
ABSTRACT
KRAS is the most frequently mutated oncogene in human neoplasia. Despite a large investment to understand the effects of KRAS mutation in cancer cells, the direct effects of the oncogenetic KRAS activation on immune cells remain elusive. Here, we report that extracellular KRASG12D is essential for pancreatic tumor-associated macrophage polarization. Oxidative stress induces KRASG12D protein release from cancer cells succumbing to autophagy-dependent ferroptosis. Extracellular KRASG12D packaged into exosomes then is taken up by macrophages through an AGER-dependent mechanism. KRASG12D causes macrophages to switch to an M2-like pro-tumor phenotype via STAT3-dependent fatty acid oxidation. Consequently, the disruption of KRASG12D release and uptake can abolish the macrophage-mediated stimulation of pancreatic adenocarcinomas in mouse models. Importantly, the level of KRASG12D expression in macrophages correlates with poor survival in pancreatic cancer patients. These findings not only identify extracellular KRASG12D as a key mediator of cancer cell-macrophage communication, but also provide a novel KRAS-targeted anticancer strategy.
Abbreviations: DAMP, damage-associated molecular pattern; PBMCMs, peripheral blood mononuclear cell-derived macrophages; PDAC, pancreatic ductal adenocarcinoma; s.c., subcutaneously; TAMs, tumor-associated macrophages; TME, tumor microenvironment.
Introduction
The tumor microenvironment (TME), a dynamic network composed of malignant cells, immune cells, and other components, shapes cancer progression and therapeutic responses [Citation1]. Usually, the immune system protects against the appearance of neoplasia. However, genetic and epigenetic adaptations of malignant cells can result in their escape from immune surveillance via multiple biochemical and metabolic mechanisms, finally facilitating tumor initiation, progression, and metastasis [Citation2]. Novel anticancer therapeutic strategies are being designed to target the signaling and molecular communications between cancer cells and the surrounding immune cells within the TME [Citation1].
The RAS protein family, encoded by KRAS, NRAS and HRAS genes, is part of the small-GTPase superfamily that cycles between inactive GDP-bound and active GTP-bound conformations [Citation3]. KRAS is among the most commonly mutated oncogenes in human cancers, especially in pancreatic, lung and colorectal carcinomas [Citation4]. The activation of oncogenic KRAS signaling results in oncogenesis and tumor progression linked to alterations in the TME. It is of great interest to understand how mutant KRAS oncoprotein may affect immunometabolism in the TME [Citation3].
Pancreatic ductal adenocarcinoma (PDAC) is one of the few KRAS-driven cancers for which survival has not improved over the past decades in spite of multiple clinical trials [Citation5]. In PDAC, G12D is the most frequent mutation in KRAS (referred as KRASG12D), correlating with distinctive features of the TME [Citation5]. Tumor-associated macrophages (TAMs) are bone marrow-derived immune cells recruited into the TME, which contribute to the initiation and progression of PDAC through metabolic reprogramming-mediated polarization [Citation6]. Depending on the environmental stresses they receive, resting macrophages can be polarized into two major subtypes: antitumor M1 and procarcinogenic M2 [Citation7]. However, it is not known how the KRASG12D mutation affecting malignant cells may contribute to M2 macrophage polarization and TAM formation.
Here, we provide the first evidence for a novel mode of KRASG12D-mediated pro-tumorigenic M2 macrophage polarization. Autophagy, a homeostatic mechanism in response to stress conditions [Citation8–10], plays multiple roles in PDAC biology [Citation11–18]. We demonstrate that oxidative stress induced autophagy-dependent KRASG12D protein release from PDAC cells. The released KRASG12D protein is further taken up by macrophages via AGER/RAGE (advanced glycosylation end product-specific receptor), a cell surface receptor accelerating inflammation and tumor growth [Citation19]. KRASG12D protein then drives macrophages into pro-tumor M2-like TAMs via inducing fatty acid oxidation. The inhibition of the release of KRASG12D from tumor cells and that of its uptake by immune cells subverted macrophage-induced PDAC tumor growth in vivo. Importantly, the abundancy of KRASG12D in TAMs is associated with dismal prognosis of PDAC patients, supporting the contention that the voyage of KRASG12D from malignant to immune cells could be therapeutically targeted.
Results
Extracellular release of KRASG12D during autophagy-dependent ferroptotic cancer cell death
The initiation and progression of PDAC are linked to oxidative stress, an imbalance of free radicals and antioxidants [Citation20,Citation21]. To determine whether oxidative stress induces oncoprotein release, we used two human PDAC cell lines (PANC1 and AsPC1) that both harbor KRASG12D mutations. Hydrogen peroxide (H2O2) induced KRASG12D release from PANC1 and AsPC1 cells as well as from primary human PDAC cells (to which we will refer as “pHsPDAC”) () in a time-dependent manner. These results suggest that oxidative stress causes KRASG12D release from PDAC cells.
Figure 1. The extracellular release of KRASG12D during autophagy-dependent ferroptotic cancer cell death. (A) The indicated human PDAC cells were treated with H2O2 (500 µM) for 6–48 h and the level of KRASG12D in the supernatants was assayed as described in the Materials and Methods (n = 3, *P < 0.05 versus control group). (B, C) Heat map of levels of cell death (B) and KRASG12D release (C) in the indicated PDAC cells following treatment with H2O2 (500 µM) in the absence or presence of chloroquine (50 µM), Z-VAD-FMK (20 µM), necrosulfonamide (1 µM), ferrostatin-1 (1 µM), or baicalein (10 µM) for 24 h (n = 3). (D) Analysis of cell death in PANC1 cells following treatment with staurosporine (1 µM) or TNF (50 nM) + Z-VAD-FMK (20 µM) + cycloheximide (10 µg/ml) (TZC) in the absence or presence of Z-VAD-FMK (20 µM) or necrosulfonamide (1 µM) for 24 h (n = 3, *P < 0.05). (E) Western blot analysis of protein expression of ATG5 or ATG7 in the indicated PDAC cells. (F, G) Cell death (F) and KRASG12D release (G) in the indicated PDAC cells following H2O2 (500 µM) treatment for 24 h (n = 3, *P < 0.05 versus control shRNA group). (H) MAP1LC3B puncta in the indicated PDAC cells following H2O2 (500 µM) treatment in the absence or presence of ferrostatin-1 (1 µM) or baicalein (10 µM) for 24 h (10–15 random fields, *P < 0.05 versus H2O2 group). Representative images of MAP1LC3B staining in PANC1 cells are shown in the right panel. Bar: 10 µm. (I) MAP1LC3B puncta in control and ATG5-knockdown PANC1 cells following treatment with erastin (10 µM) or RSL3 (0.5 µM) for 24 h (10–15 random fields, *P < 0.05 versus control group). Representative images of MAP1LC3B staining are shown in the right panel. Bar: 10 µm. (J) Western blot analysis of protein expression in the indicated PANC1 cells following treatment with erastin (10 µM) or RSL3 (0.5 µM) for 24 h. (K) The level of extracellular KRASG12D in the indicated PANC1 cells following treatment with erastin (10 µM) or RSL3 (0.5 µM) for 24 h (n = 3, *P < 0.05 versus control group)
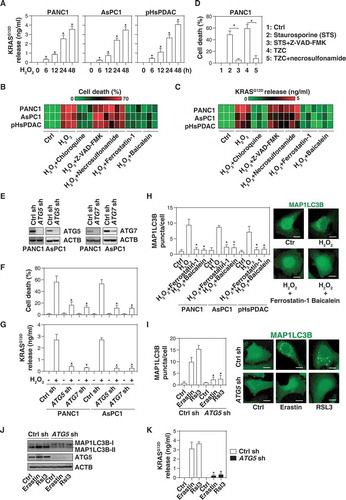
Because H2O2 can trigger various forms of regulated cell death, such as apoptosis, necroptosis, and autophagy-dependent cell death, in a context-dependent manner [Citation22,Citation23], we next investigated whether the type of H2O2-induced cell death influences KRASG12D protein release. H2O2-elicited cell death () and KRASG12D release from PDAC cells (PANC1, AsPC1, and pHsPDAC). () were blocked by an autophagy inhibitor (e.g., chloroquine), but not by inhibitors of apoptosis (e.g., Z-VAD-FMK) or necroptosis (e.g., necrosulfonamide). As expected, Z-VAD-FMK efficiently blocked cell death induced by staurosporine, and necrosulfonamide prevented the lethal effects of TNF (tumor necrosis factor) + Z-VAD-FMK + cycloheximide in PANC1 cells (). Furthermore, the knockdown of autophagy-related (ATG) genes, such as ATG5 or ATG7, by shRNAs () limited H2O2-induced cell death () and KRASG12D release () from PANC1 and AsPC1 cells, supporting the idea that autophagy-dependent cell death facilitates the KRASG12D protein release during oxidative stress.
Recent studies indicate that autophagy-dependent cell death is a distinct mode of regulated cell death required for lipid peroxidation-mediated ferroptosis [Citation24]. Ferroptosis inhibitors (ferrostatin-1 and baicalein) not only blocked the H2O2-induced formation of puncta containing MAP1LC3B (microtubule associated protein 1 light chain 3 beta), an autophagosome marker (), but also limited H2O2-induced cell death () and KRASG12D release () in PDAC cells. Ferroptosis inducers such as erastin and RSL3 also induced MAP1LC3B puncta (), the lipidation of MAP1LC3B (which leads to an increase of it electrophoretic mobility, generating the MAP1LC3B-II band) (), and cellular KRASG12D release (). All of these effects were reversed by the knockdown of ATG5 by shRNA (–). These findings suggest that ferroptosis can result in the release of KRASG12D protein from PDAC cells.
AGER is required for exosome uptake of KRASG12D by macrophages
Exosomes are endosomal-derived extracellular vesicles that mediate cell-to-cell communication during oxidative stress and cell death [Citation25–29]. Because GTPases normally are involved in exosome biology [Citation30], we investigated whether the KRASG12D protein is present in exosomes. Using a commercial exosome isolation kit, we first tested the purity of our exosome isolation approach with electron microscopy, nanoparticle tracking analysis, and western blot assays according to guidelines of the International Society of Extracellular Vesicles [Citation31]. As expected, the size of isolated exosomes was 50–150 nm (,B) and they expressed positive markers, such as CD63, CD81, PDCD6IP/ALIX (programmed cell death 6 interacting protein), and TSG101 (tumor susceptibility 101), but not negative markers, such as HSP90B1/GRP94 (heat shock protein 90 beta family member 1) and CYCS (cytochrome C, somatic) (). Importantly, H2O2 stimulation resulted in an increase of KRASG12D protein (but not CD63 and PDCD6IP/ALIX) in isolated exosome fractions in PANC1 and AsPC1 cells (). Chloroquine and ferrostatin-1 blocked the H2O2-induced KRASG12D protein accumulation in exosomes (). Knockdown of ATG5 by shRNAs inhibited the H2O2-induced KRASG12D protein accumulation in exosomes derived from PANC1 and AsPC1 cells (). GW4869, an inhibitor of exosome biogenesis and release, inhibited the H2O2-induced KRASG12D release from PANC1 and AsPC1 cells (). Similarly, the knockdown of RAB27A, a key regulator of exosome secretion [Citation32], also inhibited H2O2-induced KRASG12D release from PANC1 cells (). The vast majority of the pellet after 10K (10,000 × g) or 100K (100,000 × g) centrifugation are exosomes [Citation33]. After gradient separation of crude extracellular vesicles, we observed that KRASG12D protein was a major presence in the proteins pelleted after 10K or 100K, but not 2K (2,000 × g) centrifugation (). These 100K exosome pellets were further treated with proteinase K (a protease) or Triton X-100 (a typical nonionic detergent). Both KRASG12D and PDCD6IP/ALIX were insensitive to proteinase K digestion, but were degraded by Triton X-100 (). Overall, these findings suggest that autophagy-dependent ferroptosis results in the exosomal release of KRASG12D.
Figure 2. AGER is required for exosome uptake of KRASG12D by macrophages. (A) Transmission electron microscopy image of the exosomes isolated from PANC1 cells. (B) nanoparticle tracking analysis for the exosomes isolated from PANC1 cells. (C) Western blot analysis of exosome markers in PANC1 cells. CD63, CD81, PDCD6IP/ALIX, and TSG101 are used as exosome markers, and HSP90B1/GRP9 and CYCS are used as markers of cellular contamination. WCL, whole cell lysate; Exo, exosome. (D) Western blot analysis of KRASG12D, CD63, and PDCD6IP/ALIX expression in isolated exosomes from PDAC cells following treatment with H2O2 (500 µM) in the absence or presence of chloroquine (50 µM) or ferrostatin-1 (1 µM) for 24 h. (E) Western blot analysis of KRASG12D, CD63, and PDCD6IP/ALIX expression in isolated exosomes from wild-type and ATG5-knockdown PDAC cells following treatment with H2O2 (500 µM) for 24 h. (F) Analysis of KRASG12D release in the supernatant in PDAC cells following treatment with H2O2 (500 µM) in the absence or presence of GW4869 (10 µM) for 24 h (n = 3, *P < 0.05 versus H2O2 group). (G) Analysis of KRASG12D release in the supernatant in wild-type and RAB27A-knockdown PANC1 cells following treatment with H2O2 (500 µM) for 24 h (n = 3, *P < 0.05 versus wild-type group). (H) Western blot analysis of indicated protein expression in the successive pellets (2K, 10K, and 100K) of extracellular vesicles isolated from H2O2-treated PANC1 cells. (I) Proteinase protection assay of 100K pellets in the absence or presence of proteinase K (1 mg/mL) or 1% Triton X-100 for 30 min at 37°C. (J) Western blot analysis of KRASG12D and ACTB expression in PBMCMs following treatment with 100 μg/ml exosomes isolated from H2O2 (500 µM, 24 h)-treated PANC1 cells for 6–24 h. (K) Western blot analysis of KRASG12D and ACTB expression in PBMCMs following treatment with 100 μg/ml exosomes isolated from H2O2 (500 µM)-treated PANC1 cells in the absence or presence of AGER Ab (50 µg/ml) and control IgG (50 µg/ml) for 24 h. (L) Western blot analysis of KRASG12D and ACTB expression in wild-type and AGER-knockdown PBMCMs following treatment with 100 μg/ml exosomes isolated from H2O2 (500 µM)-treated PANC1 for 24 h
We next investigated whether extracellular KRASG12D protein from tumor-derived exosomes can be taken up by macrophages. Human peripheral blood mononuclear cell-derived macrophages (PBMCMs) normally are devoid of KRASG12D (), yet take up H2O2-generated cancer exosomes () in a time-dependent manner, suggesting that tumor KRASG12D can enter macrophages.
In a previous study, we found that AGER (advanced glycosylation end-product specific receptor), a transmembrane protein that belongs to the immunoglobulin superfamily, can bind mutant KRAS to sustain hypoxia and pro-survival signaling in PDAC cells [Citation34]. AGER is expressed by macrophages and epithelial cells to regulate inflammation, immunity and exosome uptake [Citation35–38]. To determine whether AGER is required for KRASG12D uptake by macrophages, we used a neutralizing AGER antibody. This anti-AGER antibody (but not control IgG) inhibited KRASG12D uptake by PBMCMs cultured with H2O2-generated cancer exosomes (). Similarly, the knockdown of AGER by shRNAs in PBMCMs impaired KRASG12D uptake from tumor-derived exosomes (). These findings indicate that AGER mediates KRASG12D uptake by macrophages.
KRASG12D promotes macrophage M2 polarization via STAT3-dependent fatty acid oxidation
The uptake of KRASG12D by macrophages suggested that it might influence their polarization. To explore this possibility, we knocked in KRASG12D in PBMCMs and measured biomarkers of M1 differentiation (IL12A [interleukin 12A], TNF, and NOS2/iNOS [nitric oxide synthase 2]) or M2 polarization (IL10 [interleukin 10], ARG1 [arginase 1], and TGFB1 [transforming growth factor beta 1]). The mRNA expression of IL10, ARG1, and TGFB1 (but not IL12A, TNF, and NOS2) was upregulated in PBMCMs expressing KRASG12D (). H2O2-generated cancer exosomes also increased the mRNA expression of M2 (but not M1) markers by PBMCMs, and this process was reversed by the knockdown of AGER (). Thus, KRASG12D uptake may drive the pro-carcinogenic M2 polarization.
Figure 3. KRASG12D promotes macrophage M2 polarization via STAT3-dependent fatty acid oxidation. (A) Heat map of mRNA expression of M1 and M2 genes in the indicated wild-type (WT) or KRASG12D-driven PBMCMs in the absence or presence of exosomes (100 μg/ml) or etomoxir (5 µM) for 24 h. (B) Analysis of fatty acid oxidation level in WT or KRASG12D-driven PBMCMs in the absence or presence of exosomes (100 μg/ml) or etomoxir (5 µM) for 24 h. (C) Western blot analysis of STAT3 and p-STAT3 expression in the indicated PBMCMs with or without KRASG12D transfection or exosome treatment (100 μg/ml) for 24 h. (D) Heat map of mRNA expression of fatty acid oxidation-related genes in indicated WT or KRASG12D-driven PBMCMs
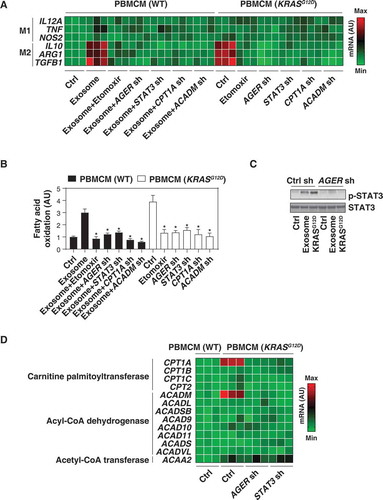
Fatty acid oxidation, the mitochondria-mediated aerobic process that results in the fragmentation of long-chain fatty acids into acetyl-CoA units, can promote M2 macrophage polarization [Citation39,Citation40]. Importantly, forced expression of KRASG12D increased fatty acid oxidation in PBMCMs (). Similarly, H2O2-generated cancer exosomes increased fatty acid oxidation in PBMCMs, and this process was inhibited by the knockdown of AGER (). Furthermore, etomoxir, a pharmacological inhibitor of fatty acid oxidation (), reduced mRNA expression of IL10, ARG1, and TGFB1 in PBMCMs that were forced to express KRASG12D or were treated with PDAC cell-derived exosomes (). Thus, fatty acid oxidation contributes to KRASG12D-mediated M2 macrophage polarization.
To understand the mechanism accounting for exacerbated fatty acid oxidation in KRASG12D-driven macrophages, we focused on STAT3 (signal transducer and activator of transcription 3), a master transcription factor that acts downstream of KRASG12D to drive pancreatic tumorigenesis [Citation41–43]. Western blot analysis found that the phosphorylation of STAT3 was upregulated in PBMCMs that were expressing KRASG12D or that had been treated with cancer exosomes. STAT3 phosphorylation was inhibited by the knockdown of AGER (). Similar to the knockdown of AGER, depletion of STAT3 by shRNA diminished fatty acid oxidation () and M2 macrophage polarization () in PBMCMs responding to KRASG12D or H2O2-elicited cancer exosomes. Thus, AGER-mediated STAT3 activation is required for KRASG12D-induced fatty acid oxidation and M2 polarization.
We next determined whether genes involved in the fatty acid oxidation metabolic pathway would be regulated by AGER-mediated STAT3 activation. Proteins from the CPT (carnitine palmitoyltransferase) family are required for the transport of long-chain fatty acids from the cytosol into mitochondria for β-oxidation, whereas enzymes from the ACAD (acyl-CoA dehydrogenase) family catalyze the initial step of each cycle of β-oxidation in the mitochondria [Citation44]. Moreover, the final step in the fatty acid oxidation spiral is performed by ACAA2 (acetyl-CoA acyltransferase 2) [Citation44]. A screening assay based on quantitative real-time PCR (qRT-PCR) revealed that the mRNA expression of CPT1A (carnitine palmitoyltransferase 1A) and ACADM (acyl-CoA dehydrogenase medium chain), but not that of other fatty acid oxidation-related genes (e.g., CPT1B, CPT1C, CPT2, ACADL, ACADSB, ACAD9, ACAD10, ACAD11, ACADS, ACADVL, and ACAA2) was upregulated in KRASG12D-expressing PBMCMs compared to wild-type PBMCMs (). This effect was inhibited by the knockdown of AGER or STAT3 (). Of note, the knockdown of CPT1A and ACADM by shRNAs limited fatty acid oxidation () and the mRNA expression of IL10, ARG1, and TGFB1 () in PBMCMs expressing by KRASG12D or responding to cancer exosomes.
Collectively, these findings indicate that the AGER-STAT3 pathway is critical for KRASG12D-induced fatty acid oxidation and subsequent macrophage M2 polarization.
Blocking KRASG12D release and uptake suppresses macrophage-mediated pancreatic tumor growth in vivo
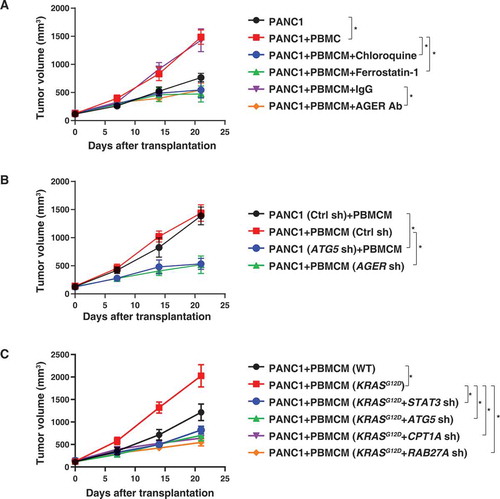
We took advantage of a xenograft model in which human PANC1 cells are implanted in immunodeficient NOD SCID mice to explore the possible voyage of KRASG12D protein from cancer cells to macrophages. PANC1 cells alone (7 × 10⁶ cells) or PANC1 cells (5 × 10⁶) plus PBMCMs (2 × 10⁶) were subcutaneously injected into the dorsal flanks of NOD SCID mice. Compared with PANC1 cells alone, PBMCMs promoted pancreatic tumor growth (). Local injection of chloroquine, ferrostatin-1, or anti-AGER antibody suppressed the growth of tumors arising from PANC1 plus PBMCMs (). The knockdown of ATG5 in PANC1 cells () or the knockdown of AGER in PBMCMs () reduced the growth of tumors generated from PANC1 cells plus PBMCMs. Furthermore, KRASG12D-driven PBMCMs promoted pancreatic tumor growth more efficiently than wild-type PBMCMs (). This tumor-accelerating effect of KRASG12D expression by PBMCMs was lost upon knockdown of STAT3, ATG5, CPT1A, or RAB27A (). These findings indicate that the transfer of the KRASG12D or KRASG12D protein into PBMCMs can drive PDAC progression through a pathway that involves ATG5, STAT3, CPT1A, and RAB27A.
Figure 4. Blocking KRASG12D release and uptake suppresses macrophage-mediated pancreatic tumor growth in vivo. (A) NOD SCID mice were injected subcutaneously (s.c.) with PANC1 cells (7 × 10⁶) or PANC1 cells (5 × 10⁶) plus PBMCMs (2 × 10⁶) and treated with chloroquine (50 mg/kg, s.c., twice a week), ferrostatin-1 (50 mg/kg, s.c., twice a week), anti-AGER antibody (10 mg/kg, s.c., twice a week) or control IgG (10 mg/kg, s.c., twice a week). Tumor volume was calculated weekly (n = 5 mice/group, *P < 0.05, ANOVA LSD test). (B, C) NOD SCID mice were injected s.c. with the indicated gene knockdown PANC1 cells (5 × 10⁶) plus wild-type or KRASG12D-driven PBMCMs (2 × 10⁶). Tumor volume was calculated weekly (n = 5 mice/group, *P < 0.05, ANOVA LSD test)
High KRASG12D expression in macrophages correlates with poor survival in PDAC patients
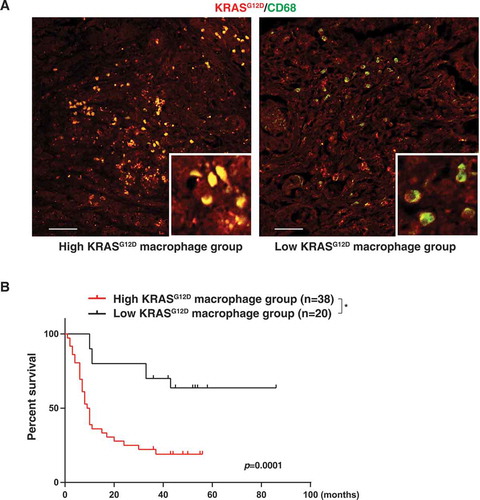
To determine whether KRASG12D expression in macrophages is aberrant in human pancreatic cancer, we used a pancreas tissue microarray to analyze a cohort of 59 patients with PDAC (). The expression of KRASG12D was detected in CD68+ macrophages (). Patients bearing PDACs with higher than median KRASG12D expression in CD68+ macrophages (high KRASG12D macrophage group) exhibited a shorter overall survival than patients with low KRASG12D expression in tumor infiltrating CD68+ macrophages (low KRASG12D macrophage group) (). These findings indicated that increased KRASG12D uptake by macrophages may contribute to human PDAC progression.
Table 1. Clinical characteristics
Figure 5. High KRASG12D expression in macrophages correlates with poor survival in PDAC patients. (A) Representative images of KRASG12D (red) and CD68 (green) staining in PDAC tissues. Bar: 100 µm. (B) Comparative survival analysis of KRASG12D expression in macrophages in PDAC patients (*P = 0.0001, log-rank test)
Discussion
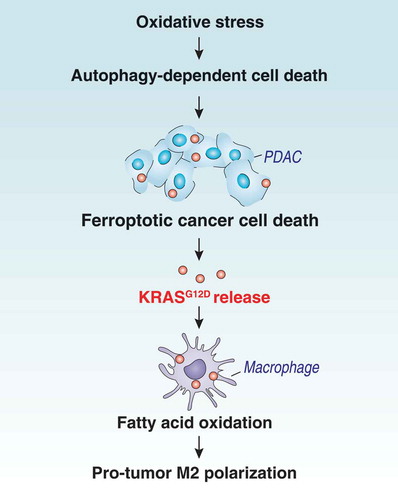
Although KRAS mutations have been studied intensively in cancer cells, the effects of mutated KRAS proteins on tumor-infiltrating immune cells have been largely elusive. In the current study, we show that pro-carcinogenic macrophage polarization relies on the uptake of KRASG12D protein from cancer cells succumbing to autophagy-dependent ferroptosis (). These findings not only reinforce the notion that an aberrant regulation of cell death and autophagy contribute to the pathogenesis of cancer [Citation45–47] but also suggest new approaches for therapeutic inhibition of the voyage of released mutated KRAS protein from cancer cells to macrophages.
Figure 6. Schematic depicting autophagy-dependent ferroptosis driving tumor-associated macrophage polarization via the release and uptake of oncogenic KRASG12D
First, we determined that KRASG12D, as a damage-associated molecular pattern (DAMP), is released from cells during oxidative stress. DAMPs are endogenous molecules liberated by dead, dying or stressed cells [Citation48]. DAMP-mediated immunogenic or tolerogenic cell death can either suppress or promote tumor growth, respectively, depending on the context of the TME and the type of DAMP [Citation49]. As a homeostatic control mechanism, autophagy plays dual roles in the regulation of cell survival and cell death. Autophagy-mediated DAMP release is tightly connected to inflammation, immunity and cell death [Citation50]. Ferroptosis was originally identified as a form of ROS-dependent regulated cell death characterized by iron accumulation and lipid peroxidation [Citation51–53]. In addition, ferroptosis may be a type of autophagy-dependent cell death [Citation24]. Although the causal mechanism remains obscure, excessive autophagy activation (e.g., ferritinophagy, lipophagy, and clockophagy) and increased lysosomal activity can promote ferroptotic cell death through the degradation of antioxidant proteins, inhibition of SLC7A11/cystine-glutamate antiporter activity, or upregulation of lysosomal membrane permeabilization [Citation54–62]. In the current study, we demonstrated that autophagy-dependent ferroptotic cancer cell death is required for ROS-induced KRASG12D release from PDAC cells.
Second, we demonstrated that extracellular KRASG12D is packaged into exosomes that are engulfed by macrophages via AGER. Exosomes are nanovesicles used to transfer bioactive molecules between cancer cells and normal neighboring cells [Citation63]. They are generally released from normal cells; however, dying cells can also release exosomes for cell-cell communication [Citation64]. Our current data suggest that KRASG12D can be delivered from ferroptotic cancer cells to macrophages through exosomes. The genetic or pharmacological inhibition of autophagy blocked exosome-associated KRASG12D release during ferroptotic cell death. Autophagosomes and exosomes share common components, and their interplay is important for the selective release of harmful proteins (e.g., DAMPs) in various diseases including neurodegeneration and cancer [Citation65–68]. AGER is a multiligand receptor that is able to bind to DAMPs such as HMGB1, histone and DNA [Citation69]. AGER plays an oncogenic role in promoting PDAC growth and chemotherapy resistance [Citation70–73]. AGER depletion limits KRASG12D-driven PDAC development and increases chemotherapy-induced cell death [Citation71–74]. The excessive activation of AGER signaling in PDAC creates an inflammatory and hypoxic TME [Citation34,Citation75]. Our current results show that AGER expression in macrophages is essential for tumor-released KRASG12D uptake and the subsequent polarization of macrophages into an M2 tumor-promoting state. These findings indicate that AGER sustains cell-cell communication in the pancreatic TME and that targeting AGER could inhibit the tumorigenic action of oncogenic KRAS protein on macrophages.
Third, we revealed a previously unknown function of KRASG12D in promoting macrophage polarization through the STAT3-dependent activation of fatty acid oxidation. The pro-tumor macrophage M2 polarization is controlled by transcriptional reprogramming [Citation76]. STAT3 is often activated in the tumor tissue and has been considered as a therapeutic in a number of cancers. In particular, STAT3 supports KRAS-dependent oncogenic transformation in the pancreas [Citation41–43]. Here, we demonstrated that KRASG12D can activate STAT3 in macrophages via AGER, leading to the selective upregulation of CPT1A and ACADM, thus favoring fatty acid oxidation and subsequent macrophage M2 polarization. Other studies have shown that STAT3-mediated CPT1B expression is important for fatty acid oxidation and subsequent stem cell self-renewal and chemoresistance in breast cancer [Citation77]. Together, these findings indicate that KRASG12D can favor fatty acid oxidation both in malignant cells and in macrophages to support tumor progression.
Last, we provided in vivo evidence that the pharmacological and genetic inhibition of KRASG12D transfer from cancer cells to macrophages can suppress the macrophage-stimulated growth of human PDACs in xenograft mouse models. Tremendous efforts are underway to develop novel RAS inhibitors through targeting its membrane association, effector binding, conformational change or nucleotide exchange [Citation78]. Unfortunately, these pharmacological strategies for targeting RAS have mostly proven unsuccessful in clinical trials [Citation78]. In contrast, our in vivo studies indicate that targeting KRASG12D release and uptake by means of existing drugs (e.g., chloroquine) may be a new approach for pancreatic cancer treatment. Chloroquine, an anti-malarial drug, is a classic autophagy inhibitor that blocks autophagic flux by decreasing autophagosome-lysosome fusion. Recently, hydroxychloroquine, a less toxic metabolite of chloroquine, in combination with other agents, has shown promise in the treatment of patients with pancreatic cancer [Citation79–82]. Although chloroquine and hydroxychloroquine may have multiple effects [Citation83], our current preclinical findings indicate their benefit in the treatment of cancer patients may be partly explained by the inhibition of autophagy-mediated KRASG12D release.
In summary, we uncovered a novel role for KRASG12D in driving macrophage M2 polarization. A specific type of cancer cell death can favor the exosomal release of KRASG12D protein, leading to its uptake by macrophages, which respond by adopting a pro-tumorigenic phenotype. We observed that KRASG12D expression in macrophages correlates with poor survival in pancreatic cancer patients, suggesting that therapeutic measures targeting the voyage of KRASG12D protein from malignant cells to macrophages might be envisaged. Given that exosomes may share mechanistic elements with other types of extracellular vesicles [Citation84], it is important to optimize the isolation method to achieve the maximum yield and purity for exosomes [Citation85].
Materials and methods
Reagents
Chloroquine (C6628), Z-VAD-FMK (V116), TNF (T6674), staurosporine (S4400), cycloheximide (C7698), puromycin (P9620), H2O2 (H3410), polybrene (TR-1003), and GW4869 (D1692) were obtained from Sigma-Aldrich. Ferrostatin-1 (S7243) and baicalein (S2268) were obtained from Selleck Chemicals. The antibodies to ATG5 (2630), ATG7 (8558), ACTB (3700), STAT3 (9139), p-STAT3 (9145), KRASG12D (14429), and MAP1LC3B (3868) were obtained from Cell Signaling Technology. The antibodies to CD63 (ab59479), CD68 (ab955), CD81 (ab219209), PDCD6IP (ab88388), TSG101 (ab125011), HSP90B1 (ab3674), CYCS (ab13575), and AGER (ab89911) were obtained from Abcam.
Cell culture
The PANC1 (CRL-1469) and AsPC1 (CRL-1682) cell lines were obtained from the American Type Culture Collection. These cells were cultured in Dulbecco’s Modified Eagle’s Medium (DMEM; Thermo Fisher Scientific, 11995073) or RPMI 1640 (Thermo Fisher Scientific, 11875119) supplemented with 10% heat-inactivated fetal bovine serum (Millipore, TMS-013-B) and 1% penicillin and streptomycin (Thermo Fisher Scientific, 15070-063) at 37°C, 95% humidity, and 5% CO2. Cell line identity was validated by STR profiling and routine mycoplasma testing was negative for contamination.
PBMCs were isolated from blood buffy coats using a Histopaque® 1077 density gradient (Sigma-Aldrich, 10771). Subsequently, the PBMCs were washed and incubated in a red blood cell lysis buffer (Sigma-Aldrich, 11814389001) for 3–5 min at room temperature. The PBMCs were suspended in serum-free RPMI 1640 medium for 1 h to allow monocyte adhesion. Non-adherent cells were removed and the adherent monocytes were further incubated in ImmunoCult™-SF Macrophage Medium (STEMCELL Technologies, 10961) for 6 days to produce PBMCMs.
Human clinical samples from patients with pancreatic cancer who underwent surgery were collected from the China-Japan Union Hospital of Jilin University. The collection of samples was approved by its institutional review board. Primary PDAC cells were isolated by enzymatic digestion, as described previously [Citation86].
Animal study
NOD SCID mice (394) were purchased from Charles River Laboratories. The mice were housed with their littermates in groups of 4 animals per cage and kept on a regular 12-hour light and dark cycle (7:00–19:00 light period). Food and water were available ad libitum. Experiments were carried out under pathogen-free conditions and the health status of mouse lines was routinely checked by veterinary staff. Experiments were carried out with randomly chosen littermates of the same sex and matched by age and body weight. PANC1 cells alone (7 × 10⁶ cells) or PANC1 cells (5 × 10⁶) plus PBMCMs (2 × 10⁶) were subcutaneously injected into the dorsal side of NOD SCID mice. We conducted all animal care and experimentation in accordance with the Association for Assessment and Accreditation of Laboratory Animal Care guidelines (http://www.aaalac.org) and with approval from institutional animal care and use committees.
Cell death assay
Trypan blue staining was used to identify dead cells. Only cells with intact membranes could effectively exclude the dye, so dead cells with compromised membranes became stained. A Countess II FL Automated Cell Counter (Thermo Fisher Scientific, AMQAF1000) was used to assay the percentages of viable and dead cells after cell staining with 0.4% trypan blue solution (Thermo Fisher Scientific, T10282).
Rnai and gene transfection
The following were obtained from Sigma-Aldrich in a lentiviral format: human ATG5-shRNA (sequence: CCGGCCTGAACAGAATCATCCTTAACTCGAGTTAAGGATGATTCTGTTCAGGTTTTTTG), human ATG7-shRNA (sequence: CCGGGCCTGCTGAGGAGCTCTCCATCTCGAGATGGAGAGCTCCTCAGCAGGCTTTTT), human AGER-shRNA (sequence: CCGGGAACTGAATCAGTCGGAGGAACTCGAGTTCCTCCGACTGATTCAGTTCTTTTTG), human STAT3-shRNA (sequence: CCGGGCACAATCTACGAAGAATCAACTCGAGTTGATTCTTCGTAGATTGTGCTTTTTG), human CPT1A-shRNA (sequence: CCGGGCCATGAAGCTCTTAGACAAACTCGAGTTTGTCTAAGAGCTTCATGGCTTTTTG), human ACADM-shRNA (sequence: CCGGGTGCAGATACTTGGAGGCAATCTCGAGATTGCCTCCAAGTATCTGCACTTTTT), and human RAB27A-shRNA (sequence: CCGGCCAGTGTACTTTACCAATATACTCGAGTATATTGGTAAAGTACACTGGTTTTT). We seeded 5 × 10⁵ cells in each well of a 12-well plate in 500 μl of complete medium and transduced by lentiviral vectors at a multiplicity of infection of 10:1. Transduction was carried out in the presence of polybrene (8 μg/ml; Sigma-Aldrich, TR-1003-G). After re-covering with complete culture medium, puromycin was used for the selection of transduced cells.
KRASG12D plasmid was a gift from Dr. Channing Der (Addgene, 58902) and electroporated into PBMCMs using the Neon Transfection System (Thermo Fisher Scientific, MPK5000,) according to the manufacturer’s protocol.
qRT-PCR assay
Total RNA was extracted using a QIAGEN RNeasy Plus Micro Kit (74034) according to the manufacturer’s instructions. Briefly, cell lysates were spun through gDNA Eliminator spin columns to remove genomic DNA. Total RNA was purified using RNeasy MinElute spin columns. First-strand cDNA was then synthesized from 1 µg of RNA using the iScript cDNA Synthesis kit (Bio-Rad, 1708890). Briefly, 20 μl reactions were prepared by combining 4 μl of iScript Select reaction mix, 2 μl of gene-specific enhancer solution, 1 μl of reverse transcriptase, 1 μl of gene-specific assay pool (20×, 2 μM), and 12 μl of RNA diluted in RNase-free water. We carried out a qRT-PCR using synthesized cDNA, primers (IL12A: 5ʹ- TGCCTTCACCACTCCCAAAACC-3ʹ and 5ʹ-CAATCTCTTCAGAAGTGCAAGGG -3ʹ; TNF: 5ʹ-CTCTTCTGCCTGCTGCACTTTG-3ʹ and 5ʹ- ATGGGCTACAGGCTTGTCACTC-3ʹ; NOS2: 5ʹ- GCTCTACACCTCCAATGTGACC-3ʹ and 5ʹ-CTGCCGAGATTTGAGCCTCATG-3ʹ; IL10: 5ʹ-TCTCCGAGATGCCTTCAGCAGA-3ʹ and 5ʹ- TCAGACAAGGCTTGGCAACCCA-3ʹ; ARG1: 5ʹ- TCATCTGGGTGGATGCTCACAC-3ʹ and 5ʹ-GAGAATCCTGGCACATCGGGAA-3ʹ; TGFB1: 5ʹ-TACCTGAACCCGTGTTGCTCTC-3ʹ and 5ʹ- GTTGCTGAGGTATCGCCAGGAA-3ʹ; CPT1A: 5ʹ- GATCCTGGACAATACCTCGGAG -3ʹ and 5ʹ-CTCCACAGCATCAAGAGACTGC-3ʹ; CPT1B: 5ʹ-TGTATCGCCGTAAACTGGACCG-3ʹ and 5ʹ-TGTCTGAGAGGTGCTGTAGCAC-3ʹ; CPT1C: 5ʹ- TGCCATGTCGTTCCATTCTCCC-3ʹ and 5ʹ-GCCGACTCATAAGTCAGGCAGA-3ʹ; CPT2: 5ʹ-GCAGATGATGGTTGAGTGCTCC-3ʹ and 5ʹ- AGATGCCGCAGAGCAAACAAGTG-3ʹ; ACADL: 5ʹ-GTTTGGACTCCGCCACTGCTTG-3ʹ and 5ʹ- GGCTGAACTCTGGCATCCACAT-3ʹ; ACAD10: 5ʹ- GCCTCTTCAGATGCCACCAACA-3ʹ and 5ʹ-CACAGAGTTGGCAACGAGGATC-3ʹ; ACADSB: 5ʹ-GCCACCTATTTGCCTCAGCTCA-3ʹ and 5ʹ-GCTCAGCACTGCTGATCCACAT-3ʹ; ACAD11: 5ʹ- GTGCAACCTCTGGCAGAAACTG-3ʹ and 5ʹ-CCTGACCTTTCCGAGTCTGTAC-3ʹ; ACAD9: 5ʹ-GCCAAAGTGAGCACAGTCATGG-3ʹ and 5ʹ- CCGAAGCAGTAGGTGTTCTCCT-3ʹ; ACADS: 5ʹ- CACGCCTTTCACCAGTGGTGAC-3ʹ and 5ʹ-GGCATTGGTGATCCAGGCTTTG-3ʹ; ACADVL: 5ʹ-TAGGAGAGGCAGGCAAACAGCT-3ʹ and 5ʹ-CACAGTGGCAAACTGCTCCAGA-3ʹ; and ACAA2: 5ʹ- GGCACTGAAGAAAGCAGGACTG-3ʹ and 5ʹ- GTGACCCAAAGCAATGGCTCCT-3ʹ), and SsoFast EvaGreen Supermix (Bio-Rad, 172–5204). The data were normalized to RNA18S (5ʹ-CTACCACATCCAAGGAAGCA-3ʹ and 5ʹ-TTTTTCGTCACTACCTCCCCG-3ʹ) and the fold change was calculated via the 2−ΔΔCt method. Relative concentrations of mRNA were expressed in arbitrary units based on the untreated group, which was assigned a value of 1.
Exosome isolation and assay
For isolation of exosomes by commercial kits, the cell media was centrifuged at 2,000 × g for 30 min at 4°C to remove cells and debris. The supernatant fraction was transferred to a new tube and then we added the Total Exosome Isolation reagent (Thermo Fisher Scientific, 4478359) at a 2:1 ratio [Citation87]. After incubation at 4°C overnight, the culture media-reagent mixture was centrifuged at 10,000 × g for 1 h at 4°C to pellet the exosomes. The precipitated exosome pellets were resuspended with phosphate-buffered saline (PBS; Sigma-Aldrich, P5493) and either used immediately or stored at −80°C until required. For isolation of exosomes by gradient purification [Citation33], the medium was centrifuged at 300 × g for 10 min at 4°C to remove cells. Next, the supernatant was collected and centrifuged at 2,000 × g for 10 min at 4°C to produce 2K pellets and then at 10,000 × g for 40 min at 4°C to produce 10K pellets. The resulting supernatant was then filtered through a 0.22-μm filter (Sigma-Aldrich, SLGP033RS) and centrifuged at 100,000 × g for 90 min at 4°C to produce 100K pellets. All ultracentrifugation steps were performed using a Sorvall WX Ultra Series Ultracentrifuge (Thermo Scientific) with a Fiberlite F50L-8 x 39 Fixed-Angle Rotor (Thermo Scientific).
Exosome concentration and quantity were determined using nanoparticle tracking analysis with a NanoSight NS300 instrument (Malvern Panalytical). Transmission electron microscopy was used for the imaging of exosomes. In brief, a 10 μL aliquot of freshly isolated exosomes was dried on a 400 mesh formvar/carbon-coated copper grid (Electron Microscopy Sciences, FCF400CU50) for 10 min and were fixed in 2.5% glutaraldehyde in PBS, pH 7.4 (Electron Microscopy Sciences, 1653708), for 10 min at room temperature, and contrasted in 2% uranyl acetate (Electron Microscopy Sciences, 224002) for 10 min at room temperature. Finally, the samples were observed at 80 kV using a JEM 1010 transmission electron microscope (JEOL).
For a proteinase K protection assay, exosomal pellets were resuspended in PBS in the absence or presence of 1 mg/mL proteinase K (Thermo Scientific, EO0491) or 1% Triton X-100 (Thermo Scientific, BP151-100) for 30 min at 37°C.
Western blot analysis
Cells were lysed in Cell Lysis Buffer (Cell Signaling Technology, 9803) with protease inhibitor cocktail (Promega, G6521), phosphatase inhibitor cocktail (Sigma-Aldrich, P0044), and 1 mM Na3VO4. Cleared lysates were resolved by SDS-PAGE (Bio-Rad, 3450124) and then transferred onto PVDF membranes (Bio-Rad, 1704273). The membranes were blocked with Tris-buffered saline Tween 20 (TBST; Cell Signaling Technology, 9997) containing 5% skim milk for 1 h at room temperature and then incubated with the indicated primary antibodies (1:1000–1:5000) overnight at 4°C. After being washed with TBST, the membranes were incubated with an HRP-linked anti-mouse IgG secondary antibody (Cell Signaling Technology, 7076) or HRP-linked anti-rabbit IgG secondary antibody (Cell Signaling Technology, 7074) for 1 h at room temperature. The membranes were washed three times in TBST and then visualized and analyzed with a ChemiDoc Touch Imaging System (Bio-Rad, 1708370). The intensities of bands were analyzed with Image Lab software (Bio-Rad, 1709690).
KRASG12D release analysis
Supernatants of PDAC cells were first concentrated on an Amicon Ultra-15 Centrifugal Filter Unit (MilliporeSigma, UFC901024) [Citation88,Citation89], with subsequent processing in Cell Lysis Buffer (Cell Signaling Technology, 9803). The concentrated supernatants were resolved by SDS-PAGE and then detected by specific anti-KRASG12D antibody (Cell Signaling Technology, 14429). The KRASG12D standards (SignalChem, R06-32BH-20) were used to quantify the concentration of KRASG12D in the supernatants after comparing the density of bands.
Image analysis
Cells were cultured on glass coverslips and fixed in 2% formaldehyde made in PBS solution for 15 min at room temperature prior to detergent extraction with 0.1% Triton X-100 (Sigma-Aldrich, T9284) made in PBS solution, for 10 min at room temperature [Citation90]. Coverslips were saturated with 2% bovine serum albumin (BSA; Sigma-Aldrich, 05470) made in PBS solution, for 1 h at room temperature and processed for immunofluorescence with anti-MAP1LC3B antibody (Cell Signaling Technology, 3868), followed by Alexa Fluor 488-conjugated secondary antibody (Thermo Fisher Scientific, A32790).
The tissue microarray with clinical characteristics was purchased from US Biomax (HPan-Ade180Sur-01). Pancreatic cancer tissue immunofluorescence was performed with primary antibodies against the KRASG12D or macrophage marker CD68, followed by Cy3-conjugated secondary antibody (Thermo Fisher Scientific, A10520) or Alexa Fluor 488-conjugated secondary antibody (Thermo Fisher Scientific, A-21202). Images were taken with a ZEISS LSM 800 confocal microscope (ZEISS, Germany).
Fatty acid oxidation assay
Fatty acid oxidation was assayed using the Seahorse XF24 Analyzer (Agilent Technologies) according to the manufacturer’s instructions [Citation91]. Briefly, we used the increased oxygen consumption rate immediately after exposing cells to palmitate-BSA substrate (Agilent Technologies, 102720-100) as an indicator for fatty acid oxidation in the XF24 Analyzer.
Statistical analysis
Data are presented as mean ± SD except where otherwise indicated. Unpaired Student’s t tests were used to compare the means of two groups. A one-way analysis of variance (ANOVA) was used for comparison among the different groups. When the ANOVA was significant, post hoc testing of differences between groups was performed using the least significant difference (LSD) test. The log-rank test was used to compare differences in survival rates between groups. A P value < 0.05 was considered statistically significant.
Acknowledgments
We thank Dave Primm (Department of Surgery, University of Texas Southwestern Medical Center) for his critical reading of the manuscript. D.T. is supported by a grant from the American Cancer Society (research scholar grant RSG-16-014-01-CDD). R.K. is supported by a grant from the U.S. National Institutes of Health (R01CA211070). D.J.K. is supported by a grant from the U.S. National Institutes of Health (R35GM131919). G.K. is supported by the Ligue contre le Cancer (équipe labellisée); Agence National de la Recherche (ANR) – Projets blancs; ANR under the frame of E-Rare-2, the ERA-Net for Research on Rare Diseases; Association pour la recherche sur le cancer (ARC); Cancéropôle Ile-de-France; Chancelerie des universités de Paris (Legs Poix), Fondation pour la Recherche Médicale (FRM); a donation by Elior; European Research Area Network on Cardiovascular Diseases (ERA-CVD, MINOTAUR); Gustave Roussy Odyssea, the European Union Horizon 2020 Project Oncobiome; Fondation Carrefour; High-end Foreign Expert Program in China (GDW20171100085 and GDW20181100051), Institut National du Cancer (INCa); Inserm (HTE); Institut Universitaire de France; LeDucq Foundation; LabEx Immuno-Oncology; the RHU Torino Lumière; the Seerave Foundation; the SIRIC Stratified Oncology Cell DNA Repair and Tumor Immune Elimination (SOCRATE); and SIRIC Cancer Research and Personalized Medicine (CARPEM). J.L. is supported by grants from the National Natural Science Foundation of China (31671435, 81400132, and 81772508). Y.X. is supported by a grant from the National Natural Science Foundation of China (81802476). J.W., L.H., and E.D. are supported by grants from the National Natural Science Foundation of China (30870355 and 81370497), Natural Science Foundation of Jilin Province in China (20160101062JC), and the Health Foundation of the Finance Department of Jilin Province in China (SCZSY201516).
Disclosure statement
No potential conflict of interest was reported by the authors.
Additional information
Funding
References
- Binnewies M, Roberts EW, Kersten K, et al. Understanding the tumor immune microenvironment (TIME) for effective therapy. Nat Med. 2018;24:541–550.
- Wellenstein MD, de Visser KE. Cancer-cell-intrinsic mechanisms shaping the tumor immune landscape. Immunity. 2018;48:399–416.
- Simanshu DK, Nissley DV, McCormick F, et al. Their regulators in human disease. Cell. 2017;170:17–33.
- Pylayeva-Gupta Y, Grabocka E, Bar-Sagi D. RAS oncogenes: weaving a tumorigenic web. Nat Rev Cancer. 2011;11:761–774.
- Waters AM, Der CJ. KRAS: the critical driver and therapeutic target for pancreatic cancer. Cold Spring Harb Perspect Med. 2018;8:a031435.
- Cui R, Yue W, Lattime EC, et al. Targeting tumor-associated macrophages to combat pancreatic cancer. Oncotarget. 2016;7:50735–50754.
- Mantovani A, Marchesi F, Malesci A, et al. Tumour-associated macrophages as treatment targets in oncology. Nat Rev Clin Oncol. 2017;14:399–416.
- Klionsky DJ, Emr SD. Autophagy as a regulated pathway of cellular degradation. Science. 2000;290:1717–1721.
- Kroemer G, Marino G, Levine B. Autophagy and the integrated stress response. Mol Cell. 2010;40:280–293.
- Klionsky DJ, Abdelmohsen K, Abe A, et al. Guidelines for the use and interpretation of assays for monitoring autophagy 3rd edition. Autophagy. 2016;12:1–222.
- Yang S, Wang X, Contino G, et al. Pancreatic cancers require autophagy for tumor growth. Genes Dev. 2011;25:717–729.
- Perera RM, Stoykova S, Nicolay BN, et al. Transcriptional control of autophagy-lysosome function drives pancreatic cancer metabolism. Nature. 2015;524:361–365.
- Viale A, Pettazzoni P, Lyssiotis CA, et al. Oncogene ablation-resistant pancreatic cancer cells depend on mitochondrial function. Nature. 2014;514:628–632.
- Sousa CM, Biancur DE, Wang X, et al. Pancreatic stellate cells support tumour metabolism through autophagic alanine secretion. Nature. 2016;536:479–483.
- Rosenfeldt MT, O’Prey J, Morton JP, et al. p53 status determines the role of autophagy in pancreatic tumour development. Nature. 2013;504:296–300.
- Li C, Zhang Y, Cheng X, et al. PINK1 and PARK2 suppress pancreatic tumorigenesis through control of mitochondrial Iron-mediated immunometabolism. Dev Cell. 2018;46:441–55 e8.
- Liang C, Xu J, Meng Q, et al. TGFB1-induced autophagy affects the pattern of pancreatic cancer progression in distinct ways depending on SMAD4 status. Autophagy. 2019;15:1–15.
- Kang R, Xie Y, Zeh HJ, et al. Mitochondrial quality control mediated by PINK1 and PRKN: links to iron metabolism and tumor immunity. Autophagy. 2019;15:172–173.
- Riehl A, Nemeth J, Angel P, et al. The receptor RAGE: bridging inflammation and cancer. Cell Commun Signal. 2009;7:12.
- Martinez-Useros J, Li W, Cabeza-Morales M, et al. Oxidative stress: a new target for pancreatic cancer prognosis and treatment. J Clin Med. 2017;6:29.
- Benz CC, Yau C. Ageing, oxidative stress and cancer: paradigms in parallax. Nat Rev Cancer. 2008;8:875–879.
- Tang D, Kang R, Berghe TV, et al. The molecular machinery of regulated cell death. Cell Res. 2019;29:347–364.
- Galluzzi L, Vitale I, Aaronson SA, et al. Molecular mechanisms of cell death: recommendations of the nomenclature committee on cell death 2018. Cell Death Differ. 2018;25:486–541.
- Zhou B, Liu J, Kang R, et al. Ferroptosis is a type of autophagy-dependent cell death. Semin Cancer Biol. 2019 Mar 14. pii: S1044-579X(19)30006-9. doi: 10.1016/j.semcancer.2019.03.002. [Epub ahead of print].
- Alonso R, Rodriguez MC, Pindado J, et al. Diacylglycerol kinase alpha regulates the secretion of lethal exosomes bearing Fas ligand during activation-induced cell death of T lymphocytes. J Biol Chem. 2005;280:28439–28450.
- de Araujo Farias V, O’Valle F, Serrano-Saenz S, et al. Exosomes derived from mesenchymal stem cells enhance radiotherapy-induced cell death in tumor and metastatic tumor foci. Mol Cancer. 2018;17:122.
- Podbielska M, Szulc ZM, Kurowska E, et al. Cytokine-induced release of ceramide-enriched exosomes as a mediator of cell death signaling in an oligodendroglioma cell line. J Lipid Res. 2016;57:2028–2039.
- Zhang HG, Liu C, Su K, et al. A membrane form of TNF-alpha presented by exosomes delays T cell activation-induced cell death. J Immunol. 2006;176:7385–7393.
- Liu Z, Xu Y, Wan Y, et al. Exosomes from adipose-derived mesenchymal stem cells prevent cardiomyocyte apoptosis induced by oxidative stress. Cell Death Discov. 2019;5:79.
- Hessvik NP, Llorente A. Current knowledge on exosome biogenesis and release. Cell Mol Life Sci. 2018;75:193–208.
- Thery C, Witwer KW, Aikawa E, et al. Minimal information for studies of extracellular vesicles 2018 (MISEV2018): a position statement of the international society for extracellular vesicles and update of the MISEV2014 guidelines. J Extracell Vesicles. 2018;7:1535750.
- Ostrowski M, Carmo NB, Krumeich S, et al. Rab27a and Rab27b control different steps of the exosome secretion pathway. Nat Cell Biol. 2010;12(19–30; sup pp):1–13.
- Kowal J, Arras G, Colombo M, et al. Proteomic comparison defines novel markers to characterize heterogeneous populations of extracellular vesicle subtypes. Proc Natl Acad Sci U S A. 2016;113:E968–77.
- Kang R, Hou W, Zhang Q, et al. RAGE is essential for oncogenic KRAS-mediated hypoxic signaling in pancreatic cancer. Cell Death Dis. 2014;5:e1480.
- Kokkola R, Andersson A, Mullins G, et al. RAGE is the major receptor for the proinflammatory activity of HMGB1 in rodent macrophages. Scand J Immunol. 2005;61:1–9.
- Patterson SA, Deep G, Brinkley TE. Detection of the receptor for advanced glycation endproducts in neuronally-derived exosomes in plasma. Biochem Biophys Res Commun. 2018;500:892–896.
- Downs CA, Dang VD, Johnson NM, et al. hydrogen peroxide stimulates exosomal cathepsin B regulation of the receptor for advanced glycation end-products (RAGE). J Cell Biochem. 2018;119:599–606.
- Park SW, Kim JH, Park SM, et al. RAGE mediated intracellular Abeta uptake contributes to the breakdown of tight junction in retinal pigment epithelium. Oncotarget. 2015;6:35263–35273.
- Vats D, Mukundan L, Odegaard JI, et al. Oxidative metabolism and PGC-1beta attenuate macrophage-mediated inflammation. Cell Metab. 2006;4:13–24.
- Huang SC, Everts B, Ivanova Y, et al. Cell-intrinsic lysosomal lipolysis is essential for alternative activation of macrophages. Nat Immunol. 2014;15:846–855.
- Corcoran RB, Contino G, Deshpande V, et al. STAT3 plays a critical role in KRAS-induced pancreatic tumorigenesis. Cancer Res. 2011;71:5020–5029.
- D’Amico S, Shi J, Martin BL, et al. STAT3 is a master regulator of epithelial identity and KRAS-driven tumorigenesis. Genes Dev. 2018;32:1175–1187.
- Lesina M, Kurkowski MU, Ludes K, et al. Stat3/Socs3 activation by IL-6 transsignaling promotes progression of pancreatic intraepithelial neoplasia and development of pancreatic cancer. Cancer Cell. 2011;19:456–469.
- Houten SM, Wanders RJ. A general introduction to the biochemistry of mitochondrial fatty acid beta-oxidation. J Inherit Metab Dis. 2010;33:469–477.
- Levy JMM, Towers CG, Thorburn A. Targeting autophagy in cancer. Nat Rev Cancer. 2017;17:528–542.
- Dower CM, Wills CA, Frisch SM, et al. Mechanisms and context underlying the role of autophagy in cancer metastasis. Autophagy. 2018;14:1110–1128.
- White E. The role for autophagy in cancer. J Clin Invest. 2015;125:42–46.
- Bianchi ME. DAMPs, PAMPs and alarmins: all we need to know about danger. J Leukoc Biol. 2007;81:1–5.
- Green DR, Ferguson T, Zitvogel L, et al. Immunogenic and tolerogenic cell death. Nat Rev Immunol. 2009;9:353–363.
- Hou W, Zhang Q, Yan Z, et al. Strange attractors: dAMPs and autophagy link tumor cell death and immunity. Cell Death Dis. 2013;4:e966.
- Stockwell BR, Friedmann Angeli JP, Bayir H, et al. Ferroptosis: a regulated cell death nexus linking metabolism, redox biology, and disease. Cell. 2017;171:273–285.
- Xie Y, Hou W, Song X, et al. Ferroptosis: process and function. Cell Death Differ. 2016;23:369–379.
- Dixon SJ, Lemberg KM, Lamprecht MR, et al. Ferroptosis: an iron-dependent form of nonapoptotic cell death. Cell. 2012;149:1060–1072.
- Hou W, Xie Y, Song X, et al. 3rdAutophagy promotes ferroptosis by degradation of ferritin. Autophagy. 2016;12:1425–1428.
- Bai Y, Meng L, Han L, et al. Lipid storage and lipophagy regulates ferroptosis. Biochem Biophys Res Commun. 2019;508:997–1003.
- Kang R, Zhu S, Zeh HJ, et al. BECN1 is a new driver of ferroptosis. Autophagy. 2018;14:2173–2175.
- Gao H, Bai Y, Jia Y, et al. Ferroptosis is a lysosomal cell death process. Biochem Biophys Res Commun. 2018;503:1550–1556.
- Torii S, Shintoku R, Kubota C, et al. An essential role for functional lysosomes in ferroptosis of cancer cells. Biochem J. 2016;473:769–777.
- Yang M, Liu J, Zhu S, et al. Clockophagy is a novel selective autophagy process favoring ferroptosis. Sci Adv. 2019;5:aaw2238.
- Zhang Z, Yao Z, Wang L, et al. Activation of ferritinophagy is required for the RNA-binding protein ELAVL1/HuR to regulate ferroptosis in hepatic stellate cells. Autophagy. 2018;14:2083–2103.
- Liu J, Yang M, Kang R, et al. Autophagic degradation of the circadian clock regulator promotes ferroptosis. Autophagy. 2019;15:2033–2035.
- Song X, Zhu S, Chen P, et al. AMPK-mediated BECN1 phosphorylation promotes ferroptosis by directly blocking system Xc(-) activity. Curr Biol. 2018;28:2388–99 e5.
- Abak A, Abhari A, Rahimzadeh S. Exosomes in cancer: small vesicular transporters for cancer progression and metastasis, biomarkers in cancer therapeutics. PeerJ. 2018;6:e4763.
- Caruso S, Poon IKH. apoptotic cell-derived extracellular vesicles: more than just debris. Front Immunol. 2018;9:1486.
- Baixauli F, Lopez-Otin C, Mittelbrunn M. Exosomes and autophagy: coordinated mechanisms for the maintenance of cellular fitness. Front Immunol. 2014;5:403.
- Xu J, Camfield R, Gorski SM. The interplay between exosomes and autophagy - partners in crime. J Cell Sci. 2018;131:jcs215210.
- Minakaki G, Menges S, Kittel A, et al. Autophagy inhibition promotes SNCA/alpha-synuclein release and transfer via extracellular vesicles with a hybrid autophagosome-exosome-like phenotype. Autophagy. 2018;14:98–119.
- Zhang XW, Zhou JC, Peng D, et al. Disrupting the TRIB3-SQSTM1 interaction reduces liver fibrosis by restoring autophagy and suppressing exosome-mediated HSC activation. Autophagy. 2019;15:1–15.
- Yamagishi S, Matsui T, Fukami K. Role of receptor for advanced glycation end products (RAGE) and its ligands in cancer risk. Rejuvenation Res. 2015;18:48–56.
- Azizan N, Suter MA, Liu Y, et al. RAGE maintains high levels of NFkappaB and oncogenic Kras activity in pancreatic cancer. Biochem Biophys Res Commun. 2017;493:592–597.
- DiNorcia J, Lee MK, Moroziewicz DN, et al. RAGE gene deletion inhibits the development and progression of ductal neoplasia and prolongs survival in a murine model of pancreatic cancer. J Gastrointest Surg. 2012;16:104–112, discussion 12
- Kang R, Loux T, Tang D, et al. The expression of the receptor for advanced glycation endproducts (RAGE) is permissive for early pancreatic neoplasia. Proc Natl Acad Sci U S A. 2012;109:7031–7036.
- Kang R, Tang D, Schapiro NE, et al. The receptor for advanced glycation end products (RAGE) sustains autophagy and limits apoptosis, promoting pancreatic tumor cell survival. Cell Death Differ. 2010;17:666–676.
- Guzman EA, Pitts TP, Diaz MC, et al. The marine natural product Scalarin inhibits the receptor for advanced glycation end products (RAGE) and autophagy in the PANC-1 and MIA PaCa-2 pancreatic cancer cell lines. Invest New Drugs. 2019;37:262–270.
- Kang R, Tang D, Schapiro NE, et al. The HMGB1/RAGE inflammatory pathway promotes pancreatic tumor growth by regulating mitochondrial bioenergetics. Oncogene. 2014;33:567–577.
- Murray PJ. Macrophage polarization. Annu Rev Physiol. 2017;79:541–566.
- Wang T, Fahrmann JF, Lee H, et al. JAK/STAT3-regulated fatty acid beta-oxidation is critical for breast cancer stem cell self-renewal and chemoresistance. Cell Metab. 2018;27:136–50 e5.
- O’Bryan JP. Pharmacological targeting of RAS: recent success with direct inhibitors. Pharmacol Res. 2019;139:503–511.
- Boone BA, Murthy P, Miller-Ocuin J, et al. Chloroquine reduces hypercoagulability in pancreatic cancer through inhibition of neutrophil extracellular traps. BMC Cancer. 2018;18:678.
- Kinsey CG, Camolotto SA, Boespflug AM, et al. Protective autophagy elicited by RAF–>MEK–>ERK inhibition suggests a treatment strategy for RAS-driven cancers. Nat Med. 2019;25:620–627.
- Wolpin BM, Rubinson DA, Wang X, et al. Phase II and pharmacodynamic study of autophagy inhibition using hydroxychloroquine in patients with metastatic pancreatic adenocarcinoma. Oncologist. 2014;19:637–638.
- Karasic TB, O’Hara MH, Loaiza-Bonilla A, et al. Effect of gemcitabine and nab-paclitaxel with or without hydroxychloroquine on patients with advanced pancreatic cancer: a phase 2 randomized clinical trial. JAMA Oncol. 2019;5:993–998.
- Manic G, Obrist F, Kroemer G, et al. Chloroquine and hydroxychloroquine for cancer therapy. Mol Cell Oncol. 2014;1:e29911.
- Mathieu M, Martin-Jaular L, Lavieu G, et al. Specificities of secretion and uptake of exosomes and other extracellular vesicles for cell-to-cell communication. Nat Cell Biol. 2019;21:9–17.
- Patel GK, Khan MA, Zubair H, et al. Comparative analysis of exosome isolation methods using culture supernatant for optimum yield, purity and downstream applications. Sci Rep. 2019;9:5335.
- Marchesi F, Monti P, Leone BE, et al. Increased survival, proliferation, and migration in metastatic human pancreatic tumor cells expressing functional CXCR4. Cancer Res. 2004;64:8420–8427.
- Skottvoll FS, Berg HE, Bjorseth K, et al. Ultracentrifugation versus kit exosome isolation: nanoLC-MS and other tools reveal similar performance biomarkers, but also contaminations. Future Sci OA. 2019;5:FSO359.
- Zhu L, Qu XH, Sun YL, et al. Novel method for extracting exosomes of hepatocellular carcinoma cells. World J Gastroenterol. 2014;20:6651–6657.
- Izuishi K, Tsung A, Jeyabalan G, et al. Cutting edge: high-mobility group box 1 preconditioning protects against liver ischemia-reperfusion injury. J Immunol. 2006;176:7154–7158.
- Tang D, Kang R, Livesey KM, et al. Endogenous HMGB1 regulates autophagy. J Cell Biol. 2010;190:881–892.
- Salabei JK, Gibb AA, Hill BG. Comprehensive measurement of respiratory activity in permeabilized cells using extracellular flux analysis. Nat Protoc. 2014;9:421–438.