
ABSTRACT
Mesenchymal stem cell (MSC) transplantation has been widely applied as a potential therapeutic for multiple diseases. However, the underlying therapeutic mechanisms are not fully understood, especially the paradox between the low survival rate of transplanted cells and the beneficial therapeutic effects generated by these cells. Herein, in a myocardial infarction (MI) model, we found that transplanted MSCs released apoptotic bodies (ABs) to enhance angiogenesis and improve cardiac functional reclovery via regulating macroautophagy/autophagy in the recipient endothelial cells (ECs). Mechanistically, after local transplantation, MSCs underwent extensive apoptosis in the short term and released ABs, which were engulfed by the recipient ECs. Then, in the ECs, ABs activated lysosome functions and promoted the expression of TFEB (transcription factor EB), which is a master gene in lysosomal biogenesis and autophagy. Finally, the increase in TFEB enhanced autophagy-related gene expression in ECs and promoted angiogenesis and cardiac functional recovery after MI. Collectively, we found that apoptotic donor MSCs promote angiogenesis via regulating autophagy in the recipient ECs, unveiling the role of donor cell apoptosis in the therapeutic effects generated by cell transplantation.
Abbreviations: 3-MA: 3-methyladenine; ABs: apoptotic bodies; BECN1: beclin 1; CASP3: caspase 3; CQ: chloroquine; ECs: endothelial cells; EVs: extracellular vesicles; LAMP1: lysosomal-associated membrane protein 1; LVEF: left ventricular ejection fraction; LVFS: left ventricular fractional shortening; MAP1LC3/LC3: microtubule associated protein 1 light chain 3; MI: myocardial infarction; MSC: mesenchymal stem cell; NO: nitric oxide; TFEB: transcription factor EB; TUNEL: TdT-mediated dUTP Nick-End Labeling.
Introduction
Mesenchymal stem cell (MSC) transplantation has been widely applied as a potential therapeutic strategy for treating multiple diseases, such as myocardial infarction (MI), autoimmune disease, diabetes, liver cirrhosis and kidney injury [Citation1–3]. The demonstrated underlying therapeutic mechanisms include engraftment and differentiation [Citation4], paracrine signaling [Citation2], cell-cell interactions, and exosome secretion [Citation5–7]. These mechanisms of MSC therapy function under the premise that transplanted MSCs survive for a certain period. However, many studies have shown that only a small proportion of transplanted MSCs can eventually survive and incorporated into the host tissues [Citation8–12].
Moreover, under certain conditions, such as myocardial ischemia, the survival of transplanted MSC is greatly affected by the pro-apoptotic microenvironment due to hypoxia, inflammatory cytokines, and pro-apoptotic factors [Citation13]. The process of cell apoptosis accompanies the low survival and considerable death of transplanted MSCs [Citation14]. Therefore, given the therapeutic effects generated by implanted MSCs, it is reasonable to assume that cell apoptosis may play a role in these therapeutic effects.
Apoptosis, a form of programmed cell death, is an important biological process and plays a critical role in development, tissue homeostasis, and immunity [Citation15]. To date, accumulating reports have revealed that apoptosis is closely related to tissue regeneration [Citation16–20]. We previously found that apoptotic MSCs could promote regeneration via the secretion of cytokines [Citation5]. In addition to secreting multiple cytokines, MSCs can also release apoptotic bodies (ABs), which are fragments of apoptotic cells composed of externalized phosphatidylserine and permeable membrane, and cytoplasmic materials [Citation16,Citation21]. We recently showed that circulating ABs can maintain stem cell homeostasis and their regenerative potential [Citation22]. However, whether transplanted MSCs could enhance tissue regeneration via the release of ABs is unknown.
Extracellular vesicles (EVs), including exosomes, microvesicles, and ABs, are usually regarded as signal carriers [Citation21,Citation23], which participate in intercellular communication and signal transduction. However, whether the disposal of these vesicles could affect cell functions has not been fully studied. Lysosomes have traditionally been considered a waste disposal system for cells [Citation24]. Interestingly, many studies have shown that lysosomes are targets of internalized EVs and that the interaction between EVs and lysosomes is not limited to degradation [Citation23,Citation25–28]. Moreover, convincing evidence suggests that lysosomes are involved in fundamental border processes, such as secretion, energy metabolism, and angiogenesis [Citation23,Citation25,Citation29–31]. Therefore, it is necessary to investigate whether the interactions between ABs and lysosomes can mediate the biological effects of ABs on recipient cells [Citation32,Citation33].
In this study, we selected an MI model to address these challenges because MSCs are clinically effective for treating ischemic heart disease, which remains the leading cause of morbidity and mortality worldwide [Citation34]. In the present study, we investigated the biological effect of MSC-derived ABs on tissue repair in an MI model and the interactions between lysosomes and ABs in endothelial cells (ECs). We found that MSC treatment for MI accompanied the production and release of ABs derived from apoptotic MSCs, which enhanced angiogenesis and cardiac function recovery in MI rats. Mechanistically, we found that the recipient ECs engulfed ABs and promoted their autophagy, thereby enhancing angiogenesis and cardiac functional recovery.
Results
Transplanted MSCs underwent apoptosis and improved cardiac function after MI
For decades, MSCs have been used to treat cardiovascular diseases in pre-clinical studies and clinical trials [Citation35]. Therefore, we used a rat MI model to investigate the mechanisms underlying the therapeutic effects generated by MSC transplantation. Cardiac function was evaluated by echocardiography after MSC transplantation in the MI model. Compared with that in the PBS control group, the left ventricular (LV) function was improved in the MSC transplantation group after 2 or 4 weeks, as seen from the increases in the left ventricular ejection fraction (LVEF) and left ventricular fractional shortening (LVFS) (). In addition, the infarct size detected by Masson’s trichrome staining was significantly smaller in the MSC group than that in the PBS group, as shown by the blue area indicating fibrotic myocardium in the mid-papillary region of the infarcted heart (). To further investigate whether angiogenesis is a potential mechanism for the therapeutic effects, capillary density was detected. The MSC-treated group exhibited a higher capillary density than the PBS group in the border zone ().
Figure 1. Injection of MSCs improved cardiac function after MI. (A) M-mode echocardiogram from sham, PBS-treated, and MSC-treated rats 4 weeks after MI. LVEF and LVFS of the hearts 0 week, 2 weeks and 4 weeks after MI. BSL, baseline prior to MI. (B) Masson’s trichrome staining images from the mid-papillary region of the infarcted hearts 4 weeks after MI. Fibrosis of the infarcts was quantified by ImageJ software. (C) Confocal microscopy images of capillary profiles in the infarction border zone 4 weeks after treatment. The % represents the area of PECAM1-positive cells over total area. Scale bar: 100 µm. (D) Confocal microscopy images showing decreased MSCs in the local injection area at 12 h, 24 h and 72 h after the injection. The fluorescence intensity was quantified. Scale bar: 50 µm. (E) Images of the border zone after MSC injection for TUNEL staining. MSCs were pre-labeled with PKH67 (green) before intracardiac injection. Apoptotic nuclei were indicated by red fluorescence after the transplantation. Scale bar: 50 μm. n = 7 rats per group (A, B, C). The results were representative of the data generated in at least 3 independent experiments. The data were presented as mean ± SEM. ns, not significant; *P < 0.05; **P < 0.01 by Student’s t-test (A, C) or one-way ANOVA (B)
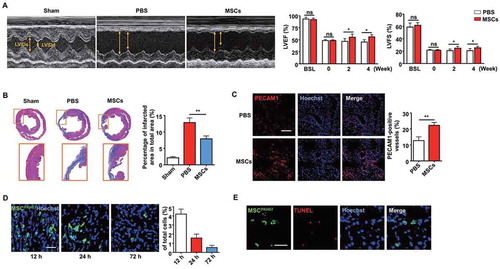
Interestingly, the process of MSC-mediated repair was accompanied by a decrease in MSCs over time, as observed by confocal microscopy in vivo (). TdT-mediated dUTP Nick-End Labeling (TUNEL) staining was performed 24 h after transplantation to determine whether MSCs underwent apoptosis. MSCs were pre-labeled with PKH67 (green) before intracardiac injection, and the presence of TUNEL-positive cells (red) revealed apoptotic MSCs in the injection zone (). These results indicated that implanted MSCs could improve the cardiac function of MI rats while undergoing apoptosis, suggesting a potential connection between MSC apoptosis and the significant therapeutic effects.
ABs released by MSCs improved cardiac function after MI
Cells can release ABs during apoptosis, and we previously found that apoptotic MSCs could promote regeneration via cytokine secretion [Citation5]. Therefore, we hypothesized that ABs derived from MSCs could improve cardiac function after MI. MSCs were pretreated with staurosporine to induce apoptosis, and we isolated ABs by a sequential centrifugation procedure [Citation36]. We used nanoparticle tracking analysis (NTA) and scanning electron microscopy (SEM) to assess the size distribution and morphology of the ABs. As shown in , ABs composed a homogenous population with sizes between 400 and 700 nm in diameter (), and they typically displayed a round shape () [Citation37]. Then, we identified ABs by positive ANXA5 (annexin A5) staining (). Western blot analysis showed that the isolated ABs express the specific marker CASP3 (caspase 3) () [Citation21].
Figure 2. Characterization of ABs and their capacity to enhance cardiac function after MI in rats. (A) Size distribution of ABs measured by nanoparticle tracking analysis (NTA). (B) Morphology of MSC-derived ABs shown by scanning electron microscope (SEM). Scale bar: 500 nm. (C) Confocal microscopy images of ABs stained with ANXA5/annexin A5 showing phosphatidylserine exposed on the surface. Scale bar: 5 µm. (D) Western blots of the apoptotic marker protein CASP3/caspase 3 in the MSCs and MSC-derived ABs. Confocal microscopy image showing the internalization of ABs by ECs in vitro (E) and in vivo (F). Scale bar: 25 µm (E); Scale bar: 10 µm (F in right panel). (G) M-mode echocardiogram from sham, PBS-treated, and AB-treated rats 4 weeks after MI. LVEF and LVFS of hearts 0 week, 2 weeks and 4 weeks after MI. BSL, baseline prior to MI. (H) Masson’s trichrome staining images from the mid-papillary region of the infarcted heart 4 weeks after MI in the sham, PBS-treated and AB-treated groups. Fibrosis of the infarct size was quantified by ImageJ software. (I) Confocal microscopy images of capillary profiles in the infarction border zone 4 weeks after treatment. The area of PECAM1-positive vessels was quantified by ImageJ software. Scale bar: 100 µm. The results were representative of the data generated in at least 3 independent experiments. n = 7 rats per group (G, H, I). The data were presented as mean ± SEM. ns, not significant; *P < 0.05; **P < 0.01 by Student’s t-test (G, I) or one-way ANOVA (H)
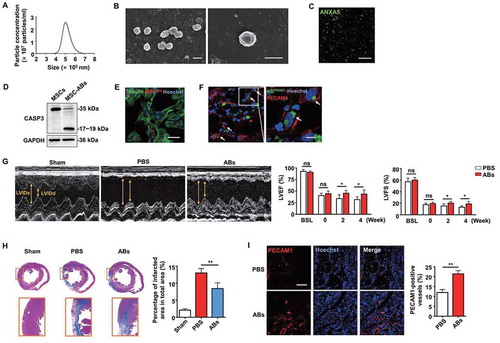
Since we found that angiogenesis is an underlying mechanism for cardiac function improvement, we examined whether ECs are potential target cells that internalize ABs. In an in vitro study, we confirmed that ABs were internalized by ECs after co-culture for 8 h, as shown by confocal microscopy (). In an in vivo study, PKH67-labeled ABs were internalized by PECAM1/CD31-positive ECs 48 h after intramyocardial injection in the infarct border zone (). To further assess their therapeutic benefits, ABs were injected intramyocardially into MI rats. Two weeks after treatment, we observed LV function deterioration in the PBS-treated group.
In contrast, the AB-treated group exhibited significant LV function improvement. The therapeutic effects generated by ABs were still obvious at 4 weeks after injection, as the LV function was enhanced in the AB-treated group, while the LV function declined in the PBS-treated group (). In addition, the infarct size was notably smaller in the AB injection group than that in the PBS group (). Regarding vessel density in the infarct border zone, there were significantly more blood vessels in the AB-treated group than that in the PBS-treated group (). These results indicated that ABs could improve cardiac function by promoting angiogenesis in the infarct border zone of MI.
ABs activated the angiogenic capacities of ECs
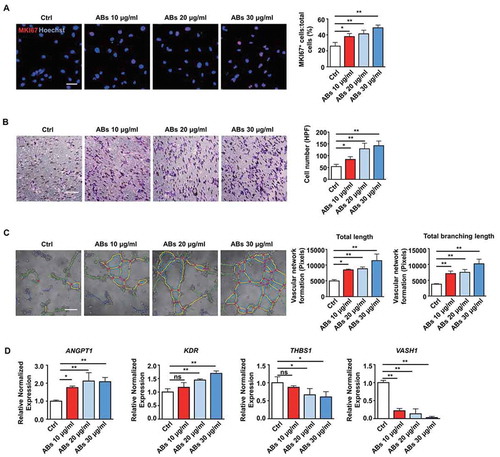
As we have shown that ABs released by MSCs could enhance angiogenesis and improve MI, we further examined the impact of ABs on functions of ECs in vitro. We performed proliferation, migration, and tube formation assays to test the pro-angiogenic efficacy of ABs. EC proliferation was assessed by MKI67/Ki67, and the results showed that the percentage of MKI67-positive cells significantly increased with AB treatment in a dose-dependent manner, indicating that ABs promoted EC proliferation (). In addition, we evaluated the effects of ABs on the angiogenic capacity of ECs by migration and tube formation assays. The results demonstrated that ABs could promote the migration () and tube formation ( and S1) of ECs. Furthermore, we analyzed the expression of angiogenesis-associated genes by quantitative real-time PCR (qPCR). The results showed that pro-angiogenic genes (ANGPT1 and KDR) were significantly upregulated after treatment, while anti-angiogenic genes (THBS1 and VASH1) were downregulated (). These results indicated that donor MSC-released ABs could activate the angiogenic capacity of ECs.
Figure 3. ABs activated the angiogenic capacities of ECs in vitro. (A) Proliferation was detected by MKI67 staining and quantified by the positive-stained percentage. Scale bar: 50 µm. (B) Cell migration was assessed by trans-well assay and quantified by the cell numbers. Scale bar: 20 µm. HPF, high power field. (C) Tube formation capacity on the Matrigel. The images were analyzed by ImageJ software. Scale bar: 20 µm. (D) HUVECs were incubated with ABs at concentrations of 10, 20 or 30 µg/ml for 12 h. The mRNA expression levels of ANGPT1, KDR, THBS1 and VASH1 were evaluated by qPCR. The results were representative of the data generated in at least 3 independent experiments. The data were presented as mean ± SEM. ns, not significant; *P < 0.05; **P < 0.01 by one-way ANOVA (A, B, C, D)
Besides ECs, we investigated the effects of ABs on other cardiac cell types, including cardiofibroblasts and cardiomyocytes. The immunofluorescence staining results showed that after injection of PKH67-labeled ABs into the local area of the border zone, they were rarely phagocytized by VIM-positive cardiofibroblasts, indicating that the recipient cells that directly affected by ABs are not mainly these cells (Fig. S2A). Meanwhile, some of the injected ABs were phagocytized by TNNT2-positive cardiomyocytes, demonstrating that ABs may generate effects on cardiomyocytes (Fig. S2A). Then we found that there was a large number of apoptotic cells (TUNEL-positive) after MI, while injection of ABs could effectively reduce the number of apoptotic cells (Fig. S2B). To directly investigate the effects of ABs on cardiomyocytes, we isolated and cultured TNNT2-positive rat cardiomyocytes (Fig. S2C). The effects of ABs on cardiomyocyte viability and apoptosis were investigated under a hypoxic environment in vitro, mimicking hypoxia after MI in vivo. We found that the treatment of ABs efficiently reduced cardiomyocytes apoptosis under hypoxic environment, as indicated by the Live & Dead assay (Fig. S2D) and flow cytometry (Fig. S2E).
ABs activated TFEB-dependent lysosome biogenesis in ECs
We next studied the mechanisms underlying the AB-induced pro-angiogenic effects on ECs. Accumulating results have shown that lysosomes are a control center for cellular clearance and energy metabolism, and the interaction between exogenous EVs and lysosomes could generate biological effects on the recipient cells [Citation23,Citation26–28]. Therefore, we investigated whether internalized ABs could interact with the lysosomes of ECs. First, lysosomes were labeled with LysoTracker Red and co-cultured with ABs for 12 h. The results showed that the majority of PKH67-labeled ABs co-localized with lysosomes and this co-location phenomenon disappeared when ECs were pre-treated with the lysosomal inhibitor chloroquine (CQ) before co-culture with ABs ().
Figure 4. ABs activated TFEB-dependent lysosome biogenesis of ECs. (A) PKH67-labeled ABs co-localized with lysosomes, which were stained with LysoTracker Red in HUVECs. CQ-treated HUVECs were used as a negative control. Scale bar: 25 µm. Chloroquine, CQ. (B) Relative lysosomal NAG activity of AB-treated and CQ-treated HUVECs. (C) HUVECs were treated with ABs (10 µg/ml, 12 h) or torin1 (1 µM, 3 h; as positive control) and stained with LysoTracker Red. The percentage of LysoTracker Red staining was quantified. Scale bar: 100 µm. (D) qPCR analysis of lysosomal genes. (E) LAMP1 and TFEB expression detected by western blots in HUVECs treated with ABs. (F) The expression of LAMP1 was detected by immunofluorescence staining, and the fluorescence intensity was quantified by ImageJ software. Scale bar: 100 μm. (G) Immunofluorescence of the subcellular locations of endogenous TFEB in HUVECs treated with ABs or torin1. The percentage of TFEB nuclear translocation was quantified. Scale bar: 50 µm. (H) HUVECs were infected with adenoviral vectors TFEB-EGFP. Forty-eight hours later, the cells were treated with ABs (20 µg/ml, 12 h) or torin1 (1 µM, 3 h). The subcellular location of TFEB was determined by green fluorescence. The percentage of TFEB nuclear translocation was quantified. Scale bar: 50 µm. (I) The expression of endogenous TFEB in the cytosolic (Cyt.) and nuclear (Nuc.) fractions was detected by western blots after treated with ABs or torin1. TUBB (tubulin, beta) and H3 were used as loading controls of the cytoplasmic and nuclear fraction, respectively. Quantitative analysis of the western blots in this study was performed by ImageJ software. The results were representative of data generated in at least 3 independent experiments. The data were presented as mean ± SEM. ns, not significant; *P < 0.05; **P < 0.01 by Student’s t-test (D) or one-way ANOVA (B, C, E, F, G, H, I)
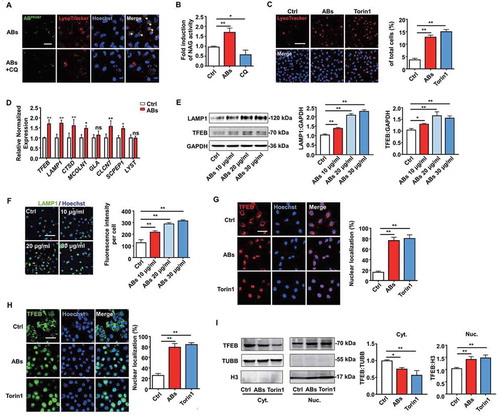
Moreover, ABs could enhance lysosomal protease activity, while CQ inhibited this effect as detected by NAG assays (). TFEB is a key molecule that regulates lysosomal biogenesis and autophagy [Citation30]. After translocation into the nucleus, TFEB triggers transcriptional regulation, which activates genes involved in autophagy and lysosomal function [Citation38]. As previous studies have shown that MTORC1 (mechanistic target of rapamycin kinase complex 1) inhibition could activate TFEB by promoting its nuclear translocation, enhance lysosomal activities, and increase the number of lysosomes, we used torin1 (an MTOR inhibitor) as a positive control [Citation39]. Next, we examined the changes in the number of lysosomes in ECs using LysoTracker Red. The results showed that ABs induced an increase in LysoTracker staining, which is similar to the effect caused by torin1 (). These results indicated that ABs activated lysosomal biogenesis in ECs.
Then, we tested whether ABs could activate lysosomes through TFEB. First, we detected the expression of lysosome-related genes. The relative expression of lysosomal genes in ECs, including TFEB and LAMP1 (lysosomal-associated membrane protein 1), was upregulated after AB treatment (). We observed consistent results at the protein levels of LAMP1 and TFEB (), and other lysosome-related proteins (Fig. S3A) as detected by western blots. In addition, we further verified the expression of LAMP1 by immunofluorescence assay (). Moreover, ABs could promote the translocation of endogenous TFEB or EGFP-tagged TFEB from the lysosome to the nucleus, thus regulating the target genes involved in autophagy and lysosomal biogenesis (). In summary, these results illustrated that ABs could enhance the biogenesis of lysosomes by activating TFEB.
ABs improved EC functions via inducing TFEB expression
TFEB regulates lysosomal biogenesis and autophagy to adapt to different environmental cues [Citation32,Citation38–40]. TFEB overexpression in cultured cells induces lysosomal biogenesis and increases the degradation of complex molecules [Citation29,Citation41]. Moreover, results have shown that TFEB has beneficial effects on post-ischemic angiogenesis [Citation31]. TFEB-deficient mice exhibit severe defects in placental vascularization and die during embryonic development [Citation41]. In addition, TFEB regulates angiogenesis in ischemic vascular disease through activating AMP-activated protein kinase (AMPK) and autophagy [Citation31]. Therefore, we investigated the role of endothelial TFEB in angiogenesis in vitro.
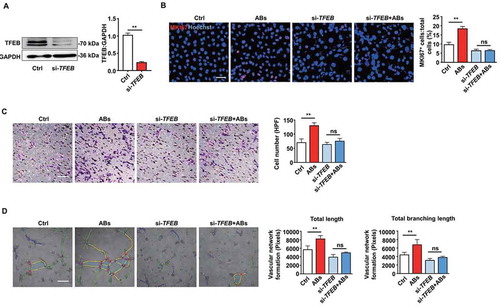
Next, we performed a siRNA-mediated TFEB knockdown to verify that TFEB is necessary for AB-enhanced EC biological functions. We detected the efficiency of the TFEB knockdown by western blots (). TFEB knockdown significantly attenuated the proliferation of ECs induced by ABs (). Similarly, ABs failed to improve migration and tube formation in the TFEB knockdown ECs as expected (, and S4). As the loss-of-function studies showed that TFEB knockdown attenuated AB-activated EC functions, our findings suggest that TFEB is required for ABs to exert angiogenic effects in ECs.
Figure 5. ABs improved EC function via inducing TFEB expression. (A) HUVECs were transfected with siRNA targeting TFEB (20 nmol/L) for 72 h, and the expression of TFEB protein was detected by western blots. (B) HUVECs proliferation was detected by MKI67 staining in the control group and in the TFEB knockdown group with or without AB treatment (20 µg/ml). Scale bar: 50 µm. Cell migration assay (C) and tube formation assay (D) were also performed in the control and TFEB knockdown group with or without AB treatment (20 µg/ml). Scale bar: 20 µm. The tube formation assay results were quantified by ImageJ software. The results were representative of data generated in at least 3 independent experiments. The data were presented as mean ± SEM. ns, not significant; **P < 0.01 by Student’s t-test (A) or one-way ANOVA (B, C, D)
ABs upregulated autophagy and angiogenesis via upregulating TFEB in ECs
TFEB is a master gene that regulates lysosomes and autophagy, which is tightly involved in the process of angiogenesis and post-ischemic tissue regeneration [Citation42,Citation43]. We further explored whether ABs could enhance autophagy in ECs. The expression of autophagy-associated genes and proteins in ECs was detected. The results showed that treatment with ABs upregulated both mRNA and protein expression levels of autophagy-associated genes in ECs (). We used a tandem fluorescence mRFP-GFP-LC3 reporter system to monitor the autophagic flux in AB-treated ECs to determine whether ABs could enhance autophagy flux in ECs. We used chloroquine (CQ) to induce the accumulation and co-localization of both mRFP and GFP fluorescence (yellow), which to indicate the blockade of autophagosome-lysosome fusion (). The results showed that ABs significantly increased the number of red-only puncta, suggesting the formation of autolysosomes (). In addition, LC3 (microtubule associated protein 1 light chain 3) expression was assessed by western blots in AB-treated ECs with or without CQ. Consistent with fluorescence data, ABs increased the LC3-II levels at 4 h, 12 h, and 24 h when we treated ECs with CQ (). These results showed that ABs could enhance autophagy flux in ECs.
Figure 6. ABs upregulated autophagy and angiogenesis via increasing TFEB expression in ECs. HUVECs were treated with different concentrations of ABs for 12 h, and the autophagy-associated protein and mRNA levels were detected by (A) western blots or (B) qPCR (20 ug/ml AB treatment). (C) HUVECs were infected with mRFP-GFP-LC3 (tfLC3) and then treated with ABs (20 ug/ml) in the presence or absence of chloroquine (CQ). The numbers of autophagosomes (yellow) and autolysosomes (red-only puncta) per cell were quantified. *p < 0.05, **p < 0.01 vs. control’s autophagosome; ns, not significant; ##p < 0.01 vs. control’s autolysosome by one-way ANOVA. (D) Expression of LC3 in HUVECs treated with ABs (20 ug/ml) with or without CQ was evaluated by western blots at different time points and was quantified by ImageJ software. (E) TFEB was knocked down with siRNA (20 nmol/l, 72 h). Transfection efficiency and autophagy-associated protein expression levels were detected by western blots. (F) TFEB was overexpressed in HUVECs via transfection with a TFEB-eGFP plasmid (20 nmol/L). Transfection efficiency and autophagy-related protein expression levels were detected by western blots. (G) BECN1 and LC3-I and LC3-II expression levels were detected by western blots in control HUVECs and the TFEB knockdown HUVECs with or without AB (20 µg/ml) treatment for 12 h. The results were representative of the data generated in at least 3 independent experiments and presented as mean ± SEM. ns, not significant; *P < 0.05; **P < 0.01 by Student’s t-test (B, D, E, F, G) or one-way ANOVA (A, C)
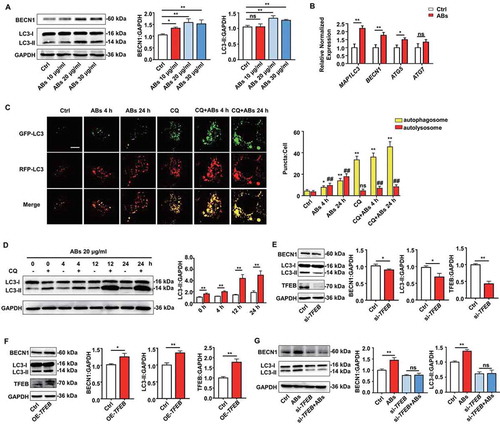
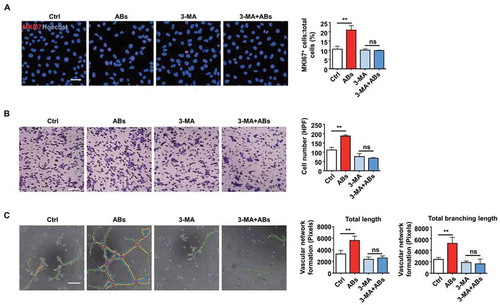
Then TFEB knockdown and overexpression were performed to confirm that TFEB could regulate autophagy in ECs. As shown in , TFEB overexpression significantly increased the expression level of LC3-II. Similarly, LC3-II expression decreased after TFEB knockdown. Then, autophagy-associated proteins were detected after ABs were co-cultured with TFEB knockdown ECs. In the absence of TFEB, ABs failed to increase the LC3-II level, which indicated that TFEB is necessary for ABs to upregulate autophagy (). To test whether autophagy was necessary for the process of AB-activated angiogenesis, we used 3-methyladenine (3-MA), an autophagy antagonist that inhibits class III phosphatidylinositol 3-kinase (PtdIns3K). The results showed that in the presence of 3-MA, ABs failed to promote the angiogenic capacity of ECs, including proliferation (), migration () and tube formation ( and S5). Together, these data indicated that TFEB mediated AB-induced autophagy and that autophagy was essential in the process of AB-activated angiogenesis.
Figure 7. Autophagy was necessary for AB-induced angiogenesis. (A-C) HUVECs were treated with 3-MA (5 mM) for 16 h. The angiogenic capacity of HUVECs, including proliferation (A), migration (B) and tube formation (C), were detected following co-culture with ABs (20 µg/ml). The tube formation assay results were quantified by ImageJ software. Scale bar: 50 µm (A); Scale bar: 20 µm (B, C). The results were representative of data generated in at least 3 independent experiments. The data were presented as the mean ± SEM. ns, not significant; **P < 0.01 by one-way ANOVA (A, B, C)
We then explored the detail mechanisms underlying angiogenesis activated by AB-induced autophagy. Since vascular endothelial growth factor (VEGF) signaling is critical for regulating angiogenesis, we examined the expression of important proteins in this pathway [Citation44–46]. We found the expression levels of KDR (kinase insert domain receptor), p-AKT1 (phosphorylated AKT serine/threonine kinase 1), and p-NOS3 (phosphorylated nitric oxide synthase 3) in ECs increased after AB treatment (Fig. S6A), which indicated that ABs could activate VEGF signaling pathway. In addition, we tested the production of nitric oxide (NO) after the treatment of ABs using DAF-FM DA fluorescent probe. Compared with the control group, the production of NO by ECs significantly increased after AB treatment (Fig. S6B). Moreover, we found that the effects of ABs on activating the VEGF signaling pathway (Fig. S6C) and increasing NO production (Fig. S6D) could be interrupted by perifosine, an inhibitor of AKT. Meanwhile, the treatment of perifosine weakened the capacity of the tube formation of ECs (Fig. S6E). Collectively, since we have found enhancing angiogenesis by ABs required autophagy elevation, these data revealed that AB-induced autophagy stimulated angiogenesis and involved AKT-mediated VEGF signaling pathway activation and NO production.
Autophagy was required for AB-mediated myocardial functional recovery and angiogenesis in vivo
To demonstrate whether autophagy regulation was required for AB-mediated myocardial functional recovery and angiogenesis in vivo, firstly, autophagy flux in vivo was detected. The western blots showed that chloroquine administration increased LC3-II levels in PBS- and AB-treated group, while the AB-treated group exhibited significantly higher increasing magnitude than the PBS group (). These results indicated that AB administration increased autophagy flux in local heart tissue. Consistent with the above results, the AB-treated group showed improved cardiac functions compared with the PBS-treated group, as assessed by the increase in LVEF and LVFS levels (). In contrast, the autophagy inhibition group showed attenuated therapeutic effects of ABs on the recovery of LVEF and LVFS levels (). In addition, autophagy inhibition by 3-MA attenuated the therapeutic effects of ABs on reducing infarct size () and promoting angiogenesis (). To determine the efficiency of autophagy inhibition, we evaluated autophagy changes by detecting the expression of LC3 by western blots. The results showed that AB treatment significantly improved the LC3-II level compared with PBS treatment, while the improvement was blocked by autophagy inhibition with 3-MA (), indicating the efficient inhibition of autophagy by 3-MA.
Figure 8. Autophagy was required for AB-mediated myocardial functional recovery and angiogenesis in rat MI model. (A) The expression of LC3 in PBS- and AB-treated group was evaluated by western blots with or without chloroquine (CQ) and was quantified by ImageJ software. (B) LVEF and LVFS of hearts from PBS group, AB group and AB+3-MA group were detected at 2 weeks and 4 weeks after MI. (C) Masson’s trichrome staining images from the mid-papillary region of the infarcted heart at 4 weeks after MI in PBS group, AB group and AB+3-MA group. Fibrosis of the infarct size was quantified by ImageJ software. (D) Confocal microscopy images of capillary density in the infarction border zone at 4 weeks after treatment. The area of PECAM1-positive vessels was quantified by ImageJ software. Scale bar: 100 µm. (E) The expression levels of LC3-I and LC3-II in PBS group, AB group and AB+3-MA group were evaluated by western blots and were quantified by ImageJ software. (F) The expression levels of ATG5 and LC3-I and LC3-II in control and ATG5-deficient mice were evaluated by western blots. (G) LVEF and LVFS of hearts from PBS group and AB group were detected at 4 weeks after MI in control and ATG5-deficient mice. (H) Masson’s trichrome staining images from the mid-papillary region of the infarcted heart at 4 weeks after MI of control and ATG5-deficient mice. Fibrosis of the infarct size was quantified by ImageJ software. (I) Confocal microscopy images of capillary density in the infarction border zone at 4 weeks after treatment. The area of PECAM1-positive vessels was quantified by ImageJ software. Scale bar: 100 µm. The results were representative of data generated in at least 3 independent experiments. The data were presented as mean ± SEM. n = 7 rats per group. ns, not significant; *P < 0.05; **P < 0.01 by Student’s t-test (A, G, H, I) or one-way ANOVA (B, C, D, E)
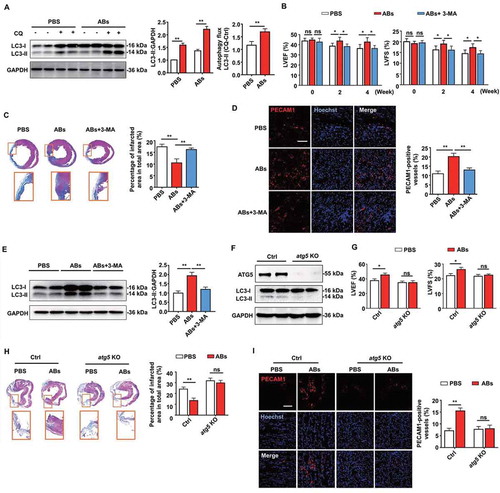
To further confirm that autophagy is required for AB-mediated myocardial functional recovery and pro-angiogenesis in vivo, we used ATG5-deficient mice as autophagy disruption animal models. ATG5 (autophagy related 5) is an initiator of autophagy required for autophagosome formation [Citation47]. AAV9-cTNT-Cre-GPF was injected into Atg5flox/flox mice to generate ATG5-deficient mice (AAV9-cTNT-GPF as control). Western blots with cardiac extract showed that ATG5-deficient mice were absent from ATG5 expression and had low levels of autophagy at 2 weeks after virus injection, compared with control mice (). Then MI was performed in ATG5-deficient mice and control mice. Compared with the PBS group, AB treatment significantly increased LVEF and LVFS in control mice, while blocking the therapeutic effects of ABs in ATG5-deficient mice with autophagy disruption (). In addition, we blocked the therapeutic effects of ABs on reducing infarct size () and promoting angiogenesis () in ATG5-deficient mice, compared with control mice. In this study, we also confirmed that MSC administration increased autophagy flux in local heart tissue (Fig. S7A). The therapeutic effects of MSCs on the recovery of LVEF and LVFS levels (Fig. S7B), reducing infarct size (Fig. S7C), and promoting angiogenesis (Fig. S7D) could be attenuated by autophagy inhibition using 3-MA (Fig. S7E).
Moreover, after AB treatment, we found elevated expression levels of TFEB in cardiomyocytes and enhanced the autophagy level of the cardiomyocytes as assessed by LC3-II and BECN1 (beclin 1) expression (Fig. S8A). In addition, when we performed TFEB knockdown by siRNA, ABs failed to increase LC3-II or BECN1 level, which indicated that TFEB elevation was necessary for ABs to upregulate autophagy in cardiomyocytes (Fig. S8B). Meanwhile, we found that ABs partially enhanced cardiomyocyte viability and reduced their apoptosis in a hypoxic environment or after in vivo transplantation, as assessed by Live & Dead assay (Fig. S8C), flow cytometry (Fig. S8D) and TUNEL staining (Fig. S8E) while the effects of ABs on cardiomyocytes were attenuated by administrating 3-MA which inhibits autophagy of cardiomyocytes.
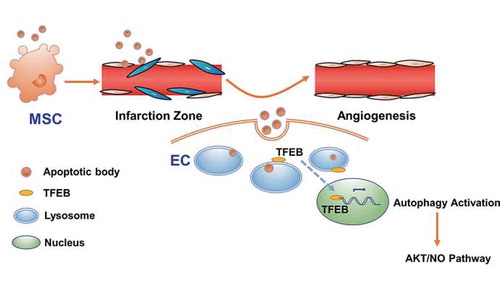
Collectively, these results using autophagy inhibition and ATG5-deficient model showed that autophagy inhibition blocked the therapeutic effects generated by MSCs or ABs, and AB-mediated myocardial functional recovery and angiogenesis in vivo required autophagy. In this study, we found that the donor MSC-derived ABs promoted TFEB-mediated lysosomal function, thus upregulating autophagy in recipient ECs to promote angiogenesis ().
Figure 9. Schema for donor MSC-derived ABs enhanced angiogenesis via TFEB-mediated lysosome functional regulation. TFEB upregulates autophagy in recipient ECs to promote angiogenesis via AKT-NO pathway
Discussion
The association between cell apoptosis and regeneration has become increasingly close since the concept of apoptosis-induced compensatory proliferation was proposed [Citation48,Citation49]. Studies have revealed that apoptosis may be the driving force for cell proliferation during tissue regeneration in many model organisms [Citation20,Citation50–55]. However, the relationship between implanted cell apoptosis and recipient cell regeneration is largely unknown. For decades, clinics extensively applied MSCs as a therapeutic strategy for several medical conditions, such as cardiac ischemia, but the underlying mechanism is still largely unclear. There is a paradox that MSCs are therapeutically efficacious without significant engraftment [Citation14,Citation18]. In our experiments, we found that MSCs indeed have positive therapeutic effects on MI, as also shown in other reports. Interestingly, we found that MSCs disappeared gradually in the injection area, accompanied by apoptosis. Furthermore, we found that MSC-derived ABs could enhance tissue repair by reducing the infarct size and improving cardiac function via angiogenesis in the MI model. Our study provides evidence to address the paradox by showing that MSC-derived ABs are effective in ischemic myocardial repair.
EVs have attracted considerable attention because they play important roles in cell-to-cell communication in physiological and pathological conditions [Citation21,Citation56]. Different cell-derived EVs exhibit different biological functions because EVs carry different membrane molecules on their surface, as well as soluble mediators, which are characteristic of the cells they generated from [Citation21,Citation57,Citation58]. In addition, different types of EVs, including ABs, microvesicles, and exosomes, possess different biological functions. For decades, a large number of studies have demonstrated the role of EVs in angiogenesis and highlighted their therapeutic potential [Citation21,Citation56]. However, current studies focus mostly on exosomes or microvesicles, while we know little about whether ABs are involved in angiogenesis. In this study, we found that ABs derived from MSCs play a positive role in angiogenesis by promoting the proliferation, migration, and tube formation of ECs. Our study extended the research of EVs to include the biological effects of ABs on tissue repair and angiogenesis.
Multiple mechanisms are involved in the modulation of angiogenesis by EVs. EVs carry various ligands on their surface that interact directly with receptors in target cells to induce signal transduction [Citation56,Citation59]. In addition, EVs can act as a carrier delivering various bioactive molecules to target cells through membrane fusion [Citation60]. However, with a deeper understanding of the fate of EVs in the recipient cells, accumulating evidence indicates that exogenous EVs end up fusing with lysosomes [Citation23]. The interaction between EVs and lysosomes does not necessarily mean a commitment to degradation. This interaction could also mediate some of the biological effects of EVs on recipient cells.
Moreover, whether lysosomal activation could promote the function of cells is largely unknown. In the present study, we found that ABs could activate the lysosomes in ECs and increase the protein expression of LAMP1 and TFEB. Also, ABs mediate TFEB translocation into the nucleus, which can promote the angiogenic capacity of ECs. Based on our results, we uncovered that AB internalization is accompanied by lysosome activation in recipient cells, thus enhancing the biological function of ECs.
Cardiomyocytes are the dominant cells that maintain heart function. Reducing the apoptosis of cardiomyocytes in extreme environments is of great significance for the maintenance of cardiac functions, and previous studies have shown that MSC transplantation effectively reduces the number of apoptotic cardiomyocytes and thus achieves the treatment of MI [Citation61–65]. In this study, we found reduced apoptotic cardiomyocytes after MSC-released AB transplantation, which indicated that effective control of the cell loss is possible. Moreover, we found that ABs effectively enhanced cardiomyocyte viability and reduced their apoptosis in a hypoxic environment. Meanwhile, we have proved that MSC-released ABs significantly increased MKI67-positive endothelial cells, which illustrated that ABs promoted the proliferation of a certain type of cells after MI. Collectively, MSC transplantation maintained the number of cardiomyocytes by enhancing their viability and promoted the proliferation of some types of cells, including ECs, therefore probably increased total cardiac cell numbers after MI in some way.
In conclusion, our study sheds light on the efficacy of ABs in tissue repair, which widens the research scope of EVs. Considering these properties of ABs, our study provides new evidence to expand the possibility of the use of ABs as therapeutic agents for pathologies associated with altered angiogenesis. In addition, the underlying mechanism through which ABs released by transplanted MSCs could promote angiogenesis can be applied in tissue repair and regeneration by regulating apoptosis in implanted cells.
Materials and methods
Cell culture and reagents
Mesenchymal stem cells (MSCs) were isolated from the femurs and tibias of Sprague Dawley (SD) rats or C57BL/6 mice, which were purchased from the Animal Center of Fourth Military Medical University. In brief, MSCs were drawn out by flushing from tibias and femurs with basal culture medium containing α-MEM medium (Gibco, 12571063), 10% or 20% FBS (Sijiqing, 13011-8611), 2 mM L-glutamine (Invitrogen, 25030-081), 100 U/mL penicillin and 100 U/mL streptomycin (Invitrogen, 15140-122). Single-cell suspension was equally seeded in dishes and initially maintained in an atmosphere of 5% CO2 at 37°C. According to the corresponding experiments, MSCs were pre-labeled with PKH67 Green Fluorescent Cell Linker Kit (Sigma-Aldrich, PKH67GL-1KT) following the manufacturer’s instructions. The human umbilical vein endothelial cells (HUVECs) were purchased from the ATCC (CRL-1730) and cultured according to the instructions. Torin1 (HY-13003), 3-MA (HY-19312), and sertraline (HY-B0176A) were purchased from MCE, and chloroquine (PHR1258) was purchased from Sigma-Aldrich. Z-VAD-FMK (60332) and Perifosine (14240) were purchased from Cell Signaling Technology.
Cardiac cell isolation and identification
The primary cardiomyocytes were isolated and cultured, as previously described [Citation66]. In brief, the hearts were obtained from SD rats with 3 d of birth. After rinsing, they were digested in 0.05% w:v trypsin-EDTA (Gibco, 25300054) and 0.1% w:v collagenase (Sigma-Aldrich, 17018029) at 37°C for 15 min. The collected cells were plated in the dishes for 2 h (adherent cells are fibroblasts) and re-inoculate the upper unattached cells onto a new dish with 0.5% gelatin, which layer of cells are the cardiomyocytes. 5-bromo-2-deoxyuridine (Sigma-Aldrich, B5002) was added into the medium to inhibit cardiofibroblast growth. After rinsing, the cells were permeabilized with 0.03% Triton X-100 (Sigma-Aldrich, T8787) for 10 min at room temperature and blocked in 5% BSA at 37°C for 1 h. The cells were incubated overnight at 4°C with the primary antibody for cardiac troponin T (1:200; Abcam, ab8295). After rinsing by PBS (XINTAI Biotechnology, BF001), the cells were incubated with secondary fluorescence antibody (1:200; Cell Signaling Technology, 8890) at room temperature for 1 h and the nuclei were counterstained by Hoechst 33342 (Sigma-Aldrich, 14533). The fluorescence was observed by the laser scanning confocal microscope (Olympus, FV1000)
Isolation and characterization of ABs
ABs were isolated from the culture supernatant of apoptosis-induced MSCs using a protocol that includes several steps of differential centrifugation [Citation36]. Firstly, MSCs were treated with the apoptosis-inducing agent staurosporine (Cell Signaling Technology, 9953s) at a concentration of 0.5 µM for 12 h to induce MSC apoptosis. Then, the cell supernatants were obtained by centrifugation at 800 × g for 10 min to get rid of large debris. After additional centrifugation at 16,000 × g for 30 min at 4°C, the pellet was washed twice with PBS. Apoptotic bodies derived from MSCs were then resuspended in PBS for further use.
We used the BCA protein assay (TIANGEN Biotechnology, PA115) to determine the protein contents of ABs. The exact size distribution of the EVs was measured using nanoparticle tracking analysis (NTA) platform (Malvern, Nanosight LM10). ABs were stained with ANXA5 fluorescent dye (7sea Biotechnology, A005-2). ABs were also observed directly under a scanning electron microscope (HITACHI, S4800).
Internalization of ABs into ECs in vitro
The HUVECs were plated onto dishes and maintained at 37°C overnight. ABs were pre-labeled with the PKH26 Red Fluorescent Cell Linker Kit (Sigma-Aldrich, PKH26PCL-1KT) according to the manufacturer’s instructions and washed in PBS with centrifugation at 16,000 × g for 30 min. PKH26-labeled ABs at a concentration of 10 μg/ml were then co-cultured with HUVECs for 8 h. After fixed by 4% paraformaldehyde for 15 min at 4°C, the cells were used for cytoskeleton staining (Yeasen, 40735ES75), and the cell nuclei were counterstained with Hoechst 33342 (Sigma-Aldrich, 14533). The fluorescence was observed by the laser scanning confocal microscope (Olympus, FV1000).
Immunofluorescence
The samples were incubated with primary antibodies at 4°C overnight, followed by treatment with Cy-3- or FITC-conjugated IgG secondary antibody for 2 h at room temperature. Cell nuclei were counter-stained with Hoechst 33342 (Sigma-Aldrich, 14533) for 10 min at room temperature. For autophagy flux assay, HUVECs were infected with adenoviruses expressing mRFP-GFP-LC3 (GENECHEM, GV374) for 72 h and then treated with ABs and/or CQ. Images were obtained using the laser scanning confocal microscope (Olympus, FV1000, Tokyo, Japan) and quantified. The following primary and secondary antibodies were used in the immunofluorescence studies: PECAM1/CD31 (1:100; Abcam, ab119139), TFEB (1:500; Cell Signaling Technology, 4240), LAMP1 (1:100; Abcam, ab24170), MKI67/Ki67 antibody (1:200; Abcam, ab15580), FITC-conjugated goat anti-rabbit IgG (Jackson, 111-095-003) and Cy3-conjugated goat anti-rabbit IgG (Jackson, 111-165-003).
Western blotting
Cells and tissue samples were lysed with RIPA (Beyotime Biotechnology, P0013) containing protease inhibitor (Roche, 04693132001). Cytosolic and nuclear fractions were extracted with nuclear and cytoplasmic protein extraction kit (Beyotime Biotechnology, P0027) according to the manufacturer’s instruction. Protein quantification was performed using a BCA assay (Beyotime Biotechnology, P0012). Extracted proteins (30 µg) were separated by SDS-polyacrylamide gel electrophoresis (PAGE) and transferred onto polyvinylidene fluoride (PVDF) membranes (Roche, 03010040001). The membranes were blocked with 5% bovine serum albumin (MP Biomedical, 0218072801) for 2 h at room temperature, followed by incubation with primary antibodies overnight at 4°C. After washing 3 times with Tris-buffered saline-Tween (Solarbio, T1081), the membranes were incubated with secondary antibodies for 2 h at room temperature. Subsequently, by further washing with TBS-T, protein bands were visualized with an enhanced chemiluminescence system using a Tanon Chemidoc Apparatus (Tanon-Bio, 4600). The following primary antibodies were used: CASP3/caspase 3 (1:5000; Cell Signaling Technology, 9665), TFEB (1:1000; Cell Signaling Technology, 37785) or TFEB (1:500; Cell Signaling Technology, 4240), LAMP1 (1:1000; Abcam, ab24170), BECN1/beclin 1 (1:1000; Cell Signaling Technology, 3738), MAP1LC3/LC3 (1:1000; Cell Signaling Technology, 3868), CTSD (1:1000; Cell Signaling Technology, 2284S), MCOLN1/TRPML1 (1:1000; Abcam, ab28508), CLCN7 (1:1000; Affinity Biosciences, DF3932), SCPEP1/RISC (1:1000; Proteintech, 60086–1), KDR/VEGFR2 (1:1000; Abcam, ab11939), p-AKT1 (1:1000; Cell Signaling Technology, 9271), AKT1 (1:1000; Abcam, ab179463), p-NOS3/eNOS (1:1000; Cell Signaling Technology, 9570), NOS3/eNOS (1:1000; Cell Signaling Technology, 32027), ATG5 (Cell Signaling Technology, 12994) and GAPDH (1:5000; CWBIO, CW0100), TUBB/beta tubulin (1:1000; Proteintech, 10068-1-AP), Histone H3 (1:1000; Cell Signaling Technology, 9715).
Cell proliferation assay
The proliferative status of HUVECs was measured by detecting MKI67/Ki67 (1:200; Abcam, ab15580) level, which is a cellular marker for proliferation, using immunofluorescence. The HUVECs were seeded on plastic plates in triplicate and cultured in alpha-MEM containing 1% FBS with different doses of ABs (0, 10, 20 and 30 µg/ml) for 12 h. Immunofluorescence was observed by confocal microscopy (Olympus, FV1000), and images of different fields from each well were taken for quantification using ImageJ software.
Cell migration assay
A trans-well system (Corning, MCEP24H48) was used to detect HUVEC migration. The pore diameter of the upper chamber was 8 µm. HUVECs (1 × 10⁵ cells/ml) were seeded in the upper chamber, and serum are starved. Then 0, 10, 20 and 30 µg/ml ABs were added into the bottom well and incubated at 37°C for another 5 h. Then, HUVECs passing through the upper chamber were fixed with 4% paraformaldehyde, stained with crystal violet (Sigma-Aldrich, C6158), and counted in 5 representative fields for quantifications.
Tube formation assay
In vitro capillary network formation was determined by tube formation assay in Matrigel (Corning, 354248). HUVECs (1.5 × 10⁴ cells/ml) were seeded onto Matrigel-coated wells of a 96-well plate and cultured in 1% FBS-supplemented DMEM (Gibco, 10567014) in the presence of ABs at the indicated concentrations. Three wells were used for each concentration, and tube formation was observed by an inverted microscope (Leica, DMi8). The number of network structures was quantified by randomly selecting 5 fields per well using ImageJ software.
Lysotracker red staining
HUVECs were seeded in plates treated with ABs, chloroquine (negative control), or torin1 (positive control) in triplicate. Then, the cells were incubated with fresh medium containing LysoTracker Red DND-99 (0.3 µM; Yeasen, 40739ES50) for 30 min. The medium was changed again to the LysoTracker-free medium, and the lysosomes were observed by confocal microscopy (Olympus, FV1000, Tokyo, Japan).
β-N-acetylglucosaminidase (NAG) assay
NAG assays were performed using a kit from Sigma-Aldrich (CS0780). Briefly, HUVECs treated with ABs or chloroquine (negative control) were lysed in RIPA buffer (250 µl). Ten micrograms of cell lysates from each sample were normalized to an equal volume and measured in triplicate for NAG activity following the protocol provided by the supplier.
Gene expression analysis by quantitative real-time PCR
Total RNA was extracted with TRIzol reagent (Invitrogen, 15596018), and one microgram of total RNA was reverse transcribed into cDNA with a Prime Script RT reagent kit (TaKaRa, RR037A). Real-time PCR was performed with SYBR Green dye and Taq polymerase (TaKaRa, RR820B; BioRad, CFX96). Gene expression was normalized to internal control. The primer sequences are shown in .
Table 1. Primers for real-time PCR
TFEB overexpression
HUVECs were plated at a density of 2 × 10⁵ cells in 6-well plates. The cells were transfected with the TFEB plasmids (Addgene, 38,119, Shawn Ferguson Lab) 24 h after cell seeding. Transfection efficiency was measured 72 h post-transfection using western blots. For subcellular locations of exogenously-expressed TFEB, adenoviral vectors TFEB-EGFP (Hanheng Biotechnology, Phbap000200) were used to infect HUVECs.
SiRNA knockdown
HUVECs were transfected with siRNA-TFEB (Santa Cruz Biotechnology, 38509) using a Transfection Kit (Ribobio, C10511-1), according to the manufacturer’s instructions. Transfection efficiency was measured 72 h post-transfection using western blots.
TUNEL staining
TUNEL staining was performed as manufacturers’ protocols with the in-situ cell death detection kit (Roche, 12156792910 & Beyotime Biotechnology, C1088) from myocardial sections. Briefly, approximately 6-μm thick sections were prepared from the rat hearts. After sequential pretreatment, each section was stained with TUNEL reagents for 1.5 h at 37°C in the dark environment. Hoechst 33342 was used to counterstain the nuclei. Digital photographs were taken at high magnification using the laser scanning confocal microscope (Olympus, FV1000).
Echocardiography
Transthoracic echocardiography and high-resolution echocardiography imaging system (VisualSonics, VEVO2100 & VINNO, X10-23L) were performed on mice and rats. Cardiac functions were assessed by M-mode echocardiography. Left ventricular end-diastolic diameter and left ventricular end-systolic diameter were measured on the parasternal LV long-axis view. All measurements represent the mean of 5 consecutive cardiac cycles. Left ventricular ejection fraction (LVEF) and left fractional shortening (LVFS) were measured as previously described [Citation67]. Echocardiography was performed by a single experienced operator in a blind manner.
MI model and intramyocardial injection
Animal experiments were approved by the Institutional Animal Care and Use Committee of the Fourth Military Medical University (FMMU). Adult male SD rats (200 ± 10 g) were used to create the MI model, as previously described [Citation68]. After anesthetization and intubation, the rat heart was exposed by performing left thoracotomy in the 4th intercostal space. Then, the left anterior descending coronary artery (LAD) was permanently ligated at its upper 1/3 location with a 6–0 silk suture. Finally, the chest and skin were closed in layers, and the rat was kept on the respiratory machine until it woke up. Hearts were imaged 2-dimensionally in the long-axis views, and cardiac function was evaluated, including the LVEF, as described before, to confirm infarction [Citation69]. Two weeks after surgery, MSCs (2 × 10⁶ cells) or ABs (100 μg in 100 μl PBS) were injected intramyocardially into the border zone of the infarction in 4 directions oriented 90 apart from one another. PBS-treated rats were injected with the same amount of PBS into the same region of their ischemic myocardium, and the sham group was subjected to only left thoracotomy.
Atg5flox/flox mice, purchased from Shanghai Model Organisms Center, were used for the MI model. To create ATG5-deficient mice, Atg5flox/flox mice were injected with 0.2 ml of AAV9-cTNT-Cre-GFP or AAV9-cTNT-GFP (Hanheng Biotechnology, HBAAV-6003) through the tail vein. Myocardial infarction of mice was accomplished by ligation of the LAD artery after left thoracotomy, as described before [Citation70]. Ventricle blanching indicated successful occlusion of the vessel. ABs (10 μg) were injected intramyocardially into the peri-infarct areas at 3 different sites with a total volume of 20 μl in each mouse with a 29-gauge needle (Hamilton, HS-600). Control animals received a 20 μl PBS injection instead.
Histology assay
To quantify the myocardial infarct size, the Masson trichrome staining was used to assess collagen fiber percentage. In brief, the heart sections were collected and stained with Masson’s trichrome following manufacturer’s instructions (BASO diagnostics, BA4079). Photographs were captured by a microscope (Leica, M205FA, Wetzlar, Germany), and the percentage of myocardial infarct area in the total area was measured by ImageJ software.
Internalization of ABs into cardiac cells in vivo
Immunofluorescence was used to detect the location of injected ABs labeled by PKH67 Green Fluorescent Cell Linker Kit (Sigma-Aldrich, USA) according to the manufacturer’s instructions. The pre-labeled ABs (100μg in 100μl PBS) were injected intramyocardially in the peri-infarct region at the border zone. Then the sections from heart tissue were fixed and rinsed and were incubated overnight at 4°C with the primary antibody for PECAM1/CD31 (1:100; Abcam, ab119139), VIM (vimentin) (1:200; Cell Signaling Technology, 5741), or TNNT2/cardiac troponin T (1:100; Abcam, ab8295), respectively. After rinsing, the sections were incubated with fluorescence secondary antibody at room temperature for 1 h. The results were examined under the laser scanning confocal microscope (Olympus, FV1000).
Cell viability
The rat cardiomyocytes were seeded into laser confocal petri dish (Nest, 801002) at 1 × 10⁵ cells per dish with hypoxia condition (90% N2, 5% CO2, and 5% O2) in an anaerobic system at 37°C for 6 h cultured in basic medium while there was another group that received 20 μg/ml ABs. In the control group, the rat cardiomyocytes were maintained at normal conditions (95% air, 5% CO2) for equivalent periods. After the treatment, the cell viability was determined via the laser scanning confocal microscope using a cell LIVE & DEAD Viability Kit (Yeasen, 40747ES76) as directed by the manufacturer’s instructions. Living cells were identified with Calcein AM (5 μM), and the dead cells were identified with propidium iodide (2.5 μM; Yeasen, 40747ES76).
Flow cytometry
ANXA5 and PI assays were conducted to measure the apoptosis of cardiomyocytes using the ANXA5-FITC & PI Apoptosis Detection Kit (7Sea Biotechnology, A005) according to the manufacturer’s instructions. The cells were collected and resuspended in 500 μL of binding buffer and stained with 15 μL of FITC-labeled ANXA5 and 5 μL of PI for 30 min at 4°C. The stained cells were then analyzed by flow cytometry (Beckman-Coulter, CytoFLEX).
Nitric oxide measurement
Nitric oxide concentrations in HUVECs were measured by fluorescent nitric oxide probe DAF-FM (Yeasen, 40769ES60) following the protocol provided by the supplier. Briefly, cells were loaded with 5 μM DAF-FM diacetate for 20 min at 37°C and then washed 3 times with PBS. The nuclei were counterstained by Hoechst 33342 (Sigma-Aldrich, 14533). DAF-FM fluorescence was observed by laser scanning confocal microscope (Nikon, A1).
Statistical analysis
Data were expressed as mean ± SEM, as indicated. Comparisons between 2 groups were performed by Student’s t-test, and multiple group comparisons were performed by one-way ANOVA. Bonferroni correction was used when multiple comparisons were performed. P values less than 0.05 were considered statistically significant. Graphs and statistical analyzes were performed using GraphPad Prism (GraphPad Software, 7.0) and SPSS software (IBM, 19.0).
Supplemental Material
Download MS Word (4.5 MB)Disclosure statement
No potential conflict of interest was reported by the authors.
Supplementary material
Supplemental data for this article can be accessed here.
Additional information
Funding
References
- Galipeau J, Sensebe L. Mesenchymal stromal cells: clinical challenges and therapeutic opportunities. Cell Stem Cell. 2018;22: 824–833. PMID:29859173.
- Golpanian S, Wolf A, Hatzistergos KE, et al. Rebuilding the damaged heart: mesenchymal stem cells, cell-based therapy, and engineered heart tissue. Physiol Rev. 2016;96: 1127–1168. PMID:27335447.
- Trounson A, McDonald C. Stem cell therapies in clinical trials: progress and challenges. Cell Stem Cell. 2015;17: 11–22. PMID:26140604.
- Ye L, Fan Z, Yu B, et al. Histone demethylases KDM4B and KDM6B promotes osteogenic differentiation of human MSCs. Cell Stem Cell. 2012;11:50–61. PMID:22770241.
- Liu S, Jiang L, Li H, et al. Mesenchymal stem cells prevent hypertrophic scar formation via inflammatory regulation when undergoing apoptosis. J Invest Dermatol. 2014;134:2648–2657. PMID:24714203.
- Liu S, Liu D, Chen C, et al. MSC transplantation improves osteopenia via epigenetic regulation of notch signaling in lupus. Cell Metab. 2015;22:606–618. PMID:26365178.
- Suzuki E, Fujita D, Takahashi M, et al. Therapeutic effects of mesenchymal stem cell-derived exosomes in cardiovascular disease. Adv Exp Med Biol. 2017;998: 179–185. PMID:28936740.
- Tan X, Gong YZ, Wu P, et al. Mesenchymal stem cell-derived microparticles: a promising therapeutic strategy. Int J Mol Sci. 2014;15: 14348–14363. PMID:25196436.
- Caplan AI, Dennis JE. Mesenchymal stem cells as trophic mediators. J Cell Biochem. 2006;98: 1076–1084. PMID:16619257.
- Barbash IM, Chouraqui P, Baron J, et al. Systemic delivery of bone marrow-derived mesenchymal stem cells to the infarcted myocardium: feasibility, cell migration, and body distribution. Circulation. 2003;108:863–868. PMID:12900340.
- Winkler T, von Roth P, Schuman MR, et al. In vivo visualization of locally transplanted mesenchymal stem cells in the severely injured muscle in rats. Tissue Eng Part A. 2008;14:1149–1160. PMID:18433314.
- Toma C, Wagner WR, Bowry S, et al. Fate of culture-expanded mesenchymal stem cells in the microvasculature: in vivo observations of cell kinetics. Circ Res. 2009;104: 398–402. PMID:19096027.
- Bian S, Zhang L, Duan L, et al. Extracellular vesicles derived from human bone marrow mesenchymal stem cells promote angiogenesis in a rat myocardial infarction model. J Mol Med (Berl). 2014;92: 387–397. PMID:24337504.
- Lee RH, Pulin AA, Seo MJ, et al. Intravenous hMSCs improve myocardial infarction in mice because cells embolized in lung are activated to secrete the anti-inflammatory protein TSG-6. Cell Stem Cell. 2009;5:54–63. PMID:19570514.
- Czabotar PE, Lessene G, Strasser A, et al. Control of apoptosis by the BCL-2 protein family: implications for physiology and therapy. Nat Rev Mol Cell Biol. 2014;15: 49–63. PMID:24355989.
- Riazifar M, Pone EJ, Lotvall J, et al. Stem cell extracellular vesicles: extended messages of regeneration. Annu Rev Pharmacol Toxicol. 2017;57: 125–154. PMID:27814025.
- Gupta KH, Goldufsky JW, Wood SJ, et al. Apoptosis and compensatory proliferation signaling are coupled by crki-containing microvesicles. Dev Cell. 2017;41:674–84e5. PMID:28633020.
- Galleu A, Riffo-Vasquez Y, Trento C, et al. Apoptosis in mesenchymal stromal cells induces in vivo recipient-mediated immunomodulation. Sci Transl Med. 2017;9:eaam7828. PMID:29141887.
- Ryoo HD, Bergmann A. The role of apoptosis-induced proliferation for regeneration and cancer. Cold Spring Harb Perspect Biol. 2012;4: a008797. PMID:22855725.
- Chera S, Ghila L, Dobretz K, et al. Apoptotic cells provide an unexpected source of Wnt3 signaling to drive hydra head regeneration. Dev Cell. 2009;17:279–289. PMID:19686688.
- Todorova D, Simoncini S, Lacroix R, et al. Extracellular vesicles in angiogenesis. Circ Res. 2017;120: 1658–1673. PMID:28495996.
- Liu D, Kou X, Chen C, et al. Circulating apoptotic bodies maintain mesenchymal stem cell homeostasis and ameliorate osteopenia via transferring multiple cellular factors. Cell Res. 2018;28:918–933. PMID:30030518.
- Eitan E, Suire C, Zhang S, et al. Impact of lysosome status on extracellular vesicle content and release. Ageing Res Rev. 2016;32: 65–74. PMID:27238186.
- Settembre C, Fraldi A, Medina DL, et al. Signals from the lysosome: a control centre for cellular clearance and energy metabolism. Nat Rev Mol Cell Biol. 2013;14: 283–296. PMID:23609508.
- Nagata S, Hanayama R, Kawane K. Autoimmunity and the clearance of dead cells. Cell. 2010;140: 619–630. PMID:20211132.
- Tian T, Wang Y, Wang H, et al. Visualizing of the cellular uptake and intracellular trafficking of exosomes by live-cell microscopy. J Cell Biochem. 2010;111: 488–496. PMID:20533300.
- Lee HD, Kim YH, Kim DS. Exosomes derived from human macrophages suppress endothelial cell migration by controlling integrin trafficking. Eur J Immunol. 2014;44: 1156–1169. PMID:24338844.
- Chiba M, Watanabe N, Watanabe M, et al. Exosomes derived from SW480 colorectal cancer cells promote cell migration in HepG2 hepatocellular cancer cells via the mitogen-activated protein kinase pathway. Int J Oncol. 2016;48:305–312. PMID:26647805.
- Perera RM, Zoncu R. The lysosome as a regulatory hub. Annu Rev Cell Dev Biol. 2016;32: 223–253. PMID:27501449.
- Mony VK, Benjamin S, O’Rourke EJ. A lysosome-centered view of nutrient homeostasis. Autophagy. 2016;12: 619–631. PMID:27050453.
- Fan Y, Lu H, Liang W, et al. Endothelial TFEB (Transcription factor EB) positively regulates postischemic angiogenesis. Circ Res. 2018;122:945–957. PMID:29467198.
- Li Y, Xu M, Ding X, et al. Protein kinase C controls lysosome biogenesis independently of mTORC1. Nat Cell Biol. 2016;18:1065–1077. PMID:27617930.
- Saftig P, Haas A. Turn up the lysosome. Nat Cell Biol. 2016;18: 1025–1027. PMID:27684505.
- Fihn SD, Blankenship JC, Alexander KP, et al. ACC/AHA/AATS/PCNA/SCAI/STS focused update of the guideline for the diagnosis and management of patients with stable ischemic heart disease: a report of the American college of cardiology/american heart association task force on practice guidelines, and the American association for thoracic surgery, preventive cardiovascular nurses association, society for cardiovascular angiography and interventions, and society of thoracic surgeons. Circulation. 2014;130:1749–1767. PMID:25070666.
- Shafei AE, Ali MA, Ghanem HG, et al. Mesenchymal stem cell therapy: A promising cell-based therapy for treatment of myocardial infarction. J Gene Med 2017;19 :e2995.
- Hristov M, Erl W, Linder S, et al. Apoptotic bodies from endothelial cells enhance the number and initiate the differentiation of human endothelial progenitor cells in vitro. Blood. 2004;104: 2761–2766. PMID:15242875.
- Crescitelli R, Lasser C, Szabo TG, et al. Distinct RNA profiles in subpopulations of extracellular vesicles: apoptotic bodies, microvesicles and exosomes. J Extracell Vesicles. 2013;2:20677. PMID:24223256.
- Settembre C, Di Malta C, Polito VA, et al. TFEB links autophagy to lysosomal biogenesis. Science. 2011;332:1429–1433. PMID:21617040.
- Settembre C, Zoncu R, Medina DL, et al. A lysosome-to-nucleus signalling mechanism senses and regulates the lysosome via mTOR and TFEB. Embo J. 2012;31:1095–1108. PMID:22343943.
- Settembre C, De Cegli R, Mansueto G, et al. TFEB controls cellular lipid metabolism through a starvation-induced autoregulatory loop. Nat Cell Biol. 2013;15:647–658. PMID:23604321.
- Steingrimsson E, Tessarollo L, Reid SW, et al. The bHLH-Zip transcription factor Tfeb is essential for placental vascularization. Development. 1998;125: 4607–4616. PMID:9806910.
- Du J, Teng RJ, Guan T, et al. Role of autophagy in angiogenesis in aortic endothelial cells. Am J Physiol Cell Physiol. 2012;302:C383–91. PMID:22031599.
- Nussenzweig SC, Verma S, Finkel T. The role of autophagy in vascular biology. Circ Res. 2015;116: 480–488. PMID:25634971.
- Olsson AK, Dimberg A, Kreuger J, et al. VEGF receptor signalling - in control of vascular function. Nat Rev Mol Cell Biol. 2006;7: 359–371. PMID:16633338.
- Bharath LP, Cho JM, Park SK, et al. Endothelial cell autophagy maintains shear stress-induced nitric oxide generation via glycolysis-dependent purinergic signaling to endothelial nitric oxide synthase. Arterioscler Thromb Vasc Biol. 2017;37:1646–1656. PMID:28684613.
- Papapetropoulos A, Garcia-Cardena G, Madri JA, et al. Nitric oxide production contributes to the angiogenic properties of vascular endothelial growth factor in human endothelial cells. J Clin Invest. 1997;100: 3131–3139. PMID:9399960.
- Lu Q, Yao Y, Hu Z, et al. Angiogenic Factor AGGF1 activates autophagy with an essential role in therapeutic angiogenesis for heart disease. PLoS Biol. 2016;14:e1002529. PMID:27513923.
- Fuchs Y, Steller H. Programmed cell death in animal development and disease. Cell. 2011;147: 742–758. PMID:22078876.
- Bergmann A, Steller H. Apoptosis, stem cells, and tissue regeneration. Sci Signal. 2010;3: re8. PMID:20978240.
- Ryoo HD, Gorenc T, Steller H. Apoptotic cells can induce compensatory cell proliferation through the JNK and the wingless signaling pathways. Dev Cell. 2004;7: 491–501. PMID:15469838.
- Kondo S, Senoo-Matsuda N, Hiromi Y, et al. DRONC coordinates cell death and compensatory proliferation. Mol Cell Biol. 2006;26: 7258–7268. PMID:16980627.
- Li F, Huang Q, Chen J, et al. Apoptotic cells activate the “phoenix rising” pathway to promote wound healing and tissue regeneration. Sci Signal. 2010;3:ra13. PMID:20179271.
- Tseng AS, Adams DS, Qiu D, et al. Apoptosis is required during early stages of tail regeneration in Xenopus laevis. Dev Biol. 2007;301: 62–69. PMID:17150209.
- Pellettieri J, Fitzgerald P, Watanabe S, et al. Cell death and tissue remodeling in planarian regeneration. Dev Biol. 2010;338: 76–85. PMID:19766622.
- Vlaskalin T, Wong CJ, Tsilfidis C. Growth and apoptosis during larval forelimb development and adult forelimb regeneration in the newt (Notophthalmus viridescens). Dev Genes Evol. 2004;214: 423–431. PMID:15322877.
- Martinez MC, Andriantsitohaina R. Microparticles in angiogenesis: therapeutic potential. Circ Res. 2011;109: 110–119. PMID:21700952.
- Yanez-Mo M, Siljander PR, Andreu Z, et al. Biological properties of extracellular vesicles and their physiological functions. J Extracell Vesicles. 2015;4:27066. PMID:25979354.
- Choi DS, Kim DK, Kim YK, et al. Proteomics, transcriptomics and lipidomics of exosomes and ectosomes. Proteomics. 2013;13: 1554–1571. PMID:23401200.
- Witek RP, Yang L, Liu R, et al. Liver cell-derived microparticles activate hedgehog signaling and alter gene expression in hepatic endothelial cells. Gastroenterology. 2009;136:320–30e2. PMID:19013163.
- Eirin A, Riester SM, Zhu XY, et al. MicroRNA and mRNA cargo of extracellular vesicles from porcine adipose tissue-derived mesenchymal stem cells. Gene. 2014;551:55–64. PMID:25158130.
- Han D, Huang W, Li X, et al. Melatonin facilitates adipose-derived mesenchymal stem cells to repair the murine infarcted heart via the SIRT1 signaling pathway. J Pineal Res. 2016;60:178–192. PMID:26607398.
- Song Y, Zhang C, Zhang J, et al. Localized injection of miRNA-21-enriched extracellular vesicles effectively restores cardiac function after myocardial infarction. Theranostics. 2019;9:2346–2360. PMID:31149048.
- Shi HJ, Wang MW, Sun JT, et al. A novel long noncoding RNA FAF inhibits apoptosis via upregulating FGF9 through PI3K/AKT signaling pathway in ischemia-hypoxia cardiomyocytes. J Cell Physiol. 2019;234:21973–21987. PMID:31093967.
- Guo X, Wu X, Han Y, et al. LncRNA MALAT1 protects cardiomyocytes from isoproterenol-induced apoptosis through sponging miR-558 to enhance ULK1-mediated protective autophagy. J Cell Physiol. 2019;234: 10842–10854. PMID:30536615.
- Yan W, Guo Y, Tao L, et al. C1q/tumor necrosis factor-related protein-9 regulates the fate of implanted mesenchymal stem cells and mobilizes their protective effects against ischemic heart injury via multiple novel signaling pathways. Circulation. 2017;136:2162–2177. PMID:28978553.
- Nakaya M, Watari K, Tajima M, et al. Cardiac myofibroblast engulfment of dead cells facilitates recovery after myocardial infarction. J Clin Invest. 2017;127:383–401. PMID:27918308.
- Pan Q, Qin X, Ma S, et al. Myocardial protective effect of extracellular superoxide dismutase gene modified bone marrow mesenchymal stromal cells on infarcted mice hearts. Theranostics. 2014;4:475–486. PMID:24669277.
- Liu Q, Hu T, He L, et al. Genetic targeting of sprouting angiogenesis using Apln-CreER. Nat Commun. 2015;6:6020. PMID:25597280.
- Yu W, Huang X, Tian X, et al. GATA4 regulates Fgf16 to promote heart repair after injury. Development. 2016;143:936–949. PMID:26893347.
- Gao E, Lei YH, Shang X, et al. A novel and efficient model of coronary artery ligation and myocardial infarction in the mouse. Circ Res. 2010;107:1445–1453. PMID:20966393.