
ABSTRACT
Almost a billion people worldwide are chronically undernourished. Herein, using a mouse model of coxsackievirus B3 (CVB3) infection, we report that a single day of food restriction (FR) markedly increases susceptibility to attenuated enterovirus infection, replication, and disease. These “pro-viral” effects, which are rapidly-reversed by the restoration of food, are mediated by several genes whose expression is altered by FR, and which support CVB3 replication. Central to this is TFEB, a protein whose expression and activation status are rapidly increased by FR. TFEB, which regulates the transcription of >100 genes involved in macroautophagy/autophagy and lysosomal biogenesis, responds similarly to both FR and CVB3 infection and plays a pivotal role in determining host susceptibility to CVB3. We propose that, by upregulating TFEB, FR generates an intracellular environment that is more hospitable to the incoming virus, facilitating its replication. This interplay between nutritional status and enterovirus replication has implications for human health and, perhaps, for the evolution of these viruses.
Abbreviations: Atg/ATG: autophagy-related; CAR: Coxsackievirus and adenovirus receptor; Cas9: CRISPR associated protein 9; Cre: recombinase that causes recombination; CRISPR: clustered regularly interspaced short palindromic repeats; Ctsb/CTSB: cathepsin B; CVB3: coxsackievirus B3; DsRedCVB3: a recombinant CVB3 that encodes the Discosoma red fluorescent protein; EL: elastase; FR: food restriction; GFP: green fluorescent protein; gRNA: guide RNA; HBSS: Hanks Buffered Salt Solution; LYNUS: lysosomal nutrient sensing machinery; MAP1LC3/LC3: microtubule-associated protein 1 light chain 3; MFI: mean fluorescence intensity; MOI: multiplicity of infection; MTOR: mechanistic target of rapamycin kinase; Nluc: nanoluciferase; NlucCVB3: a recombinant CVB3 encoding nanoluciferase; pfu: plaque-forming unit(s); p.i.: post infection; rCVB: recombinant coxsackievirus B3; RPS6KB/p70S6K: ribosomal protein S6 kinase; RT: room temperature; siRNA: small interfering RNA; TFEB: transcription factor EB; tg: transgenic; TUBB: β-tubulin; UNINF: uninfected; wrt: with respect to; WT: wild type.
Introduction
Most studies of viral pathogenicity focus on virulent isolates, which cause acute disease. Many virulent human pathogens derive from zoonoses, in which they are introduced to humans from other species. In some cases, the viruses cause little or no disease in the original host. For example, the rodent Mastomys natalensis appears healthy when infected by Lassa virus, but the infection in humans is often lethal. In other cases, the source species, too, may be ill; influenza pandemics are initiated by the introduction, into humans, of variants that have arisen in other species, e.g. avian or suidian, in which they frequently cause disease. Still other viruses (e.g., Dengue virus) require passage in, and inoculation by, insect vectors. However, some human pathogens have no other known animal reservoir, and their continued existence requires that they persist in the human population, often as a swarm of low-pathogenicity, attenuated, variants. These include the human enteroviruses such as poliovirus and coxsackievirus. Enteroviral infections are extremely common in childhood; a recent study of 113 apparently-healthy children found that, over a 28 month period, more than half of them became infected [Citation1]. For these agents, lower-virulence viruses are the sole source of pathogenic variants. Moreover, an enterovirus’ pathogenic potential can not only increase, but also can evolve in terms of organ tropism. Enterovirus D68, a virus that previously was associated mainly with respiratory disease, is thought to be the cause of acute flaccid myelitis, a poliomyelitis-like syndrome that is becoming increasingly common [Citation2–4]. Thus, it is particularly important to identify factors – including environmental factors – that can increase the replication and/or virulence of attenuated enteroviruses, potentially increasing the likelihood that a pathogenic variant will emerge.
Type B coxsackieviruses (CVBs) are members of the Picornaviridae family and enterovirus genus, and, as such, are closely related to polioviruses. CVB are important human pathogens that often induce severe acute and chronic diseases and cause morbidity and mortality [Citation5,Citation6]. CVBs are the most common cause of infectious myocarditis [Citation7,Citation8], and frequently trigger pancreatitis and aseptic meningitis [Citation9–12]. Working with coxsackievirus type B3 (CVB3) mouse models, we have previously shown that the provision of certain host proteins in excess amounts can substantially increase the virulence of attenuated CVBs in the pancreas. Those studies focused on autophagy-related proteins because several laboratories, including our own, had demonstrated that CVB3 benefits from an active autophagy pathway [Citation13–23]. We also reported that CVB3 replication and pathogenesis were partially compromised in conditionally-deleted mice whose pancreatic acinar cells lacked ATG5 (autophagy related 5), confirming an in vivo role for autophagy [Citation19]. In the present study, we sought to determine if the virulence of an attenuated CVB3 could be modulated by an environmental change that is known to upregulate autophagy, and is – unfortunately – extremely common: undernourishment. Almost a billion people worldwide are undernourished, and more than half of all deaths in children under 5 are attributable to a combination of undernourishment and infection [Citation24]. Indeed, over the past 3 years, the World Health Organization and the United Nations International Children’s Emergency Fund have reported the reemergence of several infectious diseases (measles, cholera and polio) in countries affected by famine [Citation25–27]. A relationship between infection and nutrient status was first highlighted in the 1950s and 1960s, when several studies demonstrated that RNA viruses, including measles, mumps, and rubella, caused much more serious diseases in malnourished children reviewed [Citation28]. These epidemiological data prompted a study of mice that had been underfed for many weeks, causing them to develop marasmus (malnutrition resulting in severe weight loss). Following infection with CVB3, 2 interesting observations were made [Citation29]. First, the marasmic mice had higher virus titers in several tissues, more severe histological lesions, and increased mortality; and, second, this increased susceptibility to CVB3 was significantly mitigated if food was restored at the time of infection. The latter observation suggests the existence of a rapidly-responsive “switch”, triggered by feeding, that almost immediately reduces the marasmus-induced host sensitivity to CVB3 infection. We considered it important to better characterize this switch. Might it also be rapidly-responsive in the opposite direction, rendering mice susceptible to CVB3 after a very brief period of food restriction (as distinct from the long-term starvation in the published work)? And by what mechanism(s) does feeding status (food restriction or food ingestion) so quickly alter host susceptibility to this enterovirus?
Here, for the first time we show the existence of a food-regulated switch that very quickly increases host susceptibility to enteroviral infection; we confirm that this switch resets within hours after food has been supplied, beginning to restore host resistance; and we identify one likely fulcrum upon which the switch is balanced: the transcriptional activator protein TFEB (transcription factor EB), which is the master regulator of gene expression in both the autophagy and the lysosomal biogenesis pathways.
Results
Food restriction and restoration quickly modulate productive CVB3 infection
We began by evaluating, in C57BL/6 mice, the effect of a brief period of food restriction (FR) on titers of rCVB3 in several tissues. Six different feeding regimens were compared (): in this and subsequent figures, the black or white blocks represent, respectively, a 24-h period with free access to food, or a 24-h period of FR (water was provided ad libitum). In all cases, the effect on virus titers was determined at 48 h post infection (p.i.). The results are displayed in panel B. When compared to infection of normal-fed mice (regimen 1, black bars), DsRedCVB3 infection of mice that did not have access to food during the 48 h of infection (regimen 2, orange bars) led to a substantial (47-fold) increase in rCVB3 titers in the pancreas, and to lesser increases in liver (~28-fold) and heart (~3-fold). Next, we determined the impact of a slightly different regimen, in which mice were FR for 24 h before infection, and for the subsequent 24 h (periods of FR >48 h were not evaluated, because they were forbidden by animal welfare guidelines). This regimen (regimen 3, blue bars) resulted in an even greater increase in viral titers in the pancreas (72-fold) and liver (32-fold) and both were highly statistically-significant (p ≤ 0.0001). The data from regimens 2 and 3 demonstrate that the effect reported by others [Citation29] in chronically-malnourished mice – increased coxsackieviral titers – can be recapitulated by short-term fasting. To determine if a longer period of FR prior to virus infection might provide additional benefit to a recombinant virus, a fourth feeding regimen was evaluated, in which C57BL/6 mice were infected with DsRedCVB3 after 48h of food restriction (, regimen 4, red bars). This longer period of FR prior to infection did not further increase virus yield. Instead, although replication of an attenuated virus was still significantly higher than in normal-fed mice, it was markedly lower than under regimens 2 or 3. When food was restored after only 24 h of FR (regimen 5, green bars) a similar outcome was observed. The data from regimens 4 & 5 suggested the possibility that the restoration of food at the time of infection had blunted (but not eradicated) the “pro-viral” impact of FR so, lastly, we determined how rapidly the pro-viral impact of FR was lost. Mice were FR for 24 h, then food was restored. 24 h later, the mice were infected, and tissues were harvested 48 h later (regimen 6, cyan bars). Under those circumstances, viral titers in pancreas, liver and heart were very similar to those observed in normal-fed animals, and in all cases were significantly lower than in other groups. In summary, the absence of food before and/or during infection (regimens 2–5) rapidly renders mice more susceptible to an attenuated virus. Moreover, restoration of food at the time of, or 24 h prior to, infection (regimens 4–6) very quickly reduces susceptibility, with the latter returning it to a normal level. For practical reasons we considered it desirable to focus on just one of the FR regimens our subsequent studies, and we selected regimen 3 because it showed the most statistically-significant effect compared to normal-fed animals. Since all of the data in were derived using a single rCVB3 (DsRedCVB3), we first ensured that the effect of FR was not specific to that virus. Using standard methods that we developed [Citation30], we generated a novel recombinant CVB3 encoding nanoluciferase (NlucCVB3). The growth kinetics of this virus, and the validation of luciferase activity as a surrogate measure of virus replication, are shown in Fig. S1. Normal-fed (regimen 1) mice and FR mice (regimen 3) were infected with this virus (107 plaque-forming units [pfu] per mouse) and, 48 h later, tissues were harvested and both virus titers and luciferase activity were measured. As shown in (left panel), virus titers in FR mice were significantly increased in all 3 organs analyzed; moreover, the luciferase activities (right panel) closely paralleled the titers. Finally, we determined whether or not the effect of FR could be demonstrated in cells that already contained elements that were beneficial to rCVB3 infection. As explained in the Introduction, we have reported that GFP-Lc3 transgenic mice are more susceptible to rCVB3 infection, so we determined the impact of FR in this mouse strain. As expected, in normal-fed GFP-Lc3 mice the titers of rCVB3 in pancreas and liver (, black bars) were higher (~4-fold) than those observed in normal-fed C57BL/6 mice (black bars in panel B). Of greater interest to the present study, FR significantly raised the rCVB3 yields in GFP-Lc3 mice in pancreas and liver (, compare blue bars to black bars), indicating that FR could exert additional pro-viral effects in the presence of excess LC3. However, virus yields were similar in the pancreata and livers of FR mice regardless of their Lc3 genetic status (compare blue bars in ), indicating that the effects of FR supersede those of excess LC3 protein.
Figure 1. Food-restriction and restoration quickly modulate productive CVB3 infection. (A) Groups of C57BL/6 mice were maintained under one of the six indicated feeding regimens (numbered 1–6, descriptions are color-coded to coincide with the bars in the graphs below). A black rectangle represents a 24-h period with free access to food, and a white rectangle represents a 24-h period of FR. Mice from each of the 6 feeding groups were inoculated (red arrow) with 107 pfu of DsRedCVB3 i.p. and were sacrificed 2 d later (green arrow). (B) Virus titers in the pancreas, liver, and heart were determined by plaque assay and are displayed (pfu/gram of tissue, mean + SEM) as color-coded bars. (C) C57BL/6 mice were maintained under one of the 2 indicated feeding regimens (numbers 1 & 3, descriptions color-coded as previously). At the indicated time (red arrow), the mice were inoculated i.p. with 107 pfu of NlucCVB3. Mice were sacrificed at day 2 p.i., and virus titers in pancreas, liver and heart were determined by plaque assay and are displayed (mean + SEM) as a black bar (regimen 1) or a blue bar (regimen 3). Luciferase activity in tissue lysates are also shown. (D) GFP-Lc3 mice (Tg/+) were placed under the same 2 feeding regimens shown in panel C. Both groups of mice were inoculated i.p. with 107 pfu of DsRedCVB3, and were sacrificed at day 2 p.i. Virus titers in pancreas and liver were determined by plaque assay, and are displayed (mean + SEM) as a black bar (regimen 1) or a blue bar (regimen 3). The numeral at the base of each bar indicates the numbers of mice in that group. For all relevant panels, p values are represented by asterisks, and are shown as follows: *0.05 ≥ p > 0.01; **0.01 ≥ p > 0.001; ***0.001 ≥ p > 0.0001; ****p ≤ 0.0001
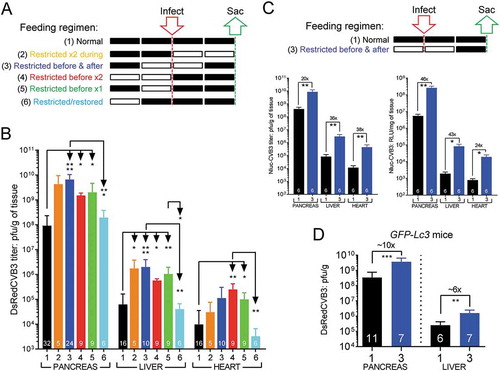
In summary, for rCVB3s, short-term food restriction results in statistically-significant increases in titer in vivo, which is rapidly-reversible by restoration of food before, or at the time of, infection.
Food restriction leads to increased viral RNA levels and accelerated pathology
We next determined if the increased titers of attenuated virus in FR mice could be explained by increased RNA replication (as distinct from for example, identical replication, but enhanced virion egress). RNA was harvested from the pancreata of the normal-fed and FR mice shown in , and the amounts of viral genomic RNA were determined by quantitative PCR (qPCR). As shown in , the genome quantities in FR mice (blue circles) were greatly elevated compared to those in normal-fed animals (black circles), consistent with the notion that viral RNA replication is more efficient in FR cells. Moreover, when these viral RNA levels were compared with virus titers for each individual mouse, there was a strong correlation between genome content and infectious titer, with an average ratio of ~2000 genomes per infectious unit, similar to what we have previously reported [Citation19]. Notably, the ratio of genomes to infectious viruses was not significantly affected by FR, suggesting that the pro-viral effect of FR cannot be attributed to enhanced viral packaging/egress.
Figure 2. Food restriction leads to increased viral RNA levels and accelerated pathology. (A) DsRedCVB3 infectious virus titer (y-axis) was compared to genome RNA copy numbers (x-axis) in the pancreata of C57BL/6 mice; this was done for normal-fed mice and mice fed under regimen 3. Each symbol represents a single mouse and is color-coded (black or blue) to show the mouse’s food regimen. The body weights (B) and blood glucose levels (C) of the mice are shown (wrt = with respect to) (mean ± SEM). C57BL/6 mice fed under regimen 1 are presented in black squares and lines, and regimen 3 mice are shown as blue circles and lines. The empty and solid blocks above panels B and C represent only regimen 3 which is extrapolated to the blue lines. (D) Histological sections (Masson’s trichrome stain) of pancreata from representative mice for each feeding regimen. Left column, regimen 1 (normal fed); right column, regimen 3 (food-restricted). Top row images are from uninfected mice; those in the bottom row are from mice infected with DsRedCVB3. (E) Serum amylase levels are shown. For all relevant panels, p values are represented by asterisks, and are shown as follows: *0.05 ≥ p > 0.01; **0.01 ≥ p > 0.001; ***0.001 ≥ p > 0.0001; ****p ≤ 0.0001
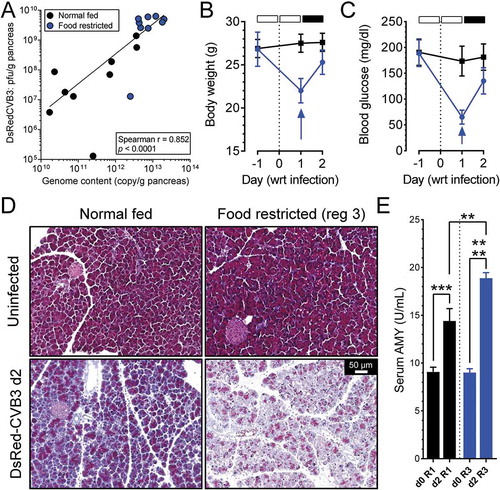
The increased viral replication in FR mice correlated with increased pathology. Normal-fed mice showed no loss in body weight in the 2 d following DsRedCVB3 infection, nor showed any significant fluctuation in blood glucose (black lines in ). FR mice showed a rapid reduction in both criteria, but this may have resulted solely from the FR, because both measures quickly began to recover when food was restored during the infection (food restoration indicated by blue arrows). However, a clear increase of virus-induced pathology in FR mice was observed in the pancreas. At 2 d after DsRedCVB3 infection (, bottom row), pancreatic acinar cells in infected normal-fed mice showed mild hypochromicity (reduced intensity of staining of cytosolic protein) and the tissues showed very mild inflammation, but both of these pathological changes were markedly increased in their FR counterparts. These histopathological results were supported by measurement of serum AMY (amylase), a marker of acinar cell death (). FR alone (in the absence of infection; d0 bars on the graph) did not increase serum AMY, but it was – as expected – elevated 2 d after CVB3 infection; notably, the mean AMY level in infected mice was significantly higher in the FR animals.
What might underpin the rapid food-dependent changes in viral replication and pathogenesis? FR has a profound impact on many body systems, and we felt it unlikely that a single molecular event, or even a single biological pathway, could explain the increased viral replication and disease. For this reason, we chose to investigate how the disruption of various inter-related biological pathways impacted the “pro-viral” effects of FR.
The pro-viral effect of FR requires intact autophagy and lysosomal pathways
We [Citation17–19,Citation23] and others [Citation13,Citation14,Citation20–22] have demonstrated, in tissue culture and in vivo, a direct association between increased autophagic flux and coxsackievirus replication/pathogenesis. Indeed, even short-term (24–48 h) food restriction causes increased autophagic activity [Citation31], and thus we hypothesized that the pro-viral effect of food restriction might be mediated, at least in part, by activation of the autophagy pathway. First, we evaluated the effect of FR on pancreatic autophagy using GFP-Lc3Tg/+ mice [Citation32]. Uninfected mice were either normal-fed, or FR for 24 h (i.e., to the point at which they would be infected under regimen 3). This short period of FR led to the upregulation of autophagy in uninfected pancreata, as evidenced by the increased abundance of green puncta, representative images of which are shown in ; the numbers of puncta in the four panels bearing Roman numerals were counted, and the data are displayed in Fig. S2. The increase in overall green signal in panel (ii) can be attributed to the accumulation of free GFP, which results from the cleavage of GFP-LC3 during autophagy flux [Citation33,Citation34]. Next, we evaluated GFP-LC3 signal in mice that had been infected, 48 h previously, with DsRedCVB3 (, four right panels). The pancreata of normal-fed infected mice contained readily-detectable virus-encoded DsRed, and autophagy-related puncta [panel (iii)] were more abundant than in the uninfected animals, as we have previously reported [Citation17]. In the FR littermates, the DsRed fluorescent signal was markedly increased, consistent with the higher virus titers that had been observed (, blue bars). Moreover, there was an accompanying increase in the abundance of GFP-LC3 puncta [panel (iv)]. Analyses of p-RPS6KB/p70S6K:RPS6KB and LC3-II:LC3-I ratios confirmed that CVB3 infection alone activates autophagy, as we have previously reported, and also demonstrated the similar effects of FR and rCVB3 infection on autophagy (Fig. S3).
Figure 3. The pro-viral effect of FR requires intact autophagy and lysosomal pathway. (A) GFP-Lc3Tg/+ mice were normal-fed (regimen 1) or food-restricted (regimen 3). The two left panels are pancreata from uninfected mice, and the four right-hand panels are from mice that had been inoculated with 107 pfu DsRedCVB3 2 d previously. ~70 µm vibratome sections of pancreata were prepared, and counterstained using Hoechst 33342 stain (blue) before being imaged by confocal microscopy. GFP-LC3 haze or puncta are green, and the DsRed protein (representing viral infection) is in red. The four panels showing green signal (GFP-LC3) are labeled with Roman numerals, and the numbers of puncta in these panels are quantified in Figure S2. (B-D) EL-Cre/Atg5f/f mice were fed under regimens 1 or 3, inoculated i.p. with 107 pfu of DsRedCVB3, and sacrificed at day 2 p.i. The body weights (B) and blood glucose levels (C) of age- and gender-matched EL-Cre/Atg5f/f mice are shown (mean ± SEM). Mice undergoing regimen 1 are presented in black squares and lines, and regimen 3 mice are presented as blue circles and lines. The empty and solid blocks in panels B and C represent only regimen 3, and extrapolate to the blue lines. (D) Virus titers were determined in the pancreata of the EL-Cre/Atg5f/f mice, and are displayed (mean + SEM) as a black bar (normal fed mice) or a blue bar (FR mice). The number in each column indicates the number of mice analyzed. (E) C57BL/6 and ctsb KO mice were normal fed (regimen 1, black bars) or fed under regimen 3 (blue bars), and were inoculated i.p. with 107 pfu of DsRedCVB3. The mice were sacrificed at day 2 p.i., and virus titers in pancreas, liver and heart were determined by plaque assay (mean + SEM)
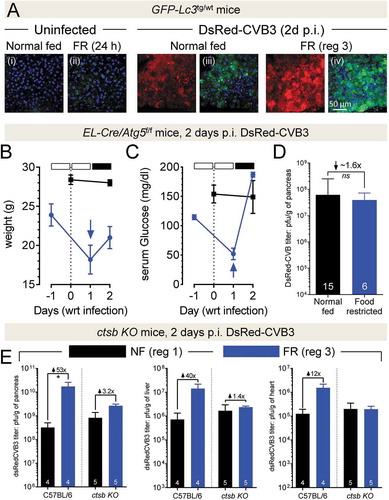
To determine if the FR-driven increase in rCVB3 titer was dependent upon autophagy, we used EL-Cre/Atg5f/f mice, which are compromised in their ability to support CVB3 replication [Citation19]. Although these mice showed the expected responses to regimen 3 FR (transient drops in body weight and blood glucose (), there was no significant difference in DsRedCVB3 titers between normal fed and FR animals () and, consistent with this, the effect of FR on histological changes in the pancreas was somewhat limited in the EL-Cre/Atg5f/f mice (Fig. S4). Thus, the pro-viral effect of FR requires an intact autophagy pathway, consistent with the hypothesis that FR upregulates autophagy in normal mice and that this contributes to the observed enhancement of viral replication and pathogenesis.
The autophagy pathway ultimately intersects with the endolysosomal pathway, and the maturation of some enteroviruses is reduced by compounds that inhibit the acidification of vesicles in this pathway [Citation35]. For these reasons, we next evaluated if the autophagy-dependent pro-viral effect of FR required that lysosomes be fully functional. We chose to use an in vivo model in which one facet of normal lysosomal activity had been disrupted, without affecting mouse viability. We selected Ctsb knockout (Ctsb KO) mice, which lack CTSB (cathepsin B), a lysosomal cysteine protease that is vital to normal acinar cell function, as it cleaves trypsinogen [thereby producing proteolytically-active trypsin; Citation36]. The phenotype of these mice was confirmed using 2 criteria; (i) the lack of trypsin activity resulting from the absence of CTSB, and (ii) the presence of DAB-2 inducer of autophagy, a protein that is normally degraded by CTSB (see Fig. S5). FR (regimen 3) Ctsb KO and C57BL/6 mice were infected with DsRedCVB3. The outcome in C57BL/6 mice () was very similar to that reported in ; pancreatic, hepatic and cardiac titers in FR mice were markedly higher than in normal-fed animals. However, the effect of FR was substantially blunted in all 3 organs in the Ctsb KO mice (); hepatic and cardiac viral titers in these mice were almost unaffected by FR, and although a small (~3-fold) increase was observed in the pancreas, this was not statistically-significant. We also compared the viral titers in the two groups of FR mice (i.e., C57BL/6 vs Ctsb KO) and found that they did not reach statistical significance. Therefore, the pro-viral impact of FR is largely mitigated by a non-lethal disruption of lysosomal function.
Numerous pancreatic mRNAs are modulated by FR, and their downregulation by siRNAs curtails CVB3 replication
The foregoing data show that 24 h of FR renders mice more vulnerable to rCVB3 infection, and that this effect requires intact autophagy and lysosomal pathways. To identify genes whose expression was changed by 24 h of FR, pancreata were harvested from normal-fed mice and from 24 h FR mice (all C57BL/6), and pancreatic RNA was isolated. This RNA was evaluated using two PCR arrays, one autophagy-directed and the other related to MTOR (mechanistic target of rapamycin kinase), a central regulator of a cell’s nutrient status. After normalization to housekeeping genes, this analysis revealed 14 autophagy-related transcripts that were significantly upregulated in FR mice (, left); none were significantly downregulated. Eight MTOR-related transcripts were significantly increased in these FR animals, and 3 were decreased (, right). We next wished to determine if these FR-responsive mRNAs had an effect on CVB3 replication, and to this end we exploited our new Nluc recombinant CVB3. Using the luciferase readout in tissue culture cells, all but one of the siRNAs tested reduced CVB3 protein levels at 24 h p.i. In all cases the data were highly-reproducible, and statistically-significant, although the absolute decreases were relatively slight (~2- to 3-fold, , left), and none of the host-directed siRNAs were as effective as the positive control siRNA targeted to 3DPol, which encodes the viral polymerase, and which has been shown by others to effectively suppress CVB replication [Citation37]. Lastly, we applied the Nluc assay to determine how viral replication was affected by suppressing the levels of various integral lysosomal membrane proteins. We focused on lysosomal proteins for four reasons. First, the Ctsb KO data () show that the pro-viral effect of FR required intact lysosomal function. Second, lysosomes are the destination of the autophagy conveyor belt, and we show above that autophagy is intimately involved in the interplay between FR and CVB3 infection. Third, the biological activity of MTOR is intimately associated with lysosomal membranes. Fourth, recent studies have overturned the long-held idea that lysosomes are merely cellular trash cans; it is now clear that they also act as a hub to coordinate the cell’s responses to a variety of stressors, including starvation [Citation38,Citation39]. Thus, we considered it possible that lysosomes might represent the nexus that links food restriction, autophagy-MTOR and CVB3 replication. We tested this hypothesis by using siRNAs that should disrupt the ability of lysosomes to sense, or to respond to, changes in nutrient status.
Figure 4. Numerous pancreatic mRNAs are modulated by FR, and their downregulation by siRNAs curtails CVB3 replication. C57BL/6 mice were food-restricted for 24 h, at which time (A) the pancreatic expression of autophagy-related MTOR pathway genes were quantified by PCR array as described in Materials and Methods. The data are presented as fold-changes compared to normal-fed mice (normal fed n = 3, 24 h of FR n = 3). (B) To determine the effect of several of the identified host genes on CVB3 infection, HeLa cells were transfected for 48 h with the indicated siRNAs, prior to being infected with Nluc-CVB3 (MOI = 10) for 24 h. siRNAs also were targeted to various genes related to the lysosomal sensing machinery. The impact of the siRNAs on viral replication was assessed by quantifying nanoluciferase released into the supernatant (presented as a percent of the control non-targeting siRNA) (mean + SEM)
Lysosomal nutrient sensing, and the responses that it generates, are dependent upon a number of proteins that, together, form the lysosomal nutrient sensing machinery (LYNUS) [Citation40]. The LYNUS sensory proteins monitor the status of intracellular nutrients such as oxygen, amino acids, glucose, and ATP [Citation41], and transmit their signals to the LYNUS effector apparatus, comprising a multi-protein assembly known as MTOR complex 1 (MTORC1) and accessory proteins. MTORC1, which is named for its key component, MTOR, is positioned at the lysosomal membrane when nutrients are plentiful; nutrient restriction triggers various lysosomal sensors, inhibiting MTORC1 activity and thereby allowing the cell to upregulate autophagy and to mobilize its energy stores. Thus, we used siRNAs to disrupt the activity of six mRNAs encoding selected lysosomal sensor and effector proteins, and determined the impact on CVB3 replication (, right). All 6 of the lysosome-targeted siRNAs significantly diminished luciferase release. Thus, our data identify FR-responding genes in 3 inter-related pathways – autophagy, MTOR, and lysosomal biogenesis – whose activities appear to support CVB3 replication.
The foregoing data indicate that the rapid pro-viral effect of FR requires that both autophagy and lysosomal function be intact. In that regard, we found it intriguing that the siRNA targeted to the transcriptional activator TFEB was one of the most effective at reducing CVB3 replication (, left), because that protein is a master regulator of the response to nutrient depletion; under starvation conditions, TFEB upregulates the transcription of more than 100 genes that participate in the lysosomal and autophagy pathways. When nutrients are plentiful, cytoplasmic TFEB is phosphorylated by a variety of kinases and the resulting phosphoprotein, p-TFEB, is retained in the cytosol. When nutrients become scarce, p-TFEB is dephosphorylated, and the resulting TFEB protein is translocated to the nucleus, where it upregulates the aforementioned autophagy and lysosome-related genes. In addition, nuclear TFEB upregulates its own gene [Citation42], leading to abundant TFEB translation in the cytosol and, if the cell remains nutrient-depleted, most of this newly-translated protein does not undergo phosphorylation, and is quickly cycled back into the nucleus, further driving autophagy and lysosomal biogenesis. This positive feedback loop, rapidly evoked by starvation, is equally-quickly suppressed by nutrient restoration [Citation43]. Thus, TFEB/p-TFEB together represent a switch that orchestrates the coordinate up- and downregulation of two interdependent cellular processes, autophagy and lysosomal function [Citation42,Citation44] and this TFEB-controlled axis was, therefore, an attractive candidate to explain the rapid food-driven modulation of host sensitivity to CVB3.
For this reason, our subsequent experiments focused on this protein. Before proceeding further, we considered it important to ensure that the TFEB-targeted siRNA effectively and specifically reduced TFEB protein levels; if this did not happen, it would suggest that the anti-CVB3 effect that we observed in might be an off-target phenomenon. As shown in Fig. S6, both TFEB and p-TFEB were identified in the two control samples (no siRNA & irrelevant siRNA), while the TFEB-specific siRNA rendered both of the proteins undetectable; the specificity of the TFEB siRNA was confirmed by the absence of any effect on the GAPDH protein.
Nutrient depletion and CVB3 infection trigger similar changes in TFEB abundance and nuclear localization
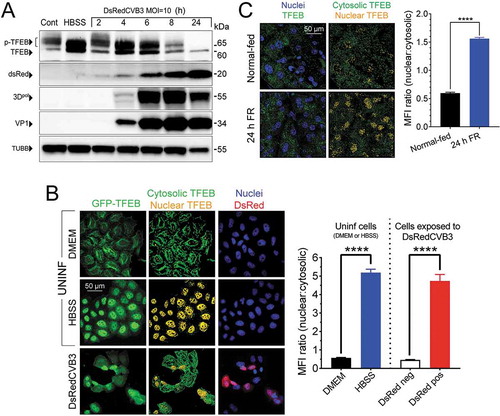
We next compared the impact of (i) nutrient depletion and (ii) virus infection on TFEB abundance and activation state (). Control HeLa cells (in complete medium; Cont) contained mainly p-TFEB and, as expected, a 6 h period of nutrient starvation (cells in Hanks Buffered Salt Solution, HBSS) led to a dramatic shift toward the de-phosphorylated protein. This was accompanied by activation of autophagy (see Fig. S7). The subcellular location of TFEB was determined by confocal analysis of HeLa cells that express a GFP-tagged TFEB [Citation45], using the Cell component of Imaris software to quantify the mean fluorescence intensities (MFIs) of cytosolic and nuclear p-TFEB/TFEB. First, we compared normal-fed cells (grown in cDMEM) and starved cells (grown in HBSS). As shown in (top row), in cells maintained in cDMEM, the great majority of GFP-TFEB was cytosolic (center column, green). In contrast, after 6 h in HBSS, cytosolic GFP-TFEB is less abundant and most of the TFEB is nuclear (shown as yellow), reflecting the translocation of the dephosphorylated protein; as shown in the related column graph, the nuclear/cytosolic ratio of TFEB MFI shifts dramatically (~10-fold) as a result of FR. Strikingly, CVB3 infection of normal-fed cells recapitulated both of the features observed in nutrient depletion. First, there was a dramatic transition from p-TFEB to TFEB as early as 2 h p.i., at which time virus-encoded proteins (DsRed, 3Dpol and VP1) were barely-detectable (). This transition to TFEB was paralleled by increased autophagic activity (see Fig. S7). Second, CVB3 infection also triggered TFEB nuclear translocation (, bottom row). After incubation with DsRedCVB3 for 4 h at MOI = 10, many GFP-TFEB HeLa cells were actively infected, as indicated by DsRed expression, but Hoechst staining also identified some uninfected cells (, bottom right image). This allowed us to determine if the distribution of GFP-TFEB differed depending on infection status. As shown in the bottom-center image, GFP-TFEB (green) was distributed throughout the cytosol of the uninfected cells, and almost no nuclear localization was visible. Conversely, the nuclei of the infected GFP-TFEB cells were bright yellow. The shift in the nuclear/cytosolic ratio of TFEB MFI in DsRedCVB3-infected cells is similar to that observed following FR (i.e., ~10-fold).
Figure 5. Nutrient depletion and CVB3 infection trigger similar changes in TFEB abundance and nuclear localization. (A) As a positive control for TFEB activation, uninfected HeLa cells were cultured for 6 h either with cDMEM (Cont), or under amino acid and serum starvation conditions (HBSS media, leading to the dephosphorylation of TFEB), and protein lysates were evaluated by western blot (left two lanes). The remaining 5 lanes show western blot analyses of protein lysates from HeLa cells harvested at the indicated time points following infection with DsRedCVB3 (MOI = 10). All samples were probed with antibodies to TFEB, virus-encoded DsRed, viral proteins VP1 or 3DPol, or TUBB/β-tubulin. (B) Top and middle rows of images: GFP-TFEB HeLa cells were incubated in DMEM or HBSS media for 6 h, then were fixed. The bottom row of images: GFP-TFEB cells were incubated with DsRedCVB3 (MOI = 10, red), and 4 h later the cells were fixed. For all samples, nuclei were counterstained using Hoechst 33342 (blue). The cells then were imaged by confocal microscopy. The MFIs of cytosolic and nuclear TFEB were determined using the Cell function of Imaris software, and the MFI ratios of nuclear (yellow) to cytosolic (green) TFEB are presented in the adjacent column graph. (C) Mice were normal-fed (top row) or were FR for 24 h (bottom row) then were sacrificed. Pancreata were harvested and vibratome sections were prepared and stained for TFEB (using an antibody) and nuclei (Hoechst), then were imaged using confocal microscopy. Left panels show all TFEB (green) and nuclei (blue). Right panels distinguish between cytosolic TFEB (green) and nuclear TFEB (yellow). Data were quantified using the Spot function of Imaris software, and the MFI ratios of nuclear to cytosolic TFEB are displayed in the column graph
Finally, TFEB redistribution also occurs following food restriction in vivo. Using confocal microscopy, the subcellular distribution of TFEB was compared in the pancreata of normal-fed mice and mice that had been FR for 24 h (the time point at which mice would be infected under regimen 3). Compared to normal-fed mice, the MFI of nuclear TFEB in acinar cells was dramatically increased (~3-fold, measured using Imaris software as described) after 24 h of FR (). In summary, the data in indicate that the changes in the intracellular environment that are induced by a relatively brief period of nutrient depletion are strikingly similar to those that occur within 1–2 h of CVB infection under normal nutritional conditions. Thus, FR and rCVB3 have very similar effects on TFEB. We propose that prior FR enhances rCVB3 infection because it alters the intracellular environment in a way that suits the incoming enterovirus; in effect, FR pre-fabricates the virus’ preferred platform, facilitating its accelerated replication.
Pharmacological activation of TFEB modestly but significantly enhances CVB3 replication, and the effect requires ATG5
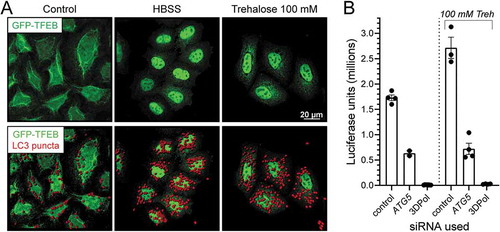
Since FR affects multiple cellular pathways, we investigated whether or not pharmacological activation of TFEB might have a similar pro-viral effect in tissue culture. GFP-TFEB cells were incubated with the disaccharide trehalose, an MTOR-independent autophagy enhancer [Citation46] that diminishes the phosphorylation of cytosolic TFEB [Citation47,Citation48]. As shown in , and as expected, both cell starvation (HBSS, center column) and 100 mM trehalose (right column) promoted TFEB translocation to the nucleus. In parallel, we stained the cells with an LC3-specific antibody and visualized the LC3 puncta using the Spot option from IMARIS. The increased numbers of puncta in HBSS-maintained cells reflect the increase in autophagic activity that results from nutrient restriction, and the pharmacological activator trehalose has a similar effect. Next, HeLa cells were grown without or with 100 mM trehalose, and were treated with one of three different siRNAs: (i) control; (ii) anti-Atg5; or (iii) anti-3DPol. The cells then were infected with Nluc-CVB3 virus, and 24 h later, luciferase was quantitated. The results are shown in . At least two conclusions can be drawn. First, the inclusion of trehalose increases CVB3 replication, providing a second line of evidence that TFEB activation is beneficial to the virus. Second, this trehalose-triggered pro-viral effect is abrogated if an Atg5-targeted inhibitory siRNA is present; this parallels the observations in , which showed that disruption of autophagy blunts the effect of FR.
Figure 6. Pharmacological activation of TFEB modestly but significantly enhances CVB3 replication, and the effect requires ATG. (A) GFP-TFEB HeLa cells on coverslips were maintained in cDMEM (control), HBSS, or cDMEM, including trehalose at 100 mM. After 24 h, cells were fixed and immunostained with rabbit LC3 antibody. Confocal images were acquired and LC3 puncta (red) were highlighted using the Spot function in Imaris. (B) Hela cells were transfected with the different siRNAs (nontarget control, ATG5 and 3Dpol) at 50 nM and 24 h later, treated with or without trehalose (Sigma-Aldrich, T9449) 100 mM for 24 h and then were infected with NlucCVB3 at MOI = 0.1 for 24 h. Viral replication was measured using a luciferase assay. ANOVA showed that statistically-significant differences (*** or ****) applied when any column was compared to any other column, with two exceptions: the two ATG5 columns, and the two 3DPol columns, were not significantly different
Deletion of TFEB negatively affects CVB3 infection
Finally, having demonstrated that (i) siRNA inhibition of TFEB had a negative impact on CVB3 replication () and (ii) that FR and pharmacological TFEB activation had a positive impact (), we evaluated the effect of genetic deletion of this important transactivator protein. The CRISPR-Cas9 technique was applied to HeLa cells to generate two clones, one that was deficient in TFEB protein expression (Fig. S8A, KO), and a second, TFEB-intact, clone that was used as a control (Fig. S8A, [+]). Both cell populations were infected with DsRedCVB3 and, at the indicated time points, both cells and supernatants were harvested and were assayed for infectious viral titer (). Three points emerged from these experiments. First, for both cell types, cell-associated titers exceeded those in the supernatant; this is as expected for CVB3. Second, titers in the TFEB KO populations were markedly lower than in the TFEB-intact counterparts, confirming that TFEB does play a supporting role during CVB3 infection. Third, the impact of TFEB was very similar (~17-fold) for both cell-associated and supernatant virus, suggesting that – as we previously concluded for FR in vivo () – the pro-viral effect of TFEB is unlikely to involve viral egress. Genome copy numbers, too, were lower in the TFEB KO cells, but over the course of the infection, the kinetics were similar (). From 3–6 h p.i. there was a burst of replication in both cell types, with copy numbers rising by ~5 logs in the genetically-intact cells, and by ~4 logs in the KO cells, and thereafter the rate of increase dropped to similar extents in both cell populations; thus, RNA replication in the TFEB KO cells appears to have been limited, rather than merely delayed. Given the different quantities of positive-sense RNAs, it appeared likely that viral proteins, too would differ. As shown in , the amounts of three different virus-encoded proteins (VP1, 3Dpol and DsRed) were, indeed, lower in the TFEB KO cells, but less so than anticipated; quantitation showed that all three proteins were only ~1.5-fold less abundant in the TFEBKO cell population. Lastly, we indirectly evaluated the efficiency of RNA encapsidation by measuring the ratio of RNA copy number to infectious virus yield; this ratio was similar in the two clonal lines at each of three different MOIs (), suggesting that the lower titers of infectious virus (shown in panel A) did not result from failed encapsidation of the viral genome.
Figure 7. Deletion of TFEB negatively affects CVB3 infection. (A) TFEB(+) and TFEB KO HeLa cells were infected with DsRedCVB3 at MOI = 0.01 for 24 h. Cells and supernatants were harvested at the indicated time points, and titers (pfu/ml) were determined by plaque assay; titers from TFEB(+) (black circles) and TFEB KO cells (open circles) are shown. (B) Viral genome RNA content in TFEB(+) and TFEB KO HeLa cells was followed over a 24-h period by qPCR. (C) Immunoblot analysis of viral protein content at 24 h p.i. The graph shows the ratio of viral protein bands from TFEB(+) and TFEB KO cells. (D) Infectious virus titers in infected cells with different MOI (1, 0.1 and 0.01) were measured by plaque assay, and genomic dsRedCVB3 RNA was determined by qPCR. A Spearman correlation line for the relationship between the genome content and virus titer is shown. (E) TFEB(+) and TFEB KO HeLa cells were infected with DsRedCVB3 at MOI = 0.01 for 24 h, then were fixed and stained with Alexa Fluor 488 phalloidin (green; detects ACTB/beta-actin; nuclei were counterstained using Hoechst 33342 (blue). Confocal images were acquired and representative images from each cell type are presented. DsRed positive cells were quantified using the Spot detection function of IMARIS, and the percent of DsRedCVB3 infected cells (red) are displayed in the graph (mean + SEM) on the right side of panel E
The data in panels A-D could be explained in 2 general ways. At one extreme, it is possible that equal numbers of cells in both populations are infected, but virus replication/yield from individual infected TFEBKO cells is ~17-fold lower than in TFEB(+) cells. At the other extreme, perhaps virus infection is established in ~17-fold fewer TFEBKO cells but, thereafter, viral replication proceeds equally well in both cell types. To begin to address this issue, the number of actively-infected cells was assessed using confocal microscopy to detect DsRed expression. In the TFEB KO population, virus-infected (red) cells were substantially less frequent (~7-fold lower) than in the TFEB(+) population (), arguing against the first explanation, and indicating that TFEB KO cells are less supportive of CVB3 infection. However, the stage (or stages) of the life cycle that is/are affected remain(s) unclear. We determined if deletion of TFEB had any impact on the expression of the receptor for this virus (CXADR [coxsackie virus and adenovirus receptor]) or of clathrin, whose endocytic activity is promoted by TFEB [Citation49,Citation50], and which may be involved in the uptake of CVB3 [Citation51]; no difference was observed (Fig. S8A). In addition, the cellular distributions of both proteins were similar in both the TFEB KO and TFEB (+) clones (Fig. S8B). Nevertheless, we also analyzed the effect of TFEB on endocytosis. Two independent approaches were employed: cells were incubated with (i) fluorescently-labeled dextran (Fig. S9A), which is known to enter cells in a clathrin and dynamin-dependent manner [Citation52], or (ii) with baculovirus expressing fluorescent proteins that localize in early (RAB5A) and late (RAB7A) endosomes (BacMam, Fig. S9B). Fluorescent organelles were visualized by confocal microscopy, and the numbers of fluorescent dots were counted using the Spot detection function of IMARIS software. By both criteria, the absence of TFEB led to statistically-significant decreases in labeled early endosomes.
Discussion
In normal-fed mice, rCVB3 at a dose as high as 107 pfu i.p. is rarely lethal, and often causes only mild disease. This observation afforded us the opportunity to identify metabolic factors that might increase rCVB3 pathogenicity in vivo. In the present study, we show that FR has a profound effect on attenuated enterovirus infection. Here we have exploited the rCVB3 model to demonstrate, for the first time, the existence of a very rapidly-responsive autophagy-dependent food-related switch that modulates host susceptibility to an attenuated virus. This switch can be flipped on and off: turning it on (by FR) renders the host more vulnerable to rCVB3 infection, while turning it off (by restoring food) quickly begins to reverse that effect. The pro-viral effect of FR was observed in pancreas, liver and heart, with the greatest impact (72-fold) observed in the pancreas, and lesser FR-driven increases in liver and heart (). This may reflect intrinsic differences in the capacity of the parenchymal cells to support CVB3 replication. The pro-viral effect of FR may benefit rCVB3 more in acinar cells than in hepatocytes and cardiomyocytes. The reversal of susceptibility that follows the restoration of food revealed a similar pattern; a significant reduction in pancreatic virus titer (p < 0.0001), with lesser reductions in the other two organs. The enhancement of rCVB3 infection in food restricted mice translates to a higher number of genome copies in pancreas, and increased pathogenicity ().
The viral amplification effect observed in food-restricted mice was autophagy-dependent because, in the absence of ATG5 expression, food restriction had no detectable impact on viral replication (). Moreover, while deficiency of a single lysosomal protease, CTSB, has little apparent effect on rCVB3 replication in normal-fed mice (, black bars), FR uncovered a difference between WT mice and Ctsb KO mice: in the latter animals, the pro-viral effect of FR was blunted (, black vs blue bars). Thus, the pro-viral effect of FR requires functional autophagy and lysosomal biogenesis. These observations are consistent with our previous demonstration that CVB3 infection involves amphisomes, which are a point of intersection between the two pathways [Citation17]. Lysosomes play a central role in cellular metabolism. They have long been known to be the ultimate destination for cellular debris, and, in that role, they are the final terminus of the autophagy conveyor belt. However, it is now known that they are far from being only passive receptacles of cellular debris; they detect different types of nutrient deficiency using transmembrane channels that act as sensors, whose signals are transduced to lysosomal effector complexes such as MTORC1; for this reason, lysosomes have been termed a “command and control center” for cellular metabolism [Citation38].
A close relationship between FR and rCVB3 infection is strongly supported by our observation that the great majority of genes whose expression is upregulated by FR in vivo also play a role in supporting rCVB3 replication in tissue culture (). It is well established that the transcriptional response to food restriction is controlled largely by TFEB, which upregulates >100 genes involved in lysosomal biogenesis and autophagy, and positively regulates autophagosome formation and autophagosome-lysosome fusion [Citation53]. Consequently, we examined how TFEB was affected by (i) food restriction and (ii) viral infection (). There was a striking resemblance between the two. Both triggered a transition from p-TFEB to TFEB (), and both also drove the nuclear translocation of TFEB, as demonstrated using GFP-TFEB expressing cells that were either nutrient-restricted or virus-infected (). Both FR and rCVB3 infection also activate autophagy (Fig. S3 and S7). Thus, we suggest that FR and rCVB3 infection activate autophagy through a common mechanism – by modulating TFEB activity, an effect that would simultaneously increase lysosomal biogenesis. To better assess the impact of TFEB on rCVB3 infection, we used the MTOR-independent TFEB activator trehalose, and found that it significantly increased CVB3 yield in tissue culture, albeit by only a small multiple (). TFEB deletion had a bigger impact. Infectious virus yield was ~17 lower in TFEB KO HeLa cells () and, while no one phase of the life cycle was dramatically more affected than any other, part of the reduction appears to be attributable to the cells’ having a lower susceptibility to infection (). We also found that the TFEB KO cells had normal levels of CAR and clathrin, which are important in viral binding and internalization, but displayed reduced endocytic activity (Fig. S8 and S9). However, the extent to which the reduced susceptibility to infection results from diminished uptake of virus by the TFEB KO cells, as distinct from their having an intracellular environment that is less conducive to the establishment of robust replication, is not known. As shown in , differences between TFEB(+) and TFEB KO cells affect several stages of the CVB3 life cycle, and it is possible that small differences at each different stage accumulate to give the eventual outcome, of a ~ 17-fold difference in infectious virus yield.
In summary, the pro-viral effects of FR appear to result from its ability to upregulate and activate TFEB. By doing so, FR may be maintaining, or even enhancing, viral uptake from the extracellular milieu, and also providing the virus with its favored cellular environment at the moment of infection, thereby relieving the virus of the need to establish that environment in the hour that immediately follows. The impact of FR on TFEB is reversible, consistent with its being the switch that rapidly up- and downregulates susceptibility to enterovirus infection. In contrast, once infection is underway, the virus-induced changes in TFEB may be irreversible, as suggested by the data in ; restoration of food at 24 h p.i. (regimen 3) does not reduce the infectious virus yield compared to mice in which food was not restored (regimen 2). Others have recently shown that the coronavirus 3a protein can cause lysosomal dysfunction and TFEB activation, which may contribute to pathogenesis [Citation54] but, to the best of our knowledge, the data herein are the first demonstration that TFEB can support a viral infection and, thereby, increase viral pathogenesis.
These findings may have additional, broader, implications. Sporadic fasting has been an integral part of religious and spiritual beliefs in a variety of cultures, and has been practiced for millennia. Moreover, involuntary food deprivation can, regrettably, be a very important issue for some countries during famine, and in civil war [Citation55,Citation56]. Our findings, and a recent study showing that starved mice appear to be more susceptible to influenza virus infection [Citation57], cause us to wonder if these individuals – after even a short period of fasting – may be more vulnerable to viral infections. Finally, we speculate that coxsackievirus’ exploitation of food deprivation may have at least two evolutionary implications. First, it is intriguing that the pancreas is a primary target for CVB infection, because this organ plays a central role in ensuring the provision of nutrients to all host cells. Pancreatic acinar cells secrete lipase and amylase into the gastrointestinal (GI) tract, and these enzymes degrade incoming fats and sugars into their component parts, which thereafter are absorbed and delivered to all host tissues. In severe CVB3 pancreatitis, the virus rapidly infects almost all acinar cells [Citation12], aborting the production of these enzymes and thereby reducing nutrient uptake in the GI tract, an outcome that is readily visualized by the characteristic steatorrhea that occurs early in infection. Thus, even if the host is ingesting plentiful food, by infecting the pancreas the virus may induce an organism-wide restriction of available nutrients; this, in turn, may cause all host cells to develop an intracellular environment that supports rCVB3 replication. Second, the effect of FR impacts attenuated forms of CVB3; we speculate that this may enhance the persistence of such variants in a malnourished populace, and also may allow the virus to mutate into a more virulent form which then could be successfully transmitted to the better-nourished members of the community. Taken together, our findings reveal an intriguing relationship between food intake and enteroviral infection: not only do these viruses commonly use food as a vehicle by which to enter the host, they also can exploit prior nutritional deprivation, ensuring that, when food is restored, they can benefit from the existing TFEB-driven changes in the intracellular microenvironment. As noted in the Introduction, undernourishment remains a distressingly frequent occurrence for hundreds of millions of people, and our observations may be relevant to their increased susceptibility to RNA virus infections. For example, exposure to an attenuated enterovirus during a period of famine (approximated by regimen 3), or the re-introduction of virus-contaminated food after a period of starvation (~regimen 4) may result in higher than normal viral replication, and more severe disease.
Materials and methods
Ethics statement
All mouse experiments were approved by The Scripps Research Institute (TSRI) Institutional Animal Care and Use Committee and were carried out in accordance with the National Institutes of Health’s Guide for the Care and Use of Laboratory Animals.
Mice
C57BL/6 mice were purchased from The Scripps Research Institute (TSRI) breeding facility. Mice with pancreatic acinar cell-specific deletion of Atg5 (EL-Cre/Atg5f/f mice) were generated as we have previously described [Citation19]. Homozygous GFP-Lc3 transgenic mice (GFP-Lc3Tg/Tg) were obtained from Riken Bio Resource Center (53) [Citation32], and were bred against C57BL/6 mice to generate hemizygous (Tg/+) mice that were used in the experiments. Mice were genotyped by PCR as previously described [Citation23,Citation31,Citation58]. Mice heterozygous for Ctsb (CtsbWT/KO mice) were obtained from Dr. Adam Goldfarb (University of Virginia) and were crossed to generate a homozygous ctsb KO line; the phenotype of these mice (reduced trypsinogen → trypsin conversion) was confirmed prior to experimental use (see Fig. S5). All mice were used at 8–12 weeks of age.
Food restriction and cellular starvation
Mice were placed in cages with water, but without food, and were maintained there for either 24 or 48 h, after which food (regular mouse chow) was supplied. All mice were maintained in the same facility. For ethical/humane reasons, longer periods of food restriction were not evaluated. As detailed in the Results section, some of the mice were infected with recombinant CVB3 (rCVB3); the time of the infection, relative to food restriction status, varied as described in the Results section. For tissue culture experiments, HeLa cells were normally fed using complete DMEM (cDMEM; DMEM [Thermo Fisher Scientific, 100313–021] supplemented with 10% FBS, 100 units/ml penicillin, 100 µg/ml streptomycin and 2 mM L-glutamine). Cell starvation was carried out by replacing the cDMEM with Hanks buffered salt solution (HBSS; STEMCELL Technologies, 37150), and maintaining the cells for 6 h.
Treatment of cells with the pharmacological TFEB activator, trehalose
In some experiments, GFP-TFEB HeLa cells were incubated with the disaccharide trehalose (Sigma-Aldrich, T9449) for 24 h, at a concentration of 100 mM in cDMEM.
Viruses and infections
Nluc-CVB3 encoding nanoluciferase is used in the experiments described herein. The Nanoluc luciferase reporter vector, pNL1.3[secNluc] was purchased from Promega Technologies Inc. (N1021), and the Nanoluc luciferase reporter gene was inserted into wild type CVB3 using the cloning approaches developed by our laboratory [Citation30], generating a new rCVB3 named Nluc-CVB3. This virus was grown in HeLa cells, and the kinetics of luciferase production was characterized (see Fig. S1). The recombinant CVB3 encoding DsRed was previously reported [Citation59], and is severely attenuated in vivo. Viruses were inoculated by the intraperitoneal (i.p.) route, at the indicated doses, or used at the indicated MOIs in tissue culture.
One-step growth curve
HeLa cell monolayers (∼75% confluent in 6-well plates) were infected with Nluc-CVB3 at a multiplicity of infection (MOI) of 10. After 1 h at 37°C, virus inoculum was removed, monolayers were washed with saline, and then 3 ml of complete DMEM (cDMEM) was added to each well. Cells and supernatants were harvested at the indicated time points, and titers (pfu/ml) were determined by plaque assay.
Determination of virus titers in tissues and cells
Mice were euthanized and perfused with Dulbecco’s PBS (DPBS; Thermo Fisher Scientific, 14190–144) to clear blood from the tissues and to prevent overestimation of organ virus titers due to CVB3 in the blood. Samples were weighed, homogenized in 1 ml DMEM (Thermo Fisher Scientific, 100313–021), and the lysates were titered for infectious virus. To evaluate virus growth in tissue culture cells, the cells were infected with rCVB3 at the indicated MOIs, incubated at 37°C for 24 h, and cells and supernatants were separately harvested. Plaque assays were performed on sub-confluent HeLa cell monolayers as described [Citation60].
CRISPR-mediated TFEB editing
Guide RNA sequences for CRISPR-Cas9 were designed at the web site http://www.genscript.com/gRNA-database.html. Insert oligonucleotides for human TFEB guide RNA (gRNA) are sense 5ʹ-CACCGCATTGACAACATTATGCGTC-3ʹ and antisense 5ʹ AAACGACGCATAATGTTGTCAATGC-3ʹ. The complementary oligonucleotides for the gRNAs were annealed, and cloned into pX459 CRISPR-Cas9-Puro vector (ver. 2). 2 × 10⁵ HeLa cells were seeded into 6-well plates and transfected with the vector pX459 encoding sgTFEB 24 h later. A day after the transfection, fresh media containing puromycin (2 µg/ml) was added to the transfected cells for three consecutive days to select Cas9-expressing HeLa cells, after which puromycin was no longer included. After two weeks, colonies were seeded into the first row of 96-well plates at 104 cells in 200 µl of cDMEM per well, and then a ten-fold serial dilution per row was applied to get a single clone of cells. TFEB expression was assessed by western blot analysis using a TFEB antibody (Cell Signaling Technology, 4240).
Labeling and quantification of endosomes and TFEB
The TFEB KO and TFEB(+) HeLa cells were seeded on collagen-coated coverslips (3.5x10⁴ cells/well) overnight. To estimate the total number of endosomes, cells were loaded with 0.1 mg/ml dextran oregon green 488 (Thermo Fisher Scientific, D7173) for 3 h at 37°C (5% CO2), and chased overnight. To evaluate specifically the total number of early and late endosomes, cells were incubated for 24 h with CellLight® Early Endosomes-RFP and Late Endosomes-GFP (Thermo Fisher Scientific, C10587 and C10588, respectively) according to the manufacturer’s instructions. Cells were then fixed, imaged and quantified using the Spot function in Imaris 8.0 software (Bitplane, Switzerland), which locates endosomes based on size and intensity thresholds in Easy 3D mode view. Each endosome is represented by a sphere of arbitrary size determined by the user (0.5 µm). The displayed sphere is positioned at the center of mass of the identified endosome. The Imaris Cell or Spot functions were employed for detecting TFEB in the pancreata of FR and normal fed mice, and in tissue culture cells. These software functions allowed us to discriminate between, and quantify, TFEB signals that were located in the cytosols and those located in the nuclei.
Analysis of protein expression by western blot
HeLa cells were homogenized in freshly prepared RIPA buffer (EMD Millipore, 20–188) containing the following inhibitors: 1X protease inhibitor cocktail (Roche/Genentech, 11697498001), and 1x Halt Phosphatase Inhibitor Cocktail (Pierce/Thermo Fisher Scientific, 1862495). Homogenates were spun at maximum speed in a cold microcentrifuge for 25 min, and the clarified supernatant was collected. The total protein concentration of each lysate was determined by the Pierce BCA Protein Assay (Thermo Fisher Scientific, PI-23227), using bovine serum albumin (BSA; Pierce, 23209) as a standard. Lysates were diluted in denaturing sample buffer, boiled for 5 min, and 40 μg of each sample was separated by SDS-PAGE on 4–15% Criterion precast Tris-HCl polyacrylamide gels (Bio-Rad, 345–0028), or with 12% Criterion™ XT Bis-Tris Protein Gel (BioRad, 345–0118; for LC3). Proteins were then transferred onto a 0.45 μm PVDF membrane (Bio-Rad, 1704085), following the manufacturer’s instructions. Membranes were blocked with 5% nonfat milk in TBST (137 mM sodium chloride, 20 mM Tris. at pH 7.6; Bio-Rad Laboratories, 1706435) + 0.1% Tween-20 (Sigma-Aldrich, P1379; TBST) for 1 h at RT. Next, membranes were washed in TBST and incubated with the primary antibody in 1% milk with TBST overnight at 4°C. The following primary antibodies were used: polyclonal rabbit anti-TFEB (Bethyl Laboratories, A303-673A); living Colors® DsRed Polyclonal Antibody, (Takara Bio USA, 632496); rabbit anti-3D pol (Dr. Karin Klingel, University Hospital Tübingen); polyclonal rabbit anti-enterovirus VP1 (Mediagnost Germany, M47); anti-CXADR/CAR antibodies (provided by Dr. Klingel, University Hospital Tübingen, Germany); polyclonal rabbit anti-clathrin antibody (Cell Signaling Technology, 2410). Membranes were washed again and then incubated with HRP-conjugated secondary antibody (Amersham donkey anti-rabbit IgG or sheep anti-mouse IgG, GE Healthcare Life Sciences, NA934 & NA931) in 1% milk in TBST for 1 h at RT. After additional washing, membranes were incubated with Amersham™ ECL™ Prime (GE Healthcare Life Sciences, RPN2232) for 5 min, and then membranes were imaged with the ChemiDoc imager (Bio-Rad). Finally, to provide a control for protein loading of each sample, the membranes were then washed in TBST, stripped with Restore PLUS western blot stripping buffer (Pierce/Thermo Fisher Scientific, 46430) for 10 min at RT, then washed and blocked with 5% milk in TBST for 1 h at RT. Membranes then were probed with mouse GAPDH antibody (clone 6C5; EMD Millipore, MAB374), rabbit TUBB/β-Tubulin (9F3) antibody (Cell Signaling Technology, 2128), or with rabbit Histone H3 antibody (Cell Signaling Technology, 9715) in 1% milk in TBST overnight at 4°C, and then processed as described above.
PCR array and quantitative PCR
To analyze the effect of FR on the autophagy and MTOR pathways, we used the RT2 Profiler PCR Array System (SABiosciences, Frederick, MD, USA; 96-well format) to evaluate the abundance of 84 mRNAs related to the mouse autophagy pathway (PCR array, PAMM-084Z), and the mouse MTOR pathway (PCR array, PAMM-098Z). Three normal-fed mice and three 24 h FR mice were sacrificed, and pancreatic RNA was isolated. For all 6 samples, 1 µg of total RNA was used as the template for cDNA synthesis, and the PCR array assays were carried out according to the manufacturer’s instructions. SABiosciences web-based software for Standard RT2 PCR Array analysis (http://pcrdataanalysis.sabiosciences.com/pcr/arrayanalysis.php) was used to calculate experimental results and their statistical significance. The data were normalized against housekeeping genes.
RT-PCR to enumerate viral genomes
Pancreatic tissue was collected and immediately stored in RNAlater stabilization reagent (Qiagen, 1017980). The tissue was weighed, and RNA was isolated using an RNeasy Mini Kit (Qiagen, 74104), following the manufacturer’s instructions. 0.25 μg total RNA from the samples was reverse transcribed using SuperScript III Reverse Transcriptase (Thermo Fisher Scientific, 18080051) according to the manufacturer’s protocol; a CVB3-specific genome complementary oligonucleotide 5ʹGAACGCTTTCTCCTTCAACC3ʹ was used as a primer for the RT reaction. The RT reactions were: 65°C for 5 min, 50°C for 45 min, 70°C for 15 min. Samples were then treated with 1 μl Ribonuclease H (Thermo Fisher Scientific, 18021–071) to remove RNA complementary to the cDNA. Next, Taqman quantitative real-time PCR was performed using CVB3-specific primers (forward 5ʹCACACTCCGATCAACAGTCA3ʹ; reverse 5ʹGAACGCTTTCTCCTTCAACC3ʹ) and a FAM/TAMRA-labeled probe (5ʹCGTGGCACACCAGCCATGTTT3ʹ) as previously described (Tabor-Godwin et al., 2010). PCR amplification was done using the Platinum Quantitative PCR SuperMix-UDG cocktail (Thermo Fisher Scientific, 11730017) as described by the manufacturer. Quantitative analysis of viral RNA was carried out using a BioRad iQ5 Real-Time PCR System in 96 well optical reaction plates heated to 50°C for 2 min to digest dUTP-containing contaminants, 95°C for 2 min to deactivate UNG and activate Platinum Taq DNA polymerase, followed by 40 cycles of: denaturation at 95°C for 15 s and annealing and extension at 60°C for 30 s. All samples were evaluated in triplicate amplification reactions. In order to assign a genome copy number to the cycle threshold value, a standard curve was generated: a known quantity of in vitro transcribed CVB genomic RNA was serially diluted, and all dilutions were subjected to the above reverse transcriptase and qPCR reactions. Additional control reactions were set up that omitted RT, and were invariably negative. Values are expressed as the average number of CVB genome copies per gram of tissue.
Staining of cells
HeLa, GFP-TFEB, TFEB(+) and TFEB KO HeLa cells were seeded in a 24 well plate containing collagen pre-coated coverslips at a density of 3 × 10⁴ cells/well. After different treatments (siRNA, DsRedCVB3 or HBSS) cells were fixed with ice-cold 4% paraformaldehyde (PFA) at 4°C for 25 min and washed three times in PBS, at room temperature. PFA-fixed cells were permeabilized using 0.2% Tween 20/PBS. Cells were then incubated with polyclonal anti-CXADR/CAR antibody (provided by Dr. Klingel, University Hospital Tübingen, Germany), polyclonal rabbit anti-clathrin antibody (Cell Signaling, 2410), or polyclonal rabbit anti-LC3 antibody (MBL International PM036). Cells were then washed with PBS/0.2% tween-20 and incubated with anti-rabbit secondary antibody conjugated with Alexa Fluor 568 (Thermo Fisher Scientific, A-11036) for 1 h at room temperature. Cells were washed again with PBS/0.2% tween-20 and labeled with Alexa Fluor 488, 568 or 647 phalloidin (Thermo Fisher Scientific, 1:40) overnight at 4ºC. Cells were counterstained with the fluorescent nuclear stain (Hoescht; Thermo Fisher Scientific, H3570) at 1:1000, air-dried and mounted on coverslips slides using ProLong Gold antifade mounting media (Thermo Fisher Scientific, P36903).
Vibratome sectioning and TFEB immunostaining
Pancreatic sections, prepared as previously described [Citation23], were incubated with polyclonal rabbit anti-mouse TFEB (Bethyl Laboratories, A303-673A) in PBS with 1% normal goat serum (Thermo Fisher Scientific, 31872) overnight at 4°C. The sections were then washed 3 times in PBS with 0.3% Triton X-100 (Sigma-Aldrich, T8787) and were incubated for 1 h at RT with Alexa Fluor 488-conjugated goat anti-rabbit IgG (Thermo Fisher Scientific, A-11034). After incubation, the sections were washed once in PBS with 0.3% Triton X-100 and 3 times in PBS, then were counterstained with Hoechst 33342 in PBS for 5 min at RT (to label nuclei). After 3 additional PBS washes, the sections were mounted on glass coverslips with ProLong Gold mounting medium (Thermo Fisher Scientific, P36930).
Serum AMY/α-amylase assay
Serum was collected in MiniCollect serum separator tubes (Greiner Bio-One, 450472), and the level of AMY (amylase) was determined using the EnzChek® Ultra Amylase Assay Kit (Thermo Fisher Scientific, E33651) according to the manufacturer’s instructions.
Confocal laser scanning microscopy
Three or 4 color images of stained tissue culture cells or vibratome sections were captured using an LSM 780 laser scanning confocal microscope equipped with Zen 2009 software (Carl Zeiss, Inc., Germany). Representative regions within each vibratome section of pancreas were scanned at 40X or 63X magnification as serial 8-bit optical sections with 0.3- to 0.5-μm-interval step slices (1,024 by 1,024 image sizes). The confocal Z-stacks were imported into Imaris 8.0 software (Bitplane, Switzerland) and reconstructed in 3D view with the aid of Imaris software Easy 3D mode by applying a maximum intensity projection (MIP) volume rendering algorithm for each individual channel. The images were saved as TIFF files from the Snapshot view (1024x1024) of IMARIS.
Using siRNAs to evaluate the impact of host genes on productive CVB3 infection
HeLa cells were seeded with DMEM and 10% FBS in 24-well plates (3.3 × 10⁴ cells/well) for 18 h before transfection, then siRNA-lipid complexes were introduced into each well of cells (50 nM RNA and 2.5 μL/well DharmaFECT 1). A table of the siRNA target sequences is provided (). All experiments were carried out in quadruplicate, and a non-target siRNA was used as a control (ON-TARGETplus Non-target siRNA; D-001810-01-20). Forty-eight hours post-transfection, for each group of RNA-transfected cells, one well of cells was harvested, and the cell viability and live-cell count was determined using a ViaStain™ AOPI Staining Solution (Nexcelom Bioscience) with a cell counter (Cellometer Auto 2000 Cell Viability Counter). Then, the remaining wells were inoculated with NlucCVB3 at the indicated MOI, and viral replication activity was measured using a luciferase assay.
Table 1. List of siRNAs used in of this manuscript
Luciferase assay
The luciferase assay was carried out according to the manufacturer’s instructions (Promega Technologies Inc., N1110). An aliquot of culture medium (50 µl) was collected, without disturbing the cell monolayer, at the indicated time(s), and was transferred to a single well of a 96-well plate. To determine in vivo luciferase activity, tissue lysate (0.2 mg of protein/µl lysis buffer) was used. Distilled water was added to a final volume of 100 µl, and 100 µl of Nluc reagent (one volume of assay substrate with 50 volumes of assay buffer) was added to the well. The bioluminescence reaction catalyzed by nanoluciferase activity was measured at 460 nm using a Perkin Elmer Victor X3 luminometer.
Histology
Mice were euthanized and perfused with DPBS and the pancreas was harvested and fixed in buffered zinc formalin at RT overnight. Tissues were paraffin-embedded and 3 μm sections were cut and stained with Masson’s trichrome. The sections were observed at 20X magnification with a Keyence BZ-X710 inverted microscope and images were acquired using BZ-X Analyzer software (Keyence, Japan).
Statistical analysis
A two-tailed unpaired non-parametric Mann–Whitney t-test was used to determine statistical significance between two groups of data (GraphPad Prism, CA, USA). ANOVA was used to compare more than two groups. P values less than 0.05 were considered significant and, when represented by asterisks, are shown as follows: * 0.05 ≥ p > 0.01; ** 0.01 ≥ p > 0.001; *** 0.001 ≥ p > 0.0001; **** p ≤ 0.0001.
Supplemental Material
Download Zip (9.7 MB)Acknowledgments
We thank: Drs. Noboru Mizushima (Tokyo Medical and Dental University) and Herbert W. “Skip” Virgin (Washington University) for providing Atg5f/f mice; Dr. Eric P. Sandgren (University of Wisconsin-Madison) for providing EL-Cre transgenic mice; Dr. Adam Goldfarb (University of Virginia) for providing ctsb KO mice; Dr. Shawn M. Ferguson (Department of Cell Biology, Yale University School of Medicine, New Haven) for providing GFP-TFEB HeLa cells; and Dr. Karin Klingel (University Hospital Tübingen, Germany) for providing antibodies against 3DPol and CXADR/CAR. This work was supported by NIH grants R01AI114615 and R01AI110621, to JLW, and by American Heart Association Postdoctoral Fellowship 18POST33960190 to TK. This is manuscript number 29561 from The Scripps Research Institute.
Disclosure statement
No potential conflict of interest was reported by the authors.
Supplementary material
Supplemental data for this article can be accessed here.
Additional information
Funding
References
- Witso E, Palacios G, Cinek O, et al. High prevalence of human enterovirus a infections in natural circulation of human enteroviruses. J Clin Microbiol. 2006;44:4095–4100.
- Hixon AM, Yu G, Leser JS, et al. A mouse model of paralytic myelitis caused by enterovirus D68. PLoS Pathog. 2017;13:e1006199.
- Brown DM, Hixon AM, Oldfield LM, et al. Contemporary circulating enterovirus D68 Strains have acquired the capacity for viral entry and replication in human neuronal cells. MBio. 2018;9(5):e01954-18.
- Messacar K, Tyler KL. Enterovirus D68-associated acute flaccid myelitis: rising to the clinical and research challenges. JAMA. 2019;321:831–832.
- Romero JR. Pediatric group B coxsackievirus infections. Curr Top Microbiol Immunol. 2008;323:223–239.
- Whitton JL. Immunopathology during coxsackievirus infection. Springer Semin Immunopathol. 2002;24:201–213.
- Knowlton KU. CVB infection and mechanisms of viral cardiomyopathy. Curr Top Microbiol Immunol. 2008;323:315–335.
- Tam PE. Coxsackievirus myocarditis: interplay between virus and host in the pathogenesis of heart disease. Viral Immunol. 2006;19:133–146.
- Daley AJ, Isaacs D, Dwyer DE, et al. A cluster of cases of neonatal coxsackievirus B meningitis and myocarditis. J Paediatr Child Health. 1998;34:196–198.
- Feuer R, Pagarigan RR, Harkins S, et al. Coxsackievirus targets proliferating neuronal progenitor cells in the neonatal CNS. J Neurosci. 2005;25:2434–2444.
- Huber S, Ramsingh AI. Coxsackievirus-induced pancreatitis. Viral Immunol. 2004;17:358–369.
- Mena I, Fischer C, Gebhard JR, et al. Coxsackievirus infection of the pancreas: evaluation of receptor expression, pathogenesis, and immunopathology. Virology. 2000;271:276–288.
- Wong J, Zhang J, Si X, et al. Autophagosome supports coxsackievirus B3 replication in host cells. J Virol. 2008;82:9143–9153.
- Yoon SY, Ha YE, Choi JE, et al. Coxsackievirus B4 uses autophagy for replication after calpain activation in rat primary neurons. J Virol. 2008;82:11976–11978.
- Yoon SY, Ha YE, Choi JE, et al. Autophagy in coxsackievirus-infected neurons. Autophagy. 2009;5:388–389.
- Gorbea C, Makar KA, Pauschinger M, et al. A role for Toll-like receptor 3 variants in host susceptibility to enteroviral myocarditis and dilated cardiomyopathy. J Biol Chem. 2010;285:23208–23223.
- Kemball CC, Alirezaei M, Flynn CT, et al. Coxsackievirus infection induces autophagy-like vesicles and megaphagosomes in pancreatic acinar cells in vivo. J Virol. 2010;84:12110–12124.
- Alirezaei M, Flynn CT, Whitton JL. Interactions between enteroviruses and autophagy in vivo. Autophagy. 2012;8:973–975.
- Alirezaei M, Flynn CT, Wood MR, et al. Pancreatic acinar cell-specific autophagy disruption reduces coxsackievirus replication and pathogenesis in vivo. Cell Host Microbe. 2012;11:298–305.
- Luo H, McManus BM. Is autophagy an avenue to modulate coxsackievirus replication and pathogenesis? Future Microbiol. 2012;7:921–924.
- Tabor-Godwin JM, Tsueng G, Sayen MR, et al. The role of autophagy during coxsackievirus infection of neural progenitor and stem cells. Autophagy. 2012;8:938–953.
- Robinson SM, Tseung G, Sin JI, et al. Coxsackievirus B exits the host cell in shed microvesicles displaying autophagosomal markers. PLoS Path. 2014;10:1–21.
- Alirezaei M, Flynn CT, Wood MR, et al. Coxsackievirus can exploit LC3 in both autophagy-dependent and -independent manners in vivo. Autophagy. 2015;11:1389–1407.
- Katona P, Katona-Apte J. The interaction between nutrition and infection. Clin Infect Dis. 2008;46:1582–1588.
- Qirbi N, Ismail SA. Ongoing threat of a large-scale measles outbreak in Yemen. Lancet Glob Health. 2016;4:e451.
- Raslan R, El Sayegh S, Chams S, et al. Re-emerging vaccine-preventable diseases in war-affected peoples of the Eastern Mediterranean region-an update. Front Public Health. 2017;5:283.
- Yuan X. Concern over reported number of measles cases in Yemen. Lancet. 2018;391:1886.
- Scrimshaw NS. Historical concepts of interactions, synergism and antagonism between nutrition and infection. J Nutr. 2003;133:316S–321S.
- Woodruff JF, Kilbourne ED. The influence of quantitated post-weaning undernutrition on coxsackievirus B3 infection of adult mice. I. Viral persistence and increased severity of lesions. J Infect Dis. 1970;121:137–163.
- Slifka MK, Pagarigan RR, Mena I, et al. Using recombinant coxsackievirus B3 to evaluate the induction and protective efficacy of CD8+ T cells during picornavirus infection. J Virol. 2001;75:2377–2387.
- Alirezaei M, Kemball CC, Flynn CT, et al. Short-term fasting induces profound neuronal autophagy. Autophagy. 2010;6:702–710.
- Mizushima N, Yamamoto A, Matsui M, et al. In vivo analysis of autophagy in response to nutrient starvation using transgenic mice expressing a fluorescent autophagosome marker. Mol Biol Cell. 2004;15:1101–1111.
- Hosokawa N, Hara Y, Mizushima N. Generation of cell lines with tetracycline-regulated autophagy and a role for autophagy in controlling cell size. FEBS Lett. 2006;580:2623–2629.
- Mizushima N, Yoshimori T, Levine B. Methods in mammalian autophagy research. Cell. 2010;140:313–326.
- Richards AL, Jackson WT. Intracellular vesicle acidification promotes maturation of infectious poliovirus particles. PLoS Pathog. 2012;8:e1003046.
- Halangk W, Lerch MM, Brandt-Nedelev B, et al. Role of cathepsin B in intracellular trypsinogen activation and the onset of acute pancreatitis. J Clin Invest. 2000;106:773–781.
- Ahn J, Jun ES, Lee HS, et al. A small interfering RNA targeting coxsackievirus B3 protects permissive HeLa cells from viral challenge. J Virol. 2005;79:8620–8624.
- Lim CY, Zoncu R. The lysosome as a command-and-control center for cellular metabolism. J Cell Biol. 2016;214:653–664.
- Carroll B, Dunlop EA. The lysosome: a crucial hub for AMPK and mTORC1 signalling. Biochem J. 2017;474:1453–1466.
- Settembre C, Fraldi A, Medina DL, et al. Signals from the lysosome: a control centre for cellular clearance and energy metabolism. Nat Rev Mol Cell Biol. 2013;14:283–296.
- Mony VK, Benjamin S, O’Rourke EJ. A lysosome-centered view of nutrient homeostasis. Autophagy. 2016;12:619–631.
- Settembre C, Di Malta C, VA P, et al. TFEB links autophagy to lysosomal biogenesis. Science. 2011;332:1429–1433.
- Settembre C, De Cegli R, Mansueto G, et al. TFEB controls cellular lipid metabolism through a starvation-induced autoregulatory loop. Nat Cell Biol. 2013;15:647–658.
- Sardiello M, Palmieri M, Di Ronza A, et al. A gene network regulating lysosomal biogenesis and function. Science. 2009;325:473–477.
- Roczniak-Ferguson A, Petit CS, Froehlich F, et al. The transcription factor TFEB links mTORC1 signaling to transcriptional control of lysosome homeostasis. Sci Signal. 2012;5:ra42.
- Sarkar S, Davies JE, Huang Z, et al. Trehalose, a novel mTOR-independent autophagy enhancer, accelerates the clearance of mutant huntingtin and alpha-synuclein. J Biol Chem. 2007;282:5641–5652.
- Palmieri M, Pal R, Nelvagal HR, et al. mTORC1-independent TFEB activation via AKT inhibition promotes cellular clearance in neurodegenerative storage diseases. Nat Commun. 2017;8:14338.
- Palmieri M, Pal R, Sardiello M. AKT modulates the autophagy-lysosome pathway via TFEB. Cell Cycle. 2017;16:1237–1238.
- Palmieri M, Impey S, Kang H, et al. Characterization of the CLEAR network reveals an integrated control of cellular clearance pathways. Hum Mol Genet. 2011;20:3852–3866.
- Pena-Llopis S, Vega-Rubin-de-Celis S, Schwartz JC, et al. Regulation of TFEB and V-ATPases by mTORC1. Embo J. 2011;30:3242–3258.
- Chung SK, Kim JY, Kim IB, et al. Internalization and trafficking mechanisms of coxsackievirus B3 in HeLa cells. Virology. 2005;333:31–40.
- Li L, Wan T, Wan M, et al. The effect of the size of fluorescent dextran on its endocytic pathway. Cell Biol Int. 2015;39:531–539.
- Settembre C, Zoncu R, Medina DL, et al. A lysosome-to-nucleus signalling mechanism senses and regulates the lysosome via mTOR and TFEB. Embo J. 2012;31:1095–1108.
- Yue Y, Nabar NR, Shi CS, et al. SARS-coronavirus open reading frame-3a drives multimodal necrotic cell death. Cell Death Dis. 2018;9:904.
- Sharara SL, Kanj SS. War and infectious diseases: challenges of the Syrian civil war. PLoS Pathog. 2014;10:e1004438.
- Akbarzada S, Mackey TK. The Syrian public health and humanitarian crisis: A ‘displacement’ in global governance?. Glob Public Health. 2017;13(7):914–930.
- Wang A, Huen SC, Luan HH, et al. Opposing effects of fasting metabolism on tissue tolerance in bacterial and viral inflammation. Cell. 2016;166:1512–1525 e12.
- Hara T, Nakamura K, Matsui M, et al. Suppression of basal autophagy in neural cells causes neurodegenerative disease in mice. Nature. 2006;441:885–889.
- Tabor-Godwin JM, Ruller CM, Bagalso N, et al. A novel population of myeloid cells responding to coxsackievirus infection assists in the dissemination of virus within the neonatal CNS. J Neurosci. 2010;30:8676–8691.
- Hunziker IP, Cornell CT, Whitton JL. Deletions within the 5ʹUTR of coxsackievirus B3: consequences for virus translation and replication. Virology. 2007;360:120–128.