
 ?Mathematical formulae have been encoded as MathML and are displayed in this HTML version using MathJax in order to improve their display. Uncheck the box to turn MathJax off. This feature requires Javascript. Click on a formula to zoom.
ABSTRACT
Mitochondria operate as a central hub for many metabolic processes by sensing and responding to the cellular environment. Developmental cues from the environment have been implicated in selective autophagy, or mitophagy, of mitochondria during cell differentiation and tissue development. Mitophagy occurring in this context, termed programmed mitophagy, responds to cell state rather than mitochondrial damage and is often accompanied by a metabolic transition. However, little is known about the mechanisms that engage and execute mitophagy under physiological or developmental conditions. As the mammary gland undergoes post-natal development and lactation challenges mitochondrial homeostasis, we investigated the contribution of mitochondria to differentiation of mammary epithelial cells (MECs). Using lactogenic differentiation of the HC11 mouse MEC line, we demonstrated that HC11 cells transition to a highly energetic state during differentiation by engaging both oxidative phosphorylation and glycolysis. Interestingly, this transition was lost when autophagy was inhibited with bafilomycin A1 or knockdown of Atg7 (autophagy related 7). To evaluate the specific targeting of mitochondria, we traced mitochondrial oxidation and turnover in vitro with the fluorescent probe, pMitoTimer. Indeed, we found that differentiation engaged mitophagy. To further evaluate the requirement of mitophagy during differentiation, we knocked down the expression of Prkn/parkin in HC11 cells. We found that MEC differentiation was impaired in shPrkn cells, implying that PRKN is required for MEC differentiation. These studies suggest a novel regulation of MEC differentiation through programmed mitophagy and provide a foundation for future studies of development and disease associated with mitochondrial function in the mammary gland.
Abbreviations: AA: antimycin A; ATG5: autophagy related 5; BAF: bafilomycin A1; BNIP3: BCL2 interacting protein 3; BNIP3L/NIX: BCL2 interacting protein 3 like; COX8A: cytochrome c oxidase subunit 8A; CQ: chloroquine; CSN2: casein beta; ECAR: extracellular acidification rate; FCCP: trifluoromethoxy carbonylcyanide phenylhydrazone; FUNDC1: FUN14 domain containing 1; HIF1A: hypoxia inducible factor 1 subunit alpha; L1: lactation day 1; MAP1LC3B: microtubule associated protein 1 light chain 3 beta; MEC: mammary epithelial cell; mitoQ: mitoquinol; mROS: mitochondrial reactive oxygen species; OCR: oxygen consumption rate; P: priming; P16: pregnancy day 16; PARP1: poly(ADP-ribose) polymerase 1; PINK1: PTEN induced kinase 1; PPARGC1A: PPARG coactivator 1 alpha; PRKN: parkin RBR E3 ubiquitin protein ligase; shNT: short hairpin non-targeting control; SQSTM1: sequestosome 1; STAT3: signal transducer and activator of transcription 3; TEM: transmission electron microscopy; TFAM: transcription factor A, mitochondrial; U: undifferentiated.
Introduction
The transformation of the mammary gland into a milk-producing nutrient supply for the neonate requires profound and systemic metabolic adaptation. Metabolic adaptation occurs in the mammary gland during the transition from gestation to lactation through hormonal, transcriptional, and bioenergetic control. The coordination of hormonal and transcriptional signals during mammary gland development has been well studied [Citation1,Citation2]; however, the contribution of cellular metabolism or bioenergetic control to differentiation remains poorly understood. Initial studies dating back to the 1960s characterized changes in metabolites, enzymes, and ATP over the course of lactation [Citation3–7]. Many of these studies focused on mitochondrial processes and observed alterations in mitochondrial morphology and output during mammary gland development. Mitochondrial density, oxidative capacity, and the total number of mitochondria per secretory cell increase with the onset of lactation [Citation2,Citation8–11]. These observations suggest that mitochondria are actively engaged to enable massive synthesis and secretion of proteins, lipids, and carbohydrates during lactation.
Technological advances have improved our ability to analyze the function and importance of mitochondria. As a result, our understanding of the dynamic control of mitochondrial homeostasis has expanded to include the processes of fission, fusion, biogenesis, and mitophagy, the targeted macroautophagy/autophagy of mitochondria [Citation12]. Mitophagy plays tissue-specific roles in cell survival, differentiation, and function [Citation13–16]. Moreover, a growing number of studies now support the role of mitophagy during tissue development as well as during cellular differentiation and have termed this process “programmed mitophagy” [Citation14,Citation17]. Programmed mitophagy differs from other forms of starvation- or chemical-induced mitophagy in that it occurs in response to developmental stimuli. The most dramatic examples of programmed mitophagy include the complete removal of mitochondria during erythroid differentiation [Citation18] and from sperm after fertilization [Citation19]; however, numerous studies in other cell types have suggested that removal and subsequent replacement of mitochondria, collectively termed mitochondrial turnover, is required for functional differentiation. For example, Gong et al. demonstrated that the development of mature cardiac mitochondria that support the metabolic function of adult cardiomyocytes in mice requires PRKN/parkin-mediated mitophagy. Disruption of PRKN-mediated mitophagy resulted in the retention of fetal cardiomyocyte mitochondria and early post-natal death. The authors concluded that mitochondrial turnover is required for metabolic transitioning in the heart [Citation15].
The idea that a metabolic transition accompanies programmed mitophagy is also supported in other tissues. In skeletal muscle, myogenic differentiation relies on mitochondrial turnover, which is accompanied by a metabolic transition toward an oxidative state [Citation16]. Conversely, a mitophagy-dependent metabolic transition toward glycolytic metabolism occurs during neuroblast differentiation into retinal ganglion cells [Citation14]. Although metabolic transitions clearly occur during mammary gland development, particularly between gestation and lactation, the precise contribution of mitochondria to this transition is undefined. Of note, mitochondrial turnover is one of two hypotheses reached by Rosano and Jones to explain the morphological and functional differences in mitochondria between gestation and lactation in the mouse mammary gland [Citation6]. Their alternative hypothesis was that mitochondria underwent differentiation along with mammary epithelial cells (MECs); however, neither hypothesis has been addressed. Therefore, we sought to further investigate the importance and contribution of mitochondria, potentially involving programmed mitophagy, using an in vitro model of MEC differentiation.
The purpose of these studies was to expand our understanding of the bioenergetic control of metabolic transitions in the mammary gland to provide new insight into the establishment and maintenance of lactation and how metabolic disruption may lead to disease and breast cancer in particular.
Results
HC11 MECs undergo a metabolic transition during functional differentiation
To address the bioenergetic adaptation of the mammary gland during development, we first needed to establish a functional baseline of MEC differentiation. As the primary function of the terminally differentiated lactating mammary gland is to provide nutritional support to the neonate(s) in the form of proteins, lipids, and carbohydrates, the production of milk proteins is often used as a marker of MEC functional differentiation. Therefore, we evaluated the expression of the milk protein CSN2 (casein beta) across differentiation in the HC11 mouse MEC line using a previously validated differentiation protocol [Citation20]. Differentiation-dependent expression of Csn2 increased starting 4 h into differentiation and peaked from 24 to 96 h (). Consistent with gene expression, protein levels of CSN2 increased across differentiation and persisted to 96 h. As cell viability is another factor that affects cell function, we evaluated the expression of the cell apoptosis marker PARP1 (poly[ADP-ribose] polymerase 1) and the mammary gland involution marker STAT3 (signal transducer and activator of transcription 3) across differentiation. Both markers were increasingly activated (cleaved PARP1 and p-STAT3) from 12 to 96 h and peaked at 96 h and 72 h, respectively, suggesting that HC11 cells begin to undergo cell death at later differentiation time points (). This observation is consistent with a previous report that demonstrated p-STAT3 induction and subsequent cell death during lysosomal-mediated programmed cell death in an EpH4 mouse MEC involution-like model after treatment with OSM (oncostatin M), a cytokine that activates STAT3 [Citation21]. Moreover, we observed a transient elevation of p-STAT3 at priming. This expression pattern is similar to that of the mammary gland during the transition from gestation to lactation (Figure S1) and may be associated with the production of phagophore membranes. These results suggest that peak differentiation, indicated by maximal expression of milk protein genes and low levels of cell death makers, occurs between 24 and 48 h in HC11 cells.
Figure 1. Functional differentiation of HC11 mouse mammary epithelial cells (MECs). (A) Differentiation-dependent expression of Csn2 in HC11 cells (n = 3). (B) Expression of differentiation and cell death markers during HC11 differentiation. Levels of PARP1, c-PARP1, p-STAT3, and STAT3 are indicated below each lane after normalization to ACTB. The undifferentiated sample was set to 1.00, and all other time points are presented relative to 1.00. (C) Seahorse Extracellular Flux oxygen consumption rates (OCRs) in differentiating HC11 cells. (D) Basal OCRs and (E) maximal OCRs show progressive metabolic transition that regresses at 72 h and 96 h. (F) Energy phenotype comparison of OCRs and extracellular acidification rates (ECARs) in differentiating HC11 cells further demonstrating a dynamic metabolic transition. (n = 4, 9 replicates per experiment) U: undifferentiated; P: 24 h primed; h: hours differentiated; oligo: oligomycin; A + R: antimycin a + rotenone. Data are presented as mean ± standard deviation. Box and whisker plots are presented from the 25th to 75th percentile, with the line at the median and the whiskers extending to the minimum and maximum values. Statistical significance was evaluated with multiple student t-tests relative to the undifferentiated time point (U). *p < 0.05, **p < 0.01
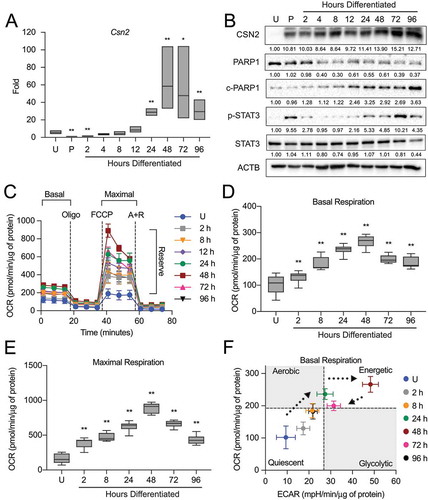
As we were interested in using this model of MEC differentiation to examine the contribution of mitochondria to the function of the mammary gland, we next measured cellular respiration and glycolysis to establish a baseline for mitochondrial function during HC11 MEC differentiation. The oxygen consumption rate (OCR) and extracellular acidification rate (ECAR) were analyzed on a Seahorse Extracellular Flux Bioanalyzer using the mitochondrial stress test, which employs sequential addition of oligomycin, trifluoromethoxy carbonylcyanide phenylhydrazone (FCCP), and antimycin A + rotenone (A + R) to measure basal, maximal, and reserve respiration (). We found that both basal and maximal OCRs were significantly elevated with differentiation, peaking at 48 h (). We then compared the relative energy phenotypes of differentiating cells by pairing the OCR with the ECAR to separate energy phenotypes into quadrants: quiescent, glycolytic, aerobic, and energetic. Using differentiation as a stressor in our model, we found that basal OCRs gradually increased from the lowest basal values in undifferentiated cells up to 24 h of differentiation. At 48 h, a dramatic increase in ECAR shifted the energy phenotype to a more energetic state, suggesting that engagement of glycolysis transiently assists at a peak functional state. Finally, in the later hours of differentiation when cells appear to undergo an involution-like event (72 to 96 h), ECARs and OCRs fell back to early differentiation levels (). Altogether, these findings suggest that mitochondrial function attains a highly energetic state that coincides with the functional differentiation baseline established above in differentiating HC11 cells, peaking at 48 h of differentiation.
Autophagy occurs during a window of functional differentiation
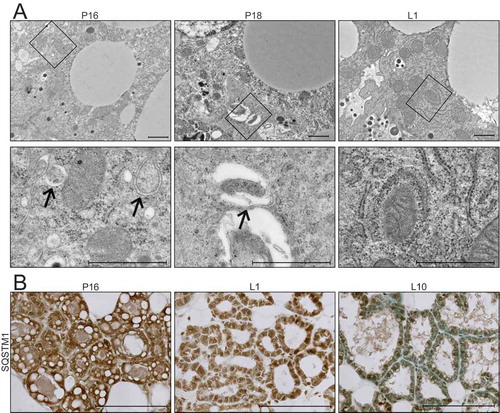
Recent studies have suggested that the ultrastructure of mitochondria, including the length, cristae association, and cristae number, contribute to their function [Citation22]. Therefore, we evaluated mitochondrial ultrastructure in HC11 cells across differentiation by transmission electron microscopy (TEM). Based on our energy phenotype results, we expected mitochondria to exhibit distinct morphologies between an undifferentiated state and those leading up to peak differentiation. Although mitochondria were visibly more electron-dense in differentiated cells, we did not observe significant differences in mitochondrial structure or length up to 24 h of differentiation (data not shown). Unexpectedly, we did observe an abundance of autophagic vesicles that exhibited progressive maturation with differentiation (). Beginning at 2 h, we found lighter autophagosomes throughout the cytoplasm, and these vesicles appeared increasingly more electron-dense from 8 to 24 h, suggesting lysosome fusion and maturation of autolysosomes (). Another marker of autophagic flux, MAP1LC3B/LC3B (microtubule-associated protein 1 light chain 3 beta), showed a transient increase of both the nonlipidated (LC3B-I) and lipidated (LC3B-II) forms at priming, suggesting induction of phagophore biogenesis and subsequent lysosomal degradation at the time points thereafter (). As elevated LCB-II levels can indicate both blockage and induction of autophagic flux [Citation23], we treated differentiating HC11 cells with the vacuolar-type H+-ATPase inhibitor bafilomycin A1 (BAF), which inhibits autophagosome-lysosome fusion, for 4 h prior to protein isolation. Indeed, we found that LC3B-II accumulated in the presence of BAF (), suggesting that autophagic flux is occurring. TEM analysis of mouse mammary glands during the transition from gestation to lactation also exhibited autophagic vesicles and the presence of phagophore membranes (). Moreover, the autophagy receptor SQSTM1 (sequestosome 1) showed higher levels of expression at late pregnancy (P16) and early lactation (L1) compared to mid-lactation (L10) (), which is indicative of macroautophagy during the transition from gestation to lactation. Together, these data suggest that autophagy occurs during an important functional transition in MEC differentiation.
Figure 2. Autophagic membrane formation during HC11 cell differentiation. (A) Model of autophagic flux. (B) Transmission electron microscopy (TEM) images of HC11 cells at progressive stages of differentiation, showing the accumulation of autophagic membranes. (C) Higher magnification TEM images demonstrate vesicle content at each stage of differentiation. Three sections each were evaluated from two independent samples for TEM analysis. (D) LC3B levels across differentiation in HC11 cells. Levels of LC3B-I and -II are indicated below each lane after normalization to ACTB. The undifferentiated time point was set to 1.00, and all other time points are presented relative to 1.00. (E) LC3B accumulation after treatment with 100 nM bafilomycin A1 (BAF) for 4 h to prevent phagophore degradation. The level of LC3B-II was normalized to ACTB and is indicated below the blot relative to the undifferentiated and untreated time point. U: undifferentiated; P: 24 h primed; h: hours differentiated. Scale bars: 1 μm
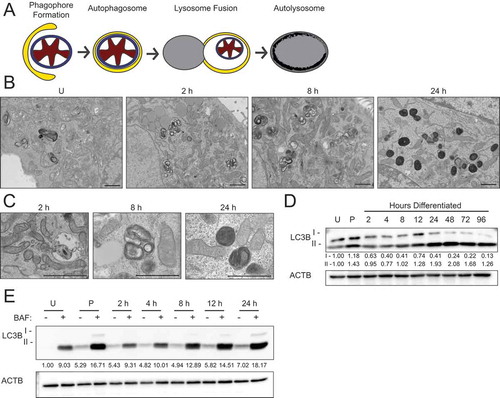
Figure 3. Transition from gestation to lactation in the mouse mammary gland. (A) Transmission electron microscopy (TEM) images of mouse mammary glands at pregnancy day 16 (P16), pregnancy day 18 (P18), and lactation day 1 (L1). Boxed regions are shown below at higher magnification. Scale bars: 1 μm. Three sections from three independent mice were evaluated by TEM. (B) Immunohistochemical staining for sequestosome 1 (SQSTM1) at P16, L1, and L10. Scale bars: 100 μm. Two mice were evaluated for each time point, and two sections from each mouse were stained for comparisons
Inhibition of autophagy impairs HC11 MEC differentiation and energy phenotype
To evaluate the necessity of autophagy during HC11 cell differentiation, we inhibited autophagosome-lysosome fusion with BAF. Initial evaluation of Csn2 expression at 48 h of differentiation revealed that even low concentrations of BAF substantially reduced induction of differentiation-dependent Csn2 expression in HC11 cells (), suggesting that the inhibition of autophagy indeed impaired differentiation. At these low doses of BAF, HC11 cells were still viable, as evidenced by similar levels of CASP3 (caspase 3) activity between vehicle- and BAF-treated cells (). However, when we increased the concentration of BAF treatment, cell death and involution markers, cleaved-PARP1 and p-STAT3, were present throughout differentiation (Figure S2A). Induction of cell death was confirmed by the significant elevation of CASP3 activity in BAF-treated cells compared to vehicle-treated cells at 48 h of differentiation (Figure S2B). Although differentiation appears impaired with BAF treatment, other indicators of functional differentiation, such as elevated mitochondrial respiration, may persist. Therefore, we treated differentiating HC11 cells with BAF and analyzed the resulting OCRs (). Compared to vehicle-treated cells, cells treated with 12.5 nM BAF had significantly reduced basal and maximal respiration at 24 h of differentiation (). A trend toward reduced respiration with BAF treatment was observed at 48 h but was not significant.
Figure 4. Inhibition of autophagy impairs HC11 cell differentiation. (A) Differentiation-dependent Csn2 expression in HC11 cells at 48 h of differentiation is inhibited by treatment with bafilomycin A1 (BAF) at low concentrations. BAF treatment was applied in the priming medium and maintained throughout differentiation (n = 3). (B) CASP3 activity in DMSO- or BAF-treated HC11 cells at 48 h of differentiation. BAF treatment was applied in the priming medium and maintained throughout differentiation (n = 3). (C) OCRs of DMSO- or BAF-treated differentiating HC11 cells. BAF treatment was applied in the priming medium and maintained throughout differentiation. (D) Basal OCRs and (E) maximal OCRs are impaired by BAF treatment at 24 and 48 h of differentiation. (F) Energy phenotypes of BAF-treated cells are also reduced compared to DMSO-treated HC11 cells (n = 2, 9 replicates per experiment). U: undifferentiated; P: 24 h primed; h: hours differentiated; oligo: oligomycin; A + R: antimycin a + rotenone. Data are presented as mean ± standard deviation. Box and whisker plots are presented from the 25th to 75th percentile, with the line at the median and the whiskers extending to the minimum and maximum values. Statistical significance was evaluated with student t-tests and compared to the appropriate DMSO-treated control. *p < 0.05, **p < 0.01
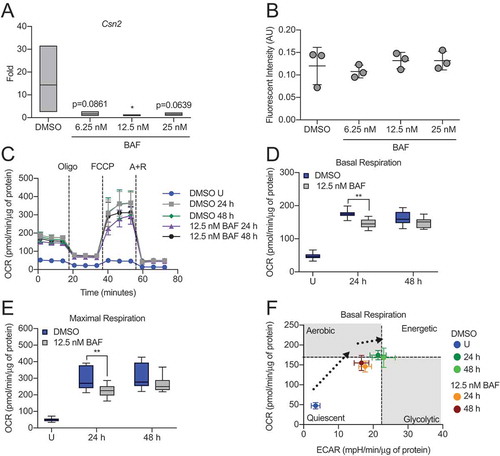
Moreover, the energy phenotype of BAF-treated cells was reduced compared to vehicle-treated cells (), indicating that the inhibition of autophagy negatively impacts both differentiation-dependent gene expression and mitochondrial function. Of note, differentiation-dependent Csn2 expression (48 h), mitochondrial respiration (24 and 48 h), and energy phenotypes (24 and 48 h) were even more significantly reduced when cells were treated with 100 nM BAF compared to vehicle-treated cells (Figure S2C–G). Although we observed cell death at this concentration of BAF, the cells we assayed were viable and were normalized in their respective assays. In further confirmation of these results, we treated HC11 cells with chloroquine (CQ), which elevates the pH of lysosomes, ultimately preventing the fusion of lysosomes and autophagosomes. We found that concentrations of CQ as low as 10 and 20 nM were sufficient to reduce Csn2 expression at 48 h of differentiation (Figure S3A). Furthermore, OCRs were reduced significantly at 48 h in response to 20 nM CQ treatment (Figure S3B–D). Together, these data strongly suggest that autophagy is vital to HC11 MEC differentiation.
ATG5 and ATG7 expression vary with MEC differentiation
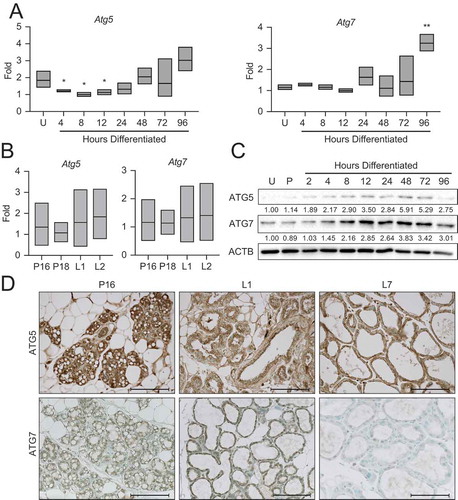
To begin addressing the mechanism responsible for this autophagy, we asked whether autophagy mediators, such as the autophagy related (Atg) genes, exhibited expression patterns corresponding to the autophagic processes observed in differentiating MECs. Gene expression of Atg5 demonstrated a reduction with the onset of differentiation, whereas expression of Atg7 was relatively consistent throughout differentiation. Both Atg5 and Atg7 trended toward elevated expression from 24 to 96 h of differentiation (). The transcript levels of these factors in the mouse mammary gland between late gestation (P16 and P18) and early lactation (L1 and L2) did not vary (). As many autophagy mediators are post-transcriptionally regulated, we examined protein expression by western blot and immunohistochemistry in HC11 cells and mouse mammary tissues, respectively. Interestingly, both ATG5 and ATG7 expression increased steadily with differentiation in HC11 cells and peaked at 48 h of differentiation (). In mouse mammary tissues, ATG5 expression was present throughout pregnancy (P16), early lactation (L1), and mid-lactation (L7) (). In contrast, the expression of ATG7 was generally low and only exhibited faint staining at P16 and L1 (). These findings suggest that autophagy factors may be developmentally regulated in MECs and that their expression coincides with the important transition between gestation and lactation in the mouse mammary gland.
Figure 5. Expression of autophagy factors during HC11 cell differentiation and mammary gland development. (A) Atg5 and Atg7 expression across differentiation in HC11 cells and (B) at pregnancy days 16 and 18 (P16, P18) and lactation days 1 and 2 (L1, L2) in the mouse mammary gland. RNA was collected from three mice per developmental time point. (C) Expression levels of ATG5 and ATG7 across differentiation in HC11 cells. Levels of ATG5 and ATG7 are indicated below each lane after normalization to ACTB. The undifferentiated time point was set to 1.00, and all other time points are presented relative to 1.00. (D) ATG5 and ATG7 expression at P16, L1, and L7 in the mouse mammary gland. Two mice were evaluated for each time point, and two sections from each mouse were stained for comparisons. U: undifferentiated; P: 24 h primed; h: hours differentiated. Scale bars: 100 μm. Data are presented as mean ± standard deviation. Statistical significance was evaluated with multiple student t-tests relative to the undifferentiated time point (U). *p < 0.05, **p < 0.01
Loss of Atg7 impairs the bioenergetic transition during HC11 MEC differentiation
Based on the reduced functional differentiation capacity observed with pharmacological inhibition of autophagy in HC11 cells, we expected genetic manipulation of the autophagy machinery to have similar effects. We targeted Atg7 due to its role in both LC3 lipidation and ATG12–ATG5 conjugation during early phagophore membrane assembly prior to sequestration of cytoplasmic material [Citation24]. Unexpectedly, stable shRNA-mediated knockdown of Atg7 in HC11 cells resulted in significantly enhanced Csn2 expression at 48 h of differentiation compared to non-targeting shRNA control (shNT) cells (), directly contrasting results seen with BAF and CQ treatment. We confirmed the loss of ATG7 in proliferating HC11 cells by preventing the degradation of phagophore membranes with BAF or by inducing mitochondrial depolarization with FCCP. Both treatments efficiently induced ATG7 expression in control cells but failed to induce substantial expression in either knockdown cell line (). Because Csn2 expression is known to be regulated by STAT5 signaling in the mammary gland, we next asked whether STAT5 expression or activation of STAT5 via phosphorylation was elevated in these cells. We found that activated STAT5 (p-STAT5) was, in fact, present at higher levels in differentiated shAtg7 cell lines (). Several reports have demonstrated that increased levels of reactive oxygen species (ROS) can activate the STAT family of transcription factors, and mitophagy-deficient conditions enhance ROS production [Citation25,Citation26]; therefore, we sought to determine whether ROS production was altered in Atg7 knockdown cells. More specifically, we asked whether mitochondrial ROS (mROS) was affected by the loss of Atg7. To test this, we evaluated mitochondrial superoxide (mROS) production by staining HC11 cells with mitoSOX and found that Atg7 knockdown cell lines produced significantly more mROS than control cells at 48 h of differentiation (). The level of mROS generated in shAtg7 cells was comparable to control cells treated with 0.5 μM antimycin A (AA) for 1 h as a positive control. Of note, 100 nM BAF treatment for the duration of differentiation did not induce a similar elevation of mROS, presumably because mitochondria are sequestered prior to lysosomal fusion. Thus, it appears that inhibiting specific events in autophagic flux has distinct outcomes on differentiation-dependent Csn2 expression and may explain why Csn2 expression was reduced in response to BAF treatment (), which prevents fusion of autophagosomes and lysosomes, but was strongly elevated in Atg7 knockdown cell lines (), where phagophore conjugation is impaired. We found that loss of Atg5, which is also involved in phagophore assembly, had similar effects on Csn2 expression and mROS production (Figure S4A–C).
Figure 6. Knockdown of Atg7 contributes to ROS-mediated gene expression. (A) Differentiation-dependent expression of Csn2 in control (shNT) and shAtg7 HC11 cell lines (n = 3). (B) ATG7 expression in shNT and shAtg7 cell lines after 4 h treatment with DMSO, 100 nM BAF, or 1 µM FCCP (C, B, or F, respectively). Levels of ATG7 are indicated below each lane after normalization to ACTB. The shNT sample treated with BAF was set to 1.00, and all other time points are presented relative to 1.00. (C) Activation (phosphorylation) of STAT5 during differentiation in shNT and shAtg7 cell lines. Levels of p-STAT5 and STAT5 are indicated below each lane after normalization to ACTB. The undifferentiated time point was set to 1.00, and all other time points are presented relative to 1.00. (D) Mitochondrial ROS generation in shNT and shAtg7 cell lines at 48 h of differentiation, measured by mitoSOX fluorescence. Control cells were treated with DMSO or 100 nM BAF beginning at priming, and treatment was maintained through differentiation. Cells were treated with 50 µM antimycin a (AA) for 1 h prior to analysis as a positive control (n = 3). (E) MitoSOX fluorescence analysis in wild-type HC11 cells across differentiation (n = 3). (F) Reduction of differentiation-dependent Csn2 expression at 48 h in HC11 cells treated with mitochondrial ROS scavenger, mitoquinol (mitoQ, 1 μM) from priming through 48 h differentiation (n = 3). (G) Proposed model, demonstrating how loss of ATG7 contributes to STAT5-mediated differentiation-dependent gene expression. U: undifferentiated; P: 24 h primed; h: hours differentiated. Data are presented as mean ± standard deviation. Statistical significance was evaluated with multiple student t-tests relative to the undifferentiated or untreated time point. *p < 0.05, **p < 0.01
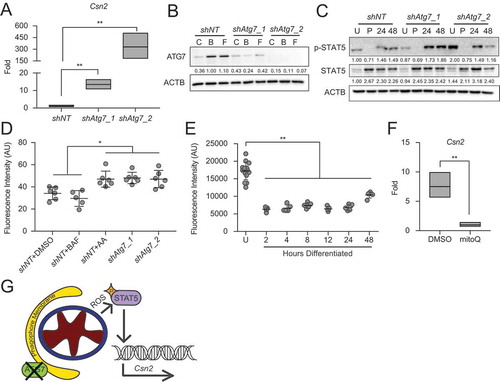
As the role of ROS as a signaling molecule in MEC differentiation is unknown, we investigated the production of mROS across differentiation. We found that proliferating, or undifferentiated (U), HC11 cells produced higher levels of mROS compared to cells that differentiated for 2 to 24 h (). At 48 h, mROS was elevated again and may contribute to the elevated Csn2 expression observed at that time. Importantly, scavenging mROS during differentiation using the antioxidant mitoquinol (mitoQ, 1 μM), which accumulates specifically in mitochondria, resulted in significantly reduced Csn2 induction at 48 h of differentiation (). These studies suggest that STAT5 activation and subsequent induction of Csn2 expression may be due in part to elevated levels of ROS (). Of note, this activation is likely dependent on the state of the cell, as high levels of mROS in undifferentiated HC11 cells did not coincide with elevated p-STAT5 or Csn2 expression.
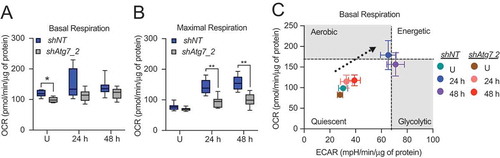
Beyond the unexpected contribution of mROS to differentiation-dependent gene expression, we investigated the impact of Atg7 knockdown on the bioenergetic capacity of differentiating HC11 cells. Basal respiration in undifferentiated shAtg7 cells was significantly reduced compared to shNT cells, but we observed no significant differences at 24 or 48 h of differentiation (). In contrast, maximal respiration at 24 and 48 h of differentiation was significantly reduced with the loss of Atg7 (), suggesting that mitochondria in shAtg7 cells are less functional than those in shNT cells. More importantly, we found that shAtg7 cells exhibited a reduced basal energy phenotype compared to shNT cells at 24 and 48 h of differentiation (), further suggesting that loss of Atg7 indeed impaired the bioenergetic component of MEC differentiation. Finally, although other studies have shown that haploinsufficiency or knockdown of Atg7 in MECs results in enhanced cell death [Citation27,Citation28], we did not observe significant cell death or induction of CASP3 activity during peak differentiation time points in shAtg7 cells (data not shown). This discrepancy could be due in part to compensation by other factors in the phagophore conjugation pathway or incomplete loss of Atg7. Nevertheless, the reduced functionality of mitochondria from shAtg7 cells suggests that Atg7 may be necessary for the metabolic transition associated with HC11 differentiation.
Figure 7. Metabolic transition of differentiating HC11 cells is impaired by loss of Atg7. (A) Basal OCRs and (B) maximal OCRs in shNT and shAtg7_2 HC11 cell lines. (C) Energy phenotypes in shNT and shAtg7_2 HC11 cell lines (n = 2, 9 replicates per experiment). U: undifferentiated; h: hours differentiated. Data are presented as mean ± standard deviation. Box and whisker plots are presented from the 25th to 75th percentile, with the line at the median and the whiskers extending to the minimum and maximum values. Statistical significance was evaluated with student t-tests relative to the shNT cell line. * p < 0.05, ** p < 0.01
Mitophagy is temporally regulated during in vitro differentiation
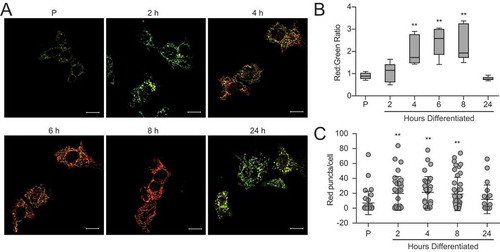
To determine whether the autophagic process observed during the differentiation of HC11 cells involved selective degradation of mitochondria, we employed the fluorescent probe, pMitoTimer [Citation29]. The protein Timer is targeted to mitochondria via a COX8A (cytochrome c oxidase subunit 8A) sequence, initially fluoresces green, and shifts irreversibly to red when mitochondrial proteins are oxidized. A comparison of the ratio of mean red to green fluorescence gives a relative oxidation status, with higher values indicating increased oxidation. The use of this system allowed us to evaluate live-cell images throughout HC11 cell differentiation in real-time (). Quantification of the ratio of mean red to green fluorescent signal intensity revealed that mitochondrial oxidation was elevated in early differentiation (4 to 8 h) and returned to basal levels by 24 h (). This wave of oxidation suggests that programmed mitophagy may be occurring, but is better evaluated by quantification of mitochondria that express only red punctate signal. Importantly, the number of red-only punctate mitochondria increased at early differentiation (2 to 8 h) and began to fall at 24 h (). Along with our autophagy analyses, this data suggests that autophagy, and more specifically mitophagy, is engaged early during differentiation in HC11 cells.
Figure 8. Mitochondria undergo progressive oxidation during HC11 cell differentiation. (A) Representative live-cell images of differentiating HC11 cells transiently transfected with pMitoTimer. Scale bars: 10 μm. (B) Average red to green fluorescent intensity ratio from 10 images per time point. (C) Enumeration of red-only punctate mitochondria from pMitoTimer images, indicating mitochondria actively undergoing mitophagy. A minimum of 10 images were evaluated per time point. Red puncta were not evaluated at 6 h of differentiation, as they were assessed from an independent experiment (n = 3). P: 24 h primed; h: hours differentiated. Data are presented as mean ± standard deviation. Box and whisker plots are presented from the 25th to 75th percentile, with the line at the median and the whiskers extending to the minimum and maximum values. Statistical significance was evaluated with multiple student t-tests relative to the primed time point (P). *p < 0.05, **p < 0.01
Because a balance of mitophagy and biogenesis maintains mitochondrial homeostasis, we also evaluated the expression of the transcription factors that are primarily responsible for mitochondrial protein biogenesis: Ppargc1a (PPARG coactivator 1 alpha) and Tfam (transcription factor A, mitochondrial). The expression of both Ppargc1a and Tfam was low from 4 to 24 h and increased at 48 h (Figure S5A,B). Ppargc1a expression was highest at 48 h, whereas Tfam expression was highest in proliferating cells and from 48 to 96 h. To assess relative mitochondrial content across HC11 MEC differentiation, we normalized mitochondrial DNA to nuclear DNA using previously validated PCR primers [Citation30]. We found that mitochondrial content rose at priming and stayed elevated until 8 h, dropping back to proliferating cell levels for the remainder of differentiation (Figure S5C). Together, these data suggest that a transitionary state exists between early (4–12 h) and peak differentiation (24–48 h) where mitochondrial turnover signals for generation of mitochondrial proteins and mitochondrial content falls back to homeostatic levels. We went on to assess mitochondrial DNA content relative to nuclear DNA in the transitionary state between gestation and lactation in the mouse mammary gland. We found that mitochondrial content was reduced at pregnancy day 18, suggesting that this could be a point of mitochondrial turnover (Figure S5D). However, we acknowledge that this bioenergetic transition may also occur outside of the investigated time frame.
PRKN localizes to the mitochondria of differentiating HC11 cells
Prior to asking whether differentiation in MECs specifically requires mitophagy, we examined the expression of mitophagy mediators during HC11 cell differentiation. As PINK1 (PTEN induced kinase 1) and PRKN are key factors in the most well-characterized mitophagy pathway [Citation31,Citation32], and PRKN has recently been identified as a tumor suppressor in breast cancer [Citation33], we began by examining PRKN expression across HC11 cell differentiation. We found that Prkn expression was significantly elevated at priming in HC11 cells and continued to increase throughout differentiation (). Consistent with gene expression, PRKN protein expression increased dramatically with priming in HC11 cells (). We observed PINK1 expression throughout differentiation, with minimal variation between time points. Interestingly, PRKN expression in mouse mammary tissues was faint in late pregnancy (P16, ) but exhibited diffuse cytoplasmic staining in early lactation (L1, ) before returning to a reduced level in mid-lactation (L7). Similarly, PINK1 expression was observed in late pregnancy and early lactation but was largely absent in mid-lactation.
Figure 9. Pink1 and parkin expression during HC11 cell differentiation and mammary gland development. (A) Expression of Prkn across differentiation in HC11 cells (n = 3). (B) Protein levels of PRKN and PINK1 during HC11 cell differentiation. Levels of PRKN and PINK1 are indicated below each lane after normalization to GAPDH. The undifferentiated sample was set to 1.00, and all other time points are presented relative to 1.00. (C) Immunohistochemical expression of PRKN and PINK1 at pregnancy day 16 (P16), lactation day 1 (L1), and lactation day 7 (L7) in the mouse mammary gland. (D) Higher magnification of cytoplasmic PRKN staining at L1. Two mice were evaluated for each time point, and two sections from each mouse were stained for comparisons. (E) Fractionation of HC11 cell lysates into mitochondrial and cytosolic components and expression of PRKN and PINK1. VDAC1 and TUBA1A expression confirm mitochondrial and cytosolic fraction purity, respectively. Levels of PRKN and PINK1 are indicated below each lane after normalization to VDAC1 for mitochondrial fractions and to TUBA1A for cytosolic fractions. The undifferentiated sample for each fraction was set to 1.00, and all other time points are presented relative to 1.00. (F) JC-1 was used to assess mitochondrial membrane polarization. A minimum of 10 images were evaluated for red and green fluorescent intensity for each time point. FCCP was used as a positive control for membrane depolarization (n = 3). U: undifferentiated; UC: undifferentiated confluent; P: 24 h primed; h: hours differentiated Scale bars: 100 μm. Data are presented as mean ± standard deviation. Statistical significance was evaluated with multiple student t-tests relative to the undifferentiated time point (U). **p < 0.01
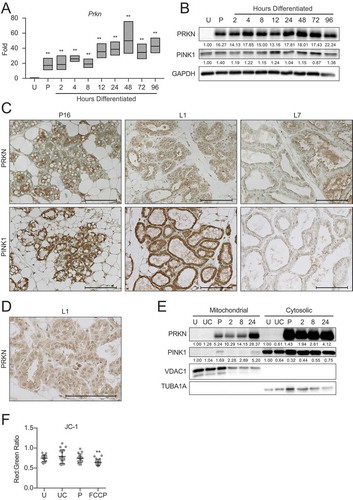
As the upregulation of PRKN and PINK1 expression does not necessarily indicate induction of mitophagy, we fractioned HC11 cells into mitochondrial and cytosolic components at several differentiation time points to observe accumulation of the mitophagy factors at the mitochondria, which would more clearly indicate active mitophagy. Interestingly, PRKN was strongly expressed in both fractions at priming and every differentiation time point. In contrast, although PINK1 was strongly expressed at every time point in the cytosolic fraction, it was only present in the mitochondrial fraction at priming and again at 24 h of differentiation (). Of note, mitochondrial membrane potential remained unaltered during early MEC differentiation between proliferating, confluent, and primed cell states, as evidenced by JC-1 staining (). The addition of FCCP confirmed that membrane depolarization could be detected by a significant reduction of the JC-1 red:green fluorescent signal. This result suggests that PRKN loading at mitochondria does not occur in response to the canonical depolarization-induced accumulation of PINK1 at damaged mitochondria and may instead respond to a developmental signaling cascade. These data suggest that non-canonical PRKN driven mitophagy may be involved in the autophagy initiated during early MEC differentiation.
PRKN is required for HC11 MEC differentiation
Finally, to assess the necessity of the mitophagy factor PRKN in HC11 MEC differentiation, we stably knocked down Prkn using two shRNAs. As proliferating HC11 cells did not substantially express PRKN (), we primed cells for 24 h to confirm the loss of PRKN protein (). Unexpectedly, shPrkn cell lines exhibited apoptotic cell morphology during priming, which we did not observe if we maintained the cells in growth medium for the same length of time (Videos S1-2). One of the shPrkn cell lines, shPrkn_1, consistently underwent cell death during priming, whereas shPrkn_2 cells survived until peak differentiation time points. This observation was quantified and confirmed by significant induction of CASP3 activity at 24 h of priming in shPrkn_1 cells () and at 24 h of differentiation in shPrkn_2 cells (), each compared to shNT cells at the appropriate time point. To determine whether mitochondrial function was affected by the loss of Prkn, we first measured the OCR in proliferating control and shPrkn cell lines. We found that OCRs were significantly reduced in shPrkn cell lines compared to control cells (). As we were interested in the differentiation ability of these cells, we subjected surviving shPrkn_2 cells to extracellular flux analysis at 24 h of differentiation. We found that shPrkn_2 cells had significantly reduced basal respiration at 24 h but exhibited maximal respiration rates comparable to those of shNT cells ().
Figure 10. Loss of Prkn impairs HC11 cell differentiation. (A) PRKN expression in shNT and shPrkn HC11 cell lines at 24 h of priming. Levels of PRKN are indicated below each lane after normalization to ACTB. The shNT sample was set to 1.00, and all other time points are presented relative to 1.00. (B) CASP3 activity in shNT and shPrkn HC11 cell lines at 24 h priming, showing induction of caspase activity in the shPrkn_1 cell line (n = 3). (C) CASP3 activity in shNT and shPrkn_2 cell lines at 24 h of differentiation (n = 3). (D) Basal OCRs in proliferating shNT and shPrkn HC11 cell lines. (E) Basal OCRs in shNT and shPrkn HC11 cell lines at a proliferative (U) state and at 24 h of differentiation. (F) Breakdown of basal and (G) maximal respiration in shNT and shPrkn HC11 cell lines at a proliferative (U) state and at 24 h of differentiation. (H) Energy phenotype profile of basal state shNT and shPrkn HC11 cell lines (n = 2, 9 replicates per experiment). (I) Differentiation-dependent Csn2 expression after loss of Prkn in HC11 cells at 24 h of differentiation (n = 3). Data are presented as mean ± standard deviation. Box and whisker plots are presented from the 25th to 75th percentile, with the line at the median and the whiskers extending to the minimum and maximum values. Statistical significance was evaluated with student t-tests relative to the shNT cell line. **p < 0.01
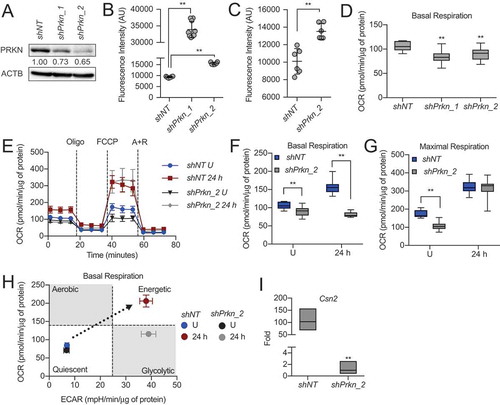
Interestingly, the energy phenotype of these cells revealed that although shPrkn_2 cells were significantly stunted in OCR, ECAR still increased with differentiation (). These results suggest that the loss of Prkn impaired full bioenergetic adaptation and further highlights the complexity of programmed mitophagy. Although we have established that differentiation-dependent gene expression can be uncoupled from other markers of differentiation, we analyzed Csn2 expression with loss of Prkn at 24 h of differentiation. We found that Csn2 expression was significantly reduced in shPrkn_2 cells compared to shNT cells, further suggesting that loss of Prkn impaired total differentiation (). Together, these results suggest that PRKN is a key factor in MEC differentiation and likely contributes to the mitophagy observed during this important bioenergetic transition.
Discussion
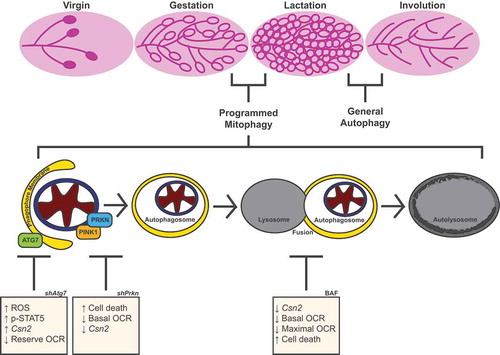
Here, we show that MEC differentiation, defined by differentiation-dependent gene expression, enhanced bioenergetic capacity, and cell survival, is dependent on autophagy. Inhibition of autophagic flux via pharmacological treatment or knockdown of Atg7 impaired one or more of these aspects of MEC differentiation. Moreover, we demonstrated that mitochondria undergo mitophagy during early differentiation, and loss of the mitophagy factor, PRKN, results in impairment of MEC differentiation. Together, these results suggest that mitochondria undergo mitophagy and a bioenergetic transition during early differentiation and that this process ultimately promotes the functional capacity of differentiated MECs ().
Figure 11. Model of MEC functional differentiation. Our results suggest that the transition from gestation to lactation in the mammary gland involves programmed mitophagy. This process relies on the autophagy machinery as well as the mitophagy factor PRKN. The boxes depict the outcomes of Atg7 knockdown, Prkn knockdown, and pharmacological inhibition of autophagy with bafilomycin A1 (BAF). Notably, this form of mitophagy is distinct from the general autophagy that occurs during involution to reset the mammary gland for subsequent rounds of gestation and lactation
To better understand the mechanism of programmed mitophagy, it is necessary to evaluate both the targeting of mitochondria for degradation and the process of autophagic flux itself. As programmed mitophagy targeting and receptors vary widely, we began by investigating autophagic flux and autophagy factors. Autophagic flux occurs in sequential steps: biogenesis of phagophore membranes, selective or nonselective engulfment of cytoplasmic material into autophagosomes, and fusion with lysosomes to form autolysosomes (). To evaluate the requirement of autophagic flux, factors in these steps are often targeted for inhibition or deletion. Based on our findings, we suggest that the specific step targeted may have distinct functional outcomes based on the context of the cell. More specifically, inhibiting autophagic flux at early stages with depletion of ATG7 resulted in divergent gene-expression outcomes compared to late-stage inhibition with BAF or CQ.
BAF and CQ inhibit lysosomal acidification, leading to the accumulation of autophagosomes and preventing autophagic flux. We found that BAF and CQ treatment in HC11 cells completely abrogated functional differentiation. Similarly, BAF-treated myoblasts fail to differentiate [Citation16], and CQ treatment prevents the differentiation-dependent metabolic transition of retinal ganglion cells [Citation14] and significantly stunts the differentiation of adipocytes [Citation34].
Returning to the autophagosome formation step, we next targeted the Atg genes, which are well-known and conserved factors in the autophagy conjugation machinery. Previous work has demonstrated that loss of either Atg5 or Atg7 results in early postnatal lethality [Citation35,Citation36]. Therefore, the majority of mouse studies have utilized conditional knockout models to study specific tissues. Studies that utilize early development models, as in adipocytes and T-cells, report essential roles for ATG5 and ATG7 in reaching functionally differentiated end cell states [Citation34,Citation37]. Adipose-specific loss of both Atg5 and Atg7 impairs adipogenesis and ultimately results in significantly reduced white adipose deposits [Citation34,Citation37,Citation38]. Similarly, mature T lymphocytes are significantly reduced in Atg7 conditional knockout mice, and the naïve T-cells that do develop exhibit increased apoptosis [Citation39].
In contrast, knockout of Atg5 or Atg7 in mature cell states, such as the heart [Citation40] and muscle [Citation41], results in phenotypes that are exacerbated when additional stress is applied; however, neuronal deletion of Atg5 results in neurodegeneration without additional stress and suggests that basal autophagy is vital in neurons [Citation42]. This observation is not surprising in light of the many neurodegenerative diseases with root causes arising from defects in autophagy processes. Genetic loss of Atg5 and Atg7 has not been specifically studied in lactation; thus, our results are the first to suggest that loss of Atg7 impairs HC11 MEC bioenergetic capacity and implies a similar requirement for autophagy during the differentiation of these cells. It would be of interest to target these factors during postnatal mammary gland development to confirm the in vivo requirement of the autophagy conjugation system.
Of note, the loss of Atg5 and Atg7 in HC11 cells resulted in a disconnect between the differentiation-dependent gene expression and bioenergetic responses. We found that this disconnect resulted from the unexpected contribution of ROS signaling to Csn2 expression (). ROS production following autophagy inhibition at the early stages of autophagic flux results from the accumulation of mitochondria [Citation43]. Moreover, ROS can mediate signaling cascades and activate the STAT family of nuclear transcription factors [Citation25,Citation26]. Indeed, STAT5, a master regulator of lactation gene expression, was increasingly activated in shAtg7 cells, and Atg7 knockdown, but not BAF treatment, resulted in significantly elevated levels of mROS.
Further, scavenging mROS in HC11 cells with mitoquinol resulted in significantly reduced Csn2 expression at 48 h of differentiation and did not affect cell viability (data not shown). Consistent with our findings, adipocyte differentiation enhances mitochondrial ROS production, which leads to the induction of PPARG transcriptional signaling [Citation44]. Although ROS generation is classically regarded as a damaging event, our findings, as well as those of others, add to the notion that moderately elevated ROS serve as signaling molecules and may contribute to cellular differentiation [Citation43].
To further define the contribution of mitophagy during MEC differentiation, we sought to address the mechanism of mitochondrial targeting. Recently, several mitophagy factors have been identified, including PINK1, PRKN, BNIP3L/NIX (BCL2 interacting protein 2 like), BNIP3 (BCL2 interacting protein 3), and FUNDC1 (FUN14 domain containing 1). Although none of these factors have been characterized in the lactating mammary gland, loss of PRKN [Citation33] or BNIP3 [Citation45] has been associated with breast cancer progression through the upregulation of HIF1A (hypoxia inducible factor 1 subunit alpha). Interestingly, both BNIP3 [Citation46] and BNIP3L [Citation47] contribute to PINK1/PRKN-mediated mitophagy. Based on these connections, we evaluated PRKN as a potential mitophagy factor during MEC differentiation. Although PRKN expression was non-existent in undifferentiated HC11 cells, strikingly similar to observations in SH-SY5Y and HeLa cell lines [Citation31,Citation47], we found substantial induction of PRKN expression in both total and mitochondrial cell fractions during priming and throughout differentiation. Importantly, this localization did not coincide or follow a mitochondrial depolarization event, as JC-1 ratios indicated no change in the accumulation of JC-1 aggregates between proliferative, confluent, and primed HC11 cell states (). These observations suggest that mitochondrial localization of PRKN occurs independently of the canonical depolarization-induced accumulation of PINK1 on damaged mitochondria. Instead, we propose that a yet-to-be-identified developmental signaling cascade is responsible for PRKN loading and programmed mitophagy in this system.
To further evaluate the contribution of PRKN to HC11 MEC differentiation, we stably expressed shRNA constructs that target Prkn in HC11 cells. Surprisingly, knockdown of Prkn resulted in cell death throughout differentiation but not in cell death in confluent cells maintained for the same length of time (Videos S1 and S2). Similar cell death occurs with loss or mutation of Prkn in mouse cardiomyocytes [Citation15] and dopaminergic neurons of Parkinson disease patients [Citation48], respectively. We can only speculate that the observed cell death could be due to the absence of vital PRKN-mediated mitophagy or PRKN-mediated function unrelated to mitophagy that occurs during the same time frame. Nevertheless, we found a reduced bioenergetic capacity of HC11 MECs lacking Prkn compared to control cells, and energy phenotypes differed from those observed after loss of Atg7. Both OCR and ECAR were stunted in shAtg7_2 cells (), whereas shPrkn_2 cells only exhibited reduced OCRs (). This observation again points to the complexity of interpreting results following perturbation of autophagic flux and suggests that both the developmental context and stage of autophagy inhibition are important factors.
The mammary gland is a unique tissue that undergoes successive rounds of proliferation during gestation, nutrient production during lactation, and regression during involution. Thus far, evaluation of autophagy during MEC differentiation is limited to acinar development in vitro [Citation49] and the early stages of involution both in vivo and in vitro [Citation50–52]. Interestingly, only the early reversible phase of involution involves autophagy, whereas the later irreversible phase is associated with lysosomal-mediated cell death. Autophagy induction during early involution is hypothesized to promote cell survival if lactation stimulus recurs. Induction of autophagy during the early phase involution relies on STAT3 [Citation21]. STAT3 is expressed across mammary gland development and is dramatically activated by tyrosine phosphorylation during involution [Citation53]. Consistent with these studies, we did not detect activation of STAT3 during late pregnancy or mid-lactation; however, we did observe induction of nuclear p-STAT3 at lactation day 1, which has never been evaluated to our knowledge.
Moreover, HC11 cells express p-STAT3 specifically at priming, the transitional stage between undifferentiated and differentiated cells. As loss of Stat3 results in embryonic lethality, conditional knockout models have been developed to conditionally delete Stat3 from the mammary epithelium using Wap or BLG (beta-lactoglobulin) promoter-driven Cre recombinase expression. Conditional Stat3 deletion in the mammary epithelium results in delayed involution and retention of mammary alveolar cells in the absence of lactational stimuli [Citation54]. Although it was suggested that STAT3-mediated autophagy is associated with cell survival [Citation55], the identity of the upstream signaling cascade and the effect of STAT3 deletion on autophagy remain unknown. To further complicate the delineation of the STAT3-mediated autophagy response, STAT3 has been shown to inhibit autophagy through a variety of transcriptional and non-transcriptional mechanisms in other tissues and is known to localize to the nucleus, cytoplasm, and mitochondria [Citation56]. Thus, due to the complexity of STAT3 localization and activation, STAT3 function appears to be highly context-dependent.
Based on previous work in the mammary gland and our observation that p-STAT3 was induced during early lactation in mouse mammary tissues as well as at priming in HC11 cells, it is tempting to postulate that STAT3 may contribute to the autophagy response described here. Of note, mice lacking Stat3 in the mammary epithelium from mid-pregnancy through involution do not display developmental abnormalities and lactate normally [Citation54]. Thus, if functional differentiation of MECs indeed requires programmed mitophagy, it is unlikely that STAT3 is the sole mediator of this response. The different outcomes between general autophagy during involution and the programmed mitophagy reported here point to the relevance of the developmental context in deciphering the complex mechanisms that coordinate these processes. Indeed, it is likely that the general autophagy observed during involution is distinct from the programmed mitophagy described here in terms of biological context, function, and mechanism. It is also worth noting that programmed mitophagy may be initiated much earlier in mouse mammary gland development than what has been captured in the present study or by the current Stat3 conditional knock out models. Additional study will be necessary to fully delineate the upstream signaling responsible for the induction of autophagy during early MEC differentiation.
In summary, we propose that programmed mitophagy is the bioenergetic mechanism responsible for the necessary metabolic transition during MEC differentiation. To our knowledge, this is the first work to address the dramatic differences in mitochondria and mitochondrial function in pregnant and lactating mouse mammary glands [Citation5,Citation6]. Importantly, mammary gland development is largely postnatal, and our work suggests that the mammary gland provides a unique physiological model to study programmed mitophagy without the application of chemicals or nutrient starvation. Future work will be necessary to confirm the in vivo requirement of programmed mitophagy during mammary gland development as well as to further define the upstream developmental signals that engage programmed mitophagy. Nevertheless, our results offer insight into the establishment and maintenance of lactation, with implications for future studies of mitochondrial dysfunction and disease in the mammary gland.
Materials and methods
Animals
All mice were housed under a standard 12-h photoperiod and provided access to food and water ad libitum. Three to five female FVB mice were analyzed for each developmental time point. Mice were sacrificed by CO2 asphyxiation followed immediately by cervical dislocation. The fourth inguinal mammary glands were harvested at pregnancy days 6, 16, and 18, lactation days 1, 7, and 10, and 72 h after forced involution [Citation57]. Glands were used for histological sectioning, RNA isolation, and TEM. All procedures were approved by and followed the guidelines of the Texas A&M University Animal Use and Care Committee.
Cell culture
HC11 cells were purchased from the American Type Culture Collection (ATCC, CRL-3062). Cells were maintained and differentiated, as previously described [Citation20]. Briefly, lactogenic differentiation was achieved by incubating confluent cells in priming media (RPMI 1640, HEPES [Thermo Fisher Scientific, 42401018] containing 10% charcoal-stripped horse serum [Atlanta Biologicals, S12150] and supplemented with 50 µg/ml gentamicin [Thermo Fisher Scientific, 15750078], 5 µg/ml bovine insulin [Sigma-Aldrich, I5500], 1 µg/ml hydrocortisone [Sigma-Aldrich, H0888]). After 24-h incubation in priming media, media was replaced with priming media containing 1 µg/ml ovine prolactin (National Hormone and Peptide Program, oPRL-21). Addition of prolactin was considered the initiation of differentiation and was timed from this point on. Bafilomycin A1 (6.25, 12.5, 25, and 100 nM; Cayman Chemical Company, 11038–500), chloroquine (10 and 20 nM; Sigma-Aldrich, C6628), and mitoquinol (1 μM; Cayman Chemical Company, 845959-55-9) were applied in the priming media and maintained for differentiation time points or for 24 h for primed or undifferentiated time points. Live-cell videos were collected on a Zeiss Cell Discoverer 7 (Oberkochen, Germany) at 15-min intervals. Videos are presented at a playback speed of five frames per second, and the time codes represent the duration of maintenance or priming, as indicated.
Short hairpin RNA (shRNA) constructs were stably introduced into cells, as previously described [Citation58]. Two constructs targeting different regions of the target transcript were used as follows: shAtg7_1 (TRCN0000092163), shAtg7_2 (TRCN0000092166), shAtg5_1 (TRCN0000099431), shAtg5_2 (TRCN0000099432), shPrkn_1 (TRCN0000041144), and shPrkn_2 (TRCN0000041145). All constructs were purchased from Sigma-Aldrich and compared to the pLKO.1-puro non-targeting control construct (shNT). Following viral transduction, puromycin selection (2 μg/ml; Sigma-Aldrich, P8833) was maintained for one week, and cells were used for experiments between 14 and 28 d post-transduction [Citation59].
Cellular respiration and glycolysis
Cellular respiration was analyzed on a Seahorse XFe96 Bioanalyzer (Agilent Technologies, Santa Clara, CA, USA). Briefly, cells were seeded at a density of 10,000 per well, growth media was replaced with priming media once cells reached confluence, and the media was again replaced by priming media containing prolactin after 24 h, as described above. The Seahorse XF Cell Mito Stress Test Kit (Agilent Technologies, 103015–100) was used to measure the oxygen consumption rate (OCR) and the extracellular acidification rate (ECAR), according to the manufacturer’s protocol with two exceptions; oligomycin was used at a final concentration of 1.5 µM, and FCCP was used at a final concentration of 1 µM. Cell number was normalized to the protein content of each well, measured by DC protein assay (Bio-Rad, 5000112). Mean OCR and ECAR values from a minimum of nine replicates per group were compared. As there are no current standards for energy phenotype quadrants, ranges were assigned based on the transition of the control cells. Specifically, consecutive time points were compared by student’s t-test, and quadrants were assigned where the least significant difference between consecutive time points occurred, which indicates a static or change point during the metabolic transition.
RNA isolation and quantitative real-time PCR (qPCR)
High Pure RNA Isolation Kits (Roche, 11828665001) were used to extract total RNA from cells and tissues per the manufacturer’s protocols. Reverse transcription was performed with 1 µg total RNA using the iScript cDNA Synthesis Kit (Bio-Rad, 1708891BUN). Subsequent qPCR was performed with 1 µl of cDNA, 1 µM forward and reverse primer mix, and 5 GoTaq qPCR Master Mix (Promega, A6002) on a CFX384 qPCR (Bio-Rad, Hercules, CA, USA). Primers were synthesized by Integrative DNA Technologies, and the primer sequences are listed in . The
Ct method was used to analyze qPCR data, and normalization was performed relative to Actb. The standard deviation of the target gene and reference gene Ct values were used to calculate the sum of squares of the standard deviation of each group. This value was used to find the positive and negative errors. The
Ct, positive error, and negative error values were then log-transformed and presented as the fold
1 standard deviation. Statistical analyses were performed on the
Ct values.
Table 1. Primer list
Immunoblotting
Protein was isolated from cells, as previously described [Citation60]. Tissues were powdered under liquid nitrogen, washed with cold PBS (137 mM NaCl, 2.7 mM KCl, 10mM Na2HPO4O, 2 mM KH2PO4O, pH 7.4), and lysed in high salt lysis buffer containing 50 mM HEPES (Sigma-Aldrich, H3375), 500 mM NaCl (Sigma-Aldrich, S7653), 1.5 mM EDTA (Sigma-Aldrich, E5134), 10% glycerol (Sigma-Aldrich, G5516), 1% Triton X-100 (Sigma-Aldrich, T8787), 1 mM Na3VO4 (Sigma-Aldrich, S6508), and 1 mM complete ULTRA tablets mini EDTA-free Easy Pack (Roche, 5892791001) at pH 7.5. Cell and tissue protein concentrations were assessed by DC protein assay (Bio-Rad, 5000112). Equivalent amounts of protein were combined with 6 Laemmli buffer (250 mM Tris-HCl [Sigma-Aldrich, T5941], 8% SDS [Sigma-Aldrich, L3771], 40% glycerol [Sigma-Aldrich, G5516], 0.4 M dithiothreitol [Fisher Scientific, BP172-5], pH 6.8) and heated at 95°C for 5 min prior to loading on 10% or 15% SDS-PAGE gels. Western blotting was performed as previously described [Citation60], and the antibodies used are listed in . Bands were visualized with enhanced chemiluminescence reagent (Genesee Scientific, 20-300S) and digitized on a ChemiDoc MP Imaging System (Bio-Rad). Band intensities were measured using Fiji (version 2.0.0, NIH) and normalized first to the loading control. These normalized values were normalized again to the control sample for each experiment, resulting in a value of 1.00 for control samples. Western blots are representative of a minimum of three independent experiments.
Table 2. Antibody list
MitoTimer
HC11 cells were transiently transfected with 2.5 µg of pMitoTimer (Addgene, 52659, deposited by the Zhen Yan Lab) in 500 μl of Opti-MEM (Thermo Fisher Scientific, 31985–062) and 10 μl of GeneJuice (EMD Millipore, 70967–3) for 24 h. Following transfection, cells were washed, and appropriate media was replaced. Live cell imaging was performed in Nunc Lab-Tek 2-well chamber slides (Thermo Fisher Scientific, 155380) on a Zeiss LSM 780 NLO Multiphoton Microscope with a 63 plan-apochromat objective. Subsequent image analysis was performed with ImageJ (NIH) and a custom python script. The methodology was based on existing studies [Citation29]. Briefly, saturated pixels (gray level = 255) were excluded, and single-channel means intensities were measured. For each image, the mean RFP signal intensity was divided by the mean GFP signal intensity. Finally, the mean ratios were compared between time points. To evaluate red-only punctate mitochondria, saturated pixels (gray level = 255) were removed, and the low red signal was excluded at a threshold of >175. Positive regions were watershed, and red dots of greater than 20 pixels and with signal intensity 2.5
greater than green intensity were considered positive mitochondria. Accuracy of automated counting was confirmed, and the average number of positive mitochondria per cell was calculated and compared between time points.
Transmission electron microscopy
Monolayer cells and tissues pieces measuring 1 mm 1 mm were fixed in 2% glutaraldehyde (Electron Microscopy Sciences, 16020) and 2.5% formaldehyde (Electron Microscopy Sciences, 15686) in 0.1 M sodium cacodylate buffer (Electron Microscopy Sciences, 12300) for 1 h at room temperature followed by overnight fixation at 4°C. The next morning, samples were washed and stored in 0.1 M sodium cacodylate buffer until processing by Dr. H. Ross Payne in the Image Analysis Lab of the College of Veterinary Medicine at Texas A&M University. Briefly, samples were post-fixed in 1% OsO4 and 1% K4(Fe[CN]6) in 0.1 M sodium cacodylate buffer for 1 h at room temperature and then washed twice in 0.1 M sodium cacodylate buffer. Dehydration was performed in graded ethanol (30%, 50%, 70%, 80%, 90%, 95%, and 100%), and samples were rinsed twice in propylene oxide and embedded in epoxy resin. Ultrathin sections were cut on a Leica EM UC6 Ultramicrotome (Wetzlar, Germany) and post-stained with uranyl acetate and lead citrate. Images were collected on a Morgagni 268 transmission electron microscope (FEI, Eindhoven, The Netherlands), and additional image analysis was performed with ImageJ. All images were auto-corrected for contrast using identical parameters.
ROS, CASP3 (caspase 3) activity, and JC-1 assays
Mitochondrial derived ROS was measured using mitoSOX (Thermo Fisher Scientific, M36008) according to the manufacturer’s instruction. Fluorescent analysis was performed using a FACSCalibur flow cytometer (BD Biosciences, San Jose, CA, USA) with biological triplicates at a minimum (time course data) or with a BioTek Synergy microplate reader (Winooski, VT, USA) with six biological replicates at a minimum (cell line comparisons). Fluorescent intensity was compared between groups. CASP3 activity was assessed using the EnzChek Caspase 3 Assay Kit #2 (Thermo Fisher Scientific, E-13,184) according to the manufacturer’s protocol. Activity was measured by fluorescent intensity on a BioTek Synergy microplate reader, and mean values were compared between groups. For JC-1 analyses, cells were grown to the indicated state (undifferentiated, confluent, or primed for 24 h) on Nunc Lab-Tek 2-well chamber slides (Thermo Fisher Scientific, 155380). FCCP (1 µM, Sigma-Aldrich, C2920) was used as a positive control to induce membrane depolarization. Cells were incubated with 10 µM JC-1 (Thermo Fisher Scientific, T3168) for 30 min, washed twice with PBS, and imaged in phenol red-free media on a Zeiss LSM 780 NLO Multiphoton Microscope with a 63 plan-apochromat objective. A minimum of 10 images were taken at each time point, and the experiment was repeated three times. Subsequent image analysis was performed with ImageJ (NIH). For each image, the mean RFP signal intensity was divided by the mean GFP signal intensity, and the mean ratios were compared between time points.
Immunostaining tissue sections
Collected tissues were fixed in 4% paraformaldehyde (Santa Cruz Biotechnology, sc-281692) overnight, washed in cold PBS, and stored in 70% ethanol until processing by the Texas A&M University Veterinary Medicine & Biomedical Science Histology Laboratory. Immunostaining was performed on unstained sections, as previously described [Citation61]. The antibodies and dilutions used are listed in . Images were collected on a Zeiss Axio Imager.Z1 with a 40 or 63
plan-apochromat objective.
Statistical analysis
All experiments were done biological triplicates with technical duplicates at a minimum, and each comparison was performed in a minimum of two independent assays. Box and whisker plots are presented from the 25th to 75th percentile, with the line at the median and the whiskers extending to the minimum and maximum values. Energy phenotypes, mitoSOX, CASP3 activity, and pMitoTimer analyses are presented as the mean ± the standard deviation (SD). Statistical analyses were performed with JMP Pro (version 14.1.0, SAS Institute Inc.) or Prism (version 7.0c, GraphPad Software). Prior to conducting two-tailed Student’s t-tests, normal distribution was confirmed, and p < 0.05 was considered statistically significant.
Supplemental Material
Download Zip (35.1 MB)Disclosure statement
No potential conflict of interest was reported by the authors.
Supplemental material
Supplemental data for this article can be accessed here.
Additional information
Funding
References
- Hennighausen L, Robinson GW, Wagner KU, et al. Prolactin signaling in mammary gland development. J Biol Chem. 1997;272(12):7567–7569.
- Rudolph MC, McManaman JL, Phang T, et al. Metabolic regulation in the lactating mammary gland: a lipid synthesizing machine. Physiol Genomics. 2007;28(3):323–336.
- Watson JA, Lowenstein JM. Citrate and the conversion of carbohydrate into fat. Fatty acid synthesis by a combination of cytoplasm and mitochondria. J Biol Chem. 1970;245(22):5993–6002.
- Shipman LJ, Docherty AH, Knight CH, et al. Metabolic adaptations in mouse mammary gland during a normal lactation cycle and in extended lactation. Q J Exp Physiol. 1987;72(3):303–311.
- Rosano TG, Jones DH. Developmental changes in mitochondria during the transition into lactation in the mouse mammary gland. J Cell Biol. 1976;69(3):573–580.
- Rosano TG, Lee SK, Jones DH. Developmental changes in mitochondria during the transition into lactation in the mouse mammary gland. II. Membrane marker enzymes and membrane ultrastructure. J Cell Biol. 1976;69(3):581–588.
- Nelson WL, Butow RA, Ciaccio EI. Oxidative phosphorylation in guinea pig mammary gland mitochondria during various functional states. Arch Biochem Biophys. 1962;96:500–505.
- Alex AP, Collier JL, Hadsell DL, et al. Milk yield differences between 1x and 4x milking are associated with changes in mammary mitochondrial number and milk protein gene expression, but not mammary cell apoptosis or SOCS gene expression. J Dairy Sci. 2015;98(7):4439–4448.
- Hadsell DL, Olea W, Wei J, et al. Developmental regulation of mitochondrial biogenesis and function in the mouse mammary gland during a prolonged lactation cycle. Physiol Genomics. 2011;43(6):271–285.
- Hadsell DL, Torres D, George J, et al. Changes in secretory cell turnover, and mitochondrial oxidative damage in the mouse mammary gland during a single prolonged lactation cycle suggest the possibility of accelerated cellular aging. Exp Gerontol. 2006;41(3):271–281.
- Mowry AV, Donoviel ZS, Kavazis AN, et al. Mitochondrial function and bioenergetic trade-offs during lactation in the house mouse (Mus musculus). Ecol Evol. 2017;7(9):2994–3005.
- Friedman JR, Nunnari J. Mitochondrial form and function. Nature. 2014;505(7483):335–343.
- Altshuler-Keylin S, Shinoda K, Hasegawa Y, et al. Beige adipocyte maintenance is regulated by autophagy-induced mitochondrial clearance. Cell Metab. 2016;24(3):402–419.
- Esteban-Martinez L, Sierra-Filardi E, McGreal RS, et al. Programmed mitophagy is essential for the glycolytic switch during cell differentiation. Embo J. 2017;36(12):1688–1706.
- Gong G, Song M, Csordas G, et al. Parkin-mediated mitophagy directs perinatal cardiac metabolic maturation in mice. Science. 2015;350(6265):aad2459.
- Sin J, Andres AM, Taylor DJ, et al. Mitophagy is required for mitochondrial biogenesis and myogenic differentiation of C2C12 myoblasts. Autophagy. 2016;12(2):369–380.
- Rodger CE, McWilliams TG, Ganley IG. Mammalian mitophagy - from in vitro molecules to in vivo models. Febs J. 2018;285(7):1185–1202.
- Sandoval H, Thiagarajan P, Dasgupta SK, et al. Essential role for Nix in autophagic maturation of erythroid cells. Nature. 2008;454(7201):232–235.
- Song WH, Yi YJ, Sutovsky M, et al. Autophagy and ubiquitin-proteasome system contribute to sperm mitophagy after mammalian fertilization. Proc Natl Acad Sci U S A. 2016;113(36):E5261–5270.
- Wellberg E, Metz RP, Parker C, et al. The bHLH/PAS transcription factor singleminded 2s promotes mammary gland lactogenic differentiation. Development. 2010;137(6):945–952.
- Kreuzaler PA, Staniszewska AD, Li W, et al. Stat3 controls lysosomal-mediated cell death in vivo. Nat Cell Biol. 2011;13(3):303–309.
- Cogliati S, Frezza C, Soriano ME, et al. Mitochondrial cristae shape determines respiratory chain supercomplexes assembly and respiratory efficiency. Cell. 2013;155(1):160–171.
- Klionsky DJ, Abdalla FC, Abeliovich H, et al. Guidelines for the use and interpretation of assays for monitoring autophagy. Autophagy. 2012;8(4):445–544.
- Cecconi F, Levine B. The role of autophagy in mammalian development: cell makeover rather than cell death. Dev Cell. 2008;15(3):344–357.
- Nakajima H, Takenaka M, Kaimori JY, et al. Activation of the signal transducer and activator of transcription signaling pathway in renal proximal tubular cells by albumin. J Am Soc Nephrol. 2004;15(2):276–285.
- Simon AR, Rai U, Fanburg BL, et al. Activation of the JAK-STAT pathway by reactive oxygen species. Am J Physiol. 1998;275(6):C1640–1652.
- Warri A, Cook KL, Hu R, et al. Autophagy and unfolded protein response (UPR) regulate mammary gland involution by restraining apoptosis-driven irreversible changes. Cell Death Discov. 2018;4:40.
- Fung C, Lock R, Gao S, et al. Induction of autophagy during extracellular matrix detachment promotes cell survival. Mol Biol Cell. 2008;19(3):797–806.
- Laker RC, Xu P, Ryall KA, et al. A novel MitoTimer reporter gene for mitochondrial content, structure, stress, and damage in vivo. J Biol Chem. 2014;289(17):12005–12015.
- Yamamoto T, Takabatake Y, Kimura T, et al. Time-dependent dysregulation of autophagy: implications in aging and mitochondrial homeostasis in the kidney proximal tubule. Autophagy. 2016;12(5):801–813.
- Narendra D, Tanaka A, Suen DF, et al. Parkin is recruited selectively to impaired mitochondria and promotes their autophagy. J Cell Biol. 2008;183(5):795–803.
- Youle RJ, Narendra DP. Mechanisms of mitophagy. Nat Rev Mol Cell Biol. 2011;12(1):9–14.
- Liu J, Zhang C, Zhao Y, et al. Parkin targets HIF-1alpha for ubiquitination and degradation to inhibit breast tumor progression. Nat Commun. 2017;8(1):1823.
- Baerga R, Zhang Y, Chen PH, et al. Targeted deletion of autophagy-related 5 (atg5) impairs adipogenesis in a cellular model and in mice. Autophagy. 2009;5(8):1118–1130.
- Kuma A, Hatano M, Matsui M, et al. The role of autophagy during the early neonatal starvation period. Nature. 2004;432(7020):1032–1036.
- Komatsu M, Waguri S, Ueno T, et al. Impairment of starvation-induced and constitutive autophagy in Atg7-deficient mice. J Cell Biol. 2005;169(3):425–434.
- Singh R, Kaushik S, Wang Y, et al. Autophagy regulates lipid metabolism. Nature. 2009;458(7242):1131–1135.
- Zhang Y, Goldman S, Baerga R, et al. Adipose-specific deletion of autophagy-related gene 7 (atg7) in mice reveals a role in adipogenesis. Proc Natl Acad Sci U S A. 2009;106(47):19860–19865.
- Pua HH, Guo J, Komatsu M, et al. Autophagy is essential for mitochondrial clearance in mature T lymphocytes. J Immunol. 2009;182(7):4046–4055.
- Nakai A, Yamaguchi O, Takeda T, et al. The role of autophagy in cardiomyocytes in the basal state and in response to hemodynamic stress. Nat Med. 2007;13(5):619–624.
- Masiero E, Agatea L, Mammucari C, et al. Autophagy is required to maintain muscle mass. Cell Metab. 2009;10(6):507–515.
- Hara T, Nakamura K, Matsui M, et al. Suppression of basal autophagy in neural cells causes neurodegenerative disease in mice. Nature. 2006;441(7095):885–889.
- Hamanaka RB, Chandel NS. Mitochondrial reactive oxygen species regulate cellular signaling and dictate biological outcomes. Trends Biochem Sci. 2010;35(9):505–513.
- Tormos KV, Anso E, Hamanaka RB, et al. Mitochondrial complex III ROS regulate adipocyte differentiation. Cell Metab. 2011;14(4):537–544.
- Chourasia AH, Tracy K, Frankenberger C, et al. Mitophagy defects arising from BNip3 loss promote mammary tumor progression to metastasis. EMBO Rep. 2015;16(9):1145–1163.
- Lee Y, Lee HY, Hanna RA, et al. Mitochondrial autophagy by Bnip3 involves Drp1-mediated mitochondrial fission and recruitment of Parkin in cardiac myocytes. Am J Physiol Heart Circ Physiol. 2011;301(5):H1924–1931.
- Ding WX, Ni HM, Li M, et al. Nix is critical to two distinct phases of mitophagy, reactive oxygen species-mediated autophagy induction and Parkin-ubiquitin-p62-mediated mitochondrial priming. J Biol Chem. 2010;285(36):27879–27890.
- Kitada T, Asakawa S, Hattori N, et al. Mutations in the parkin gene cause autosomal recessive juvenile parkinsonism. Nature. 1998;392(6676):605–608.
- Zielniok K, Motyl T, Gajewska M. Functional interactions between 17 beta -estradiol and progesterone regulate autophagy during acini formation by bovine mammary epithelial cells in 3D cultures. Biomed Res Int. 2014;2014:382653.
- Sobolewska A, Gajewska M, Zarzynska J, et al. IGF-I, EGF, and sex steroids regulate autophagy in bovine mammary epithelial cells via the mTOR pathway. Eur J Cell Biol. 2009;88(2):117–130.
- Sobolewska A, Motyl T, Gajewska M. Role and regulation of autophagy in the development of acinar structures formed by bovine BME-UV1 mammary epithelial cells. Eur J Cell Biol. 2011;90(10):854–864.
- Zielniok K, Sobolewska A, Gajewska M. Mechanisms of autophagy induction by sex steroids in bovine mammary epithelial cells. J Mol Endocrinol. 2017;59(1):29–48.
- Philp JA, Burdon TG, Watson CJ. Differential activation of STATs 3 and 5 during mammary gland development. FEBS Lett. 1996;396(1):77–80.
- Humphreys RC, Bierie B, Zhao L, et al. Deletion of Stat3 blocks mammary gland involution and extends functional competence of the secretory epithelium in the absence of lactogenic stimuli. Endocrinology. 2002;143(9):3641–3650.
- Pensa S, Lloyd-Lewis B, Sargeant TJ, et al. Signal transducer and activator of transcription 3 and the phosphatidylinositol 3-kinase regulatory subunits p55alpha and p50alpha regulate autophagy in vivo. Febs J. 2014;281(20):4557–4567.
- You L, Wang Z, Li H, et al. The role of STAT3 in autophagy. Autophagy. 2015;11(5):729–739.
- Scribner KC, Wellberg EA, Metz RP, et al. Singleminded-2s (Sim2s) promotes delayed involution of the mouse mammary gland through suppression of Stat3 and NFkappaB. Mol Endocrinol. 2011;25(4):635–644.
- Laffin B, Wellberg E, Kwak HI, et al. Loss of singleminded-2s in the mouse mammary gland induces an epithelial-mesenchymal transition associated with up-regulation of slug and matrix metalloprotease 2. Mol Cell Biol. 2008;28(6):1936–1946.
- Staskiewicz L, Thorburn J, Morgan MJ, et al. Inhibiting autophagy by shRNA knockdown: cautions and recommendations. Autophagy. 2013;9(10):1449–1450.
- Pearson SJ, Roy Sarkar T, McQueen CM, et al. ATM-dependent activation of SIM2s regulates homologous recombination and epithelial-mesenchymal transition. Oncogene. 2019;38(14):2611–2626.
- McQueen CM, Schmitt EE, Sarkar TR, et al. PER2 regulation of mammary gland development. Development. 2018;145(6):dev157966.