
ABSTRACT
Macroautophagy/autophagy is indispensable for testosterone synthesis in Leydig cells (LCs), and here we report a negative association between m6A modification and autophagy in LCs during testosterone synthesis. A gradual decrease of METTL14 (methyltransferase like 14) and an increase of ALKBH5 (alkB homolog 5, RNA demethylase) were observed in LCs during their differentiation from stem LCs to adult LCs. These events led to reduced mRNA methylation levels of N6-methyladenosine (m6A) and enhanced autophagy in LCs. Similar regulation of METTL14, ALKBH5, and m6A was also observed in LCs upon treatment with human chorionic gonadotropin (HsCG). Mechanistically, m6A modification promoted translation of PPM1A (protein phosphatase 1A, magnesium dependent, alpha isoform), a negative AMP-activated protein kinase (AMPK) regulator, but decreased expression of CAMKK2 (calcium/calmodulin-dependent protein kinase kinase 2, beta), a positive AMPK regulator, by reducing its RNA stability. Thus, m6A modification resulted in reduced AMPK activity and subsequent autophagy inhibition. We further demonstrated that ALKBH5 upregulation by HsCG was dependent on enhanced binding of the transcriptional factor CEBPB (CCAAT/enhancer binding protein [C/EBP], beta) and the TFEB (transcription factor EB) to its gene promoter. Moreover, HsCG treatment decreased METTL14 by reducing its stability. Collectively, this study highlights a vital role of m6A RNA methylation in the modulation of testosterone synthesis in LCs, providing insight into novel therapeutic strategies by exploiting m6A RNA methylation as targets for treating azoospermatism and oligospermatism patients with reduction in serum testosterone.
Abbreviations: 3-MA: 3-methyladenine; ACTB: Actin, beta; ALKBH5: alkB homolog 5, RNA demethylase; AMPK: AMP-activated protein kinase; BafA1: bafilomycin A1; CAMKK2: calcium/calmodulin-dependent protein kinase kinase 2, beta; CEBPB: CCAAT/enhancer-binding protein (C/EBP), beta; ChIP: chromatin immunoprecipitation; FTO: fat mass and obesity associated; HsCG: human chorionic gonadotropin; HSD3B: 3β-hydroxysteroid dehydrogenase; LCs: Leydig cells; m6A: N6-methyladenosine; METTL14: methyltransferase like 14; METTL3: methyltransferase like 3; MTOR: mechanistic target of rapamycin kinase; PPM1A: protein phosphatase 1A, magnesium dependent, alpha isoform; PRKAA: 5ʹ-AMP-activated protein kinase catalytic subunit alpha; SQSTM1: sequestosome 1; STK11/LKB1: serine/threonine kinase 11; TFEB: transcription factor EB; ULK1: unc-51-like kinase 1; WTAP: Wilms tumor 1-associating protein; YTHDF: YTH N6-methyladenosine RNA binding protein
Introduction
Testosterone, an important male hormone, is required for male sexual development and characteristic maintenance [Citation1,Citation2], and its deficiency usually causes male sexual dysfunction and reduced reproductive capacity [Citation3,Citation4]. Moreover, some late-onset hypogonadism symptoms, including a decrease in lean body mass, diabetes, a decline in bone mineral density, cardiovascular disease, and sleep disturbances, are observed in males with a deficiency in serum testosterone [Citation1,Citation5,Citation6]. Leydig cells (LCs), residing in the testis interstitium, are the primary source of testosterone in males [Citation7]. During the development of mammals from infancy to adulthood, four distinct developmental stages of LCs, including stem LCs, progenitor LCs, immature LCs, and adult LCs, have been characterized [Citation7]. Undifferentiated stem LCs are capable of doing indefinite self-renewal and differentiating to progenitor LCs that share the capacity to produce minimal levels of androgen. Moreover, progenitor LCs continue to differentiate into immature LCs with a higher level of biosynthetic activity of testosterone metabolites. Adult LCs are derived from immature LCs characterized by more efficient production of testosterone. With aging, the ability to synthesize testosterone in LCs progressively declines, resulting in a reduction of serum testosterone and concomitant alterations in physical function [Citation5].
Up to date, molecular mechanisms associated with the regulation of testosterone in LCs remain elusive [Citation3,Citation8]. Growing evidence support the notion that autophagy plays an important role in regulating testosterone synthesis in LCs; this process is initiated in progenitor LCs, peaked in adult LCs, and attenuated in aged LCs [Citation3,Citation4,Citation9]. As a normal cellular metabolic process, autophagy mediates the delivery of cellular components to lysosomes to contribute to cell survival under stress [Citation10–13]. Previous studies have identified that AMP-activated protein kinase (AMPK), a major energy-sensing kinase, can promote autophagy to maintain energy homeostasis, whereas MTOR (mechanistic target of rapamycin kinase) can inhibit autophagy [Citation14,Citation15].
Cell growth and differentiation depend upon the fine-tuning regulation of gene expression at both transcriptional and translational levels [Citation16]. It is noted that post-transcriptional modifications of eukaryotic mRNA play important roles in helping cells survive various stimuli [Citation17]. N6-methyladenosine (m6A), the most prevalent internal modification in mRNA, has roles in various biological processes [Citation18,Citation19]. Usually, m6A modification is embedded within the consensus motif DRACH (D = A, G, U; R = A, G; H = A, C, U) and preferentially enriched around stop codons [Citation20–22]. m6A modification is a dynamic and reversible process, which is mediated through “writer” and “eraser” proteins [Citation21,Citation23]. In mammalian cells, methyltransferase complex consisting of METTL3 (methyltransferase like 3), METTL14 (methyltransferase like 14), and a regulatory subunit WTAP (Wilms tumor 1-associating protein) catalyze m6A modification [Citation24,Citation25]. By contrast, ALKBH5 (alkB homolog 5, RNA demethylase) and FTO (fat mass and obesity associated) are capable of mediating the reversal of this methylation [Citation26,Citation27]. m6A exerts many of its functions through “reader” proteins that selectively recognize and bind to the m6A-modified transcripts [Citation28–33]. One class of m6A readers is the YTHDF (YTH N6-methyladenosine RNA binding protein), which includes YTHDF1 and YTHDF2. YTHDF1 promotes translation of the target m6A-modified mRNA, while YTHDF2 decrease mRNA stability and mediate subcellular localization and alternative splicing of mRNA [Citation23,Citation34–36].
Recent works have uncovered that m6A modification regulates differentiation of embryonic stem cells [Citation37–39], reprogramming of somatic cells [Citation40], sex determination [Citation37–39], spermatogenesis [Citation42],Citation41 tumorigenicity of cancer cells [Citation23,Citation43], and neuronal development [Citation36]. Given key roles of m6A modification in regulating gene expression and its dynamic properties, it was reasonable to speculate that m6A modification regulates differentiation of LCs and testosterone synthesis. Here, we found a negative correlation of m6A modification with testosterone synthesis in LCs. Further studies revealed that m6A modification affected AMPK activity by promoting translation of the negative AMPK regulator PPM1A (protein phosphatase 1A, magnesium dependent, alpha isoform) while decreasing expression of the positive AMPK regulator CAMKK2 (calcium/calmodulin-dependent protein kinase kinase 2, beta) by reducing its mRNA stability, resulting in autophagy inhibition and subsequent suppressed testosterone synthesis in LCs.
Results
Autophagy is vital for testosterone synthesis in LCs
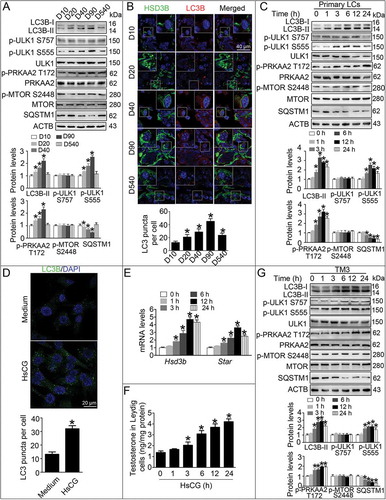
In this study, we measured the autophagic marker LC3B-II levels in stem LCs (post-natal days 10; D10), progenitor LCs (D20), immature LCs (D40), adult LCs (D90), and aged LCs (D540), and found increasing expression of LC3B-II in LCs during cellular differentiation, peaking in adult LCs (); however, cellular SQSTM1 (sequestosome 1) became markedly reduced during development from stem LCs to adult LCS (). Moreover, we observed an increasing number of LC3 puncta in LCs during cell differentiation from stem LCs to adult LCs (), accompanied by gradually increasing serum testosterone levels (Fig. S1). Furthermore, we also observed upregulated expression of LC3B-II, increased numbers of LC3 puncta, and a concurrent decrease of SQSTM1 in primary LCs following HsCG treatment (), accompanied by increased mRNA expression of steroidogenic enzymes, including Star (steroidogenic acute regulatory protein) and Hsd3b (3β-hydroxysteroid dehydrogenase) (). As predicted, HsCG treatment markedly increased testosterone production in LCs (). Similarly, HsCG also induced increased expression of LC3B-II but decreased expression of SQSTM1 in TM3 cells (). These cells are usually chosen as a surrogate for primary LCs based on their sharing many properties of primary LCs [Citation44].
Figure 1. Autophagy is closely associated with testosterone synthesis in Leydig cells (LCs). Primary LCs from mouse testes at various developmental stages were isolated and cultured for 48 h. (A) Autophagy-related protein expression was analyzed by western blotting. The expression levels of the target proteins were determined by densitometry by normalizing to ACTB, and data are presented as the means ± SEM (n = 3). *P < 0.05 vs. post-natal days 10 (D10) group. (B) The expression of LC3B in LCs at different developmental stages was examined by immunofluorescence staining, and the average LC3B puncta number per cell was quantified. Data are presented as means ± SEM (n = 3). *P < 0.05 vs. D10 group. (C) Primary LCs were treated with HsCG for indicated times. The cell extracts were subjected to western blotting and quantitative analysis. Data are presented as means ± SEM (n = 3). *P < 0.05 vs. D10 group. (D) The expression of LC3B in LCs at 6 h was examined by immunofluorescence staining, and the average LC3B puncta number per cell was quantified. Data are presented as means ± SEM (n = 3). *P < 0.05 vs. the control cells. (E) mRNA levels of Hsd3b and Star were determined by qRT-PCR. Data are presented as means ± SEM (n = 3). *P < 0.05 vs. the control cells. (F) Testosterone levels were detected by radioimmunoassay. Data are presented as means ± SEM (n = 3). *P < 0.05 vs. the control cells. (G) TM3 cells were treated with HsCG for indicated times. The cell extracts were subjected to western blotting and quantitative analysis. Data are presented as means ± SEM (n = 3). *P < 0.05 vs. the control cells
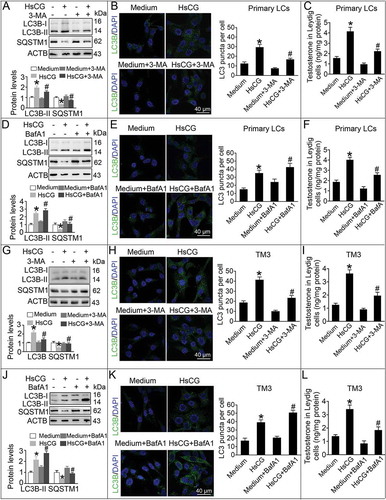
Since the increase in LC3B-II could reflect an increase in autolysosome synthesis or reduction in autophagic flux in cells, we performed additional autophagy blockade experiments. We note that LC3B-II levels, LC3 puncta number per cell and testosterone production became substantially ameliorated after pre-treatment with the autophagy inhibitor 3-methyladenine (3-MA) in HsCG-treated primary LCs (). Bafilomycin A1 (BafA1) pre-treatment resulted in the enrichment of LC3B-II and SQSTM1 but lowered the testosterone production (). Moreover, we also observed similar effects of 3-MA and BafA1 on HsCG-induced autophagic flux in primary LCs in TM3 cells (). To further investigate whether testosterone synthesis in LCs involved autophagy, we used small interfering RNA (siRNA) targeting Atg7 to knock down ATG7 in LCs. As predicted, knockdown of ATG7 alleviated HsCG-induced LC3B-II increase and testosterone production (Fig. S2), suggesting that autophagy mediates testosterone synthesis.
Figure 2. 3-methyladenine and bafilomycin A1 regulate HsCG-induced autophagy in Leydig cells (LCs). Primary LCs were pre-treated with 3-methyladenine (3-MA, 5.0 mM) for 1 h followed by exposure to HsCG for 6 h. (A) The cell extracts were subjected to western blotting and quantitative analysis. (B) Immunofluorescence staining of LC3B and quantitative analyses of LC3 puncta per cell were performed. (C) Testosterone levels were measured by radioimmunoassay. Primary LCs were pre-treated with bafilomycin A1 (BafA1, 10 nM) for 1 h followed by exposure to HsCG for 6 h. (D) The cell extracts were subjected to western blotting and quantitative analysis. (E) Immunofluorescence staining of LC3B and quantitative analyses of LC3 puncta per cell were performed. (F) Testosterone levels were measured by radioimmunoassay. TM3 cells were pre-treated with 3-MA for 1 h followed by exposure to HsCG for 6 h. (G) The cell extracts were subjected to western blotting and quantitative analysis. (H) Immunofluorescence staining of LC3B and quantitative analyses of LC3 puncta per cell were performed. (I) Testosterone levels were measured by radioimmunoassay. TM3 cells were pre-treated with BafA1 for 1 h followed by exposure to HsCG for 6 h. (J) The cell extracts were subjected to western blotting and quantitative analysis. (K) Immunofluorescence staining of LC3B and quantitative analyses of LC3 puncta per cell were performed. (L) Testosterone levels were measured by radioimmunoassay. Data are presented as means ± SEM (n = 3). *P < 0.05 vs. the control cells; #P < 0.05 vs. the HsCG-treated cells
Autophagy in LCs is dependent on the AMPK signaling pathway
In order to assess whether the MTOR-ULK1 (unc-51-like kinase 1) signaling pathway mediates autophagy and testosterone synthesis in LCs, we examined the expression of p-MTOR Ser2448 and its downstream target p-ULK1 Ser757. We observed no marked changes in Ser757 phosphorylation of ULK1 and Ser2448 phosphorylation of MTOR (). Interestingly, we observed enhanced phosphorylation of AMPK subunit PRKAA2 (protein kinase, AMP-activated, alpha 2 catalytic subunit) at Thr172 (p-PRKAA2 Thr172), a canonical initiator of the autophagic process, and increased expression of its downstream protein p-ULK1 Ser555 (). Furthermore, during the differentiation of LCs from stem LCs to adult LCs, cellular p-PRKAA2 Thr172 and p-ULK1 Ser555 levels were steadily increased ().
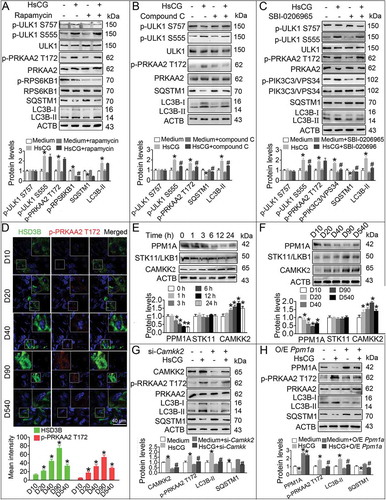
In this study, the treatment using MTOR inhibitor rapamycin failed to alter the levels of LC3B-II, SQSTM1, p-PRKAA2 Thr172, p-ULK1 Ser555, and p-ULK1 Ser757 in HsCG-treated TM3 cells and primary LCs ( and S3A). However, rapamycin could effectively inhibit phosphorylation of RPS6KB1, another classical MTOR target not associated with autophagic flux [Citation45], indicating that the autophagic process in LCs is MTOR-independent. The specific AMPK inhibitor compound C could effectively suppress a serious of events, including HsCG-induced increase in LC3B-II, Thr172 phosphorylation of PRKAA2, Ser555 phosphorylation of ULK1, and decrease of SQSTM1 ( and S3B). Similarly, the ULK1 inhibitor SBI-0206965 significantly attenuated HsCG-induced increase of LC3B-II and Ser555 phosphorylation of ULK1, and decrease of SQSTM1 in both TM3 cells and primary LCs. However, we examined no inhibitory effects of SBI-0206965 on p-PRKAA2 T172 ( and S3C). These results confirmed the AMPK-ULK1-dependency of autophagy induction in LCs during HsCG stimulus. Consistently, we confirmed the increased expression of p-PRKAA2 Thr172 in mouse LCs during development, peaking in adult LCs, by immunofluorescence assay ().
Figure 3. AMPK mediates autophagy in Leydig cells (LCs) upon the HsCG challenge. (A-C) TM3 cells were pre-treated with rapamycin (100 μM), compound C (1 μM) or SBI-0206965 (2 μM) for 1 h followed by exposure to HsCG for 6 h. The cell extracts were subjected to western blotting and quantitative analysis. Data are presented as means ± SEM (n = 3). *P < 0.05 vs. the control cells; #P < 0.05 vs. the HsCG-treated cells. (D) The expression of p-PRKAA2 in LCs at different developmental stages was examined by immunofluorescence staining. Fluorescence intensity was presented as means ± SEM (n = 3). *P < 0.05 vs. post-natal days 10 (D10) group. (E) TM3 cells were treated with HsCG for indicated times. The cell extracts were subjected to western blotting and quantitative analysis. Data are presented as means ± SEM (n = 3). *P < 0.05 vs. the control cells. (F) Protein levels of PPM1A, STK11/LKB1, and CAMKK2 in LCs at different developmental stages were analyzed by western blotting. *P < 0.05 vs. D10 group. (G and H) TM3 cells were transfected with siRNA targeting Camkk2 (si-Camkk2) or pcDNA3.1-Ppm1a vector (O/E Ppm1a; O/E, overexpression) for 36 h followed by exposure to HsCG for 6 h. The cell extracts were subjected to western blotting and quantitative analysis. Data are presented as means ± SEM (n = 3). *P < 0.05 vs. the control cells; #P < 0.05 vs. the HsCG-treated cells
CAMKK2/PPM1A is required for thr172 phosphorylation of PRKAA2
To determine the mechanisms underlying HsCG-induced enhanced expression of p-PRKAA2 Thr172 in LCs, we examined CAMKK2 and STK11/LKB1 (serine/threonine kinase 11), two classical kinases that phosphorylate PRKAA2 at Thr172, and PPM1A, a phosphatase that mediates Thr172 dephosphorylation of PRKAA2 [Citation46]. Our data revealed that HsCG induced increased expression of CAMKK2, and reduced expression of PPM1A in a time-dependent manner in both TM3 cells and primary LCs using western blotting ( and S4A). Furthermore, we also recorded upregulated expression of CAMKK2 and downregulated expression of PPM1A in adult LCs in comparison to stem LCs by western blotting and immunofluorescence assays ( and S5). Also, TM3 cells and primary LCs following CAMKK2 knockdown or overexpression of PPM1A markedly suppressed HsCG-induced increased expression of LC3B-II, AMPK activation, and concurrent decrease of SQSTM1 (,H, and S4B, C).
Testosterone synthesis in LCs is regulated by m6A mRNA modification
With the development of LCs from stem LCs to adult LCs, we observed a gradual decrease of m6A levels (). Moreover, we recorded a gradual increase in Alkbh5 and Fto mRNA in LCs during their development, whereas Mettl3, Mettl14, and Wtap exhibited no remarkable differences (Fig. S6). The protein levels of FTO and ALKBH5 became upregulated, while METTL14 levels in LCs became downregulated during cellular differentiation from stem LCs to adult LCs confirmed by both western blotting and immunofluorescence analyses (, S7 and S8). Consistently, we revealed a gradual decrease of m6A levels in LCs using ELISA during the same cellular differentiation process (). Furthermore, we also observed a significantly increased ALKBH5 and FTO protein levels, and a reduction in METTL14 in both primary LCs and TM3 cells upon HsCG treatment accompanied with a decrease in m6A levels, in a time-dependent manner (, E, and S9).
Figure 4. The m6A mRNA methylation regulates AMPK activity in Leydig cells (LCs). (A) m6A levels in LCs were assessed by immunofluorescence staining. Fluorescence intensity was presented as means ± SEM (n = 3). *P < 0.05 vs. post-natal day 10 (D10) group. (B) Protein levels of m6A regulatory enzymes in LCs at various developmental stages were examined by western blotting and quantitatively analyzed. Data were presented as means ± SEM (n = 3). *P < 0.05 vs. D10 group. (C) Relative m6A levels were measured by ELISA-based m6A quantitative analyses. *P < 0.05 vs. D10 group. TM3 cells were treated with HsCG for indicated times. (D) The expression of m6A regulatory enzymes were examined by western blotting and quantitatively analyzed. *P < 0.05 vs. the control cells. (E) Relative m6A levels were measured by ELISA-based m6A quantitative analyses. *P < 0.05 vs. the control cells. (F) The expression of both HSD3B and m6A levels in LCs at 6 h was examined by immunofluorescence staining. Fluorescence intensity was presented as means ± SEM (n = 3). *P < 0.05 vs. the control cells. (G) TM3 cells were transfected with increasing doses of pcDNA3.1-Mettl14 vector (O/E Mettl14; O/E, overexpression) for 36 h followed by HsCG treatment for 6 h. The cell extracts were subjected to western blotting and quantitative analysis. Data are presented as the means ± SEM (n = 3). *P < 0.05 vs. the control cells; #P < 0.05 vs. the HsCG-treated cells. (H) TM3 cells were transfected with siRNA targeting Alkbh5 (si-Alkbh5) and cultured for 36 h followed by HsCG treatment for 6 h. The cell extracts were subjected to western blotting and quantitative analysis. Data are presented as means ± SEM (n = 3). *P < 0.05 vs. the control cells; #P < 0.05 vs. the HsCG-treated cells
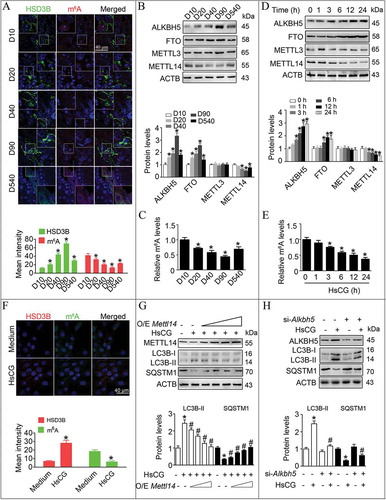
We further demonstrated that HsCG decreased m6A levels and increased HSD3B levels in LCs using immunofluorescence analyses (). To understand how m6A modification modulates the synthesis of testosterone in LCs, we tried to assess the association between m6A methylation and autophagy. We observed that METTL14 overexpression could alleviate HsCG-induced m6A reduction, testosterone production, LC3B-II upregulation, and concurrent decrease of SQSTM1 ( and S10). Additionally, knockdown of ALKBH5 but not FTO significantly inhibited HsCG-induced m6A decrease, testosterone production, and autophagy in LCs (, S10, and S11). Together, these data support the idea that by modulating autophagy in LCs, testosterone synthesis may correlate to reduced m6A mRNA modification.
m6A mRNA modification is reduced in LCs from patients with azoospermia or oligospermia
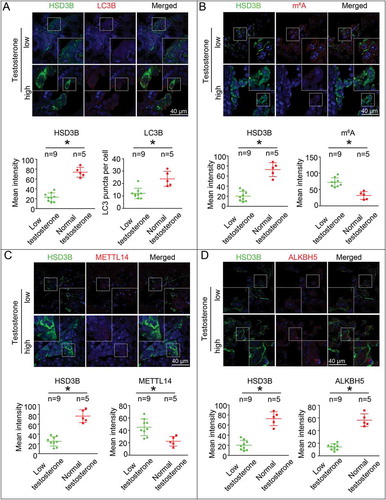
To further investigate how m6A modifications play important roles in regulating testosterone synthesis in LCs, we measured m6A methylation levels in LCs from patients with azoospermia or oligospermia. Our data demonstrated that expression of HSD3B, a measure of the capacity to synthesize testosterone [Citation47,Citation48], positively correlated with puncta numbers in LC3 cells, while negatively correlated with SQSTM1 in LCs ( and S12). Furthermore, we observed a negative correlation between m6A and HSD3B expression in these patients, suggesting m6A modification might mediate testosterone synthesis in LCs (). As predicted, we observed increased expression of METTL14 and decreased expression of ALKBH5 in those LCs that had reduced levels of HSD3B ().
Figure 5. Upregulated m6A levels were observed in Leydig cells (LCs) from azoospermia or oligospermia patients with lowered levels of serum testosterone. (A) The expression of LC3B in LCs at 6 h was examined by immunofluorescence staining, and the average LC3B puncta number per cell was quantified. (B) m6A levels in LCs were assessed by immunofluorescence assay. (C and D) The protein levels of METTL14 and ALKBH5 in LCs were determined by immunofluorescence staining. Data are presented as means ± SEM. *P < 0.05
m6A methylation regulates the activation of AMPK
Given that we identified a negative correlation between m6A methylation and autophagy, we next evaluated the possible relationship between m6A methylation and activation of AMPK in LCs. Our data revealed that METTL14 knockdown enhanced phosphorylation of PRKAA2, upregulated expression of LC3B-II, and decreased expression of SQSTM1 (); however, compound C effectively attenuated these changes (). Moreover, we observed decreased p-PRKAA2 Thr172, CAMKK2, and LC3B-II levels, and increased PPM1A and SQSTM1 levels in LCs in response to METTL14 overexpression (). Additionally, knockdown of CAMKK2 effectively alleviated both METTL14 knockdown- and ALKBH5 overexpression-induced PRKAA2 activation, LC3B-II increase, and SQSTM1 reduction in both TM3 cells and primary LCs (, D, and S13). Similarly, ectopic expression of PPM1A also suppressed both METTL14 knockdown- and ALKBH5 overexpression-induced PRKAA activation, LC3B-II increase, and SQSTM1 reduction (, F, and S13). Together, we provided solid data which confirmed that CAMKK2 upregulation and PPM1A downregulation modulate autophagy in LCs owing to reduced m6A levels.
Figure 6. m6A mRNA methylation impacts the expression of regulators of the AMPK pathway. (A) TM3 cells were transfected with shRNA targeting Mettl14 (sh-Mettl14) followed by compound C treatment for 6 h. The cell extracts were subjected to western blotting and quantitative analysis. Data are presented as means ± SEM (n = 3). *P < 0.05 vs. the control cells; #P < 0.05 vs. the sh-Mettl14-treated cells. (B) TM3 cells were transfected with increasing doses of pcDNA3.1-Mettl14 vector (O/E Mettl14; O/E, overexpression). The cell extracts were subjected to western blotting and quantitative analysis. Data are presented as means ± SEM (n = 3). *P < 0.05 vs. the control cells. (C) TM3 cells were transfected with sh-Mettl14 before treatment with siRNA targeting Camkk2 (si-Camkk2), and cell lysate was subjected to western blotting and quantitative analysis. Data are presented as means ± SEM (n = 3). *P < 0.05 vs. the control cells; #P < 0.05 vs. the sh-Mettl14-treated cells. (D) TM3 cells were transfected with the pcDNA3.1-Alkbh5 (O/E Alkbh5) vector before treatment with si-Camkk2, and cell lysate was subjected to western blotting and quantitative analysis. Data are presented as means ± SEM (n = 3). *P < 0.05 vs. the control cells; #P < 0.05 vs. the O/E Alkbh5-treated cells. (E) TM3 cells were transfected with sh-Mettl14 before transfection with pcDNA3.1-Ppm1a (O/E Ppm1a), and cell lysate was subjected to western blotting and quantitative analysis. Data are presented as means ± SEM (n = 3). *P < 0.05 vs. the control cells; #P < 0.05 vs. the sh-Mettl14-treated cells. (F) TM3 cells were transfected with pcDNA3.1-Alkbh5 (O/E Alkbh5) before transfection with pcDNA3.1-Ppm1a (O/E Ppm1a), and cell lysate was subjected to western blotting and quantitative analysis. Data are presented as means ± SEM (n = 3). *P < 0.05 vs. the control cells; #P < 0.05 vs. the O/E Alkbh5-treated cells
m6A methylation affects the RNA stability of CAMKK2
We next investigated whether m6A modification could regulate the expression of CAMKK2 and PPM1A. Because m6A methylation appeared to reduce the expression of CAMKK2, we speculated that the Camkk2 transcript was a target of YTHDF2, a protein that is capable of reducing the stability of m6A methylated transcripts. Consistent with this hypothesis, knock down of YTHDF2 increased expression of Camkk2 at both mRNA and protein levels to a similar extent as knock down of METTL14 in both TM3 cells and primary LCs (–C and S14A-C). Conversely, m6A methylation appeared to upregulate PPM1A, suggesting that YTHDF1 could recognize the transcript of PPM1A, which promoted the translation of PPM1A. As expected, knock down of YTHDF1 resulted in lower PPM1A protein levels, while we observed no significant changes in mRNA (–C and S14A-C). We noted that knock down of YTHDF1 failed to change the expression of CAMKK2, while knock down of YTHDF2 was unable to affect the expression of PPM1A (–C and S14A-C). Given the specificity of YTHDF1 or YTHDF2 in regulating the expression of PPM1A or CAMKK2, respectively, we hypothesized that YTHDF1 and YTHDF2 functioned at the level of RNA recognition and interaction. Consistent with this hypothesis, YTHDF1 interacted stronger with Ppm1a than Camkk2, while YTHDF2 interacted stronger with Camkk2 than Ppm1a, as assessed by RNA-immunoprecipitation (RIP) analyses (, S15A, and B). Moreover, our data demonstrated that the YTHDF1 enrichment at Ppm1a transcripts and YTHDF2 enrichment at Camkk2 transcripts were significantly reduced in LCs upon METTL14 knockdown (). Furthermore, it was noted that both YTHDF1 and YTHDF2 immunoprecipitation efficiencies remained unchanged irrespective of the treatments (Fig. S15C and D).
Figure 7. m6A induces the decay of the Camkk2 transcript in Leydig cells (LCs). TM3 cells were treated with indicated siRNAs. (A and B) Cell lysates were subjected to western blotting and quantitative analysis. Data are presented as means ± SEM (n = 3). *P < 0.05 vs. the control cells. (C) mRNA levels of target genes were measured by qRT-PCR. *P < 0.05 vs. the control cells. (D) YTHDF1/YTHDF2 was immunoprecipitated, followed by qRT-PCR for assessing the association of the indicated transcripts with each protein. Data are presented as means ± SEM (n = 3). *P < 0.05 vs. the IgG group. (E) Schematic representation of the position of m6A motifs with Camkk2 transcript. (F) Abundance of Camkk2 transcript among mRNA immunoprecipitated with anti-m6A antibody was measured by qRT-PCR and normalized to input. Data are presented as means ± SEM (n = 3). *P < 0.05 vs. the IgG group. (G) Abundance of Camkk2 transcript among mRNA immunoprecipitated with anti-m6A antibody from cells with or without transfection of shRNA targeting Alkbh5 (sh-Alkbh5) was measured by qRT-PCR. Data are presented as means ± SEM (n = 3). *p < 0.05. (H) Camkk2-3ʹ-UTR of the wild-type or containing an m6A consensus sequence mutant (A to G) was fused with a luciferase reporter. (I) Luciferase activity of Camkk2-3ʹ-UTR was measured and normalized to Renilla luciferase activity. Data are presented as means ± SEM (n = 3). *P < 0.05 vs. the control cells. (J) TM3 cells pre-treated with indicated siRNAs were treated with actinomycin D (5 μg/mL) for 2 h, followed by measurement of Camkk2 and Ppm1a mRNA levels at indicated times. *P < 0.05 vs. the control cells
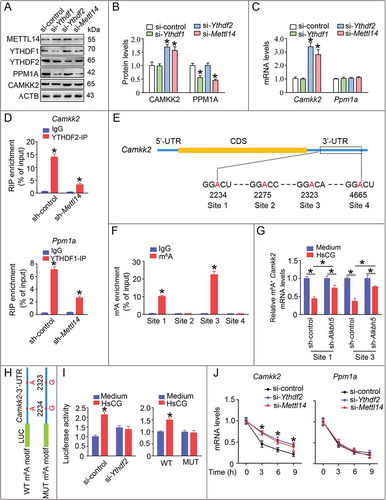
To further confirm whether the Camkk2 transcript could be m6A modified, we performed sequence analysis of the Camkk2 transcript and found four matches to the 5ʹ-RRACU-3ʹ m6A consensus sequence within 3ʹ-UTR of the Camkk2 transcript (). We next performed m6A RIP analyses and found that m6A was significantly enriched at site 1 and site 3 (). Moreover, m6A levels at both site 1 and site 3 of the Camkk2 transcript were significantly reduced in LCs upon treatment with HsCG; knock down of ALKBH5 effectively inhibited HsCG-induced m6A reduction (). Furthermore, we generated luciferase reporters containing a firefly luciferase placed before the wild-type or mutant Camkk2-3ʹ-UTR (). The luciferase reporter assay revealed that HsCG treatment could upregulate luciferase activity, while knock down of YTHDF2 effectively attenuated this increase (). Moreover, HsCG failed to increase the luciferase activity of the reporter construct bearing the mutant Camkk2-3ʹ-UTR (). To understand the molecular mechanism that accounted for the regulation of CAMKK2 by m6A methylation, we tried to assess whether m6A modification could affect Camkk2 mRNA decay. We observed decreases in the decay rates of Camkk2 mRNA upon knock down of YTHDF2 or METTL14 in both TM3 cells and primary LCs ( and S14D, E). Conversely, knock down of YTHDF2 failed to attenuate the decay rates of Ppm1a mRNA ( and S14D, E).
m6A methylation promotes translation of the PPM1A transcript
We observed decreased expression of PPM1A in LCs upon knock down of YTHDF1 or METTL14, while we observed no significant changes of Ppm1a mRNA levels (). Therefore, we speculated that the disruption of protein stability or reduction in translation efficiency might decrease PPM1A protein levels. To verify this hypothesis, we treated LCs with the protein translation inhibitor cycloheximide (CHX) and observed that the degradation rate of PPM1A in LCs following METTL14 knockdown was similar to those cells without METTL14 knock down (). Next, we pre-treated LCs with MG-132 to inhibit proteasome activity and then treated with HsCG. Our data demonstrated that HsCG reduced the expression of PPM1A in both primary LCs and TM3 cells (, D, S14F, and G). However, we did not observe the HsCG-induced decrease of PPM1A in LCs upon ALKBH5 knockdown (, D, S14F, and G). Together, these results suggested that m6A mediates PPM1A expression through regulating its translation without impacting protein stability. As predicted, HsCG treatment promoted binding between YTHDF1 and EIF3A (eukaryotic translation initiation factor 3) and EEF2 (eukaryotic elongation factor 2), as assessed by coimmunoprecipitation (Co-IP) analyses (Fig. S16).
Figure 8. m6A triggers the translation of the Ppm1a transcript. (A and B) TM3 cells with or without transfection of shRNA targeting Mettl14 (sh-Mettl14) were pre-treated with cycloheximide (CHX, 10 μg/mL) for 3 h followed by exposure to HsCG for indicated times. Expression levels of PPM1A were examined by western blotting and quantitatively analyzed. (C and D) TM3 cells with or without transfection of shRNA targeting Alkbh5 (sh-Alkbh5) were pre-treated with MG-132 (2 μM) for 1.5 h followed by exposure to HsCG for 6 h. Expression levels of PPM1A were examined by western blotting and quantitatively analyzed. Data are presented as means ± SEM (n = 3). *P < 0.05 vs. the control cells; #P < 0.05 vs. the MG-132-treated cells. (E) Schematic representation of the position of m6A motifs with Ppm1a transcript. (F) Abundance of the Ppm1a transcripts among mRNA immunoprecipitated with anti-m6A antibody was measured by qRT-PCR. Data are presented as means ± SEM (n = 3). *P < 0.05 vs. the IgG group. (G) Abundance of the Ppm1a transcript among mRNA immunoprecipitated with anti-m6A antibody from cells with or without transfection of sh-Alkbh5 was measured by qRT-PCR. Data are presented as means ± SEM (n = 3). *P < 0.05. (H) Ppm1a-3ʹ-UTR of the wild-type or containing an m6A consensus sequence mutant (A to G) were fused with a luciferase reporter. (I and J) Luciferase activity of Camkk2-3ʹ-UTR was measured and normalized to Renilla luciferase activity. Data are presented as means ± SEM (n = 3). *P < 0.05 vs. the control cells. (K) Schematic representation of mutation in pcDNA3.1-Ppm1a-CDS-3ʹUTR is shown. (L) TM3 cells were transfected with sh-Mettl14 followed by transfection with indicated vectors, and cell lysate was subjected to western blotting
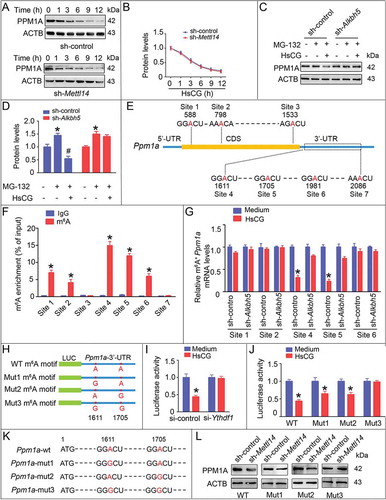
Sequence analysis revealed three sites of m6A modification within the CDS region and four m6A sites in the 3ʹ-UTR (). m6A RIP analyses revealed that m6A significantly enriched at site 1, site 2, site 4, site 5, and site 6 (). Following HsCG treatment, m6A enrichment at both site 4 and site 5 became significantly reduced; however, ALKBH5 knockdown effectively suppressed these changes (). To study the potential roles of m6A modification in regulating the expression of PPM1A, we constructed a luciferase reporter containing Ppm1a-3ʹUTR () and demonstrated that HsCG treatment significantly reduced luciferase activity of the reporter construct; however, we could not reproduce this phenomenon in those cells with YTHDF1 knockdown (). Moreover, we also mutated the potential m6A motif GGACU to GGGCU, and the luciferase assay revealed that HsCG treatment could still reduce the luciferase activity of the reporter construct bearing Ppm1a-3ʹ-UTR-mut1, Ppm1a-3ʹ-UTR-mut2, but not Ppm1a-3ʹ-UTR-mut3 (). To further confirm the importance of the m6A motif in 3ʹ-UTR in regulating the expression of PPM1A, we generated an expression construct containing the coding sequence (CDS) and 3ʹUTR sequence. PPM1A expression in those LCs overexpressing pcDNA3.1-WT, pcDNA3.1-mut1, and pcDNA3.1-mut2 were markedly reduced upon knock down of METTL14; however, we observed no obvious changes in pcDNA3.1-mut3-transfected cells (). Collectively, our results suggested that m6A modification at both site 4 and site 5 in 3ʹ-UTR could promote translation of the Ppm1a transcript.
HsCG decreases METT14 expression by affecting protein stability
In this study, we observed reduced METTL14 levels in LCs upon HsCG treatment ( and S9), while we detected no significant changes in mRNA levels (). To investigate the molecular mechanism underlying HsCG-induced decreased expression of METTL14, we assessed the effects of HsCG on METTL14 protein stability. Our data demonstrated that HsCG treatment increased the degradation rate of METTL14 (). Moreover, METTL14 levels could be restored in those LCs with pre-treatment with MG-132 (), suggesting that HsCG reduced METTL14 protein levels by inducing its degradation.
Figure 9. HsCG induces transcription of Alkbh5 in Leydig cells (LCs). (A) TM3 cells were treated with HsCG for indicated times, and mRNA levels of Mettl14 and Alkbh5 were analyzed by qRT-PCR. *P < 0.05 vs. the control cells. (B and C) TM3 cells were pre-treated with cycloheximide (CHX, 10 μg/mL) for 3 h followed by exposure to HsCG for indicated times, and protein levels of METTL14 were assessed by western blotting and quantitatively analyzed. *P < 0.05 vs. the CHX-treatment cells. (D) TM3 cells were pre-treated with MG-132 (2 μM) for 1.5 h followed by exposure to HsCG for 6 h. Expression levels of METTL14 were examined by western blotting and quantitatively analyzed. Data are presented as means ± SEM (n = 3). *P < 0.05 vs. the control cells. (E) Potential transcription factor binding sites in the Alkbh5 promoter region were predicted. (F) TM3 cells were treated with HsCG for indicated times. Both cytoplasmic and nuclear proteins were isolated, followed by western blotting and quantitative analysis. ACTB and LMNB1 served as cytosolic and nuclear markers, respectively. Data are presented as means ± SEM (n = 3). *P < 0.05 vs. the control cells. (G and H) TM3 cells were transfected with siRNA targeting Cebpb (si-Cebpb) or si-Tfeb and cultured for 36 h followed by exposure to HsCG for 6 h. The expression of ALKBH5 was examined by western blotting and quantitatively analyzed. Data are presented as means ± SEM (n = 3). *P < 0.05 vs. the control cells; #P < 0.05 vs. the HsCG-treated cells. (I and J) TM3 cells were transfected with Alkbh5 promoter constructs harboring indicated mutations of TEFB binding sites (I) or CEBPB binding sites (J). Luciferase activity was measured, and data were presented as means ± SEM (n = 3). *P < 0.05. An “NS” denotes no statistically significant difference between the testing groups
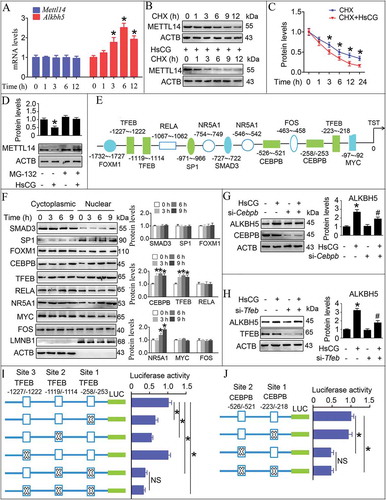
HsCG induces ALKBH5 expression via enhancing its transcriptional levels
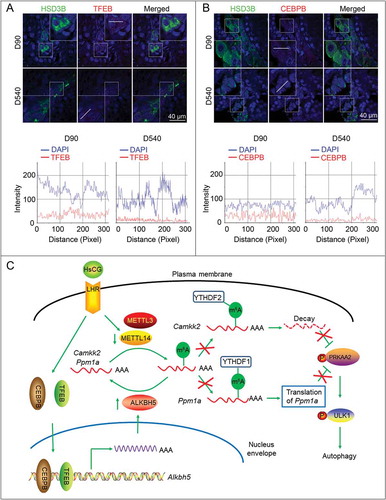
We noted that HsCG treatment upregulated the mRNA and protein levels of ALKBH5 ( and ). Therefore, we anticipated that HsCG treatment could upregulate ALKBH5 expression by increasing its transcriptional levels. As shown in , we observed multiple potential transcription factor binding sites in the Alkbh5 promoter, including SMAD3, SP1, FOXM1, CEBPB, TFEB, NR5A1/SF-1, RELA, MYC, and FOS. Next, we found that HsCG treatment markedly promoted nuclear translocation of NR5A1, CEBPB, and TFEB in both TM3 cells and primary LCs ( and S17). Based on the fact that HsCG could promote expression of ALKBH5 as early as 1 h following treatment, we could thus rule out the possibility of NR5A1 in mediating HsCG-induced ALKBH5 expression. Additionally, LCs with CEBPB or TFEB knockdown effectively inhibited HsCG-induced increase in ALKBH5 (, H, and S17). To provide direct evidence confirming that TFEB could regulate Alkbh5 transcription, we performed site-directed mutagenesis to mutate these TFEB binding sites from CANNTG to CANNCC in the Alkbh5 luciferase reporter construct. The luciferase assay revealed that mutation of site 1 and site 3 significantly decreased luciferase activity, while mutation of site 2 had minor effects (). Moreover, we also mutated two potential CEBPB-binding sites from NTGCNN to NAAANN and observed that mutation of site 2 but not site 1 could significantly decrease the luciferase activity (). Consistently, HsCG treatment promoted binding of TFEB to site 1 and site 2 of the ALKBH5 promoter, and binding of CEBPB to site 2 of this promoter, as assessed by ChIP assay (Fig. S18). Together, our results strongly support that HsCG upregulates expression of ALKBH5 by promoting binding of TFEB and CEBPB to the Alkbh5 promoter and then enhancing its transcription levels. Moreover, we also observed reduced enrichment of both TFEB and CEBPB in the nuclei of testicular LCs in aged mice in comparison to adult mice, accompanied by a decline of HSD3B ().
Figure 10. Reduced nuclear translocation of TFEB and CEBPB is observed in aged Leydig cells (LCs). Enrichment of TFEB (A) and CEBPB (B) in the nucleus of LCs was determined by immunofluorescence analysis. The merging of the red and green fluorescence signals was quantified with Image J software. D10, post-natal days 10; D540, post-natal days 540. (C) A model for the critical link between METTL14/ALKBH5 and autophagy in HsCG-treated LCs is proposed. HsCG reduces METTL14 expression and increases ALKBH5 expression by suppressing the stability of METTL14 and enhancing Alkbh5 transcription, respectively. Both downregulation of METTL14 and upregulation of ALKBH5 lead to reduced m6A mRNA methylation levels. Reduction of m6A levels alleviates m6A-mediated Ppm1a translation and upregulates CAMKK2 expression by retarding m6A-mediated decay of the transcript, contributing to activation of PRKAA2 and subsequently autophagy initiation
Discussion
Cell growth and differentiation depend on the fine-tuning regulation of gene expression [Citation49]. LCs in mammals progressively improve their capacity to synthesize testosterone during development and differentiation from stem LCs to the adult LCs, peaking in the adult LCs [Citation3]. As mammals age, the ability to synthesize testosterone markedly decreases [Citation1,Citation6,Citation7,Citation9]. Based on these facts, we speculated that some genes involved in testosterone synthesis might be dynamically regulated during the differentiation of LCs. It has been previously revealed that m6A modification plays an important role in regulating gene expression by impacting RNA stability, translation efficiency, subcellular localization, and alternative splicing [Citation23,Citation35,Citation36,Citation43]. In this study, we observed a gradual decrease of m6A modification levels in LCs during their differentiation from stem LCs to adult LCs, suggesting a role for m6A in mediating differentiation of LCs.
Growing evidence has supported that autophagy is vital for testosterone synthesis in LCs [Citation3,Citation4]. In this study, we observed that autophagy initiated in progenitor LCs, progressively increased with differentiation, and peaked in adult LCs, suggesting that autophagy was dynamically modulated during differentiation of LCs. Further studies revealed that m6A negatively mediated autophagy in LCs. Consistently, it has recently been reported that m6A can decrease the expression of ULK1 and TFEB by affecting their mRNA stability, resulting in inhibition of autophagy [Citation22,Citation34].
It has been reported that binding of HsCG to the LHCGR (luteinizing hormone/choriogonadotropin receptor) is crucial for stimulating subsequent intracellular signaling pathways [Citation50]. LHCGR is expressed primarily in the gonads, where it regulates steroidogenesis [Citation50]. In the testis, LHCGR is detected in both Sertoli cells and LCs, with the latter being the source of testosterone [Citation3,Citation51]. Therefore, we focused on LCs in this study. Following HsCG treatment, we could confirm the dependence of AMPK-ULK1 for the autophagic process in LCs. Note that phosphorylation of AMPK can be enhanced by an upstream kinase, including STK11/LKB1 and CAMKK2, and antagonized by PPM1A phosphatase [Citation46]. In this study, both upregulation of the CAMKK2 kinase and downregulation of the PPM1A phosphatase, which contributed to the activation of PRKAA2 and autophagy initiation, were observed in LCs upon HsCG treatment.
Further studies demonstrated that m6A could inhibit PRKAA2 activity by inducing m6A-dependent translation of Ppm1a and m6A-dependent degradation of the Camkk2 transcript. Following HsCG treatment, reduced m6A slowed down the regulation of m6A on these transcripts, leading to increased CAMKK2 levels but reduced PPM1A levels. Moreover, as both overexpression of PPM1A and knock down of CAMKK2 could attenuate HsCG-induced autophagy in LCs, we believe that both PPM1A and CAMKK2 are crucial for autophagy induction and this coordinated regulation may provide a fine-tuning system in modulating testosterone synthesis (). Moreover, m6A modification-dependent testosterone synthesis was also confirmed in those patients with oligospermia or azoospermia. Together, these results highlight a vital role of m6A mRNA methylation in regulating testosterone synthesis through modulating autophagy in LCs.
m6A modification is catalyzed and formed by a methyltransferase complex consisting of METTL3, METTL14, and WTAP; however, ALKBH5 and FTO can reverse m6A modification [Citation20,Citation21]. It is noted that METTL14 is not enzymatically active, and its main function is to facilitate RNA binding to METTL3 [Citation20,Citation21]. Accumulating evidence has confirmed that reduced expression of METTL3 or loss-of-function mutation in METTL14 may result in lowered m6A levels [Citation23]. In this study, we observed decreased expression of METTL14 but not METTL3 in LCs upon HsCG treatment. Moreover, a progressive decrease of METTL14 was detected in LCs during their differentiation from stem LCs to adult LCs. Therefore, we speculated that the reduction of METTL14 might hinder the assembly of the METTL3-METTL14-WTAP complex, inhibiting the potential of this complex to catalyze the m6A methylation of mRNA during testosterone synthesis in LCs.
FTO has been identified to demethylate m1A in specific tRNAs, N6 and 2ʹ-O-dimethyladenosine (m6Am) in some snRNAs, and internal m6A and m6Am at the second base adjacent to the 5ʹcap (cap-m6Am) in mRNA [Citation20,Citation21]. Compared with FTO, ALKBH5 only possesses effective demethylation activity toward m6A [Citation20,Citation21]. In this study, we found that knock down of ALKBH5 but not FTO could effectively reverse HsCG-induced autophagy. Moreover, it has been reported that ALKBH5 is most highly expressed in the testes but has low expression in the heart and brain [Citation27]. Together, both the decrease of METTL14 and the increase of ALKBH5 could synergistically reduce m6A modification in LCs during testosterone synthesis.
In this study, knock down of CEBPB or TFEB dramatically attenuated Alkbh5 mRNA induction. HsCG induced recruitment of CEBPB and TFEB to the Alkbh5 gene promoter to enhance its transcription was confirmed by ChIP assay. TFEB, as a master gene during the autophagic process [Citation52], has been reported to regulate Alkbh5 promoter activity following hypoxia/reoxygenation treatment in cardiomyocytes [Citation22]. It is reported that TFEB nuclear translocation is the first step for binding to the promoter of target genes and then promote gene transcription. TFEB can be phosphorylated by various kinases, including MTORC1, ERK2, or AKT, and sequestered in the cytoplasm, while the inactivation of these kinases can induce dephosphorylation of TFEB and subsequent translocation to the nucleus [Citation53–55]. Calcium ion release from lysosomes also contributes to TFEB nuclear translocation through PPP3/calcineurin-mediated dephosphorylation of TFEB [Citation55]. Moreover, numerous studies have confirmed reactive oxygen species-dependent nuclear translocation of TFEB and autophagy activation [Citation56]. At the moment, we do not have any data to unravel the molecular mechanism underlying the nuclear translocation of TFEB in LCs during testosterone synthesis, which deserves a follow-up study.
YTHDF2 has been reported to reduce the stability of m6A-modified mRNA, and YTHDF2-binding sites are usually enriched around stop codons and in 3ʹUTRs [Citation20,Citation21]. In this study, we identified two m6A modification sites to exist in 3ʹUTR of the Camkk2 transcript. In contrast to YTHDF2, YTHDF1 was shown to promote translation of m6A-modified transcripts by interacting with the EIF3A, EEF1A1, and EEF2 [Citation35,Citation57]. Moreover, similar to YTHDF2, YTHDF1-binding sites are also concentrated around the stop codons and in 3ʹUTRs [Citation21]. However, recent studies have found that m6A in the CDS sequence, but not 3ʹUTR, also triggers the translation of some m6A-modified mRNAs [Citation35]. Our data revealed that HsCG treatment significantly reduced m6A levels at two sites within 3ʹUTR of the Ppm1a transcript, but displayed no impact on other m6A modification sites within CDS. Although HsCG does not change m6A levels of the two sites within CDS of the Ppm1a transcript, whether they are also involved in PPM1A gene regulation, such as acting as sensors, deserves a separate study.
In summary, we have provided compelling both in vitro and in vivo evidence to demonstrate that m6A modification reduced testosterone synthesis in LCs through the regulation of autophagy by affecting the stability of the Camkk2 transcript and promoting translational efficiency of Ppm1a (). Further studies revealed that METTL14 and ALKBH5 modulated m6A modification in LCs upon the HsCG challenge. The results presented here provide insight into novel therapeutic strategies by exploiting m6A RNA methylation as targets for treating azoospermatism and oligospermatism patients with lowered levels of serum testosterone.
Materials and methods
Main reagents and cell culture
DMEM/F12 (11,320,033), horse serum (16,050,122), penicillin-streptomycin (10,378,016), and fetal bovine serum (FBS; 10099133C) were obtained from Gibco. The autophagy inhibitor 3-MA (HY-19,312), BafA1 (HY-100,558), MTOR inhibitor rapamycin (HY-10,219), AMPK inhibitor compound C (HY-13418A), protein synthesis inhibitor CHX (HY-12,320), DNA transcription inhibitor actinomycin D (HY-17,559), and ULK1 inhibitor SBI-0206965 (HY-16,966) were purchased from Medchemexpress. The specific information about antibodies used in the present study was provided in . TM3 cells (ATCC, CRL-1714) were cultured in DMEM/F12 with 5% horse serum, 2.5% fetal bovine serum, and 1% penicillin-streptomycin. Primary LCs from 4-week-old mice were isolated based on previously established protocols [Citation58,Citation59].
Table 1. Primary antibodies used in this study
Plasmid and siRNA transfection
Gene sequences coding for Mettl14 and Alkbh5 were cloned into the pcDNA3.1 vector (Invitrogen, V79020). The siRNA sequences used in this study were designed and chemically synthesized by RiboBio as: Mettl14, 5ʹ-GGAUGAGUUAA UAG CUAAA-3ʹ; Fto, 5ʹ-GAGCUGGCAUCACGAUGAA-3ʹ; Alkbh5, 5ʹ-CCTATG AGTCCTCGGAAGATT-3ʹ; Ythdf1, 5ʹ-GCACACAACCUCUAUCUUU-3ʹ; Ythdf2, 5ʹ-GACCAAGAAUGGCAUUGCA-3ʹ; Atg7, 5ʹ-GCCTGGCATTTGATAAATGT A-3ʹ; Camkk2, 5ʹ-GTATCCACTTGGGCATGGAAT-3ʹ; Cebpb, 5ʹ-CACCCTGCGGA ACTTGTTCAA-3ʹ; Tfeb, 5ʹ-GCAGGCTGTCATGCATTATAT-3ʹ. Transfection was performed using Lipofectamine 2000 (Invitrogen, 11,668,019) according to the manufacturer’s protocols.
Construction of the stable cell lines
Lentiviral vector expressing Mettl14-specific or Alkbh5-specific shRNA was designed and constructed by GENECHEM. The sequence for Mettl14-specific shRNA was 5ʹ-CCGGGGAUGAGUUAAUAGCUAAACTCGAGTTTAGCTATTAACTCATCCTTTTTG-3ʹ, and sequence for Alkbh5-specific shRNA was 5ʹ-CCGGCCTATGAGTC CTCGGAAGATTCTCGAGAATCTTCCGAGGACT CATAGGTTTTTG-3ʹ. TM3 cells were transfected with the overexpressing or knock down plasmids. After 36 h of transfection, cells were treated with 2 μg/mL puromycin (Medchemexpress, HY-B1743A) to obtain stable cell lines.
Quantitative real-time PCR (qRT-PCR) and RNA decay analyses
Total RNA from cells was extracted using Trizol reagent (Invitrogen, 15,596,018) following the manufacturer’s instructions. The cDNA was generated by HiScript Q RT SuperMix (Vazyme, R122-01). qRT-PCR was performed using ChamQ SYBR qPCR Master Mix (Vazyme, Q311-02). All primers used in this study are listed in Table S1, and Actb was chosen as internal control for normalization. Moreover, to assess the effects of m6A modification on RNA stability, cells were treated with actinomycin D at 5 μg/mL for indicated times. The stability of RNA was analyzed using the Click-iT nascent RNA capture kit according to the manufacturer’s instructions (Life Technologies, C10365).
Western blotting and coimmunoprecipitation (Co-IP) analyses
Western blotting analyses were performed as previously described [Citation60]. Briefly, proteins from each sample were separated on SDS-PAGE gel (Bio-Rad, 3,540,124) and then electrophoretically transferred onto PVDF membranes (Millipore Sigma, IPVH00010). The membranes were incubated with primary antibodies overnight at 4°C and then incubated with HRP-conjugated secondary antibodies for 45 min at 37°C. Protein signals were detected using ECL solution (Millipore Sigma, 345,818), and band intensities were quantified using Image J software (National Institutes of Health). Additionally, ACTB and LMNB1 (lamin B1) were chosen as cytosolic and nuclear markers, respectively. To measure protein stability, TM3 cells were treated with CHX at 100 μg/mL for indicated times, after which western blotting was used to examine protein levels of METTL14 and PPM1A. Moreover, Co-IP was performed as previously established protocols to assess interaction of YTHDF1with EIF3A and EEF2 [Citation60]. Briefly, anti-YTHDF1 antibody was used as the precipitating antibody to first isolate YTHDF1 from cell lysates by immunoprecipitation, followed by western blotting analyses using antibodies against EIF3A and EEF2.
RNA-immunoprecipitation (RIP)-qRT-PCR analyses
RIP analyses were conducted using EZ-Magna RIPTM RNA-Binding Protein Immunoprecipitation Kit (Millipore Sigma, 17–700) according to the manufacturer’s instruction. Briefly, cells were lysed with RIP lysis buffer containing protease and RNase inhibitor, after which cell lysate supernatant was incubated with anti-YTHDF1/YTHDF2 antibody-conjugated beads overnight at 4°C. After being washed with IP buffer for three times, the beads were then treated with proteinase K (Millipore Sigma, 71,049) at 65°C for 0.5 h with occasional shaking. At last, the supernatant was mixed with TRIzol reagent and total RNA was then isolated. Camkk2 and Ppm1a mRNA levels were detected by qRT-PCR, and primer sequences were listed in Table S1.
m6A RIP-qRT-PCR analyses and measurement of cellular m6A levels
Magna MeRIPTM m6A kit was chosen to assess m6A modification levels in target mRNA according to the manufacturer’s instructions (Millipore Sigma, 17–10,499). Briefly, the isolated RNA needs to be fragmented by RNA fragmentation buffer. After saving one tenth of the total RNA as input, the remaining RNAs were performed for immunoprecipitation with m6A antibody (Millipore Sigma, ABE572) coated on magnetic beads A/G (Millipore Sigma, 16–663). After being washed with immunoprecipitation buffer for three times, m6A-modified RNAs were eluted with elution buffer. Finally, eluted RNAs were recovered by ethanol precipitation and then subjected to qRT-PCR assay. Specific primer information about Camkk2 and Ppm1a was list in Table S2. Moreover, total cellular m6A modification levels were detected by EpiQuik m6A RNA Methylation Quantification Kit (Epigentek, P-9005-96), and measurement were carried out in triplicate according to manufacturer’s instructions.
Immunofluorescence analyses
Immunofluorescent staining of testicular tissues was performed as previously described [Citation61]. Rabbit anti-m6A, mouse anti-HSD3B, rabbit-anti METTL14, rabbit-anti ALKBH5, rabbit-anti CAMKK2, and rabbit anti-PPM1A were added to the tissue sections and incubated at 4°C overnight, followed by incubation with secondary antibodies. The images were acquired using a FV3000 confocal fluorescence microscope (Olympus, Tokyo, Japan). For cellular immunofluorescence assay, the cells plated onto cover glasses were fixed with 4% paraformaldehyde, and incubated antibodies according to protocols above. In this study, a total of 3 independent samples were included for quantitative analysis, and 15 Leydig cells for each sample were collected.
Chromatin immunoprecipitation (ChIP) assay
PierceTM Agarose ChIP Kit was chosen to assess binding ability of CEBPB and TFEB to ALKBH5 promoter according to manufacturer’s instruction (Thermo Fisher Scientific, 26,156). DNA immunoprecipitated with anti-CEBPB or TFEB was subjected to qRT-PCR assay. Primer sets targeting those regions containing potential CEBPB or TFEB binding sites in ALKBH5 promoter were provided in Table S3.
Luciferase report assay
The indicated cells were seeded in 12-well plates and transfected with pmirGLO luciferase vector (Promega, E1330) fused with wild-type or mutated Ppm1a-3ʹUTR or Camkk2. The firefly luciferase and Renilla luciferase activity in each cell were detected by dual-luciferase reporter assay system (Promega, E1910). TM3 cells were transfected with pGL3-Basic vector (Promega, E1751) fused with Alkbh5 promoter sequence (−2000 ~ −1), after which promoter luciferase activity was measured. Moreover, luciferase activity needs to be normalized by co-transfection with pRL-TK-Renilla vector (Promega, E2241).
Animal experiments and patient sample collection
Male SPF BALB/c mice (qls02-0202) were purchased from Qinglongshan animal breeding farm. Mice were sacrificed by CO2 asphyxiation and testes were obtained for following histopathological analyses. Moreover, serum testosterone levels were measured by radioimmunoassay. In this study, the 14 clinical testicular specimens from azoospermia and oligospermia patients were collected from Center of Reproductive Medicine at the First Affiliated Hospital of Nanjing Medical University (Nanjing, China) with appropriate informed consent from patients. Based on levels of serum testosterone, these patients were further classified into low testosterone group (testosterone < 10.4 nM, n = 9) and normal testosterone group (testosterone > 10.4 nM, n = 5).
Statistical analysis
The data were analyzed for statistical significance with SPSS 18.0 (SPSS, Chicago, IL, USA). One-way ANOVA with Duncan’s post hoc test was used to analyze the difference between groups; the Student’s t-test was used for paired comparisons. A p value of less than 0.05 was considered statistically significant.
Supplemental Material
Download MS Word (14.2 MB)Disclosure statement
No potential conflict of interest was reported by the authors.
Supplementary material
Supplemental data for this article can be accessed here.
Additional information
Funding
References
- Dudek P, Kozakowski J, Zgliczynski W. Late-onset hypogonadism. Przeglad Menopauzalny = Menopause Rev. 2017;16(2):66–69.
- Sinclair M, Grossmann M, Gow PJ, et al. Testosterone in men with advanced liver disease: abnormalities and implications. J Gastroenterol Hepatol. 2015;30(2):244–251.
- Gao F, Li G, Liu C, et al. Autophagy regulates testosterone synthesis by facilitating cholesterol uptake in Leydig cells. J Cell Biol. 2018;217(6):2103–2119.
- Li WR, Chen L, Chang ZJ, et al. Autophagic deficiency is related to steroidogenic decline in aged rat Leydig cells. Asian J Androl. 2011;13(6):881–888.
- Liu ZY, Zhou RY, Lu X, et al. Identification of late-onset hypogonadism in middle-aged and elderly men from a community of China. Asian J Androl. 2016;18(5):747–753.
- Wang C, Nieschlag E, Swerdloff R, et al. Investigation, treatment and monitoring of late-onset hypogonadism in males: ISA, ISSAM, EAU, EAA and ASA recommendations. Eur J Endocrinol. 2008;159(5):507–514.
- Chen H, Ge RS, Zirkin BR. Leydig cells: from stem cells to aging. Mol Cell Endocrinol. 2009;306(1–2):9–16.
- Wang X, Pan L, Zou Z, et al. Hypoxia reduces testosterone synthesis in mouse Leydig cells by inhibiting NRF1-activated StAR expression. Oncotarget. 2017;8(10):16401–16413.
- Midzak AS, Chen H, Papadopoulos V, et al. Leydig cell aging and the mechanisms of reduced testosterone synthesis. Mol Cell Endocrinol. 2009;299(1):23–31.
- Codogno P, Mehrpour M, Proikas-Cezanne T. Canonical and non-canonical autophagy: variations on a common theme of self-eating?. Nat Rev Mol Cell Biol. 2011;13(1):7–12.
- Liu C, Wang H, Shang Y, et al. Autophagy is required for ectoplasmic specialization assembly in sertoli cells. Autophagy. 2016;12(5):814–832.
- Luciani A, Festa BP, Chen Z, et al. Defective autophagy degradation and abnormal tight junction-associated signaling drive epithelial dysfunction in cystinosis. Autophagy. 2018;14(7):1157–1159.
- Pi H, Li M, Zou L, et al. AKT inhibition-mediated dephosphorylation of TFE3 promotes overactive autophagy independent of MTORC1 in cadmium-exposed bone mesenchymal stem cells. Autophagy. 2019;15(4):565–582.
- Alers S, Loffler AS, Wesselborg S, et al. Role of AMPK-mTOR-Ulk1/2 in the regulation of autophagy: cross talk, shortcuts, and feedbacks. Mol Cell Biol. 2012;32(1):2–11.
- Kim J, Kundu M, Viollet B, et al. AMPK and mTOR regulate autophagy through direct phosphorylation of Ulk1. Nat Cell Biol. 2011;13(2):132–141.
- Padmanabhan K, Robles MS, Westerling T, et al. Feedback regulation of transcriptional termination by the mammalian circadian clock PERIOD complex. Science. 2012;337(6094):599–602.
- Moore MJ. From birth to death: the complex lives of eukaryotic mRNAs. Science. 2005;309(5740):1514–1518.
- Liu N, Pan T. N6-methyladenosine-encoded epitranscriptomics. Nat Struct Mol Biol. 2016;23(2):98–102.
- Zhao BS, Roundtree IA, He C. Post-transcriptional gene regulation by mRNA modifications. Nat Rev Mol Cell Biol. 2017;18(1):31–42.
- Meyer KD, Jaffrey SR. Rethinking m(6)A readers, writers, and erasers. Annu Rev Cell Dev Biol. 2017;33:319–342.
- Shi H, Wei J, He C. Where, when, and how: context-dependent functions of RNA methylation writers, readers, and erasers. Mol Cell. 2019;74(4):640–650.
- Song H, Feng X, Zhang H, et al. METTL3 and ALKBH5 oppositely regulate m(6)A modification of TFEB mRNA, which dictates the fate of hypoxia/reoxygenation-treated cardiomyocytes. Autophagy. 2019;15(8):1419–1437.
- Liu J, Eckert MA, Harada BT, et al. m(6)A mRNA methylation regulates AKT activity to promote the proliferation and tumorigenicity of endometrial cancer. Nat Cell Biol. 2018;20(9):1074–1083.
- Liu J, Yue Y, Han D, et al. A METTL3-METTL14 complex mediates mammalian nuclear RNA N6-adenosine methylation. Nat Chem Biol. 2014;10(2):93–95.
- Ping XL, Sun BF, Wang L, et al. Mammalian WTAP is a regulatory subunit of the RNA N6-methyladenosine methyltransferase. Cell Res. 2014;24(2):177–189.
- Fu Y, Jia G, Pang X, et al. FTO-mediated formation of N6-hydroxymethyladenosine and N6-formyladenosine in mammalian RNA. Nat Commun. 2013;4:1798.
- Zheng G, Dahl JA, Niu Y, et al. ALKBH5 is a mammalian RNA demethylase that impacts RNA metabolism and mouse fertility. Mol Cell. 2013;49(1):18–29.
- Dominissini D, Moshitch-Moshkovitz S, Schwartz S, et al. Topology of the human and mouse m6A RNA methylomes revealed by m6A-seq. Nature. 2012;485(7397):201–206.
- Li A, Chen YS, Ping XL, et al. Cytoplasmic m(6)A reader YTHDF3 promotes mRNA translation. Cell Res. 2017;27(3):444–447.
- Patil DP, Pickering BF, Jaffrey SR. Reading m(6)A in the transcriptome: m(6)A-binding proteins. Trends Cell Biol. 2018;28(2):113–127.
- Wang X, Lu Z, Gomez A, et al. N6-methyladenosine-dependent regulation of messenger RNA stability. Nature. 2014;505(7481):117–120.
- Wang X, Zhao BS, Roundtree IA, et al. N(6)-methyladenosine modulates messenger RNA translation efficiency. Cell. 2015;161(6):1388–1399.
- Zhou J, Wan J, Gao X, et al. Dynamic m(6)A mRNA methylation directs translational control of heat shock response. Nature. 2015;526(7574):591–594.
- Jin S, Zhang X, Miao Y, et al. m(6)A RNA modification controls autophagy through upregulating ULK1 protein abundance. Cell Res. 2018;28(9):955–957.
- Lin X, Chai G, Wu Y, et al. RNA m(6)A methylation regulates the epithelial mesenchymal transition of cancer cells and translation of Snail. Nat Commun. 2019;10(1):2065.
- Zhuang M, Li X, Zhu J, et al. The m6A reader YTHDF1 regulates axon guidance through translational control of Robo3.1 expression. Nucleic Acids Res. 2019;47(9):4765–4777.
- Haussmann IU, Bodi Z, Sanchez-Moran E, et al. m(6)A potentiates Sxl alternative pre-mRNA splicing for robust Drosophila sex determination. Nature. 2016;540(7632):301–304.
- Wang Y, Li Y, Toth JI, et al. N6-methyladenosine modification destabilizes developmental regulators in embryonic stem cells. Nat Cell Biol. 2014;16(2):191–198.
- Wu Y, Xie L, Wang M, et al. Mettl3-mediated m(6)A RNA methylation regulates the fate of bone marrow mesenchymal stem cells and osteoporosis. Nat Commun. 2018;9(1):4772.
- Aguilo F, Zhang F, Sancho A, et al. Coordination of m(6)A mRNA methylation and gene transcription by ZFP217 regulates pluripotency and reprogramming. Cell Stem Cell. 2015;17(6):689–704.
- Lence T, Akhtar J, Bayer M, et al. m(6)A modulates neuronal functions and sex determination in Drosophila. Nature. 2016;540(7632):242–247.
- Lin Z, Hsu PJ, Xing X, et al. Mettl3-/Mettl14-mediated mRNA N(6)-methyladenosine modulates murine spermatogenesis. Cell Res. 2017;27(10):1216–1230.
- Zhang S, Zhao BS, Zhou A, et al. m(6)A demethylase ALKBH5 maintains tumorigenicity of glioblastoma stem-like cells by sustaining FOXM1 expression and cell proliferation program. Cancer Cell. 2017;31(4):591–606 e6.
- Guo Y, Shen O, Han J, et al. Circadian rhythm genes mediate fenvalerate-induced inhibition of testosterone synthesis in mouse Leydig cells. J Toxicol Environ Health Part A. 2017;80(23–24):1314–1320.
- Choi H, Merceron C, Mangiavini L, et al. Hypoxia promotes noncanonical autophagy in nucleus pulposus cells independent of MTOR and HIF1A signaling. Autophagy. 2016;12(9):1631–1646.
- Qi D, Young LH. AMPK: energy sensor and survival mechanism in the ischemic heart. Trends Endocrinol Metab. 2015;26(8):422–429.
- Maric D, Kostic T, Kovacevic R. Effects of acute and chronic immobilization stress on rat Leydig cell steroidogenesis. J Steroid Biochem Mol Biol. 1996;58(3):351–355.
- Teerds KJ, de Rooij DG, de Jong FH, et al. Development of the adult-type Leydig cell population in the rat is affected by neonatal thyroid hormone levels. Biol Reprod. 1998;59(2):344–350.
- Bass J. Circadian topology of metabolism. Nature. 2012;491(7424):348–356.
- Li YX, Guo X, Gulappa T, et al. SREBP plays a regulatory role in LH/hCG receptor mRNA expression in human granulosa-lutein cells. J Clin Endocrinol Metab. 2019;104(10):4783–4792.
- Suzuki H, Kazeto Y, Gen K, et al. Functional analysis of recombinant single-chain Japanese eel Fsh and Lh produced in FreeStyle 293-F cell lines: binding specificities to their receptors and differential efficacy on testicular steroidogenesis. Gen Comp Endocrinol. 2019;285:113241.
- Pastore N, Brady OA, Diab HI, et al. TFEB and TFE3 cooperate in the regulation of the innate immune response in activated macrophages. Autophagy. 2016;12(8):1240–1258.
- Medina DL, Ballabio A. Lysosomal calcium regulates autophagy. Autophagy. 2015;11(6):970–971.
- Sakamaki JI, Long JS, New M, et al. Emerging roles of transcriptional programs in autophagy regulation. Transcription. 2018;9(2):131–136.
- Tong Y, Song F. Intracellular calcium signaling regulates autophagy via calcineurin-mediated TFEB dephosphorylation. Autophagy. 2015;11(7):1192–1195.
- Li X, Zhang X, Zheng L, et al. Hypericin-mediated sonodynamic therapy induces autophagy and decreases lipids in THP-1 macrophage by promoting ROS-dependent nuclear translocation of TFEB. Cell Death Dis. 2016;7(12):e2527.
- Lin S, Choe J, Du P, et al. The m(6)A methyltransferase METTL3 promotes translation in human cancer cells. Mol Cell. 2016;62(3):335–345.
- Chen Y, Wang J, Zhang Q, et al. Microcystin-leucine arginine exhibits immunomodulatory roles in testicular cells resulting in orchitis. Environ Pollut. 2017;229:964–975.
- Ma W, Li S, Ma S, et al. Zika virus causes testis damage and leads to male infertility in mice. Cell. 2016;167(6):1511–24 e10.
- Chen Y, Wang J, Pan C, et al. Microcystin-leucine-arginine causes blood-testis barrier disruption and degradation of occludin mediated by matrix metalloproteinase-8. Cell Mol Life Sci. 2018;75(6):1117–1132.
- Chen Y, Wang J, Chen X, et al. Microcystin-leucine arginine mediates apoptosis and engulfment of Leydig cell by testicular macrophages resulting in reduced serum testosterone levels. Aquatic Toxicol. 2018;199:116–126.