
ABSTRACT
The precise mechanism through which macroautophagy/autophagy affects psoriasis is poorly understood. Here, we found that keratinocyte (KC) autophagy, which was positively correlated with psoriatic severity in patients and mouse models and could be inhibited by mitogen-activated protein kinase (MAPK) family inactivation. The impairment of autophagic flux alleviated psoriasisform inflammation. We also found that an autophagy-based unconventional secretory pathway (autosecretion) dependent on ATG5 (autophagy related 5) and GORASP2 (golgi reassembly stacking protein 2) promoted psoriasiform KC inflammation. Moreover, the alarmin HMGB1 (high mobility group box 1) was more effective than other autosecretory proteins in regulating psoriasiform cutaneous inflammation. HMGB1 neutralization in autophagy-efficient KCs eliminated the differences in psoriasiform inflammation between Krt14+/+-Atg5f/f KCs and Krt14Cre/+-atg5f/f KCs, and conversely, recombinant HMGB1 almost completely restored psoriasiform inflammation in Krt14Cre/+-atg5f/f KCs in vivo. These results suggest that HMGB1-associated autosecretion plays a pivotal role in cutaneous inflammation. Finally, we demonstrated that Krt14Cre/+-hmgb1f/f mice displayed attenuated psoriatic inflammation due to the essential crosstalk between KC-specific HMGB1-associated autosecretion and γδT cells. Thus, this study uncovered a novel autophagy mechanism in psoriasis pathogenesis, and the findings imply the clinical significance of investigating and treating psoriasis.
Abbreviations: 3-MA: 3-methyladenine; ACTB: actin beta; AGER: advanced glycosylation end-product specific receptor; Anti-HMGB1: anti-HMGB1 neutralizing antibody; Anti-IL18: anti-IL18 neutralizing antibody; Anti-IL1B: anti-IL1B neutralizing antibody; ATG5: autophagy related 5; BAF: bafilomycin A1; BECN1: beclin 1; CASP1: caspase 1; CCL: C-C motif chemokine ligand; CsA: cyclosporine A; ctrl shRNA: lentivirus harboring shRNA against control; CXCL: C-X-C motif chemokine ligand; DCs: dendritic cells; DMEM: dulbecco’s modified Eagle’s medium; ELISA: enzyme-linked immunosorbent assay; EM: electron microscopy; FBS: fetal bovine serum; GORASP2 shRNA: lentivirus harboring shRNA against GORASP2; GORASP2/GRASP55: golgi reassembly stacking protein 2; GR1: a composite epitope between LY6 (lymphocyte antigen 6 complex) locus C1 and LY6 locus G6D antigens; H&E: hematoxylin and eosin; HMGB1: high mobility group box 1; HMGB1 shRNA: lentivirus harboring shRNA against HMGB1; IFNG/IFN-γ: interferon gamma; IL17A: interleukin 17A; IL18: interleukin 18; IL1A/IL-1α: interleukin 1 alpha; IL1B/IL-1β: interleukin 1 beta; IL22/IL-22: interleukin 22; IL23A: interleukin 23 subunit alpha; IL23R: interleukin 23 receptor; IMQ: imiquimod; ITGAM/CD11B: integrin subunit alpha M; ITGAX/CD11C: integrin subunit alpha X; IVL: involucrin; KC: keratinocyte; KD: knockdown; KO: knockout; Krt14+/+-Atg5f/f mice: mice bearing an Atg5 flox allele, in which exon 3 of the Atg5 gene is flanked by two loxP sites; Krt14+/+-Hmgb1f/f: mice bearing an Hmgb1 flox allele, in which exon 2 to 4 of the Hmgb1 gene is flanked by two loxP sites; Krt14Cre/+-atg5f/f mice: keratinocyte-specific atg5 knockout mice generated by mating Atg5-floxed mice with mice expressing Cre recombinase under the control of the promoter of Krt4; Krt14Cre/+-hmgb1f/f mice: keratinocyte-specific hmgb1 knockout mice generated by mating Hmgb1-floxed mice with mice expressing Cre recombinase under the control of the promoter of Krt14; Krt14-Vegfa mice: mice expressing 164-amino acid Vegfa splice variant recombinase under the control of promoter of Krt14; LAMP1: lysosomal associated membrane protein 1; LDH: lactate dehydrogenase; LORICRIN: loricrin cornified envelope precursor protein; M5: TNF, IL1A, IL17A, IL22 and OSM in combination; MAP1LC3/LC3: microtubule associated protein 1 light chain 3; MAPK: mitogen-activated protein kinase; MKI67: marker of proliferation Ki-67; MTT: thiazolyl blue tetrazolium bromide; NFKB/NF-κB: nuclear factor kappa B; NHEKs: primary normal human epidermal keratinocytes; NS: not significant; OSM: oncostatin M; PASI: psoriasis area and severity index; PtdIns3K: class III phosphatidylinositol 3-kinase; qRT-PCR: quantitative RT-PCR; RELA/p65: RELA proto-oncogene, NF-kB subunit; rHMGB1: recombinant HMGB1; rIL18: recombinant interleukin 18; rIL1B: recombinant interleukin 1 beta; S100A: S100 calcium binding protein A; SQSTM1/p62: sequestosome 1; T17: IL17A-producing T; TCR: T-cell receptor; tcrd KO mice: tcrd (T cell receptor delta chain) knockout mice, which show deficient receptor expression in all adult lymphoid and epithelial organs; TLR: toll-like receptor; TNF/TNF-α: tumor necrosis factor; WOR: wortmannin; WT: wild-type; γδT17 cells: IL17A-producing γδ T cells.
Introduction
Psoriasis is a recurrent autoimmune skin disease that is characterized by excessive hyperproliferation and aberrant differentiation of KCs [Citation1]. In the immunopathogenesis of psoriasis, proinflammatory cytokines synergistically stimulate KCs to produce chemokines (CCL20 [C-C motif chemokine ligand 20], CXCL1 [C-X-C motif chemokine ligand 1], CXCL2, and CXCL8), antimicrobial peptides (S100A7 [S100 calcium binding protein A7], S100A8, S100A9, S100A12, DEFB4A/DEFB2 [defensin beta 4A/defensin beta 2] and CAMP/LL37 [cathelicidin antimicrobial peptide]), and other inflammatory factors that attract and activate pathogenic IL17A (interleukin 17A)-producing T (T17) cells and neutrophils, and thereby further amplify the IL23A (interleukin 23 subunit alpha)-IL17A axis [Citation2]. The crosstalk between KCs and T17 cells generates immune circuits responsible for the induction and maintenance of psoriasis. Thus, psoriatic KCs play central roles in the inflammatory pathogenic loop of psoriasis, not only as immune responses trigger but also as proinflammatory effectors.
Autophagy is an essential process through which cells break down their components to maintain homeostasis [Citation3,Citation4]. Connections between several autophagy loci and genetic predispositions for inflammatory diseases, including rheumatoid arthritis (ATG5), systemic lupus erythematosus (ATG5 and DRAM1 [DNA damage regulated autophagy modulator 1]), and inflammatory bowel disease (ATG16L1 [autophagy related 16 like 1] and IRGM [immunity related GTPase M]), have been proposed [Citation5]. Autophagy contributes to autoimmune responses in multiple sclerosis by promoting T cell survival through the degradation of cell death-related proteins [Citation6], it also protects against gut inflammation in inflammatory bowel disease by suppressing IL1B (interleukin 1 beta) processing via autophagic degradation of the NLRP3 (NLR family pyrin domain containing 3) inflammasome [Citation7]. Importantly, autophagy has been reported to be a potential therapeutic target for several autoimmune diseases [Citation5,Citation8], and the autophagy inducer rapamycin and the autophagy inhibitor chloroquine have been successfully used to treat patients with systemic lupus erythematosus [Citation9] and rheumatoid arthritis [Citation10], respectively. Notably, a link between autophagy and psoriasis has been observed because polymorphisms in the autophagy gene ATG16L1 (autophagy related 16 like 1) are associated with psoriasis [Citation11]. Bone marrow-derived cell (BMDC) autophagy induces the degradation of MYD88 (MYD88 innate immune signal transduction adaptor) and controls the activation of MYD88-dependent cytokines upon imiquimod (IMQ) stimulation in a mouse model of psoriasis [Citation12]. These findings imply that autophagy might play a pivotal function in psoriasis.
Studies of autophagy in cell differentiation, antimicrobial defense, and the immune responses of KCs are continuously performed [Citation13]. Recent studies have demonstrated that terminal differentiation in KC cultures accompany the targeted autophagic degradation of nuclear material (nucleophagy) [Citation14], and blockade of autophagy inhibits the expression of markers of differentiation (LORICRIN [loricrin cornified envelope precursor protein], FLG [filaggrin], and IVL [involucrin]) in KCs [Citation15,Citation16]. The autophagic response of KCs also contributes to the elimination of intracellular pore-forming toxins that are necessary for bacterial infection [Citation17]. In addition, emerging lines of evidence suggest that the autophagic degradation of the NFKBIA (NFKB inhibitor alpha) controls the activation of NFKB/NF-κB (nuclear factor kappa B) by the selective autophagy receptor SQSTM1/p62 (sequestosome 1) in TLR2/6 (toll-like receptor 2/6) agonist- or IL1B-stimulated KCs [Citation18,Citation19]. Importantly, studies have shown that constitutive granular layer autophagy is deregulated in psoriasis patients [Citation14,Citation18,Citation20]. IL17A enhances autophagic flux in KCs to promote the degradation of cholesterol, and this effect is related to psoriasis [Citation20]. These findings imply that degradative autophagy is involved in the physiological mechanisms of KCs.
However, recent studies on mammalian systems have suggested that secretory autophagy plays a remarkably broad biogenesis-related role in protein trafficking and secretion [Citation21]. However, scarce information is currently available on the association of secretory autophagy with the disease. Here, we revealed a novel immunoregulatory mechanism of autophagy in psoriasis and highlighted the essential role of KC-derived alarmin autosecretion in cutaneous disease. Our results showed that autophagy-related markers were functionally active in psoriatic KCs of patients and mouse models. Activated autophagy was involved in the MAPK pathways, which responded to psoriasis-associated proinflammatory cytokines. Moreover, we demonstrated that autophagy deficiency decreased NFKB activation and chemokine/antimicrobial peptide expression in psoriasiform KCs and ameliorated IMQ-induced skin lesions in Krt14Cre/+-atg5f/f mice accompanied by a reduction in the number of IL17A-producing γδ T (γδT17) cells. We further showed that psoriasiform KCs released autosecretory proteins via an autophagy-mediated export pathway that depended on ATG5 and GORASP2. The administration of autosecretory proteins, particularly alarmin HMGB1, was found to rescue the pathogenicity of atg5-knockout (KO) KCs in the psoriasis model. The symptom relief observed in Krt14Cre/+-hmgb1f/f mice implicated a vital pathogenic role of autosecretion in psoriasis. We further demonstrated that KCs-γδ T cell crosstalk was indispensable for the vital role of KC autosecretion in skin inflammation. Our findings provide in-depth insights into secretory autophagy function in immune-related diseases and offer a potential new therapeutic strategy involving the reduction of autosecretion.
Results
Autophagy-related proteins are functionally active in psoriatic keratinocytes
To determine the autophagy levels in psoriatic patients, we analyzed the autophagy-related markers in psoriatic skin lesions. BECN1/Beclin 1, a well-known key regulator of autophagy, was expressed at low levels in the basal layer of the healthy epidermis, whereas its expression shifted to the basal and suprabasal epidermal layers in human psoriatic lesions; in addition, its expression levels were higher in the psoriatic epidermis than in the healthy controls epidermis (). Moreover, we found a positive correlation between the average intensities of BECN1 expression and the Baker scores, which we assessed as described previously to reflect the psoriasis severity in humans [Citation22] ( and Table S1). The expression levels of a key autophagy gene, ATG5, were significantly higher in the human psoriatic epidermis than in the healthy control epidermis (). MAP1LC3A/LC3A and MAP1LC3B/LC3B, two important isoforms of MAP1LC3/LC3 (microtubule associated protein 1 light chain 3) that are both involved in the biogenesis of autophagosomes and cargo recruitment, are widely used as biomarkers of autophagy [Citation23,Citation24]. Although LC3B expression is absent from all layers of the psoriatic epidermis [Citation14,Citation20], the appearance of LC3-positive puncta is indicative of the occurrence of autophagy [Citation24]. First, we evaluated the specificities of anti-LC3 antibodies in targeting LC3A/B, LC3A, and LC3B, respectively (Figure S1A). Furthermore, the numbers of LC3A/B, LC3A, and LC3B puncta were increased in the human psoriatic epidermis compared with the healthy epidermis, as demonstrated by immunofluorescence (). The ultrastructural analysis of electron microscopy (EM) images revealed that the KCs of human psoriatic skin lesions exhibited more autophagic vesicles than those of healthy skin samples (). These results suggest that autophagy is activated in psoriatic KCs.
Figure 1. Autophagy-related proteins are functionally active in psoriatic keratinocytes. (A) Expression of the autophagy marker BECN1 in the epidermis of psoriatic patients and normal subjects. Representative immunostaining images of skin (left) and quantification of staining intensity in the epidermis (right). Scale bar: 50 μm. n = 12/group. (B) A significant correlation was found between the average epidermal BECN1 intensities in (A) and the Baker scores of psoriatic lesions (r and p values obtained with Spearman’s rank correlation test). (C and D) Expression of the indicated autophagy markers in the epidermis of psoriatic patients and normal subjects. (C) Representative ATG5 immunostaining images (left) and quantification of staining intensity in the epidermis (right), scale bar: 50 μm, n = 6/group. (D) Representative immunofluorescence of LC3 immunostaining images (top) and quantification of LC3 puncta in the epidermis (bottom, more than 200 epidermal cells were counted each specimen), scale bar: overviews (50 μm) and insets (10 μm), n = 7/group. (E) Representative electron microscopic images of keratinocytes of lesional psoriatic skin and healthy skin (top) and quantification of autophagic vacuoles (bottom), more than 10 cells were counted from each specimen. Black arrow, autophagic vacuoles; N, nucleus. Scale bar: 1 µm. (F-I) Expression of autophagy markers in the back skin of the IMQ mouse model (F and H) and the ear skin of the Krt14-Vegfa transgenic mouse model (G and I) at the indicated time points (d: day; mo: month), n = 5/group. (F and G) Representative immunoblots of indicated proteins from skin lysates. (H and I) Quantification of immunohistochemical staining intensity of BECN1 in the epidermis. (J-M) Skin autophagy was detected in an IMQ-induced psoriasis mouse model (J and L) and a Krt14-Vegfa transgenic mouse model of psoriasis (K and M) after treatment with therapeutic, recombinant IL23R-FC (0.5 or 1 mg/kg) or cyclosporin A (CsA; 20 or 50 mg/kg), n = 5/group. (J and K) Representative immunoblots of BECN1, LC3A/B-II and ATG5 from skin lysates. (L and M) Quantification of immunohistochemical staining intensity of BECN1 in the epidermis. ACTB was detected as a loading control in (F, G, J and K). Mean ± SD. *P < 0.05; **P < 0.01; ***P < 0.001. Two-tailed Student’s T-test (A and C-E). One-way ANOVA (H, I, L and M). All the data are representative of three independent experiments
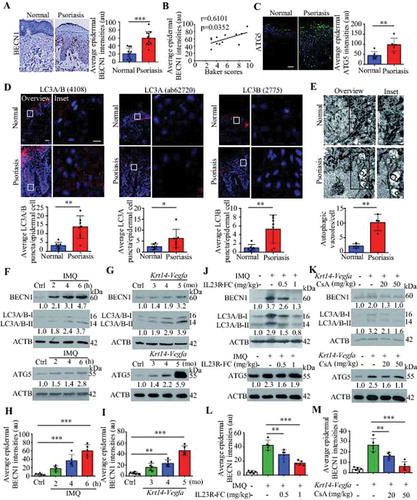
We obtained similar results in two mouse models, an IMQ-induced psoriasis-like mouse model [Citation25,Citation26] and a mouse strain expressing 164-amino acid Vegfa splice variant recombinase under the control of the promoter of Krt14 (a Krt14-Vegfa transgenic mouse model) [Citation27]. The expression of autophagy markers (BECN1, LC3A/B-II, and ATG5) in the skin and BECN1 in the epidermis were consistently increased as the disease progressed, as verified by western blot analysis and immunohistochemical analysis (; S1B and C). The analysis of psoriasis-like models treated with biological therapeutics (IL23R [interleukin 23 receptor]-Fc recombinant proteins) or a calcineurin inhibitor (cyclosporine A, CsA) demonstrated that the expression of skin autophagy markers (LC3A/B-II and BECN1) and epidermal BECN1 were decreased in the treatment group compared with the control group (; S1D and E), even though IL23R-Fc and CsA had a slightly inhibitory effect on ATG5 expression in psoriasis lesions (). These results suggest that the KC autophagy pathway might play a crucial role in psoriasis.
Activation of MAPK signaling pathways is involved in autophagy in psoriasiform keratinocytes
TNF (tumor necrosis factor), IL1A (interleukin 1 alpha), IL17A, IL22 (interleukin 22), and OSM (oncostatin M) are closely associated with the pathogenesis of psoriasis. KCs stimulated with the mixture of these five proinflammatory cytokines (termed as M5) constitute a psoriasiform KC model in vitro [Citation28], as described in our previous study [Citation29]. Both the M5 combination and the individual cytokines significantly induced LC3-II levels in KCs (; S2A-C). We observed increases in EGFP-LC3 puncta accumulation in M5-induced HaCaT cells (). Furthermore, EM ultrastructural analysis showed that the numbers of autophagic vacuoles per cell were significantly higher in M5-stimulated NHEKs (primary normal human epidermal keratinocytes) than in unstimulated NHEKs (). The ATG5 levels in KCs slightly increased at 24 h, and 48 h of stimulation with M5 (Figure S2C-F), and SQSTM1 (a selective autophagy receptor) levels had no significant difference in M5-stimulated KCs (Figure S2C). Altogether, these results suggest that M5 induced an increase in autophagosomes in KCs.
Figure 2. The activation of MAPK signaling pathways is involved in autophagy in psoriasiform keratinocytes. (A and B) Representative LC3A/B-II immunoblots from HaCaT cells (A) and NHEK cells (B) stimulated with or without M5 for the indicated times. (C) EGFP-LC3-transfected HaCaT cells were stimulated with or without M5 for the indicated times, n = 3/group. Representative fluorescence images (left) and quantification of EGFP-LC3 puncta in keratinocytes (right, more than 50 cells were counted each condition). Scale bar: 10 μm. (D) Representative electron microscopic images of NHEKs treated with or without M5 for 48 h (top). Black arrow, autophagic vacuoles; N, nucleus; scale bar: 2 μm. Quantification of autophagic vacuoles (bottom, more than 20 cells were counted for each condition), n = 5/group. (E and F) Representative images of LC3A/B and lysosomal marker LAMP1 immunostaining in HaCaT cells (E) and NHEK cells (F) stimulated with or without M5 (left). Scale bar: 10 μm. Pearson’s colocalization coefficient for LC3A/B and LAMP1 (right), n = 5-6/group. (G) NHEKs were pre-treated with or without 3-methyladenine (3-MA; 4 h, 10 mM), bafilomycin A1 (BAF; 4 h, 200 nM) or wortmannin (WOR; 4 h, 100 nM), and then stimulated with or without M5 for 48 h. Immunoblot analysis of the LC3A/B-II levels. (H) Representative immunoblots of MAPK proteins in HaCaT cells stimulated with or without M5 in a time-dependent manner. (I) Representative immunoblots of MAPKs (MAPK8/9/10, MAPK1/3 and MAPK14) for HaCaT cells that were transiently transfected with MAPKs (MAPK8/9/10, MAPK1/3 and MAPK14) siRNA or control siRNA for 48 h. (J and K) HaCaT cells were transiently transfected with MAPKs (MAPK8/9/10, MAPK1/3 and MAPK14) siRNA or control siRNA for 48 h, and were then treated with M5 for 48 h. Representative LC3A/B-II immunoblots (J) and representative images of LC3A/B and lysosomal marker LAMP1 immunostaining (K, left), scale bar: 10 μm. Pearson’s colocalization coefficient for LC3A/B and LAMP1 (K, right), n = 5/group. ACTB was detected as a loading control (A, B and G-J). Mean ± SD. **P < 0.01; ***P < 0.001. Two-tailed Student’s T-test (C-F). One-way ANOVA (K). All the data are representative of three independent experiments
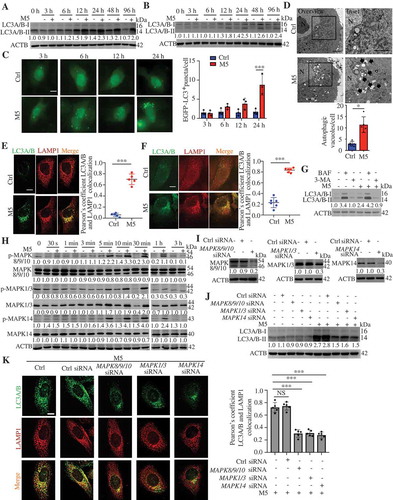
The autophagosome-lysosome fusion was further detected, and we observed increases in the colocalization of LC3 puncta with LAMP1 (lysosomal associated membrane protein 1) in KCs stimulation with the M5 combination or the individual cytokines (; S2G), suggesting that the numbers of autolysosomes increased. Moreover, in NHEKs, the ability of M5 to increase the LC3A/B-II levels were attenuated by pretreatment with 3-methyladenine (3-MA), a class III phosphatidylinositol 3-kinase (PtdIns3K, plays a central role in autophagosome formation by generating the phospholipid PtdIns3P) inhibitor (), but was significantly increased by pretreatment with a vacuolar H+-ATPase inhibitor (bafilomycin A1 [BAF], prevents lysosomal acidification and fusion of autophagosomes with lysosomes) (). Thus, these findings confirmed that KCs stimulated with M5, a combination of psoriasis-associated cytokines, activated autophagic flux.
The mechanisms responsible for the induction of autophagy in psoriasiform KCs are poorly understood. We thus wondered whether MAPK signaling pathways participated in the regulation of autophagy in KCs because previous studies have shown that cytokine inflammatory signaling (by TNF or IL1) triggers autophagy through the activation of MAPK signaling pathways [Citation30,Citation31]. M5 induced the phosphorylation of MAPKs (MAPK8/JNK1 [mitogen-activated protein kinase 8]-MAPK9/JNK2-MAPK10/JNK3, MAPK1/ERK2-MAPK3/ERK1, and MAPK14/p38) as a result of MAPKs activation upon exposure to proinflammatory cytokines (). Furthermore, the knockdown of MAPKs significantly suppressed the increase in the LC3A/B-II levels induced by M5 (). We also observed decreases in the colocalization of LC3 puncta with LAMP1 in M5-stimulated KCs after MAPKs knockdown (KD) (). We obtained similar results with MAPKs inhibitors (Figure S3A and B). These data indicate that MAPK signaling plays a role in the induction of autophagic flux by M5 in KCs.
Keratinocyte-specific ablation of autophagy caused resistance to imiquimod-induced psoriasis
We crossed Atg5 floxed (referred to as Krt14+/+-Atg5f/f hereafter) mice [Citation32] with Krt14-Cre transgenic mice for selective ablation of ATG5 in KCs (referred to as Krt14Cre/+-atg5f/f hereafter) to identify the role of KC autophagy in psoriasis. We confirmed the KC-specific deletion of autophagy by LC3-II immunoblotting (). Moreover, the finding that M5 induced an increase in the LC3-II levels in KCs from Krt14+/+-Atg5f/f mice but not in autophagy-deficient KCs from Krt14Cre/+-atg5f/f mice () confirmed that we disrupted autophagy in psoriasiform Krt14Cre/+-atg5f/f KCs. We observed slightly abnormal keratinization and decreased expression of MKI67 in the epidermis of Krt14Cre/+-atg5f/f mice compared with that of Krt14+/+-Atg5f/f mice (). However, we observed no corresponding clinical phenotype in Krt14Cre/+-atg5f/f mice.
Figure 3. Keratinocyte-specific ablation of autophagy caused resistance to IMQ-induced psoriasis. (A) Representative immunoblots of the indicated autophagy markers from epidermal lysates of Krt14+/+-Atg5f/f and Krt14Cre/+-atg5f/f mice. (B) Representative western blots for the indicated autophagy markers in Krt14+/+-Atg5f/f and Krt14Cre/+-atg5f/f primary murine keratinocytes stimulated with or without M5 for 48 h. (C) Representative images of the dorsal back from Krt14+/+-Atg5f/f and Krt14Cre/+-atg5f/f mice stained with H&E. Scale bars: 50 μm. n = 5/group. (D) Representative MKI67 immunohistochemistry of the back skin (left), scale bars: 50 μm. MKI67-positive cells were quantified by counting the stained dots (right). n = 5/group. (E-J) The Krt14+/+-Atg5f/f and Krt14Cre/+-atg5f/f mice were treated with IMQ for 5 d, n = 5/group. (E) Representative images of the dorsal back from mice (left) and mice PASI scores were depicted (right). (F) Representative histological sections of the dorsal back from mice stained with H&E (left), and quantification of the epidermal thickness based on epidermal thickness measurements (right), scale bars: 50 μm. Representative immunohistochemistry images of MKI67 in the dorsal back of mice, scale bars: 50 μm (left). (G) Quantification of MKI67-positive cells in the epidermis of the dorsal back (right). (H and I) qRT-PCR analysis of indicated genes from the dorsal skin RNA of mice. (J) Representative and quantification of intracellular FACS analysis of IL17-producing cells, neutrophils cells, Vγ5+ cells and IFNG+ cells in dorsal skin. ACTB was detected as a loading control (A and B). Mean ± SD. *P < 0.05; **P < 0.01; ***P < 0.001. Two-tailed Student’s T-test (D-J). All the data are representative of three independent experiments
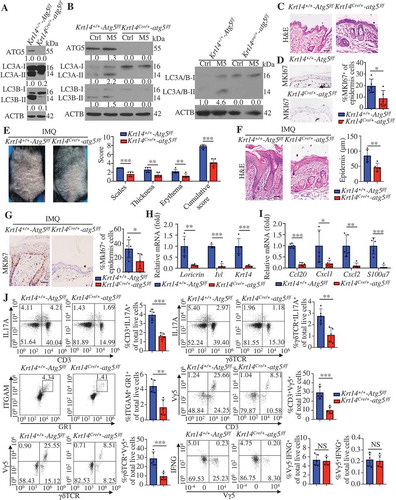
We investigated whether autophagy affects IMQ-induced psoriasis-like inflammation. IMQ induced increases in the mouse psoriasis area and severity index (PASI; evaluates erythema, scales, and thickness) [Citation25,Citation26] and the epidermal thickness on the backs of Krt14+/+-Atg5f/f mice compared with those of Krt14Cre/+-atg5f/f mice (). We observed significant reductions in the number of MKI67+ KCs () and the expression of skin differentiation and proliferation markers (Lor, Ivl, and Krt14) () in IMQ-treated Krt14Cre/+-atg5f/f mice compared with Krt14+/+-Atg5f/f mice. These results suggest that autophagy may be critical for IMQ-induced KC proliferation and differentiation. We subsequently determined whether autophagy deficiency in KCs affects IMQ-induced skin inflammation. IL17A is critical for psoriatic skin inflammation, and γδT cells are considered as the predominant IL17A-producing cells in IMQ-induced psoriasis inflammation [Citation33,Citation34]. Krt14Cre/+-atg5f/f mice showed decreased expression of T17 cell chemotactic factors (Ccl20), neutrophil chemotactic factors (Cxcl1 and Cxcl2) and antimicrobial peptide S100a7 in skin lesions compared with Krt14+/+-Atg5f/f mice (). In addition, the percentages of IL17A-producing cells, T17 cells (IL17A+CD3+ T cells) or γδT17 cells (IL17A+γδΤCR+ cells), and neutrophil cells (ITGAM/CD11B [integrin subunit alpha M]-positive, a composite epitope between LY6 (lymphocyte antigen 6 complex) locus C1 and LY6 locus G6D antigens [GR1]-positive cells) were determined to be lower in Krt14Cre/+-atg5f/f skin than in Krt14+/+-Atg5f/f skin by flow cytometric analysis (). IFNG/IFN-γ (interferon gamma) mainly expressed in CD4+ T cell, and we observed no significant differences in IFNG+ cells among the groups ( and S4). ITGAX/CD11C (integrin subunit alpha X)+ dendritic cells (DCs) and ITGAM+ADGRE1/F4/80+ macrophages also did not change among the groups (data not shown). Altogether, these results demonstrate that autophagy deficiency in KCs can ameliorate a psoriasis-like phenotype and IMQ-induced skin inflammation.
We identified Vγ5+ γδT cells to respond by the local secretion of chemokines and cytokines that orchestrate skin inflammation [Citation35]. We found lower percentages of Vγ5+ γδT cells (dendritic epidermal T cells, DETC) in Krt14Cre/+-atg5f/f compared with Krt14+/+-Atg5f/f skin (). However, Vγ5+ γδT cells were dispensable in the IMQ model due to the lack of IL17A expression [Citation34].
Autophagic flux regulates the features of psoriasiform keratinocytes
To identify the role of autophagy in psoriasiform KCs, we assessed the effects of autophagy blockage in KCs after stimulation with M5. We found that treatment with 3-MA, wortmannin (WOR), and BAF significantly decreased the mRNA levels of chemokines (CXCL1, CXCL2, and CCL20) and antimicrobial peptides (S100A7) and the secretion of CXCL8 in M5-stimulated NHEKs (). Thiazolyl blue tetrazolium bromide (MTT) assays demonstrated that the noncytotoxic working concentrations of BAF and 3-MA did not account for the changes in the secretion and transcription levels of inflammatory cytokines in NHEKs (). Furthermore, M5-induced psoriasis-like inflammation decreased in Krt14Cre/+-atg5f/f KCs compared with Krt14+/+-Atg5f/f KCs (). We also found that RELA/p65 (RELA proto-oncogene, NF-kB subunit) translocation to the nucleus was significantly increased in M5-stimulated HaCaT cells compared with control HaCaT cells, but decreased in 3-MA-pretreated M5-stimulated cells compared with non-pretreated M5-stimulated cells ().
Figure 4. Autophagic flux regulates the features of psoriasiform keratinocytes. (A and B) NHEKs were pre-treated with or without 3-methyladenine (3-MA; 4 h, 10 mM), bafilomycin A1 (BAF; 4 h, 200 nM) or wortmannin (WOR; 4 h, 100 nM), and stimulated with or without M5 for 24 h or 48 h, n = 3/group. (A) The RNA levels of the indicated genes were assessed by qRT-PCR at 24 h. (B) ELISA assessed the levels of CXCL8 in the culture medium at 48 h. (C) Treatment with 3-MA (4 h, 10 mM), BAF (4 h, 200 nM) or WOR (4 h, 100 nM) for 72 h did not induce cell death in NHEKs by MTT assay. n = 4/group. (D) Validation of the mRNA expression of the indicated genes by qRT-PCR in both Krt14+/+-Atg5f/f and Krt14Cre/+-atg5f/f primary murine keratinocytes stimulated with or without M5 for 24 h. n = 3/group. (E) HaCaT cells were pretreated with 3-MA (4 h, 10 mM) and stimulated with M5. Representative western blots of RELA in cytoplasmic and nuclear fractions at 48 h (left), and the nuclear/cytosolic RELA intensity ratios (right) are shown. n = 3/group. ACTB served as a loading control for total proteins or cytoplasmic proteins, and HISTONE H3 served as a loading control for nuclear proteins. (F) HaCaT cells were pretreated with or without 3-MA (4 h, 10 mM), stimulated with M5 for 24 h and subjected to whole transcriptome gene expression analysis (criteria: fold-change>1.5, P < 0.01, and false discovery rate adjusted for multiple testing). Functional annotation analysis of the overlapping genes among the upregulated genes (M5 vs. control) and the downregulated genes (M5 + 3-MA vs. M5) using the DAVID tool indicated that the main differences between the groups were associated with 4 main pathogenesis-related functions. A heat map analysis of the differential expression of important representative genes associated with these main pathogenesis-related functions is shown. The color gradient indicates the log2 (fold-change). The results were combined results from two independent experiments. Mean ± SD. *P < 0.05; **P < 0.01; ***P < 0.001. One-way ANOVA (A, B and D). Two-tailed Student’s t-test (C). The data are representative of three independent experiments (A-E)
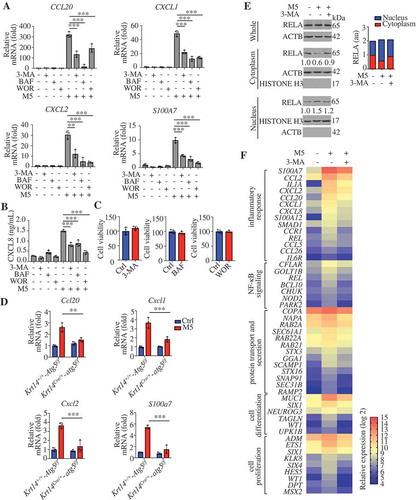
To further elucidate the biological function of autophagy in psoriasiform KCs, we analyzed overlapping differentially expressed genes in the M5 vs. control and M5 + 3-MA vs. M5 comparisons. Upon performing gene enrichment analysis (DAVID [Citation36], http://david.abcc.ncifcrf.gov/) of the overlapping upregulated genes (M5 vs. control) and downregulated genes (M5 + 3-MA vs. M5), we were surprised to discover that functions related to the inflammatory response, NFKB signaling, protein transport, and secretion, cell differentiation and proliferation as the compelling difference between the populations (). A complete list of the genes and Gene Ontology categories is provided in Table S2. The relative expression of important representative genes associated with these main pathogenesis-related functions is also shown (). Among the representative genes, CXCL1, CXCL2, CXCL8, CCL2, CCL5, and CCL20 have immunocyte chemoattractant activity in psoriasis; proinflammatory cytokine or cytokine receptor genes (IL1A, CCR1 [C-C motif chemokine receptor 1], and IL6R [interleukin 6 receptor]) and the psoriasis antimicrobial peptide (S100A7) contribute to amplification of the local immune response; transcription factors (REL [REL proto-oncogene, NF-kB subunit] and SMAD1 [SMAD family member 1]) regulate the expression of inflammatory molecules; REL and BCL10 (BCL10 immune signaling adaptor) play key roles in the regulation of NFKB signaling; GTP-binding proteins (RAB2A [RAB2A, member RAS oncogene family], RAB22A [RAB22A, member RAS oncogene family], and RAB21 [RAB21, member RAS oncogene family]), Sec genes (SEC61A1 [SEC61 translocon alpha 1], SEC31B [SEC31 homolog B, COPII coat complex component]), syntaxins (STX3 [syntaxin 3], STX16 [syntaxin 16]), and SNAP91 (synaptosome associated protein 91) are required for transport and secretory pathways; and SIX1/4 (SIX homeobox 1/4), WT1 (WT1 transcription factor), UPK1B (uroplakin 1B), ETS1 (ETS proto-oncogene 1, transcription factor), and HES5 (hes family bHLH transcription factor 5) control proliferation and differentiation. These results are consistent with those regarding the biological functions of autophagy that may be involved in the IMQ model (), which demonstrates that autophagy is critical for KC inflammation, and KC proliferation and differentiation in psoriasis.
Autophagy-based unconventional secretion of HMGB1 in psoriasiform KCs
Secretory cytokines are considered master regulators of the crosstalk between KCs and immune cells that play major roles in the inflammatory loop of psoriasis. Previous research has indicated that autophagy positively contributes to the secretion of proinflammatory cytokines (HMGB1, IL18 [interleukin 18] and IL1B) via an export pathway in macrophages [Citation21,Citation37–39]. As shown in , the genes associated with “protein transport and secretion” were compellingly regulated by 3-MA in psoriasiform KCs. We further found that the presence of 3-MA, WOR, and BAF significantly inhibited M5-induced HMGB1, IL18, and IL1B secretion (). As shown by the results from a LDH (lactate dehydrogenase) release assay, the increased secretion of these cytokines was not due to increased cell death or nonspecific membrane permeability (). Previous studies have reported that the Golgi reassembly stacking protein GORASP2 facilitates autophagosome-lysosome fusion [Citation40] and controls the secretion of IL18 and IL1B from macrophages [Citation37]. We stably transduced HaCaT cells with lentivirus harboring shRNA against GORASP2 (GORASP2 shRNA) and a scrambled shRNA sequence (ctrl shRNA). The secretion of HMGB1, IL18, and IL1B, as well as the levels of LC3A/B-II, were reduced in the GORASP2-knockdown cells compared to the ctrl shRNA cells upon M5 stimulation (). The evidence above suggests the activation of autosecretion in psoriasiform KCs. Furthermore, the KD of GORASP2 inhibited the expression of chemokines (CXCL1, CXCL2, CXCL8, and CCL20) and antimicrobial peptides (S100A7, S100A8, S100A9, S100A12, and DEFB4A) in M5-stimulated KCs (). In particular, HMGB1 (a prototypical alarmin)-neutralizing antibody (anti-HMGB1) reduced the inflammatory response to a greater degree than IL18 or IL1B neutralizing antibody (anti-IL18 or anti-IL1B, respectively) ( and S5A). These data suggest that autosecretory proteins, particularly HMGB1, may play key roles in psoriatic KCs.
Figure 5. HMGB1, IL1B, and IL18 secretion are regulated by autophagy in psoriasiform keratinocytes dependent on GORASP2. (A and B) NHEK cells were pre-treated with or without 3-methyladenine (3-MA; 4 h, 10 mM), bafilomycin A1 (BAF; 4 h, 200 nM) or wortmannin (WOR; 4 h, 100 nM), and stimulated with or without M5 for 48 h, n = 3/group. (A) ELISA assessed the levels of HMGB1, IL18 and IL1B in the culture medium. (B) The LDH release assay determined cytotoxicity. (C) qRT-PCR analysis of the GORASP2 knockdown levels in HaCaT cells after transfection with GORASP2 shRNA or vector control, n = 3/group. (D-G) Ctrl shRNA KCs and GORASP2 shRNA KCs were stimulated with or without M5 for 24 h or 48 h, n = 3/group. (D) Representative LC3A/B-II immunoblots for KCs after treatment with M5 for 48 h, ACTB was used as a loading control. (E) Analysis of HMGB1, IL18 and IL1B levels in the culture medium by ELISA at 48 h. (F) The RNA levels of chemokines and antimicrobial peptides were assessed by qRT-PCR at 24 h. (G) Analysis of CXCL8 levels in the culture medium by ELISA at 48 h. Mean ± SD. *P < 0.05; **P < 0.01; ***P < 0.001. One-way ANOVA (A-C, E-G). All the data are representative of three independent experiments
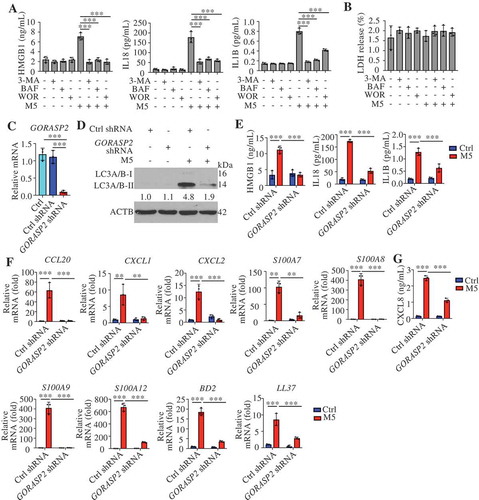
Figure 6. Autophagy-based unconventional secretion of HMGB1 in psoriasiform KCs. (A) NHEK cells were stimulated with M5 for 24 h in the absence or presence of HMGB1-neutralizing antibody (anti-HMGB1,10 µg/mL), IL18- or IL1B-neutralizing antibody (anti-IL18,10 µg/mL; anti-IL1B, 10 µg/mL). The indicated genes levels were assayed by qRT-PCR, n = 3/group. (B) ELISA analysis of HMGB1 levels in cell culture supernatants of Krt14+/+-Atg5f/f and Krt14Cre/+-atg5f/f primary murine keratinocytes treated with M5 for 48 h, n = 3/group. (C) ELISA analysis of HMGB1 levels in serum from Krt14+/+-Atg5f/f and Krt14Cre/+-atg5f/f mice treated with IMQ for 5 d, n = 3/group. (D) NHEKs were pre-treated with or without 3-methyladenine (3-MA; 4 h, 10 mM), bafilomycin A1 (BAF; 4 h, 200 nM) or wortmannin (WOR; 4 h, 100 nM), and stimulated with or without M5 for 24 h. The HMGB1 gene expression levels were assayed by qRT-PCR, n = 3/group. (E) Ctrl shRNA HaCaT cells and GORASP2 shRNA HaCaT cells were stimulated with or without M5 for 24 h. HMGB1 gene expression levels were assayed by qRT-PCR, n = 3/group. (F-H) HaCaT cells were stimulated with M5 for 24 h or 48 h in the absence or presence of monensin (10 μM, 3 h) or FLI-06 (10 μM, 3 h), the blockers of Golgi transport in conventional secretion pathway. n = 3/group. (F) Representative immunoblots of HMGB1 in cell lysates at 48 h. (G) Analysis of HMGB1 levels in the culture medium by ELISA at 48 h. (H) qRT-PCR analysis of HMGB1 expression at 24 h. (I) HMGB1-EBFP2-transfected HaCaT cells were treated with M5, and representative confocal images of immunofluorescence of LC3A/B and LAMP1 are shown. Scale bars: 10 μm. (J) Line tracings, analysis of fluorescence signal intensity from images in (I), scale bars: 2 μm. (K) Pearson’s colocalization coefficient for HMGB1 and LC3A/B, HMGB1 and LAMP1. (L and M) Representative immunoblots of the indicated proteins in the cell lysates of NHEKs that were pretreated with or without 3-MA (4 h, 10 mM), BAF (4 h, 200 nM), and stimulated with or without M5 for 48 h. ACTB was used as a loading control (F, L and M). Mean ± SD. *P < 0.05; **P < 0.01; ***P < 0.001. One-way ANOVA (A-E, G and H), Two-tailed Student’s T-test (K). All the data are representative of three independent experiments
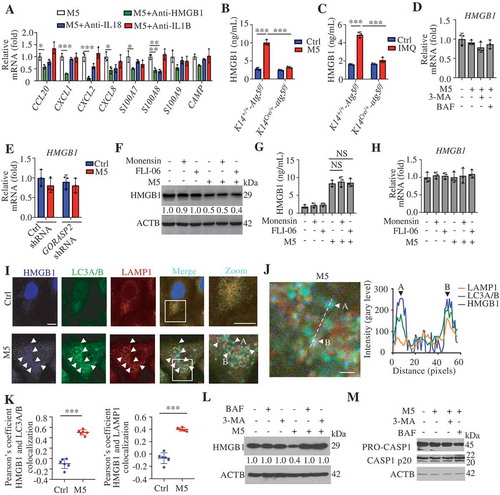
We observed reduced secretion of HMGB1 in M5-stimulated Krt14Cre/+-atg5f/f KCs compared with M5-stimulated Krt14+/+-Atg5f/f KCs (). Similarly, IMQ induced greater HMGB1 levels in the serum of Krt14+/+-Atg5f/f mice compared with that of Krt14Cre/+-atg5f/f mice (). We found that neither M5 nor autophagy inhibitor treatment changed HMGB1 mRNA levels in human KCs (), and similar findings were also confirmed by KD of GORASP2 (). We obtained consistent results were for the IL18 mRNA levels (Figure S5B and C). These results suggest that autophagy regulates the secretion of HMGB1 through non-transcriptional effects. Previous studies have shown that autophagy-mediated HMGB1 secretion does not occur via the conventional secretion pathway in neurodegenerative diseases [Citation38]. We found that three blockers of conventional secretion, monensin (an ionophore of monovalent cations that disrupts Golgi-dependent transport), FLI-06 (a general secretion inhibitor that disrupted the Golgi apparatus), and brefeldin A (BFA, a blocker of endoplasmic reticulum to Golgi transport), failed to inhibit M5-induced HMGB1 secretion (; S5D and E) without influencing the mRNA levels ( and S5F), and even brefeldin A (BFA) increased HMGB1 secretion (Figure S5D and E) due to the induced endoplasmic reticulum stress [Citation38]. These results imply that autophagy positively regulates HMGB1 secretion in psoriasiform KCs but not through the conventional secretory pathway. Furthermore, we confirmed that HMGB1 colocalized with autophagosomes and autolysosomes and that their colocalization increased in M5-induced KCs (). If HMGB1 is a substrate for autophagy or lysosomal degradation, the impairment of autophagic flux might increase the total HMGB1 levels intracellularly and extracellularly. Our results demonstrated that M5 increased the extracellular HMGB1 levels but decreased the intracellular HMGB1 levels ( and ); however, the inhibition of autophagic flux through the administration of BAF or 3-MA impaired the extracellular release of HMGB1 from psoriasiform KCs () but restored the total intracellular HMGB1 levels (). These data imply that HMGB1 is not a degradative substrate for the autophagy-lysosomal pathway but that the secretion of HMGB1 depends on the autophagy-lysosomal pathway in psoriasiform KCs.
Activated CASP1 (caspase 1) play a regulatory role in the extracellular release of HMGB1, IL18, and IL1B from activated immune cells [Citation41], and CASP1 activation can be inhibited through the clearance of the inflammasome components AIM2 (absent in melanoma 2) and PYCARD (PYD and CARD domain containing) by degradative autophagy [Citation42]. A western blotting assay of CASP1 p20 showed that autophagy inhibitors did not reduce the activation of CASP1 (), which suggests that the autophagy regulated release of autosecretory proteins is not associated with CASP1 activation.
Keratinocyte-derived HMGB1 regulates psoriasis
HMGB1, a multifunctional alarmin, with a broad repertoire of immune activation, mediated multiple surface receptors that can drive the pathogenesis of inflammatory disorders [Citation43]. To investigate the role of HMGB1 in skin inflammation, we injected wild-type (WT) mice intradermally with recombinant HMGB1 (rHMGB1), and these mice developed epidermal thickening and substantial cell infiltration (). Moreover, rHMGB1 significantly induced psoriasis-associated inflammatory mediums expression, including chemokines (Cxcl1, Cxcl2, and Ccl20), anti-microbial peptides (S100a7, S100a8, S100a9, and Defb2 [defensin beta 2]), cytokines associated with innate immunity (Il1b and Tnf), cytokines in the IL23A-IL17A axis (Il23a, IL17a, and IL22), transcription factors (Rorc/Rorγt) and the neutrophil membrane marker Ly6g (Figure S6). Overall, HMGB1 appeared to be sufficient for inducing significant pathological changes in dorsal skin that were reminiscent of human psoriasis and were accompanied by a clearly defined HMGB1-associated molecular profile.
Figure 7. Keratinocyte-derived HMGB1 regulates psoriasis. (A) C57BL/6 wild-type mice received daily intradermal injections of 2 μg rHMGB1 or vehicle control for 7 d. Representative H&E-stained sections are shown and the infiltrating cells were measured at day 7, scale bar: 200 μm (left). Quantification of the thickness and the infiltrating cells in the back skin (right). n = 5/group. (B) Blocking HMGB1 by subcutaneous injection of Hmgb1 shRNA and Ctrl shRNA into mice, and the mice then treated with IMQ for 7 d displayed disease symptoms. Representative H&E-stained sections are shown, scale bar: 100 μm (left). Quantification of thickness and the infiltrating cells in the skin (right). (C) Representative immunoblot for the HMGB1 knockdown levels in human HaCaT cells after transfection with shRNA or vector control. n = 5/group. (D and E) Ctrl shRNA and HMGB1 shRNA KCs were stimulated with M5, n = 3/group. (D) ELISA determined the CXCL8 levels in the culture medium at 48 h. (E) The RNA levels of the indicated genes were assessed by qRT-PCR at 24 h. (F) Representative immunoblots of HMGB1 in epidermal lysates of Krt14+/+-Hmgb1f/f and Krt14Cre/+-hmgb1f/f mice. (G and H) The Krt14+/+-Hmgb1f/f and Krt14Cre/+-hmgb1f/f mice were treated with IMQ for 5 d, n = 5/group. (G) Representative images of the dorsal back from mice treated with IMQ (left), and the mice PASI scores were depicted (right). (H) Representative histological sections of IMQ-treated dorsal back stained with H&E (left), and quantification of thickness and the infiltrating cells in the back skin (right), scale bar: 100 μm. ACTB was used as a loading control (C and F). Mean ± SD. *P < 0.05; **P < 0.01; ***P < 0.001. Two-tailed Student’s T-test (A, G and H), One-way ANOVA (B, D and E). All the data are representative of three independent experiments
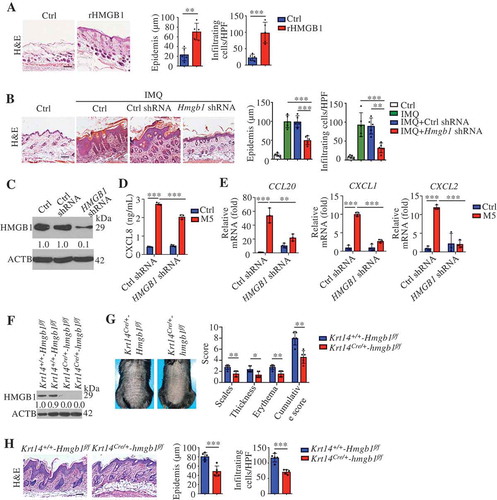
We generated Hmgb1-KD animals by subcutaneous injection of a lentivirus expressing a small hairpin RNA (shRNA) against Hmgb1 (Hmgb1 shRNA) (Figure S7A and B). After IMQ treatment, the mouse PASI [Citation25,Citation26], histological parameters (epidermal thickening and inflammation), and deregulation of psoriasis-related genes were significantly ameliorated in KD mice compared to WT mice ( and S7C-E). We obtained a similar amelioration by blocking extracellular HMGB1 (Figure S7F-J). These data indicate that HMGB1 plays a critical role in psoriasis and that blocking HMGB1 might be therapeutically beneficial.
We confirmed that the cytoplasmic translocation of HMGB1 in KCs and the serum levels of HMGB1 elevated in the IMQ model (Figure S8A and B). The serum levels of HMGB1 were significantly increased in patients with psoriasis compared with healthy subjects, as previously reported [Citation44,Citation45]. We also found that the cytoplasmic translocation of HMGB1 increased in the KCs of psoriasis patients (Figure S8C). In vitro, HMGB1 shRNA markedly diminished CXCL1, CXCL2, CXCL8, and CCL20 expression in M5-stimulated KCs (). These data suggest that KC-derived HMGB1 might regulate psoriasis.
We further generated mice with a conditional deletion of Hmgb1 in KCs, referred to as Krt14Cre/+-hmgb1f/f mice hereafter (). The absence of HMGB1 in KCs decreased the mouse PASI score, epidermal thickness, and dermal inflammatory cell infiltration in the IMQ model (). As previously reported, activated DCs and myeloid cells can release of HMGB1 [Citation43]. We crossed Hmgb1-floxed (Hmgb1f/f) mice with Itgax-Cre, Lyz2-Cre or Lck-Cre transgenic mice (mice expressing Cre recombinase under the control of the promoter/enhancer of Itgax [integrin subunit alpha X], Lyz2 [lysozyme 2], or Lck [lymphocyte protein tyrosine kinase], respectively) for the selective ablation of HMGB1 in DCs (ItgaxCre/+-hmgb1f/f), myeloid cells (Lyz2Cre/+-hmgb1f/f) or T cells (LckCre/+-hmgb1f/f) (Figure S8D, H and L). IMQ treatment did not change the PASI and histological parameters (epidermal thickening and inflammation) in these conditional KO mice (Figure S8E-G, I-K, and M-O). Together, these results indicate that KC-derived HMGB1 regulates psoriasis in the IMQ model.
Autosecretory proteins are responsible for autophagy-modulated psoriasis-like skin inflammation in keratinocytes
The above findings prompted the question of whether autophagy participates in the immunoregulation of psoriasiform inflammation mainly through autosecretion. In M5-stimulated KCs, the blockade of HMGB1 eliminated differences in Cxcl1, Ccl20, and S100a7 expression between autophagy-efficient KCs (Krt14+/+-Atg5f/f KCs) and autophagy-deficient KCs (Krt14Cre/+-atg5f/f KCs) as effectively as the combined blockade of HMGB1, IL18, and IL1B with the corresponding neutralizing antibodies (). We also found that both the combination of recombinant proteins (rHMGB1, recombinant interleukin 18 [rIL18], and recombinant interleukin 1 beta [rIL1B]) and rHMGB1 alone nearly completely rescued the M5-induced expression of Cxcl1, Ccl20, and S100a7 in autophagy-deficient KCs (). HMGB1 alone and the combination of rHMGB1, rIL18, and rIL1B completely counteracted the regulatory effect of autophagy on the expression of the proliferation marker Mki67 (). Notably, neither neutralizing antibodies nor cytokine stimulation affected the expression of the differentiation marker Lor (loricrin) (). These results suggest that autophagy regulates immune responses and proliferation markers mainly through autosecretory proteins, particularly HMGB1, in psoriasis-like KCs.
Figure 8. Autosecretory proteins are responsible for autophagy-modulated psoriasis-like skin inflammation in keratinocytes. (A and B) Krt14+/+-Atg5f/f and Krt14Cre/+-atg5f/f primary murine keratinocytes were stimulated with or without M5 for 24 h in the absence or presence of anti-HMGB1 IgY antibodies (10 μg/mL), anti-IL1B IgG antibodies (10 μg/mL), and anti-IL18 IgG2a antibodies (10 μg/mL); nonimmune IgY, nonimmune IgG or IgG2a were used controls. The indicated genes expression levels were assayed by qRT-PCR. n = 3/group. (C and D) Krt14+/+-Atg5f/f and Krt14Cre/+-atg5f/f primary murine keratinocytes were stimulated with M5 in the absence or presence of rHMGB1 (10 μg/mL), rIL1B (10 ng/mL), rIL18 (100 ng/mL). The indicated genes expression levels were assayed by qRT-PCR. n = 3/group. (E-G) IMQ was applied daily to Krt14+/+-Atg5f/f and Krt14Cre/+-atg5f/f mice that were received a daily intradermal injection of rHMGB1 (1 µg), rIL1B (20 ng), and rIL18 (20 ng) for 5 d, n = 5/group. (E) H&E staining skin sections, left: Representative H&E staining data; right: statistical data, scale bar: 100 μm. (F) FACS for IL17A-producing T cells in the back skin. qRT-PCR analysis of the indicated genes from back skin RNA (G). Mean ± SD. *P < 0.05; **P < 0.01; ***P < 0.001; NS, not significant. One-way ANOVA (A-G). All the data are representative of three independent experiments
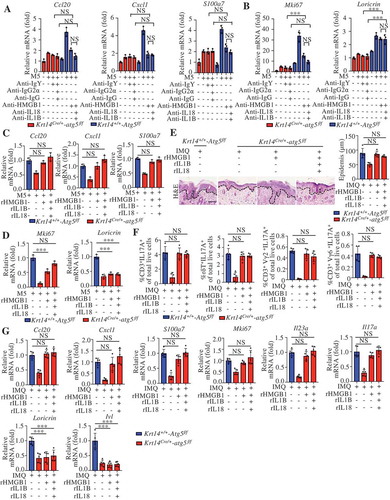
We further determined the roles of autosecretory proteins in vivo. Both the combination and rHMGB1 treatments rescued the IMQ-induced epidermal thickening; the percentages of IL17A+ immune cells, including CD3+IL17A+, CD3+γδ TCR (T cell receptor)+ IL17A+, CD3+ Vγ2 TCR+ IL17A+, and CD3+ Vγ6 TCR + IL17A+ cells; and the expression of Cxcl1, Ccl20, S100a7, and Mki67 in Krt14Cre/+-atg5f/f mice (). The intradermal injection of autosecretory proteins rescued the expression of the IL23A-IL17A axis (Il23a and Il17a) in Krt14Cre/+-atg5f/f mice () but did not exert an obvious effect on the expression of differentiation markers (Lor and Ivl) (). These results indicate a crucial role for autosecretion in the autophagy-regulated mechanism in psoriasis.
Keratinocyte-γδ t cell crosstalk is involved in rHMGB1-induced skin inflammation
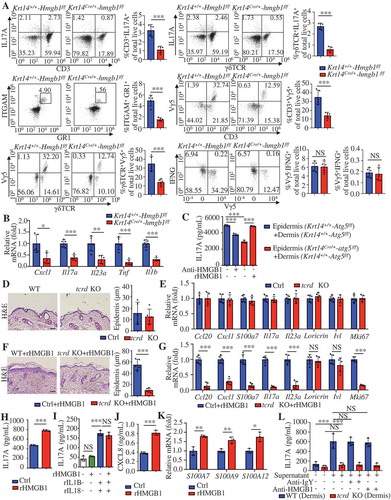
Similar to the results obtained for Krt14Cre/+-atg5f/f mice (), we found that the decreased percentages of γδT17 cells, neutrophils (ITGAM+GR1+) and Vγ5+ γδT cells in the skin of IMQ-induced Krt14Cre/+-hmgb1f/f mice (). The percentages of ITGAX+ DCs and ITGAM+ADGRE1+ macrophages (data not shown) did not change. Accordingly, we observed reduced levels of cytokines (Il17a, Il23a, Tnf, and Il1b) and chemokines (Cxcl1) (), and we found no significant differences in IFNG+ among the groups ( and S9). The blockade of HMGB1 or the KC knockout of Atg5 significantly suppressed the secretion of IL17A from in vitro co-cultured psoriatic epidermal and dermal cells (). rHMGB1 rescued the secretion of IL17A from co-cultured psoriatic epidermal cells of Krt14Cre/+-atg5f/f mice and dermal cells of Krt14+/+-Atg5f/f mice (). These results indicate crucial roles for KC autophagy and HMGB1 in IL17A secretion from psoriatic skin.
Figure 9. Keratinocyte-γδ T cell crosstalk is involved in rHMGB1-induced skin inflammation. (A and B) The Krt14+/+-Hmgb1f/f and Krt14Cre/+-hmgb1f/f mice were treated with IMQ for 5 d, n = 5/group. (A) Representative and quantitative results from intracellular FACS analysis of IL17A-producing cells, neutrophils, Vγ5+ cells and IFNG+ cells in the dorsal skin. (B) qRT-PCR analysis of the mRNA levels of the indicated genes in back skin. (C) Epidermal or dermal cell suspensions were isolated from Krt14+/+-Atg5f/f and Krt14Cre/+-atg5f/f mice that treated with IMQ for 2 d. The coculture system of the epidermal and dermal cells was treated with HMGB1 neutralizing antibody (10 μg/mL) or rHMGB1 (10 μg/mL) for 48 h, and the extracellular IL17 expression was analyzed by ELISA, n = 3/group. (D) Representative H&E-stained sections (left, scale bar: 50 μm) of dorsal skin and quantification of the thickness (right) are shown, n = 5/group. (E) qRT-PCR analysis of each indicated gene in the skin, n = 5/group. (F and G) C57BL/6 WT and tcrd KO mice received daily intradermal injections with 2 μg of rHMGB1 or vehicle control for 7 d, n = 5/group. (F) Representative H&E-stained sections (left) and quantification of the thickness (right) are shown, scale bar: 50 μm. (G) The qRT-PCR analysis was performed for each indicated gene in the skin. (H) The coculture system of the epidermal and dermal cells from wild-type C57BL/6 mice was stimulated with rHMGB1 (10 μg/mL) for 48 h, and the extracellular IL17A expression was analyzed by ELISA, n = 3/group. (I) Dermal cell suspensions from wild-type C57BL/6 mice were stimulated with rHMGB1 (10 μg/mL), rIL1B (10 ng/mL) and rIL23A (50 ng/mL) for 48 h, and the extracellular IL17A expression was analyzed by ELISA, n = 3/group. (J and K) KCs were stimulated with 10 μg/mL rHMGB1 for 24 h or 48 h, n = 3/group. (J) The protein level of CXCL8 in the culture medium was assessed by ELISA at 48 h. (K) qRT-PCR analysis of the indicated genes at 24 h. (L) Dermal cells of tcrd KO mice or WT mice were treated with 10 μg/mL rHMGB1-induced epidermal supernatant for 48 h in the absence or presence of anti-HMGB1 IgY antibody (10 μg/mL) or IgY antibody (10 μg/mL), and the extracellular IL17A secretion was analyzed by ELISA. n = 3/group. Mean ± SD. *P < 0.05; **P < 0.01; ***P < 0.001. NS, not significant. Two-tailed Student’s t-test (A, B, D-H, J and K), One-way ANOVA (C, I and L). All the data are representative of three independent experiments
Dermal γδ T cells are the major IL17A-producing cells in the IMQ-induced model [Citation33]. We observed no obvious differences between γδ T cell receptor-KO (tcrd KO) mice and WT mice in steady-state (). rHMGB1-induced epidermal thickness and Mki67 expression in IMQ-induced lesions were lower in tcrd KO mice than in WT mice (). Additionally, tcrd KO mice significantly attenuated the rHMGB1-induced mRNA levels associated with the IL23A-IL17A cytokine axis (). These results indicate that γδ T cells are involved in rHMGB1-induced skin inflammation.
As previously reported, IL17A production in γδ T cells increased by exposure to IL23A and IL1B [Citation46]. rHMGB1 also stimulated the secretion of IL17A from co-cultured epidermal and dermal cells of WT mice (). However, we did not observe a synergistic effect of HMGB1 and IL23A-IL1B on IL17A production in dermal cells (). HMGB1 secreted from KCs can facilitate the production of IL23A and IL1B in an autocrine way [Citation47]. Our experiments confirmed that rHMGB1 stimulated expression of CXCL8, S1000A7, S1000A9, and S1000A12 in KCs (). We further found that the supernatant of rHMGB1-stimulated epidermal cells could strongly induce IL17A secretion from dermal cells of WT mice but not dermal cells of tcrd KO mice (), even if in the presence of HMGB1-neutralizing antibody (). These results suggest that HMGB1 facilitates the expression of inflammatory mediators via an autocrine pathway, and subsequently activates dermal γδT cells to produce IL17A, thereby amplifying the immune cycle of psoriasis lesions.
Discussion
Studies on the immunopathogenesis of psoriasis have outlined the decisive role of KCs in the induction and substantial amplification of psoriatic inflammation [Citation2]. However, the precise nature of the autophagy effect of autophagy on psoriatic KCs remains poorly understood. Here, we demonstrated a significant positive correlation between functionally active autophagy and psoriasis severity. The alarmin HMGB1, which KCs release via autosecretion, drove the overproduction of psoriasis-related chemokines and antimicrobial peptides via an autocrine loop and thereby led to amplification of the IL23A-IL17A immune circuits in γδ T17 cells and KCs in the context of psoriasis. Thus, we uncover a novel KC autophagy mechanism that is involved in psoriasis pathogenesis, and our study reveals that the inhibition of autosecretion may be an effective new therapeutic strategy for the cutaneous disease.
In psoriatic lesions, LC3B staining is absent in the epidermis [Citation14,Citation20]. However, our study showed that the numbers of LC3 (LC3A/B, LC3A, and LC3B) puncta and autophagic vesicles (the “gold standard” of autophagy markers), were increased in the human psoriatic epidermis compared with the normal epidermis. Moreover, the levels of other autophagy-related markers (BECN1 and ATG5) were increased in the psoriatic epidermis, consistent with a previous report [Citation14]. Similarly, a positive correlation between KC autophagy and psoriatic severity was also demonstrated in mouse models. Previous studies have reported that IL17A enhances autophagic flux by increasing autophagosome-lysosome fusion [Citation20]. However, it appears that single-cytokine stimulation has a limited effect on KCs, resulting in the induction of only a few amounts of the features of psoriasis [Citation28]. Karline Guilloteau et al. found that stimulation of KCs with a combination of five cytokines (M5) induces inflammation that aptly recapitulates the features of psoriasis both in vitro and in vivo [Citation28]. This psoriatic model has been widely cited in and used in multiple studies, and we found that the M5 combination induced autophagic flux. Thus, the results indicate that autophagy is activated in psoriatic KCs.
Diverse pathways, such as the AMP-activated protein kinase (AMPK) and MAPKs pathways, are involved in autophagy [Citation3,Citation48]. Among these pathways, the MAPK pathways play a key role in the activation of autophagy by cytokines, previous studies have shown that TNF and IL1 alone upregulate LC3-II and BECN1 expression through activation of the MAPK pathways in atherosclerotic vascular smooth cells and macrophages [Citation30,Citation31]. p-MAPK1/3 can stimulate autophagy by upregulating the expression of ATG5 and BECN1, and elevated EIF2A (eukaryotic translation initiation factor 2A) phosphorylation results in increased LC3 conversion (LC3-I to LC3-II) [Citation49,Citation50]. Activated MAPK8/9/10 not only activates JUN (Jun proto-oncogene, AP-1 transcription factor subunit), FOS (Fos proto-oncogene, AP-1 transcription factor subunit), FOXO (forkhead box O) transcription factors, DRAM1 (DNA damage regulated autophagy modulator 1), and SESN2 (sestrin 2) by enhancing the transcription of autophagy-related genes but also promotes the phosphorylation of BCL2 (BCL2 apoptosis regulator) and BCL2L1 (BCL2 like 1), leading to the dissociation of BECN1 from BCL2 and BCL2L1 and thereby stimulating autophagy [Citation51]. The activation of MAPK14 can reduce MTOR (mechanistic target of rapamycin kinase) phosphorylation, leading to the induction of autophagy [Citation52]. These results were consistent with our finding that the MAPK pathway was involved in M5-induced autophagy in KCs.
Recent evidence supports the existence of crosstalk between autophagy and immune responses. Autophagy can negatively regulate TLR2/6 agonist-, IL1B- or IL17A-induced inflammatory factors expression in KCs [Citation18–20] and macrophage cells [Citation53]. Such regulation might be due to autophagy-mediated downregulation of SQSTM1 accumulation, which contributes to the autophagic degradation of the NFKB inhibitor NFKBIA [Citation18]. Our results showed that the blockage of autophagic flux downregulated NFKB activity in psoriasiform KCs, and the previous finding supports this conclusion that autophagy enhances NFKB activation through autophagic depletion of the NFKB inhibitor A20 [Citation54]. Also, autophagy plays a dual role in the regulation of NFKB activity because it can also regulate NFKB activity via the SQSTM1-mediated autophagic degradant NFKB activator BCL10 (BCL10 immune signaling adaptor) [Citation55]. Accumulating evidence shows that autophagic intracellular degradation plays a crucial role in the regulation of inflammatory responses [Citation3–5]; however, the studies on the immunoregulatory mechanisms of secretory autophagy are rare. We have shown that secretory autophagy was a critical driving factor that accelerated the immune functions of psoriatic KCs and the progression of psoriasis.
Previous studies on atg7 (autophagy related 7) KO mice have demonstrated a significant role of autophagy in the epidermal keratinization [Citation16]. 3-MA treatment or ATG5/7 depletion in KCs results in impaired differentiation [Citation15,Citation56]. Consistent with these findings, we found that the KC-specific ablation of autophagy decreased the expression of epidermal differentiation markers in IMQ-induced Krt14+/+-Atg5f/f mice. However, autosecretory proteins could not rescue the differentiation of KCs, which suggests that autophagy may regulate KC differentiation in a manner independent of autosecretion. Previous studies have shown that nucleophagy, a mechanism of targeted autophagic degradation of nuclei, is essential for KC differentiation [Citation14].
Whether secretory autophagy is dependent on lysosomes remains unclear. In macrophages responding to lysosomal damage, TRIM16 (tripartite motif containing 16)-SEC22B (SEC22 homolog B, vesicle trafficking protein [gene/pseudogene]) complex on autophagosomes recognizes IL1B, which combines with plasma membrane proteins to facilitate direct autophagosome fusion with the plasma membrane and completes IL1B secretion [Citation57]. In this secretory pathway, IL1B secretion is unaffected by knockdown of Stx17, an autophagosomal soluble N-ethylmaleimide-sensitive factor attachment protein receptor (SNARE) required for fusion with the lysosome [Citation57], which implies that autolysosomes may not be essential for autosecretion of IL1B. However, our study showed that autolysosomes were indispensable for autosecretion in psoriasiform KCs, as supported by previous studies showing that the inhibition of autophagosome-lysosome fusion by BAF inhibits autosecretion in macrophages [Citation37]. Consistent with these findings, insulin-degrading enzyme secretion from astrocytes mediate by autosecretion in neurodegenerative diseases is also dependent on autolysosomes [Citation38]. Thus, both autophagosomes and autolysosomes may be capable of mediating the autosecretion of their cargos.
Although autophagosomes can nonspecifically sequester cytosolic components, there is also ample evidence that selective autophagy degrades various cellular structures (such as proteins, mitochondria, and microbes) [Citation58]. The process of selective autophagy requires autophagic receptors (such as SQSTM1, NBR1 [NBR1 autophagy cargo receptor], and CALCOCO2 [calcium binding and coiled-coil domain 2]) that link cargo to growing autophagosomal membranes [Citation59]. Whether HMGB1 is selectively introduced into the autophagy pathway remains unclear. The interaction between HMGB1 and autophagic receptor proteins that mediates selective autophagy has not been investigated. Intracellular HMGB1 can interact with BECN1 and thereby orient BECN1 toward autophagosomes [Citation60], which may result in the selective drag of HMGB1 into autophagosomes. Also, how HMGB1 is selected and separated from degradative autophagy cargo to undergo secretory autophagy remains unclear. HMGB1 can be degraded in via a proteasome-mediated pathway [Citation61,Citation62] but does not appear to be degraded by lysosomes under certain conditions because cytosolic HMGB1 can concentrate into lysosomes and be secreted [Citation63]. One possible reason is that HMGB1 glycosylation increases the stability of the protein [Citation62]. However, the precise mechanisms mediating HMGB1 autosecretion, such as the interaction between HMGB1 and autophagic receptor proteins, and the stabilization of HMGB1 by post-translational modification, require future investigation.
As previously reported, the HMGB1-AGER (advanced glycosylation end-product specific receptor) inflammatory pathway promotes ATP production [Citation64,Citation65], and keratinocytes promote murine Vγ5+ γδT cell proliferation in an ATP-dependent manner [Citation66]. We found that Vγ5+ γδT cells decreased in psoriatic lesion after keratinocyte autophagy or HMGB1 deficiency. However, Vγ5+ γδT cells could not produce IL17A and are dispensable for psoriatic inflammation in the IMQ model [Citation34]. Our study suggested that the keratinocyte autophagy affected Vγ5+ γδT cell distribution might by altering HMGB1 secretion in the psoriasis model.
The activated IL23A-IL17A axis is significant for the development of psoriasis [Citation67]. We found that KC-specific atg5 or hmgb1 KO inhibited the IL23A-T17 pathogenic axis in the psoriatic skin and that KC autophagy regulated the IL17A level of psoriasis lesions via autosecretory HMGB1. IL17A is mainly derived from dermal γδ T cells in psoriasis [Citation33]. We show that γδ T cell deficiency led to resistance to rHMGB1-induced skin inflammation. However, HMGB1 was unaffected on IL17A production from dermal cells, consistent with a previous report that HMGB1 alone does not upregulate IL17A secretion from γδ T cells [Citation68]. AGER, TLR2 (toll-like receptor 2), and TLR4, all of which are HMGB1 receptors [Citation69]. TLR2 and TLR4 ligand agonists are not able to directly stimulate T cells to secrete IL17A [Citation70]. The expression of the key HMGB1 receptor AGER in γδ T cells has not been experimentally tested. These findings imply that HMGB1 might be unable to activate γδ T17 cells. Notably, HMGB1 can induce IL23A, IL1B, and IL6 (interleukin 6) expression in KCs [Citation47], and these cytokines are commonly used to drive Th17 cell differentiation and IL17A production by γδ T cells [Citation46]. We show that HMGB1 can induce the secretion of IL17A from cocultured psoriatic epidermal and dermal cells and that HMGB1-induced epidermal supplement can strongly promote IL17A secretion from dermal cells of WT mice, but not dermal cells of tcrd KO mice. Therefore, the significance of an autocrine pathway involving HMGB1 in KC-γδ T cell crosstalk is becoming evident.
Nuclear HMGB1 acts as an architectural factor for the maintenance of the chromosomal structure [Citation71]. In immunocytes, stimuli promote the translocation of nuclear HMGB1 to the cytosol [Citation69]. Cytosolic HMGB1 acts as a BECN1-binding protein to promote autophagy [Citation60], and it also serves as a sensor for nucleic acids activation of the innate immune response [Citation43]. Extracellular HMGB1, a multifunctional alarmin that transduces activation signals through binding to TLR2, TLR4, and AGER [Citation69,Citation72], provokes various inflammatory disorders, such as arthritis and systemic lupus erythematosus [Citation43]. Recent studies have demonstrated that HMGB1 can translocate to the cytoplasm in psoriatic KCs, and this translocation is accompanied by increased levels of HMGB1 in the sera of patients [Citation44,Citation45]. HMGB1 induces activation of NFKB signaling and CASP1, thereby facilitates the IL18 expression and maturation in KCs, and thus contributes to IMQ-induced psoriasis-like skin inflammation [Citation47,Citation73]. KCs are reservoirs of inflammatory mediators that induce and sustain psoriatic lesions. In the present study, the KC-specific ablation of HMGB1 attenuated IMQ-induced skin inflammation in Krt14Cre/+-hmgb1f/f mice, emphasizing the critical role of autosecretion of the alarmin HMGB1 by psoriatic KCs. KC-γδ T cell crosstalk was found to be essential for IL17A-producing dermal γδ T cell activation by HMGB1 in our study, and these findings highlight the role of aberrant interplay between skin-resident KCs and immune cells in the inflammatory responses in psoriasis.
In summary, this study reveals a novel crucial autophagy mechanism involved in the KC autoregulatory circuit that amplifies and sustains chronic inflammation in psoriasis. Moreover, our data enhance knowledge regarding autosecretion and highlight the role of autosecretory HMGB1 in cutaneous disease, and these findings will aid in the development of new strategies for the treatment of inflammatory diseases.
Materials and methods
Animals
The Atg5-floxed mice (B6.129S-Atg5< tm1Myok>; RBRC02975) on the C57BL/6 background were a gift from Prof. Wei Li (Chinese Academy of Sciences), these mice were provided by the RIKEN BRC through the National Bio-Resource Project of the MEXT with permission from Prof. Noboru Mizushima (University of Tokyo) [Citation32]. Hmgb1-floxed mice (B6.129P2-Hmgb1< tm1Ttg>; RBRC06240) on the C57BL/6 background were provided by the RIKEN BRC through the National Bio-Resource Project of the MEXT with permission from Prof. Tadatsugu Taniguchi (University of Tokyo). Krt14-Cre mice (STOCK Tg[Krt14-cre]1Amc/J), Lck-Cre (B6.Cg-Tg[Lck-Cre]548Jxm/J) mice, and Lyz2-Cre (B6.129P2-Lyz2tm1[Cre]Ifo/J) mice on the C57BL/6 background were purchased from Nanjing Biomedical Research Institute of Nanjing University (J004782, J003802, and J004781). Itgax-Cre mice (B6.Cg-Tg[Itgax-Cre]1-1Reiz/J) on the C57BL/6 background were purchased from Shanghai Model Organisms Center, Inc. (008068). Krt14-Vegfa mice (FVB-Tg[Krt14-Vegfa]3Dtm/J) were purchased from Jackson Laboratories (005705). B6.129P2-Tcrdtm1Mom/J mice (tcrd KO mice; 002120) were kindly provided by Dr. Zhinan Yin (Jinan University). BALB/c and C57BL/6 mice (aged 8–12 weeks) were purchased from the Vital River Laboratory Animal Technology Co., Ltd (211 and 219). The animals were housed under the following controlled conditions: a 12 h light/12 h dark cycle, a steady temperature of 25 ± 1°C, and with free access to water and food. The animal protocols were approved by the Committee on the Ethics of Animal Experiments of Sichuan University. The experimental procedures were conducted according to the ethical guidelines for the care and use of laboratory animals of the National Institutes of Health (https://grants.nih.gov/grants/olaw/guide-for-the-care-and-use-of-laboratory-animals.pdf) and the International Association for the Study of Pain (IASP). Every effort was made to decrease the number of animals used and to reduce animal suffering. Genotyping was performed after weaning by PCR assay with genomic DNA extracted from tail biopsies using the Mouse Direct PCR Kit (Bimake, B40015). Genotyping primers are provided in Table S3.
Human subjects
The present study was performed in accordance with the principles of the Helsinki Declaration and approved by the Ethics Committee of the West China Hospital, Sichuan University (Chengdu, Sichuan, China). Written informed consent was obtained from all the study participants prior to the study. All the patients were diagnosed based on the clinically apparent symptoms (easily diagnosed as characteristic red colored plaques with well-defined borders and silvery-white dry scale), and histopathological criteria (abnormal proliferation and differentiation of the epidermis, hyperkeratosis, and parakeratosis of keratinocytes). All the patients were assessed according to the psoriasis area and severity index (PASI) [Citation74]. Biopsies of lesional skin were collected from 12 patients with psoriasis, and biopsies of healthy skin were obtained from 12 donors. The clinical characteristics of the normal subjects and patients with psoriasis are provided in Table S4. The fresh skin samples were snap-frozen in liquid nitrogen and stored at −80°C for immunofluorescence analysis, were immediately fixed in 4% paraformaldehyde in phosphate-buffered saline (PBS; ZSGB-BIO, ZLI-9061) for paraffin-embedding section, or immediately fixed in 3% glutaraldehyde, 0.1 M phosphate buffer, pH 7.4, and post-fixed in 1% osmium tetroxide in Sorensen’s phosphate buffer (0.133 M Na2HPo4, 0.133 M KH2PO4, pH 7.4) for transmission electron microscopy. None of the participants had been administered systemic therapy, including investigational agents for at least 4 weeks prior to the study entry. Patients with a history of other autoimmune diseases, immunologic deficiency diseases or tumors were excluded.
Cell lines
The keratinocyte cell line HaCaT was obtained from the China Center for Type Culture Collection (0106). Human embryonic kidney (HEK) cells (HEK293A) were purchased from the ATCC (CRL-1573), the HaCaT or HEK293A cells were cultured in Dulbecco’s modified Eagle’s medium (DMEM; Thermo Fisher Scientific, C11995500BT) supplemented with 10% (v:v) fetal bovine serum (FBS; Thermo Fisher Scientific, 10099141), 100 U/mL penicillin G and 0.1 mg/mL streptomycin sulfate (Thermo Fisher Scientific, 15140122). The cell culture conditions were 37°C and 5% CO2. All cells were found to be free from mycoplasma contamination.
Preparation of human primary keratinocytes
Primary normal human epidermal keratinocytes (NHEKs) were isolated from the newborn circumcision foreskin with donors’ agreement and from the adult abdomen with the donors’ consent using an enzyme digestion method, as described in the literature [Citation75]. Briefly, the skin samples were cut into small pieces and incubated in 2.4 U/mL dispase II (CELLnTEC, CnT-DNP-10) solution overnight at 4°C to allows separation of the epidermis from the dermis. The epidermis was used for the isolation of NHEKs using 0.25% trypsin-EDTA (Life Technologies, 25200072). The NHEKs were cultured in the CnT-PR medium (CELLnTEC, CnT-PR) supplemented with IsoBoost (CELLnTEC, CnT-ISO-50) for at least the first 3 d post-seeding and then switched to standard CnT-PR medium. For all the experiments, the keratinocytes were used after two passages to ensure that the absence of contaminating cells.
Isolation of murine primary keratinocytes
For the culture of mouse primary keratinocytes, the separation of the epidermis from the dermis of adult mouse skin is possible only if the area to be excised is in the resting phase of the hair cycle (telogen). After the mice were killed, the back skin area was shaved and removed using sterile instruments, namely, a scalpel blade or a single-edged razor blade, carefully scrape off the hypodermis, followed by overnight incubation in 2.4 U/mL dispase II at 4°C. The epidermis was then separated from the dermis using forceps and further digested into single suspended keratinocytes with accutase (CELLnTEC, CnT-Accutase-100). The keratinocytes were washed with PBS and passed through a 70 μm mesh to remove any debris before use. Freshly isolated keratinocytes were cultured in the CnT-07 medium (CELLnTEC, CnT-07) supplemented with IsoBoost for at least the first 3 d post-seeding, and the keratinocytes were used after two passages to ensure the absence of contaminating cells [Citation76,Citation77].
Induction of the in vitro psoriatic model
NHEK cells or HaCaT cells were stimulated with 10 ng/mL recombinant IL17A (Prospec Protein Specialists, CYT-250), OSM (Prospec Protein Specialists, CYT-231), TNF (Prospec Protein Specialists, CYT-223), IL22 (Prospec Protein Specialists, CYT-328), and IL1A (Prospec Protein Specialists, CYT-253) alone or in combination (named M5 combination) in DMEM supplemented with 2% (v:v) FBS, to recapitulates numerous features of psoriasis [Citation28]. Similarly, primary mouse keratinocyte cells were stimulated with 10 ng/mL recombinant IL17A (Prospec Protein Specialists, CYT-378), OSM (Prospec Protein Specialists, CYT-168), TNF (Prospec Protein Specialists, CYT-252), IL22 (Prospec Protein Specialists, CYT-539), and IL1A (Prospec Protein Specialists, CYT-523) in combination in DMEM supplemented with 2% (v:v) FBS.
Induction of the in vivo psoriatic model
The psoriasis animal models used in our research study were an IMQ-induced psoriasis mouse model and the Krt14-Vegfa mouse model.
To establish IMQ-induced psoriasis-like skin inflammation, the IMQ mouse model of psoriasis-like skin inflammation was induced as previously described [Citation25,Citation26]. Briefly, the day before induction, the backs of the mice were shaved and then treated with Aldara cream (Sichuan MingXin Pharmaceutical Co., LTD., H20030129) containing 5% IMQ (55 mg) once daily for 1 to 7 d.
In Krt14-Vegfa mice (FVB-Tg[Krt14-Vegfa]3Dtm/J), VEGFA is overexpressed in the epidermis, and the mice spontaneously develop a chronic inflammatory cutaneous disease with many features similar to human psoriasis [Citation27,Citation78].
Mice treatment
The IMQ-induced psoriasis mouse model was performed by subcutaneous injection of the mice with 0.5 or 1 mg/kg recombinant IL23R-FC (customized by Sino Biological Inc.) on days −3, 0, and 3 (the days were numbered relative to the start of IMQ application). On day 5, the skin was harvested and analyzed.
Krt14-Vegfa transgenic homozygous female mice (aged 3 months) with moderate psoriasis were selected for the experiment. Isovolumetric PBS (vehicle), 20 mg/kg, or 50 mg/kg cyclosporin A (CsA; Sigma-Aldrich, C1832) was administered once daily via intraperitoneal injections for 3 weeks, respectively.
For the HMGB1-induced inflammatory skin experiments, 2 μg rHMGB1 (R&D Systems, 1690-HMB-050) or vehicle control was intradermal injected daily into the dorsal skin of WT mice or tcrd KO mice for 7 d.
For treatment in psoriasis model with lentiviral shRNA interference, mouse lentiviral Hmgb1 shRNA (5ʹ-GCTCAAGGAGAATTTGTAACT-3ʹ) and scrambled shRNA were customized by Shanghai GenePharma Co., Ltd. Ten million particle forming units (PFU) of either lentiviral production (Hmgb1 shRNA or control shRNA) were subcutaneously injected into the dorsal skin of WT mice. One week later, the IMQ mouse model was established as described above.
The day prior to rHMGB1, rIL1B and rIL18 induction, the backs of the Krt14+/+-Atg5f/f and Krt14Cre/+-atg5f/f mice were shaved. Subsequently, the mouse dorsal skin was intradermal injected with 1 μg rHMGB1, 20 ng rIL1B (Sino Biological, 50101-MNAE), 20 ng rIL18 (Sino Biological, 50073-MNCE), or an equal volume of PBS (vehicle control) daily for 5 d during IMQ treatment.
Hematoxylin and eosin (H&E) staining, microscopy and image analysis
Human skin, mouse dorsal skin, and ear tissue were fixed in 4% paraformaldehyde in PBS, embedded in paraffin, sectioned, and stained with H&E for histopathologic examination. Images were captured using an Olympus BX600 microscope (Olympus Corporation, Tokyo, Japan) and SPOT Flex camera (Olympus Corporation, Tokyo, Japan) and were analyzed with ImagePro Plus (version 6.0, Media Cybernetics) software. The epithelial thickness and infiltrating cells were evaluated in independent regions.
Immunohistochemistry, microscopy and image analysis
Human skin, mouse dorsal skin, and ear tissue were fixed in 4% paraformaldehyde in PBS, and the fixed sections were incubated in 3% H2O2 solution in PBS at room temperature for 10 min. Antigen retrieval was performed in sodium citrate buffer (0.01 M, pH 6.0) in a microwave oven at 1000 W for 3 min. Nonspecific antibody binding was blocked by incubation with 5% normal goat serum in PBS for 1 h at room temperature. Slides were stained overnight at 4°C with the following primary antibodies: BECN1 (Santa Cruz Biotechnology, sc-11427; 1:200 dilution), MKI67 (Abcam, ab16667; 1:200 dilution), and HMGB1 (Cell Signaling Technology, 6893S; 1:200 dilution). The slides were subsequently washed and incubated with biotin-conjugated secondary antibodies for 30 min, and then with Horseradish Peroxidase Streptavidin (HRP Streptavidin) for 30 min (SPlink Detection Kits; ZSGB-BIO, SP-9001 or SP-9002). The sections were developed using the 3,3ʹ-Diaminobenzidine (DAB) substrate kit (ZSGB-BIO, ZLI-9017) and counterstained with hematoxylin. Images were captured using an Olympus BX600 microscope and SPOT Flex camera. ImagePro Plus was used for further quantification of the DAB intensity and the number of MKI67-positive cells in the images.
Histology, immunostaining, microscopy and image analysis
Tissue biopsies were directly embedded in OCT compound, and the frozen sections were fixed in cold methanol-acetone (1:1) for 15 min, permeabilized with 0.3% Triton X-100 (Sigma-Aldrich, X100) in PBS for 15 min, blocked with 5% BSA (Sigma-Aldrich, B2064) in PBS for 30 min, and then incubated overnight at 4°C with primary antibodies against ATG5 (Sigma-Aldrich, A0731; 1:200 dilution), LC3A/B (Cell Signaling Technology, 4108S; 1:200 dilution), LC3A (Abcam, ab62720; 1:200 dilution), and LC3B (Cell Signaling Technology, 2775S; 1:200 dilution). As a secondary reagent, FITC- or TRITC- conjugated donkey anti-rabbit antibodies (A16036, A16040; 1:1000 dilution, 4 μg/mL) were used, they were both from Invitrogen. Nuclear counterstaining was performed with 4ʹ,6-diamidino-2-phenylindole (DAPI; Sigma-Aldrich, D9542). Images were analyzed with a Leica DM RXA2 confocal microscope controlled by Leica Microsystems confocal software (version 2.61 Build 1537; all from Leica Microsystems, Wetzlar, Germany). ImageJ (National Institutes of Health) was used for further quantification of the fluorescence and intensities of the images.
EGFP-LC3 assay
HaCaT cells were transfected with 4 μg EGFP-LC3 (Addgene, 11546; deposited by Dr. Karla Kirkegaard’s lab) using X-tremeGENE HP DNA transfection reagent (Roche, 06366236001) for 48 h according to the manufacturer’s instructions. The cells were selected with antibiotics (G418; Thermo Fisher Scientific, 10131027) to generate stable cell lines, and the stable cell lines were plated on 14 mm-diameter coverslips (WHB-Bio, WHB-24-CS). The coverslips were stimulated with an M5 combination for the indicated times. The coverslips were fixed in 4% formaldehyde, and specimens were evaluated using an Olympus BX600 microscope and SPOT Flex camera.
Immunocytochemistry, microscopy and image analysis
HaCaT cells were plated on 14 mm-diameter coverslips, and the coverslips were transfected with 5 pmol SignalSilence® MAPK8/9/10 siRNA I (Cell Signaling Technology, 6232S), SignalSilence® MAPK14 siRNA I (Cell Signaling Technology, 6564S), SignalSilence® p44/42 MAPK (MAPK1/3) siRNA (Cell Signaling Technology, 6560S), and SignalSilence® Control siRNA (Cell Signaling Technology, 6568S) using Lipofectamine™ RNAiMAX reagent (Invitrogen, 13778–075) for 48 h according to the manufacturer’s instructions. NHEK cells were plated on 14 mm-diameter coverslips, and the coverslips were transfected with 4 μg HMGB1-EBFP2 using X-tremeGENE HP DNA transfection reagent (Roche, 06366236001) for 48 h according to the manufacturer’s instructions. The HMGB1-EBFP2 plasmid was generated in our laboratory. The coverslips were stimulated with M5 combination for 48 h, and the coverslips were fixed in cold methanol-acetone (1:1) for 15 min, permeabilized with 0.1% Triton X-100 in PBS for 10 min, blocked with 5% BSA in PBS for 30 min, and then incubated overnight at 4°C with primary antibodies against LC3A/B (1:200 dilution) and LAMP1 (Sino Biological, 11215-MM07; 1:100 dilution). As a secondary reagent, FITC-conjugated donkey anti-rabbit antibodies (A16036; 1:1000 dilution) and TRITC-conjugated donkey anti-mouse antibodies (A16022; 4 µg/mL) were used, they were both from Invitrogen. Images were analyzed with a Leica DM RXA2 confocal microscope controlled by Leica Microsystems confocal software (version 2.61 Build 1537; all from Leica Microsystems, Wetzlar, Germany). ImageJ was used for further analysis of lines of fluorescence tracing from images and the Pearson colocalization coefficient for LC3A/B and LAMP1.
Transmission electron microscopy
Human skin tissues and NHEK cells were fixed in 3% glutaraldehyde, 0.1 M phosphate buffer, pH 7.4, and post-fixed in 1% osmium tetroxide in Sorensen’s phosphate buffer (0.133 M Na2HPo4, 0.133 M KH2PO4, pH 7.4). After dehydration in ethyl alcohol, the tissues and cells were embedded in Epon (Electron Microscopy Sciences, 14120). The samples were cut serially and placed on copper grids and analyzed using an H-600IV transmission electron microscope (HITACHI, Tokyo, Japan). The samples were processed for EM by Song Lei, Ph.D. (Department of Pathology, West China Hospital, Sichuan University).
Neutralizing antibodies in vitro
NHEK cells were stimulated with M5 for 24 h in the absence or presence of neutralizing antibodies, anti-IL1B goat IgG antibody (anti-IL1B; R&D Systems, AF-201-NA; 10 µg/ml), anti-IL18 mouse IgG1 antibody (anti-IL18; MBL International Corporation, D044-3; 10 µg/mL), anti-HMGB1 IgY antibody (anti-HMGB1; SHINO-TEST Corporation, 326052233; 10 µg/mL), or isotype control antibodies, goat IgG (R&D Systems, AB-108-C; 10 µg/mL), mouse IgG1 (R&D Systems, MAB002; 10 µg/mL), and IgY (SHINO-TEST Corporation, 326058471; 10 µg/mL). The chemokine and antimicrobial peptides RNA levels were assayed by quantitative RT-PCR (qRT-PCR).
Krt14+/+-Atg5f/f and Krt14Cre/+-atg5f/f primary murine keratinocytes were stimulated with M5 for 24 h in the absence or presence of neutralizing antibodies, anti-IL1B armenian hamster IgG antibody (anti-IL1B; BioXcell, BE0246; 10 µg/mL), anti-IL18 rat IgG2a antibody (anti-IL18; BioXcell, BE0237; 10 µg/mL), anti-HMGB1 IgY antibody (anti-HMGB1; 10 µg/mL), or isotype control antibodies, armenian hamster IgG antibody (anti-IgG; BioXcell, BE0091; 10ug/ml), rat IgG2a (anti-IgG2a; BioXcell, BE0089; 10 µg/mL) and IgY (anti-IgY; 10 µg/mL). The indicated genes levels were assayed by qRT-PCR.
Treatment of primary murine keratinocytes with recombinant proteins
Krt14+/+-Atg5f/f and Krt14Cre/+-atg5f/f primary murine keratinocytes were stimulated with M5 for 24 h in the absence or presence of rHMGB1 (10 μg/mL), rI18 (100 ng/mL), rIL1B (10 ng/mL). The indicated genes levels were assayed by qRT-PCR analysis.
Inhibitor experiments
NHEK cells or HaCaT cells were stimulated with or without M5 in the absence or pretreated with 3-methyladenine (3-MA; Sigma-Aldrich, M9281; 4 h, 10 mM), bafilomycin A1 (BAF; Sigma-Aldrich, B1793; 4 h, 200 nM) or wortmannin (WOR; Beyotime Institute of Biotechnology, S1952; 4 h, 100 nM) for indicated times.
HaCaT cells were stimulated with or without M5 in the absence or presence of monensin (Selleck Chemicals, S2324; 10 μM) or FLI-06 (Selleck Chemicals, S7399; 10 μM) for the indicated times.
siRNA and shRNA-mediated silencing of gene expression
HaCaT cells were transfected with 5 pmol SignalSilence® MAPK8/9/10 siRNA I (Cell Signaling Technology, 6232S), SignalSilence® MAPK14 siRNA I (Cell Signaling Technology, 6564S), SignalSilence® p44/42 MAPK (MAPK1/3) siRNA (Cell Signaling Technology, 6560S), or SignalSilence® Control siRNA (Cell Signaling Technology, 6568S) using Lipofectamine™ RNAiMAX reagent (Invitrogen, 13778–075) for 48 h according to the manufacturer’s instructions.
Human shRNA-HMGB1 lentivirus (HMGB1 shRNA, 5ʹ-CCCGTTATGAAAGAGAAATGA-3ʹ), human shRNA-GORASP2 lentivirus (GORASP2 shRNA, 5ʹ-GGTCCAGCTGTCCTCAGTTAA-3ʹ) and control lentivirus (Ctrl shRNA) were obtained from Shanghai GenePharma Co., Ltd. Lentiviral production was performed in HaCaT cells according to the manufacturer’s instructions. The cells were incubated with the lentivirus particles, and 2 d after post-infection, the cells stably expressing the lentiviral construct were selected with puromycin (Thermo Fisher Scientific, A1113802; 3 μg/mL) for cells stably expressing the lentiviral construct.
Flow cytometry
To obtain single-cell suspensions from dorsal skin, 2 × 3 cm sections of skin samples were incubated for approximately 1.75 h at 37°C with 5 mL RPMI medium (Thermo Fisher Scientific, C22400500BT) containing 500 μg/mL of Liberase (Roche, 5401127001) and then were minced with sharp scissors, incubated for an additional 15 min with 0.1 mg/mL DNase (Roche, 10104159001), single-cell suspension of dorsal skin was made followed by mechanical dissociation with a gentleMACS dissociator (Miltenyi Biotech, Bergisch Gladbach, Germany), and filtered sequentially through 40 μm and 70 μm cell strainers (BD Bioscience, 352340 and 352350), and cells were washed once with PBS [Citation79].
For surface staining, the cells were stained with appropriate antibodies against surface antigens in PBS on ice for 30 min. The cellular viability was assessed by staining with 7-aminoactinomycin D (7-AAD) (BioLegend, 420404; 0.5 μg/mL) to exclude dead cells. For the analysis of IL17A production, in vitro re-stimulation and intracellular staining, single-cell suspensions were incubated for 4 h at 37°C with PMA (Sigma-Aldrich, p1585; 200 ng/mL), brefeldin A (BioLegend, 420601; 5 µg/mL), and ionomycin (Abcam, ab120116; 1 µg/mL). The cells were then washed and stained with the fixable viability stain 620 (FVS 620; BD-Biosciences, 564996) for 10 min. After performing surface staining as described above, cells were fixed with 4% paraformaldehyde and permeabilized with PBS supplemented with 0.1% Triton X-100. Intracellular staining with fluorescent-labeled antibodies was performed for 30 min in PBS. For flow cytometric analysis, the cells were washed and resuspended in PBS. Flow cytometry was performed using the NovoCyte flow cytometer and ACEA NovoExpress™ software (ACEA Biosciences, San Diego, CA, USA). The single-cell suspensions were stained with the following antibodies: ITGAM-APC (17-0112-82), GR1-FITC (11-5931-82), CD3-APC-CY7 (100222), γδT-PE-CY7 (118124), IL17A-APC (506916), Vγ2-PE (137705), CD4-PerCP (100432), γδT-APC (118116), Vγ5-PE (137504) and IFNG-FITC (505806). Antibodies were purchased from eBioscience and BioLegend and used at 1:100 dilution. The anti-vγ6 antibody was purified from 17D1, and the cells were kindly provided by Dr. Tigelaar (Department of Dermatology, Yale University). Anti-Vγ6 antibody was fluorescently labeled with a Rapid Alexa Fluor® 488 antibodies using a protein labeling kit (332–0015) obtained from Expedeon.
qRT-PCR analysis
Total RNA from cells or mouse tissues was extracted with TRIzol (Thermo Fisher Scientific, 15596018) according to the manufacturer’s protocol. Gel electrophoresis was performed to detect the integrity of the total RNA extracted. After the genomic DNA elimination reaction, the total RNA (2 µg) was reverse transcribed into cDNA. A primeScript RT reagent kit with gDNA Eraser (Takara Bio, RR047A) was used for reverse transcription to produce cDNA at 37°C for 15 min and at 85°C for 5 s according to the manufacturer’s protocol. The obtained cDNA (20 ng) was subjected to qRT-PCR analysis with TB Green™ Premix Ex Taq™ II (Takara Bio, RR820) according to the manufacturer’s protocol. The results were normalized to ACTB, and quantification was performed using the 2−ΔΔCt method. The melting curves were confirmed to ensure the amplification of a single product. All primers were obtained from Chengdu Qing Ke Zi Xi Biotechnology Co., and the primer sequences are provided in Table S5.
Tissue dissection
The backs of the mice were shaved, and the skin was wiped with alcohol prior to its removal, then subcutaneous fat was removed and was cut into small pieces convenient for digestion and separation. The samples were then incubated in 2.4 U/mL dispase II overnight at 4°C and then immersed in DMEM containing 50% (v:v) FBS to inactivate the dispase II. The epidermis and dermis were then separated at the epidermal-dermal interface under magnification with a dissecting microscope (Leica MZ6, Leica Microsystems, Wetzlar, Germany). Only pieces that consisted entirely of epidermis or dermis were used.
Cell fractions
HaCaT cells were stimulated with M5 in the absence or pretreated with 3-methyladenine (3-MA; 4 h, 10 mM) for 48 h. Western blots were performed to analyze the expression of various proteins in the whole cell, nuclear, and cytoplasmic extracts. The nuclear and cytosolic extracts were prepared using the nuclear and cytoplasmic extraction kit (Thermo Fisher Scientific, 78833) according to the manufacturer’s protocol.
Western blot
The samples derived from cells and tissue were lysed, separated by electrophoresis on SDS-PAGE gels (Beyotime Institute of Biotechnology, P0012AC) and transferred to polyvinylidene fluoride (PVDF) membranes (MerckMinipore, IPVH00010 or ISEQ00010). For western blotting detection, the proteins were incubated overnight with the following primary antibodies: BECN1 (1:1000 dilution), LC3A/B-II (1:1000 dilution), LC3A-II (1:1000 dilution), LC3B-II (1:1000 dilution), ATG5 (Sigma‑Aldrich, A0731; 1:1000 dilution), SQSTM1 (Cell Signaling Technology, 5114S; 1:1000 dilution), HMGB1 (1:1000 dilution), p-MAPK8/9/10 (Cell Signaling Technology, 9251S; 1:1000 dilution), MAPK8/9/10 (Cell Signaling Technology, 9252S; 1:1000 dilution), p-MAPK1/3 (Cell Signaling Technology, 9101S; 1:1000 dilution), MAPK1/3 (Cell Signaling Technology, 9102S; 1:1000 dilution), p-MAPK14 (Cell Signaling Technology, 9211S; 1:1000 dilution), MAPK14 (Cell Signaling Technology, 9212S; 1:1000 dilution), RELA/p65 (Cell Signaling Technology, 8242S; 1:1000 dilution), Histone H3 (Cell Signaling Technology, 4499S; 1:2000 dilution), PRO-CASP1 (R&D Systems, MAB6215; 0.1 µg/mL), CASP1 p20 (Adipogen, AG-20B-0048-C100; 1:1000 dilution), and ACTB (actin beta; Proteintech group, 60008-1-Ig; 1:10000 dilution), incubated overnight. Labeling of the primary antibodies was detected using goat anti-rabbit or goat anti-mouse antibodies conjugated to horseradish peroxidase (HRP) (ZSGB-BIO, ZB-2301 or ZB2305; 1:10000 dilution), and further detected using ECL reagents (MerckMinipore, WBULS0500). ImageJ was used for further quantification of the band intensities in the images, and only the band intensities in the linear range were included.
Enzyme-linked immunosorbent assay (ELISA)
To detect the levels of HMGB1, IL8, IL18, IL1B and IL17A in the cell culture supernatant, the cell culture supernatants were collected, and the HMGB1, IL8, IL18, IL1B, and IL17A levels were measured using the HMGB1 Detection Kit (Chondrex, 6010), IL8 ELISA kit (Thermo Fisher Scientific, 88–8086), IL18 ELISA kit (Thermo Fisher Scientific, BMS267INST), IL1B ELISA kit (Thermo Fisher Scientific, BMS224HS), and IL17A ELISA kit (BioLegend, 432502) according to the manufacturer’s instructions.
Microarray expression profiling
Microarray expression profiling. Gene array analysis was performed using Human Expr 12x135K Arr Del (Roche NimbleGen, 05543789001) by KangChen Bio‑tech, Inc. In brief, total mRNA was isolated from KCs at 24 h post-stimulation with M5 using the PureYield™ RNA Midiprep System (Promega Corporation, Madison, WI, USA). The total RNA was quantified using the NanoDrop ND-1000A (Thermo Fisher Scientific, Wilmington, USA), and the RNA integrity and gDNA contamination were assessed by standard denaturing 1% agarose gel electrophoresis. The total mRNA from each sample was used for labeling, and array hybridization was performed according to the manufacturer’s protocols. Specifically, reverse transcription was performed using the SuperScript Double-Stranded cDNA Synthesis kit (Thermo Fisher Scientific, Waltham, USA); ds-cDNA labeling was performed using the NimbleGen one-color DNA labeling kit (Roche Diagnostics, Mannheim, Germany); array hybridization was performed using the NimbleGen Hybridization System followed by washing with the NimbleGen wash buffer kit (Roche Diagnostics, 05584507001); and array scanning was performed using the Axon GenePix 4000B microarray scanner (Molecular Devices LLC, Sunnyvale, CA, USA). The raw signal intensities were extracted and normalized using the Robust Multichip Average (RMA) method with NimbleScan v2.5 software (Roche NimbleGen), and low intensity (<100.0) genes were filtered. Further data analysis was performed using Agilent GeneSpring GX 11.5.1 software (Agilent Technologies). Two biological replicates were used for each sample, the expression values were normalized based on the expression value for each probe set and differently expressed probe sets were identified based on Student’s t-test for paired samples’ normalized expression values using the following cutoff: absolute fold-change (FC) > 1.5, P < 0.01, and false discovery rate < 0.05.
MTT assay
Growing NHEK cells (2 × 10³ cells/well) were seeded on 96-well plates with 100 µL medium. For the assessment of cell viability, 100 µL medium containing 3-methyladenine (3-MA; 10 mM) and bafilomycin A1 (BAF; 200 nM) was added, and the cultures were incubated at 37°C for 72 h. Subsequently, 20 µL MTT solution (Sigma-Aldrich, M5655; 5 mg/mL) was added to each well and the cells were incubated at 37°C for 4 h. The supernatant was removed and 150 µL DMSO (Sigma-Aldrich, D2650) was added to each well. The absorbance was at 570 nm was measured using an ELISA reader (Bio-Rad Laboratories, Richmond, CA). All experiments were performed in triplicate.
LDH release assay
The release of LDH was measured as a physiological indicator of cell membrane damage. NHEK cells were stimulated with or without M5 in the absence or pretreated with 3-methyladenine (3-MA; 4 h, 10 mM), bafilomycin A1 (BAF; 4 h, 200 nM) or wortmannin (WOR; 4 h, 100 nM) for 48 h. The release of LDH from cells was detected using an LDH cytotoxicity detection kit (Promega, G1780). The maximal LDH release was detected by freeze-thaw lysis of the transfected cells. The experiment was repeated three times.
Skin cell preparation and stimulation
The back skin obtained from the mice was incubated in 0.25% Trypsin (Thermo Fisher Scientific, 15050–057) for overnight at 4°C. The epidermis was separated, cut into small pieces. Epidermis was further incubated with 0.25% Trypsin for 30 min at 37°C; a buffer containing 100 U/mL collagenase I (Thermo Fisher Scientific, 17100017), 0.5 mg/mL hyaluronidase (Sigma-Aldrich, H1136) and 0.1 mg/mL DNase was used to obtain dermal cell suspensions. Single-cell suspensions of epidermis and dermis were prepared after mechanical dissociation using a gentleMACS dissociator. Complete RPMI medium supplemented with 10% (v:v) FBS was added and the cell suspensions were subsequently passed through a 40-μm and 70-μm cell strainer, and the cells were washed once with PBS.
Cocultures of epidermal and dermal cells at a ratio of 1:1 were treated with or without anti-HMGB1 IgY antibody (10 µg/mL) or rHMGB1 (10 µg/mL) for 48 h. The dermal cells were stimulated with the indicated combination of mouse rIL23A (Sino Biological, CT028-M08H; 50 ng/mL), rHMGB1 (10 µg/mL), and rIL1B (10 ng/mL) with the indicated combination for 48 h. The supernatants were harvested for measurement of the IL17A level using an IL17A ELISA kit according to the manufacturer’s instructions.
Epidermal cells from the WT mice were stimulated with rHMGB1 (10 µg/mL) for 48 h, and the supernatant was collected for the stimulation of dermal cells. Dermal cells from tcrd KO mice or WT mice were treated with rHMGB1-induced epidermal supernatant for 48 h in the absence or presence of anti-HMGB1 IgY antibody (10 µg/mL), or isotype control antibodies (anti-IgY; 10 µg/mL). The supernatants were harvested for measurement of the IL17A level using an IL17A ELISA kit according to the manufacturer’s instructions.
Statistical analysis
All statistical analysis was performed with GraphPad Prism 8 software (GraphPad Software Company, version 8.0.0). Student’s t-test was used for comparing two groups, Spearman’s rank correlation test was used to analyze the relationship between two quantitative variables, and one-way analysis of variance with Turkey’s post hoc test was utilized for the comparisons of multiple groups. P < 0.05 was considered statistically significant.
Please see supplementary methods of supplementary information for the description of LC3 antibodies specificities, the single factor of M5 stimulation, inhibition experiment, ELISA for serum HMGB1, HMGB1 neutralization in vivo.
Supplemental Material
Download MS Word (88 MB)Supplemental Material
Download MS Word (88 MB)Acknowledgments
We thank Prof. Noboru Mizushima (University of Tokyo) and Prof. Wei Li (Chinese Academy of Sciences) for providing Atg5-floxed mice (B6.129S-Atg5<tm1Myok>), Prof. Tadatsugu Taniguchi (University of Tokyo) for providing Hmgb1-floxed mice. B6.129P2-Tcrdtm1Mom/J mice (tcrd KO mice; 002120) were kindly provided by Dr. Zhinan Yin (Jinan University, Guangzhou). Dr. Tigelaar (Department of Dermatology, Yale University) for providing Anti-TCRVγ5/Vγ6 (17D1).
Supplemental Material
Supplemental data for this article can be accessed on the publisher's website.
Disclosure statement
No potential conflict of interest was reported by the authors.
Additional information
Funding
References
- Lowes MA, Suarez-Farinas M, Krueger JG. Immunology of psoriasis. Annu Rev Immunol. 2014;32:227–255.
- Nestle FO, Di Meglio P, Qin JZ, et al. Skin immune sentinels in health and disease. Nat Rev Immunol. 2009;9:679–691.
- Deretic V, Saitoh T, Akira S. Autophagy in infection, inflammation and immunity. Nat Rev Immunol. 2013;13:722–737.
- Shibutani ST, Saitoh T, Nowag H, et al. Autophagy and autophagy-related proteins in the immune system. Nat Immunol. 2015;16:1014–1024.
- Deretic V, Levine B. Autophagy balances inflammation in innate immunity. Autophagy. 2018;14:243–251.
- Kovacs JR, Li C, Yang Q, et al. Autophagy promotes T-cell survival through degradation of proteins of the cell death machinery. Cell Death Differ. 2012;19:144–152.
- Mehto S, Jena KK, Nath P, et al. The crohn’s disease risk factor IRGM limits NLRP3 inflammasome activation by impeding its assembly and by mediating its selective autophagy. Mol Cell. 2019;73:429–45 e7.
- Yin H, Wu H, Chen Y, et al. The therapeutic and pathogenic role of autophagy in autoimmune diseases. Front Immunol. 2018;9:1512.
- Lai ZW, Kelly R, Winans T, et al. Sirolimus in patients with clinically active systemic lupus erythematosus resistant to, or intolerant of, conventional medications: a single-arm, open-label, phase 1/2 trial. Lancet. 2018;391:1186–1196.
- Plantone D, Koudriavtseva T. Current and future use of chloroquine and hydroxychloroquine in infectious, immune, neoplastic, and neurological diseases: a mini-review. Clin Drug Investig. 2018;38:653–671.
- Douroudis K, Kingo K, Traks T, et al. Polymorphisms in the ATG16L1 gene are associated with psoriasis vulgaris. Acta Derm Venereol. 2012;92:85–87.
- Shao F, Tan T, Tan Y, et al. Andrographolide alleviates imiquimod-induced psoriasis in mice via inducing autophagic proteolysis of MyD88. Biochem Pharmacol. 2016;115:94–103.
- Li L, Chen X, Gu H. The signaling involved in autophagy machinery in keratinocytes and therapeutic approaches for skin diseases. Oncotarget. 2016;7:50682–50697.
- Akinduro O, Sully K, Patel A, et al. Constitutive autophagy and nucleophagy during epidermal differentiation. J Invest Dermatol. 2016;136:1460–1470.
- Chikh A, Sanza P, Raimondi C, et al. iASPP is a novel autophagy inhibitor in keratinocytes. J Cell Sci. 2014;127:3079–3093.
- Yoshihara N, Ueno T, Takagi A, et al. The significant role of autophagy in the granular layer in normal skin differentiation and hair growth. Arch Dermatol Res. 2015;307:159–169.
- Kloft N, Neukirch C, Bobkiewicz W, et al. Pro-autophagic signal induction by bacterial pore-forming toxins. Med Microbiol Immunol. 2010;199:299–309.
- Lee HM, Shin DM, Yuk JM, et al. Autophagy negatively regulates keratinocyte inflammatory responses via scaffolding protein p62/SQSTM1. J Iimmunol. 2011;186:1248–1258.
- Mahil SK, Twelves S, Farkas K, et al. AP1S3 mutations cause skin autoinflammation by disrupting keratinocyte autophagy and up-regulating IL-36 production. J Invest Dermatol. 2016;136:2251–2259.
- Varshney P, Saini N. PI3K/AKT/mTOR activation and autophagy inhibition plays a key role in increased cholesterol during IL-17A mediated inflammatory response in psoriasis. Biochim Biophys Acta Mol Basis Dis. 2018;1864:1795–1803.
- Deretic V, Jiang S, Dupont N. Autophagy intersections with conventional and unconventional secretion in tissue development, remodeling and inflammation. Trends Cell Biol. 2012;22:397–406.
- Baker BS, Brent L, Valdimarsson H, et al. Is epidermal cell proliferation in psoriatic skin grafts on nude mice driven by T-cell derived cytokines? Br J Dermatol. 1992;126:105–110.
- Weidberg H, Shvets E, Shpilka T, et al. LC3 and GATE-16/GABARAP subfamilies are both essential yet act differently in autophagosome biogenesis. Embo J. 2010;29:1792–1802.
- Klionsky DJ, Abdelmohsen K, Abe A, et al. Guidelines for the use and interpretation of assays for monitoring autophagy (3rd edition). Autophagy. 2016;12:1–222.
- El Malki K, Karbach SH, Huppert J, et al. An alternative pathway of imiquimod-induced psoriasis-like skin inflammation in the absence of interleukin-17 receptor a signaling. J Invest Dermatol. 2013;133:441–451.
- van der Fits L, Mourits S, Voerman JS, et al. Imiquimod-induced psoriasis-like skin inflammation in mice is mediated via the IL-23/IL-17 axis. J Iimmunol. 2009;182:5836–5845.
- Xia YP, Li B, Hylton D, et al. Transgenic delivery of VEGF to mouse skin leads to an inflammatory condition resembling human psoriasis. Blood. 2003;102:161–168.
- Guilloteau K, Paris I, Pedretti N, et al. Skin inflammation induced by the synergistic action of IL-17A, IL-22, oncostatin M, IL-1{alpha}, and TNF-{alpha} recapitulates some features of psoriasis. J Iimmunol. 2010;184:5263–5270.
- Teng X, Hu Z, Wei X, et al. IL-37 ameliorates the inflammatory process in psoriasis by suppressing proinflammatory cytokine production. J Iimmunol. 2014;192:1815–1823.
- Jia G, Cheng G, Gangahar DM, et al. Insulin-like growth factor-1 and TNF-alpha regulate autophagy through c-jun N-terminal kinase and Akt pathways in human atherosclerotic vascular smooth cells. Immunol Cell Biol. 2006;84:448–454.
- Harris J. Autophagy and cytokines. Cytokine. 2011;56:140–144.
- Hara T, Nakamura K, Matsui M, et al. Suppression of basal autophagy in neural cells causes neurodegenerative disease in mice. Nature. 2006;441:885–889.
- Cai Y, Shen X, Ding C, et al. Pivotal role of dermal IL-17-producing gammadelta T cells in skin inflammation. Immunity. 2011;35:596–610.
- Pantelyushin S, Haak S, Ingold B, et al. Rorγt+ innate lymphocytes and γδ T cells initiate psoriasiform plaque formation in mice. J Clin Invest. 2012;122:2252–2256.
- Macleod AS, Havran WL. Functions of skin-resident gammadelta T cells. Cell Mol Life Sci. 2011;68:2399–2408.
- Huang da W, Sherman BT, Lempicki RA. Systematic and integrative analysis of large gene lists using DAVID bioinformatics resources. Nat Protoc. 2009;4:44–57.
- Dupont N, Jiang S, Pilli M, et al. Autophagy-based unconventional secretory pathway for extracellular delivery of IL-1beta. Embo J. 2011;30:4701–4711.
- Son SM, Cha MY, Choi H, et al. Insulin-degrading enzyme secretion from astrocytes is mediated by an autophagy-based unconventional secretory pathway in alzheimer disease. Autophagy. 2016;12:784–800.
- Zhang M, Kenny SJ, Ge L, et al. Translocation of interleukin-1beta into a vesicle intermediate in autophagy-mediated secretion. eLife. 2015;4:e11205.
- Zhang X, Wang L, Lak B, et al. GRASP55 senses glucose deprivation through O-GlcNAcylation to promote autophagosome-lysosome fusion. Dev Cell. 2018;45:245–61 e6.
- Vande Walle L, Kanneganti TD, Lamkanfi M. HMGB1 release by inflammasomes. Virulence. 2011;2:162–165.
- Shi C-S, Shenderov K, Huang -N-N, et al. Activation of autophagy by inflammatory signals limits IL-1 [beta] production by targeting ubiquitinated inflammasomes for destruction. Nat Immunol. 2012;13:255–263.
- Harris HE, Andersson U, Pisetsky DS. HMGB1: a multifunctional alarmin driving autoimmune and inflammatory disease. Nat Rev Rheumatol. 2012;8:195–202.
- Bergmann C, Strohbuecker L, Lotfi R, et al. High mobility group box 1 is increased in the sera of psoriatic patients with disease progression. J Eur Acad Dermatol Venereol. 2016;30:435–441.
- Chen T, Guo ZP, Li L, et al. Increased HMGB1 serum levels and altered HMGB1 expression in patients with psoriasis vulgaris. Arch Dermatol Res. 2013;305:263–267.
- Sutton CE, Lalor SJ, Sweeney CM, et al. Interleukin-1 and IL-23 induce innate IL-17 production from gammadelta T cells, amplifying Th17 responses and autoimmunity. Immunity. 2009;31:331–341.
- Zhang W, Guo S, Li B, et al. Proinflammatory effect of high-mobility group protein B1 on keratinocytes: an autocrine mechanism underlying psoriasis development. J Pathol. 2017;241:392–404.
- Kuballa P, Nolte WM, Castoreno AB, et al. Autophagy and the immune system. Annu Rev Immunol. 2012;30:611–646.
- Kouroku Y, Fujita E, Tanida I, et al. ER stress (PERK/eIF2alpha phosphorylation) mediates the polyglutamine-induced LC3 conversion, an essential step for autophagy formation. Cell Death Differ. 2007;14:230–239.
- Tong Y, Huang H, Pan H. Inhibition of MEK/ERK activation attenuates autophagy and potentiates pemetrexed-induced activity against HepG2 hepatocellular carcinoma cells. Biochem Biophys Res Commun. 2015;456:86–91.
- Sui X, Kong N, Ye L, et al. p38 and JNK MAPK pathways control the balance of apoptosis and autophagy in response to chemotherapeutic agents. Cancer Lett. 2014;344:174–179.
- Obergasteiger J, Frapporti G, Pramstaller PP, et al. A new hypothesis for Parkinson’s disease pathogenesis: gTPase-p38 MAPK signaling and autophagy as convergence points of etiology and genomics. Mol Neurodegener. 2018;13:40.
- Feng L, Song P, Xu F, et al. cis-khellactone inhibited the proinflammatory macrophages via promoting autophagy to ameliorate imiquimod-induced psoriasis. J Invest Dermatol. 2019;139:1946–1956.e3.
- Kanayama M, Inoue M, Danzaki K, et al. Autophagy enhances NFkappaB activity in specific tissue macrophages by sequestering A20 to boost antifungal immunity. Nat Commun. 2015;6:5779.
- Paul S, Kashyap AK, Jia W, et al. Selective autophagy of the adaptor protein Bcl10 modulates T cell receptor activation of NF-kappaB. Immunity. 2012;36:947–958.
- Monteleon CL, Agnihotri T, Dahal A, et al. Lysosomes support the degradation, signaling, and mitochondrial metabolism necessary for human epidermal differentiation. J Invest Dermatol. 2018;138:1945–1954.
- Kimura T, Jia J, Kumar S, et al. Dedicated SNAREs and specialized TRIM cargo receptors mediate secretory autophagy. Embo J. 2017;36:42–60.
- Kirkin V, McEwan DG, Novak I, et al. A role for ubiquitin in selective autophagy. Mol Cell. 2009;34:259–269.
- Stolz A, Ernst A, Dikic I. Cargo recognition and trafficking in selective autophagy. Nat Cell Biol. 2014;16:495–501.
- Tang D, Kang R, Livesey KM, et al. Endogenous HMGB1 regulates autophagy. J Cell Biol. 2010;190:881–892.
- Roy M, Liang L, Xiao X, et al. Lycorine downregulates HMGB1 to inhibit autophagy and enhances bortezomib activity in multiple myeloma. Theranostics. 2016;6:2209–2224.
- Kim YH, Kwak MS, Park JB, et al. N-linked glycosylation plays a crucial role in the secretion of HMGB1. J Cell Sci. 2016;129:29–38.
- Bonaldi T, Talamo F, Scaffidi P, et al. Monocytic cells hyperacetylate chromatin protein HMGB1 to redirect it towards secretion. Embo J. 2003;22:5551–5560.
- Kang R, Tang D, Schapiro NE, et al. The HMGB1/RAGE inflammatory pathway promotes pancreatic tumor growth by regulating mitochondrial bioenergetics. Oncogene. 2014;33:567–577.
- He SJ, Cheng J, Feng X, et al. The dual role and therapeutic potential of high-mobility group box 1 in cancer. Oncotarget. 2017;8:64534–64550.
- MacLeod AS, Rudolph R, Corriden R, et al. Skin-resident T cells sense ultraviolet radiation-induced injury and contribute to DNA repair. J Iimmunol. 2014;192:5695–5702.
- Nakajima K. Critical role of the interleukin-23/T-helper 17 cell axis in the pathogenesis of psoriasis. J Dermatol. 2012;39:219–224.
- Hasegawa E, Sonoda KH, Shichita T, et al. IL-23-independent induction of IL-17 from gammadeltaT cells and innate lymphoid cells promotes experimental intraocular neovascularization. J Iimmunol. 2013;190:1778–1787.
- Andersson U, Tracey KJ. HMGB1 is a therapeutic target for sterile inflammation and infection. Annu Rev Immunol. 2011;29:139–162.
- Derkow K, Kruger C, Dembny P, et al. Microglia Induce Neurotoxic IL-17+ gammadelta T cells dependent on TLR2, TLR4, and TLR9 activation. PloS One. 2015;10:e0135898.
- Yu Y, Tang D, Kang R. Oxidative stress-mediated HMGB1 biology. Front Physiol. 2015;6:93.
- Kang R, Chen R, Zhang Q, et al. HMGB1 in health and disease. Mol Aspects Med. 2014;40:1–116.
- Chen T, Fu LX, Guo ZP, et al. Involvement of high mobility group box-1 in imiquimod-induced psoriasis-like mice model. J Dermatol. 2017;44:573–581.
- Langley RG, Ellis CN. Evaluating psoriasis with psoriasis area and severity index, psoriasis global assessment, and lattice system physician’s global assessment. J Am Acad Dermatol. 2004;51:563–569.
- Aasen T, Izpisua Belmonte JC. Isolation and cultivation of human keratinocytes from skin or plucked hair for the generation of induced pluripotent stem cells. Nat Protoc. 2010;5:371–382.
- Lichti U, Anders J, Yuspa SH. Isolation and short-term culture of primary keratinocytes, hair follicle populations and dermal cells from newborn mice and keratinocytes from adult mice for in vitro analysis and for grafting to immunodeficient mice. Nat Protoc. 2008;3:799–810.
- Nakagawa S, Matsumoto M, Katayama Y, et al. Staphylococcus aureus virulent psmalpha peptides induce keratinocyte alarmin release to orchestrate IL-17-dependent skin inflammation. Cell Host Microbe. 2017;22:667–77 e5.
- Huggenberger R, Ullmann S, Proulx ST, et al. Stimulation of lymphangiogenesis via VEGFR-3 inhibits chronic skin inflammation. J Exp Med. 2010;207:2255–2269.
- Shibata S, Tada Y, Hau CS, et al. Adiponectin regulates psoriasiform skin inflammation by suppressing IL-17 production from gammadelta-T cells. Nat Commun. 2015;6:7687.