
ABSTRACT
Lysosomal Ca2+ contributes to macroautophagy/autophagy, an intracellular process for the degradation of cytoplasmic material and organelles in the lysosomes to protect cells against stress responses. TMBIM6 (transmembrane BAX inhibitor motif containing 6) is a Ca2+ channel-like protein known to regulate ER stress response and apoptosis. In this study, we examined the as yet unknown role of TMBIM6 in regulating lysosomal Ca2+ levels. The Ca2+ efflux from the ER through TMBIM6 was found to increase the resting lysosomal Ca2+ level, in which ITPR-independent regulation of Ca2+ status was observed. Further, TMBIM6 regulated the local release of Ca2+ through lysosomal MCOLN1/TRPML1 channels under nutrient starvation or MTOR inhibition. The local Ca2+ efflux through MCOLN1 channels was found to activate PPP3/calcineurin, triggering TFEB (transcription factor EB) nuclear translocation, autophagy induction, and lysosome biogenesis. Upon genetic inactivation of TMBIM6, lysosomal Ca2+ and the associated TFEB nuclear translocation were decreased. Furthermore, autophagy flux was significantly enhanced in the liver or kidney from starved Tmbim6+/+ mice compared with that in the counter tmbim6−/- mice. Together, our observations indicated that under stress conditions, TMBIM6 increases lysosomal Ca2+ release, leading to PPP3/calcineurin-mediated TFEB activation and subsequently enhanced autophagy. Thus, TMBIM6, an ER membrane protein, is suggested to be a lysosomal Ca2+ modulator that coordinates with autophagy to alleviate metabolism stress.Abbreviations: AVs: autophagic vacuoles; CEPIA: calcium-measuring organelle-entrapped protein indicator; ER: endoplasmic reticulum; GPN: glycyl-L-phenylalanine-beta-naphthylamide; ITPR/IP3R: inositol 1,4,5-trisphosphate receptor; LAMP1: lysosomal associated membrane protein 1; MCOLN/TRPML: mucolipin; MEF: mouse embryonic fibroblast; ML-SA1: mucolipin synthetic agonist 1; MTORC1: mechanistic target of rapamycin kinase complex 1; RPS6KB1: ribosomal protein S6 kinase B1; SQSTM1: sequestosome 1; TFEB: transcription factor EB; TKO: triple knockout; TMBIM6/BI-1: transmembrane BAX inhibitor motif containing 6
Introduction
Macroautophagy (hereafter referred to as “autophagy”) is an intracellular mechanism of self-degradation of cellular materials such as proteins, lipids, or even entire organelles. During nutrient starvation, autophagy is stimulated, and the lysosomal degradation pathway converts macromolecules into substrates for energy production, thus ensuring survival [Citation1]. Recent studies on the lysosome and its associated autophagy mechanisms have mainly focused on Ca2+ and TFEB (transcription factor EB) [Citation2].
TFEB is considered a master regulator of lysosomal and autophagic functions [Citation3,Citation4]. TFEB activity is negatively regulated by phosphorylation, which keeps the inactive TFEB in the cytoplasm [Citation2,Citation5–7]. Dephosphorylated TFEB rapidly enters the nucleus to activate transcriptional target genes related to lysosome biogenesis. TFEB phosphorylation is mediated mainly by the mechanistic target of rapamycin kinase complex 1 (MTORC1), a major kinase complex that controls cell growth and negatively regulates autophagy. It was recently reported that lysosomal Ca2+ release through MCOLN1/TRPML1 (mucolipin 1; a member of the transient receptor potential channel family) evokes local calcium signaling, which activates PPP3/calcineurin phosphatase for dephosphorylation of TFEB, thus promoting autophagy [Citation2].
Lysosomes are membrane-bound organelles present in all cell types. Intracellular substrates are delivered to the lysosome by the autophagic pathway through the fusion of autophagosomes with lysosomes [Citation8] and then degraded by a wide variety of hydrolases for recycling of cellular waste. The lysosome is also a Ca2+ signaling center of the cell, with an estimated Ca2+ concentration of 500–600 μM [Citation9]. The endoplasmic reticulum (ER), particularly ITPR/IP3 R (inositol 1,4,5-trisphosphate receptor), which is a ubiquitous ER Ca2+-release channel, can be a direct and primary source of Ca2+ for lysosome [Citation10]. However, because the role of lysosomes in degradation and recycling processes has always been considered as a cellular “housekeeping” function, little attention has been paid to investigate the relationship between ER, lysosomal Ca2+ signaling, and related autophagy.
TMBIM6 (transmembrane BAX inhibitor motif containing 6), a highly conserved multi-transmembrane protein, has been identified as a suppressor of BAX-mediated cell death [Citation11]. TMBIM6 has been suggested to be a Ca2+ channel-like protein that is integral to the intracellular membranes of ER [Citation12,Citation13]. The calcium-binding activity has been found to be responsive to protons and other cations. The conserved aspartyl dyad (Asp171-Asp195) in an uncharacterized protein YetJ from Bacillus subtilis (BsYetJ) among TMBIM members regulates pH-dependent calcium-binding and manages the channel pore opening and closing, and Ca2+ translocation [Citation14,Citation15]. The Ca2+-permeating role of TMBIM6 lowers the steady-state [Ca2+]ER. Recent findings indicated that TMBIM6 interacts with ITPR [Citation16], which may regulate steady-state [Ca2+]ER, leading to the relatively low mitochondrial calcium ([Ca2+]mito) levels and reduced mitochondrial bioenergetics, and ultimately autophagy. Independently, TMBIM6-specific regulation of a specific arm of ER stress involving ERN1/IRE-1α has also been reported in the context of secretory protein IgG and autophagy studies [Citation17,Citation18]. Although there have been a few studies on TMBIM6-associated autophagy regulation [Citation18,Citation19], the effect of TMBIM6 on ER and lysosomal Ca2+ signaling-associated autophagy has not been studied yet.
In the present study, we have investigated the role of TMBIM6 in lysosomal Ca2+ signaling and related autophagy.
Results
TMBIM6 enhances lysosomal calcium levels
To determine whether the presence of TMBIM6 regulates Ca2+ distribution, we measured Ca2+ release from the ER, mitochondria, and lysosomes. HT1080 cells were loaded with the Ca2+ probe Fura-2AM and treated with either 1 μM thapsigargin or 1 μM A23187 to release ER Ca2+ or 2 μM carbonyl cyanide 3-chlorophenylhydrazone (CCCP), a mitochondrial uncoupler. Ca2+ levels released from the ER or mitochondria were relatively low in the TMBIM6-overexpressing HT1080 cells (TMBIM6/HT1080 cells) compared with control HT1080 cells (vector cells) ( and S1A), as previously reported [Citation12,Citation20]. Interestingly, when Ca2+ was released from lysosomes with 200 μM glycyl-L-phenylalanine-beta-naphthylamide (GPN), a lysosomal Ca2+ ionophore, or with 50 nM bafilomycin A1, an inhibitor of the vacuolar-ATPase, we observed an increase in Ca2+ release from the acidic compartment in TMBIM6/HT1080 cells compared with the vector cells (). In the tmbim6−/- mouse embryonic fibroblast (MEF) cells, thapsigargin or A23187 induced a larger spike in cytoplasmic Ca2+ compared with Tmbim6+/+ MEF cells, indicating that levels of intra-ER Ca2+ were higher in the knockout (KO) than in the WT condition ( and S1B). Upon treatment with GPN, we observed that the release of lysosomal Ca2+ was relatively low in the tmbim6−/- MEF (MEF−/-) cells compared with Tmbim6+/+ MEF (MEF+/+) cells.
Figure 1. TMBIM6 enhances lysosomal calcium levels. (A-B) Vector/HT1080 and TMBIM6/HT1080 (A) or Tmbim6+/+ and tmbim6−/- MEF cells (B) were treated with the indicated agent, and Fura-2 Ca2+ imaging was performed as described in Materials and Methods. (C-D) ER Ca2+ stores were emptied with 1–5 μM thapsigargin or and 1 μM ionomycin before inducing Ca2+ release from acidic stores by GPN in vector/HT1080 and TMBIM6/HT1080 cells (C) or Tmbim6+/+ and tmbim6−/- MEF cells (D). (E-F) Fluorescence images of intralumenal Ca2+ in vector/HT1080 and TMBIM6/HT1080 cells. Representative images were showing the cells loaded with low-affinity Rhod-dextran (LA-RhodDx, E) and OG-BAPTA-dextran (F). Scale bar: 15 µm. (G) Time-lapse images of GPN-treated GCaMP3-ML1-expressing vector/HT1080 and TMBIM6/HT1080 cells during the indicated time periods. The GPN responses were quantified (bottom). Representative fluorescence image of GCaMP3-ML1-expressing (green) and LysoTracker-loaded (red) vector/HT1080 and TMBIM6/HT1080 cells (up, right). The data are represented as mean ± SEM from n = 3 independent experiments
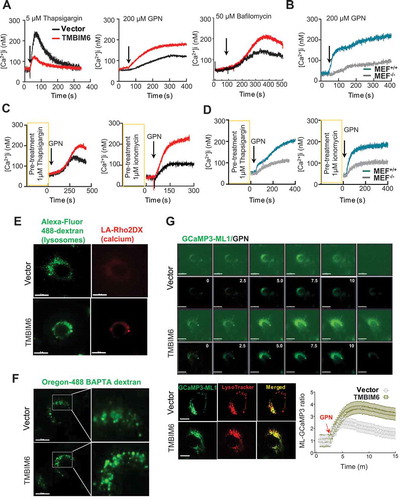
To rule out ER involvement during Ca2+ measurement from the acidic compartment, we pretreated cells with either thapsigargin or ionomycin followed by GPN to induce Ca2+ release from the acidic compartment alone. Remarkably, GPN significantly increased cytosolic Ca2+ due to lysosomal Ca2+ release from TMBIM6/HT1080 cells and MEF+/+ cells compared with the control cells (), indicating that lysosomal Ca2+ is highly maintained in the presence of TMBIM6. Consistently, we observed a high lysosomal Ca2+ release in the presence of TMBIM6 using Oregon-488 BAPTA AM (Fig. S1 C and Video S1).
To measure Ca2+ directly in the acidic compartment lumen, we used an intralumenal Ca2+ indicator, namely low-affinity Rhod-dextran (LA-RhoDx), to label lysosomal calcium and FITC-dextran, as a lysosome marker [Citation21]. The fluorescence intensity of Rhod-dextran in the acidic compartments of TMBIM6/HT1080 cells was relatively high compared with that in the vector cells (). Similarly, using Oregon-488-BAPTA-dextran, another lysosome lumenal calcium indicator [Citation22], we found that lysosomal Ca2+ was highly maintained in TMBIM6/HT1080 cells compared with control cells (). The signal intensities of Rhod-dextran and Oregon-dextran were decreased upon the addition of GPN and bafilomycin (Fig. S1D and Video S2), suggesting that these dyes are indeed specific intralumenal Ca2+ dyes. Moreover, GCaMP3-ML1, a single-wavelength genetically-encoded Ca2+ indicator [Citation23], was tagged to the cytoplasmic amino terminus of MCOLN1/TRPML1, and we analyzed real-time the GCaMP3 green fluorescence in the presence of GPN. Under the Ca2+-free external solution, the GCaMP3 green fluorescence overlapping with the red LysoTracker fluorescence (, bottom), showed a high spike pattern of lysosomal Ca2+ release in TMBIM6-overexpressing cells compared with that in vector cells (, bottom and right, S1E and F, Video S3). These data consistently indicated that TMBIM6 enhances lysosomal Ca2+ concentration even under non-stressed conditions, and suggests that maintenance of lysosomal Ca2+ might be one of the basic functions of TMBIM6.
TMBIM6-associated ER Ca2+ release enhances lysosomal Ca2+ level
TMBIM6 is reported to be an integral protein in the ER membrane [Citation12,Citation13]. Considering that TMBIM6 affected lysosomal Ca2+, we sought to clarify whether TMBIM6 localizes to the lysosome, as well as ER. Therefore, we first performed sucrose gradient centrifugation for the preparation of detergent-resistant membrane (DRM, or lipid raft) fraction of late endosomes/lysosomes [Citation24]. TMBIM6 was only detected in the ER, i.e., in the non-DRM fraction, and not in the endosome/DRM fraction (Fig. S2A). Consistently, TMBIM6 was colocalized with CANX/calnexin, an ER marker, but not with LAMP1, a lysosome marker, in immunofluorescence assay (Fig. S2B), suggesting that ER-localized TMBIM6 regulates lysosomal Ca2+ levels.
Recent studies demonstrate that the ER is important for the maintenance of lysosomal Ca2+ stores [Citation10,Citation25]. Since TMBIM6 is a Ca2+ channel-like protein in the ER, we confirmed the involvement of ITPR through available RNA interference (RNAi). First, we identified ER Ca2+ status using an ER lumen Ca2+ indicator, calcium-measuring organelle-entrapped protein indicator 1 (G-CEPIAer) [Citation26]. Expectedly, the intensities of fluorescence in cells depleted of either TMBIM6 or ITPR1 were increased compared with control cells. Interestingly, the fluorescence in the TMBIM6-ITPR1-double depleted cells was significantly higher than that in the single gene-depleted cells (Fig. S2 C). The expression of the three ITPR isoforms – ITPR1, ITPR2, and ITPR3 – with the same role as endogenous Ca2+ channels, showed distinct tissue distribution, viz. ITPR1 in the brain and atrium of heart, ITPR2 in liver and muscle, and ITPR3 in minor tissues, i.e., salivary gland [Citation27–29]. ITPR1 was expressed predominantly, but the other ITPRs such as ITPR2 or ITPR3 were not detectable in the HT1080 cells (Fig. S2D-F). Next, in the siRNA-transfected cells, we analyzed lysosomal Ca2+ levels using Oregon-488-BAPTA-dextran. The intensity of fluorescence was significantly diminished in the TMBIM6 or ITPR1-depleted cells, compared with the scrambled siRNA- or non-transfected control cells (). Consistently, the intensities of the fluorescence in the TMBIM6/ITPR1-double depleted cells were significantly declined compared with that in single gene-depleted cells. Lysosomal Ca2+ state, as examined by GPN, was also relatively less in TMBIM6 or ITPR1-depleted cells compared with control cells, and significantly lesser in the TMBIM6 ITPR1 double-depleted cells than those in the single gene-depleted cells ( and S2 G). Together, these data suggest that the ITPR1 and TMBIM6 have independent roles in regulating Ca2+ efflux from the ER and its transfer between the juxtaposed organelles.
Figure 2. TMBIM6 regulates the lysosomal calcium level. (A) Fluorescence images of intralumenal Ca2+ in HT1080 cells loaded with OG-BAPTA-dextran using siRNA of TMBIM6 (TMBIM6 RNAi) or ITPR (ITPR RNAi). Scale bar: 15 µm. The right graph represents the fold of fluorescence intensity under indicated siRNA transfection compared with cells transfected with scrambled siRNA oligonucleotides. (B) qPCR analysis of TMBIM6 and ITPR (bottom) was performed to confirm the efficacy of siRNA-mediated silencing. (C) Fura-2 AM was loaded in HT1080 cells with TMBIM6 and ITPR RNAi, treated with GPN (200 μM), and then the difference between the peak value upon the treatment and the resting value before treatment was analyzed. (D) In HT1080 cells, stably expressing GCaMP3-ML1 with TMBIM6 or ITPR RNAi, the ML1 channel agonist ML-SA1 (25 μM) was added in a Ca2+-free external solution for increasing GCaMP3 fluorescence (F470). Note that we typically set F0 based on the value that is closest to the baseline (up to 10 min). (E) Proximity ligation assay (PLA) between ZFYVE27/protrudin (ER membrane) and RAB7A/RAB7 (endolysosome) in cells overexpressing TMBIM6 and vector cells. Scale bar: 15 µm. The data are represented as the mean ± SEM from n = 3 independent experiments. Asterisks indicate significant differences from the scramble. Hash indicates significant differences between double depleted and other cells. (A, C, D) One-way ANOVA
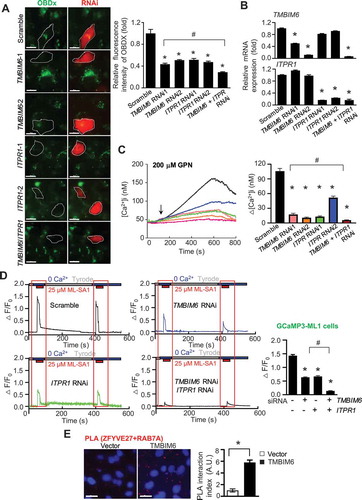
In HT1080 cells stably expressing GCaMP3-ML1 (HT1080-GCaMP3-ML1 cells) transfected with TMBIM6 or ITPR RNAi, we measured lysosomal Ca2+ release by bath application of ML-SA1 in Ca2+-free external solution. After an initial release of Ca2+, a time interval was required to restore the lysosomal Ca2+ effectively. The first and second ML-SA1 responses were decreased in the TMBIM6- or ITPR1-depleted cells than those in the control cells (). Further, the lysosomal Ca2+ release was significantly highly reduced in TMBIM6-ITPR1-double depleted cells compared with that observed in the single gene-depleted cells. Consistently, the response of ML-SA1 was significantly higher in TMBIM6 overexpressing ITPR triple knockout (TKO) DT40 cells than in neomycin-resistant vector-transfected ITPR TKO cells (Fig. S2 H). In TMBIM6 KO cells through RNAi approach, the response of ML-SA1 was markedly low compared with scrambled RNAi transfected cells (Fig. S2I). These observations further suggested that TMBIM6 regulates lysosomal Ca2+ stores independently of ITPR.
To investigate how TMBIM6 positively regulates lysosomal Ca2+, we tested whether TMBIM6 affects ER-endolysosome contact sites through an in situ proximity ligation assay (PLA). We seeded cells onto glass slides and treated them with mouse anti-ZFYVE27/protrudin (ER membrane resident) and rabbit anti-RAB7A/RAB7 (late endosome resident). Each red dot indicated close contact between the ER and the lysosome. We counted the number of red dots and divided it by the number of nuclei to calculate the PLA interaction index. TMBIM6 overexpressing cells showed a drastic increase in the number of interactions between ER and lysosomes (), indicating a physical association between the ER and lysosome for the transfer of Ca2+ between the ER and lysosome. In addition, electron microscopy confirmed that the ER-endolysosome contact sites were increased in TMBIM6 overexpressing cells compared with vector cells (Fig. S3A).
To assess whether TMBIM6 is part of the contact sites or not, we accomplished PLA in TMBIM6-GFP transiently- or stable TMBIM6-HA-overexpressing HT1080 cells. We found TMBIM6-GFP signal close to ER-lysosome contact sites, identified as a red dot of RAB7A and ZFYVE27 (Fig. S3B). We obtained similar data by PLA using the exogenous overexpressed TMBIM6-HA and endogenous LAMP1 proteins (Fig. S3 C). These results suggest that TMBIM6 is present at the ER-lysosome contact sites and play a role in transferring Ca2+ to the lysosome.
To examine whether TMBIM6-mediated ER-releasable Ca2+ affects the ER-lysosome contact sites, we performed PLA in cells expressing TMBIM6-HA WT or TMBIM6D213A, a recently reported Ca2+ channel mutant [Citation13]. In PLA assay, ER-lysosome contact sites that were increased in TMBIM6 WT cells were diminished in TMBIM6D213A cells and in BAPTA-AM-treated cells (Fig. S3D). We next identified ER-lysosome contact sites using PLA assay in the ITPR TKO DT40 cells due to the involvement of ITPR as Ca2+ channels. The PLA interaction index was similar between DT40 and the TKO DT40 cells, similar to a previous report [Citation30], but decreased in TMBIM6-depleted cells compared with the counter scramble cells (Fig. S3E). The TMBIM6 mRNA expression was significantly inhibited in the presence of TMBIM6 RNAi (Fig. S3 F). These results indicate that the releasable Ca2+ mediated by TMBIM6 may affect ER-endolysosome contact sites.
TMBIM6 has ER Ca2+ leak characteristics in which ITPR is at least partially involved
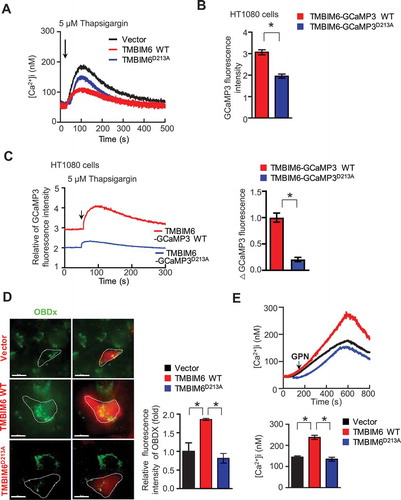
In order to confirm whether the enhanced lysosomal Ca2+ is related to the reported TMBIM6-associated phenotypes, particularly the interaction between TMBIM6 and ITPR1 [Citation16], we examined the interaction in cells expressing either TMBIM6-HA WT or TMBIM6D213A. First, we compared the intra-ER Ca2+ state in empty vector- (control), TMBIM6-, and TMBIM6D213A-transfected cells. With Fura-2AM and G-CEPIAer indicator assays, ER Ca2+ concentration was found to be comparably lower in TMBIM6-expressing cells than in TMBIM6D213A-expressing or control cells ( and S4A). Using an immunoprecipitation assay, we confirmed the interaction of ITPR1 with TMBIM6, with no obvious differences in the two kinds of TMBIM6 expressing cells (Fig. S4B), suggesting that TMBIM6-associated Ca2+ leak might be independent of its interaction with ITPR. To further confirm this, we directly measured the Ca2+ released specifically through TMBIM6 by constructing TMBIM6 with GCaMP3, a single-wavelength genetically-encoded Ca2+ indicator, at the cytoplasmic C-terminus of TMBIM6. This allowed us to specifically detect the Ca2+ leaked from the ER through the TMBIM6 pore upon binding of Ca2+ in the cytosol (Fig. S4 C). First, we transfected TMBIM6-GCaMP3 into HT1080 cells and was compared with G-CEPIAer-overexpressing cells, in which ER lumenal Ca2+ was detected through green fluorescence [Citation26]. Although the G-CEPIAer was highly expressed, and the green fluorescence of TMBIM6-GCaMP3 was comparatively low, both fluorescence signals co-localized with mCherry-ER (Fig. S4D). We, then, compared the basal intensities of GCaMP3 fluorescence in TMBIM6-GCaMP3 WT and TMBIM6-GCaMP3D213A-transfected cells. The GCaMP3 fluorescence was relatively lower in TMBIM6-GCaMP3D213A-transfected cells than in TMBIM6-GCaMP3 WT cells ( and S4E, F). Furthermore, the wild type cells expressing TMBIM6-GCaMP3, which detects leaky Ca2+ from ER through TMBIM6, were highly responsive to thapsigargin compared with the mutant cells ( and S4 G). Upon pretreatment with U73122, a PLC inhibitor that blocks the constitutive production of IP3, the GCaMP3 fluorescence was not significantly changed in either thapsigargin-treated WT or mutant cells (Fig. S4 H), suggesting that ITPR-independent Ca2+ release is observed in TMBIM6 expressing cells. Consistently, in Oregon-488-BAPTA-dextran-loading condition or GPN treatment, lysosomal Ca2+ was relatively lower in TMBIM6D213A-expressing cells compared with TMBIM6-expressing cells ()), further suggesting that TMBIM6-mediated ER Ca2+ leak is important for maintaining high lysosomal Ca2+ levels.
Figure 3. TMBIM6 functions as a calcium-permeating channel. (A) Intracellular Ca2+ was recorded in Fura-2AM-loaded empty, TMBIM6 WT, or TMBIM6D213A HT1080 cells. (B) The intensities of fluorescence measured in TMBIM6-GCaMP3 WT- and TMBIM6-GCaPM3D213A-overexpressing HT1080 cells (F470). (C) Thapsigargin (5 μM) in a Ca2+-free external solution was applied to TMBIM6-GCaMP3 WT- and TMBIM6-GCaPM3D213A-overexpressing HT1080 cells. (D) Fluorescence images of intralumenal Ca2+ in empty vector-, TMBIM6 WT-, and TMBIM6D213A HT1080 cells loaded with OG-BAPTA-dextran. Scale bar: 15 µm. The data are represented as mean ± SEM from n = 3 independent experiments (right). (E) Intracellular Ca2+ was recorded in Fura-2AM-loaded empty vector, TMBIM6 WT, or TMBIM6D213A HT1080 cells induced by GPN. The data are represented as mean ± SEM from n = 3 independent experiments (right)
TMBIM6 enhances lysosomal Ca2+ release in stress conditions
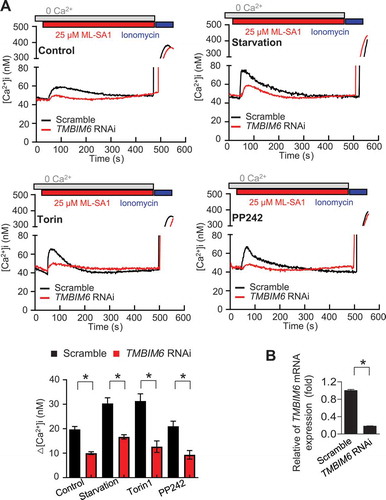
Based on the above observations, we next examined the relation of TMBIM6-associated lysosomal Ca2+ with autophagy. We first identified whether autophagy-inducing conditions, such as amino acid or serum starvation and inhibition of MTORC1 with PP242 or torin1, can induce lysosomal calcium release. We analyzed real-time GCaMP3 green fluorescence in GCaMP3-ML1-overexpressing cells, which showed a spike pattern of lysosomal Ca2+ release cells (Fig. S5A, B, and Video S4). ML-SA1-induced Ca2+ spike was significantly higher in the vehicle (control), starved, or torin1 or PP242-exposed TMBIM6-overexpressing cells than that in the counter vector cells (Fig. S5 C and D). Moreover, under stress, ML-SA1-induced spike in Ca2+ concentration was relatively low in the TMBIM6 siRNA-transfected cells compared to the scrambled siRNA-transfected cells (). The successful depletion of TMBIM6 expression in the TMBIM6-siRNA-transfected cells compared with that in the control cells is shown in . This result indicated that irrespective of stress, the lysosomal Ca2+ levels were maintained relatively high in the TMBIM6-expressing cells compared with that in the vector cells. Together, our observations suggest an increased TRPML1-mediated Ca2+ release from lysosomes in the presence of TMBIM6.
Figure 4. TMBIM6 increases lysosomal calcium release through MCOLN1 under stress conditions. (A) Fura-2AM-loaded GCaMP3-ML1 cells transfected with TMBIM6 RNAi were treated with ML-SA1 (25 μM) in a Ca2+-free external solution under starvation or torin or PP242 treatment for 1 h. Ca2+ concentrations are based on the calibration of the Fura-2 signal. The bar graph shows the difference between the peak value upon the addition of agonist and the resting value before the addition of agonist. The data are the means ± SEM from n = 3 independent experiments (bottom). (B) qPCR analysis of TMBIM6 was performed to confirm the efficacy of siRNA-mediated silencing
TMBIM6 enhances TFEB nuclear translocation through the activation of calcineurin
Recent studies demonstrated that lysosomal Ca2+ release via MCOLN1 activates calcineurin, which physically associates with and de-phosphorylates TFEB, thus promoting its nuclear translocation to activate transcription of target genes [Citation2,Citation31]. Therefore, it is necessary to confirm whether TMBIM6 affects the interaction between calcineurin and TFEB. In situ PLA analysis demonstrated increased interactions between TFEB and calcineurin (indicated by fluorescence dots) in TMBIM6 cells compared with that in the vector and TMBIM6 D213A/HT1080 cells (). In order to examine whether TMBIM6 is involved in TFEB nuclear translocation, endogenous TFEB expression was confirmed under starved conditions or in the presence of the MTORC1 inhibitors, torin1 and PP242. In the TMBIM6 cells, TFEB nuclear localization was highly increased in the starved and torin1 or PP242-treated conditions compared with that in the corresponding vector and TMBIM6D213A/HT1080 cells (). Another transcription factor for lysosome biogenesis, TFE3, was also highly activated in starvation, torin1, or pp242-exposed TMBIM6, not the D213A mutant-expressing cells (Fig. S6A).
Figure 5. TMBIM6 enhances TFEB nuclear localization independent of MTORC1 activity. (A) Proximity ligation assay (PLA) between TFEB and PPP3CA (red dots) in TMBIM6- or TMBIM6D213A expressing HT1080 cells and vector cells under starvation or torin or PP242-treatment. Scale bar: 15 µm. The data are represented as mean ± SEM from n = 3 independent experiments (right). (B) Fluorescence images of endogenous TFEB after 3 h of starvation or torin or PP242-treatment TFEB nuclear translocation. Scale bar: 15 µm. The data are represented as the mean ± SEM from n = 3 independent experiments. (C) Fluorescence images of endogenous TFEB in siRNA of TMBIM6 and MCOLN1-pretreated cells under starvation or torin or PP242-treatment after 3 h. Scale bar: 15 µm. (D) qPCR analysis of TMBIM6 and MCOLN1 was performed to confirm the efficacy of siRNA-mediated silencing. Asterisks indicate significant differences from vector or scramble siRNA treatments. The hash indicates significant differences between TMBIM6 and TMBIM6D213A
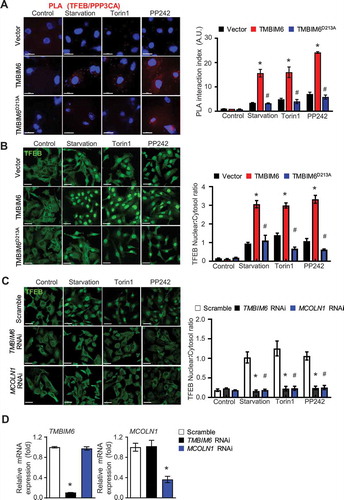
Since calcineurin activation is related to the cytosolic Ca2+ environment [Citation32], BAPTA-AM was applied to the starved and torin1- or PP242-treated conditions. As expected, TFEB activation was abrogated in the presence of the Ca2+ chelator, with no difference between vector and TMBIM6 cells (Fig. S6B). Consistently, the activation of TFE3 was also controlled in the presence of BAPTA-AM (Fig. S6 C). Further, through time kinetics microscopy analysis, we found that Torin1-mediated TFEB nuclear localization in TMBIM6/HT1080 cells occurred faster than in the control cells (Fig. S7A). Next, we examined endogenous TFEB translocation through subcellular fractionation. Consistently, TFEB was more translocated into the nucleus in starvation-exposed, and PP242-, or torin1-treated TMBIM6/HT1080 cells than in the corresponding vector/HT1080 cells (Fig. S7B). In the stress-exposed TMBIM6-depleted condition, the cytoplasm-to-nucleus transfer pattern was clearly inhibited, which was similar to the MCOLN1-depleted pattern (). The successful depletion of TMBIM6 or MCOLN1 is shown in . Consistently, the knockdown condition of TMBIM6 or MCOLIN1 significantly inhibited the nuclear translocation of TFE3 in the MTORC1-associated conditions (Fig. S7 C).
We confirmed intra-ER Ca2+ in vector and TMBIM6/HT1080 cells to uncover the specific pathway involved in TFEB activation. However, the ER Ca2+ content was not significantly affected even under starvation or MTOR inhibition, as indicated by the measured ER lumen Ca2+ using G-CEPIAer (Fig. S8A). Since reactive oxygen species (ROS) can trigger calcineurin-dependent TFEB-nuclear translocation through activation of lysosomal MCOLN1 channels [Citation33], we also examined whether ROS is increased in the above-mentioned stress condition, starvation or MTOR inhibition. Although we found intracellular ROS levels to be significantly stimulated in 1 h of starvation, the ROS levels were similar between TMBIM6 and vector cells (Fig. S8B), suggesting that TMBIM6-associated TFEB activation is independent of intra-ER Ca2+ and ROS.
Transcription levels of TFEB target genes were significantly increased in the treated TMBIM6/HT1080 cells compared with that in the treated vector/HT1080 cells (Fig. S8 C). We also compared TFEB mRNA levels in tmbim6−/- liver, kidney, and MEF cells. As expected, the enhanced expression of TFEB after starvation or PP242 treatment was lower in MEF−/- and tmbim6−/- conditions (Fig. S8D and E). The expression of TFEB-target genes was less increased in the kidney and liver from nutrient-starved tmbim6−/- mice compared with the control Tmbim6+/+mice (Fig. S8 F).
To confirm the association of TFEB with MTORC1 inhibition, we confirmed the MTORC1 status through the MTOR-mediated phosphorylation of RPS6 KB1/P70S6 kinase, RPS6/S6, and ULK1. Starvation, PP242- and torin1-treatment showed complete inhibition of MTORC1 (Fig. S8 G), and there was no obvious difference between vector and TMBIM6/HT1080 cells, suggesting that TMBIM6-associated TFEB activation is not related to the status of MTORC1.
TMBIM6 enhances autophagy
In starvation-exposed torin1 or PP242-treated condition, the LysoTracker fluorescence that labels acidic organelles in live cells was highly induced in TMBIM6/HT1080 cells compared with that in control and TMBIM6D213A cells (). The effect of stress conditions on autophagy was also quantified using Cyto-ID autophagy detection reagents, which specifically labels autophagosomes [Citation34]. As shown in , Cyto-ID fluorescence was more highly increased in TMBIM6/HT1080 cells than in control and TMBIM6 D213A/HT1080 cells (). In addition, we examined two autophagy marker proteins, LC3 and SQSTM1/p62, in the starvation-exposed or torin1 or PP242-treated cells. The conversion of cytosolic LC3-I to the autophagosome-specific isoform LC3-II was significantly higher in the treated TMBIM6-expressing cells compared with that in the vector and TMBIM6D213A cells/HT1080 cells (). SQSTM1 degradation was also highly enhanced in the treated TMBIM6/HT1080 cells than in vector and TMBIM6D213A cells.
Figure 6. TMBIM6 enhances autophagy flux. (A) Lysosomal staining was performed with 100 nM LysoTracker for 30 min. Vector, TMBIM6, and TMBIM6D213A/HT1080 cells were starved or treated with torin1 or PP242 for 3 h. The data are represented as the mean ± SEM from n = 3 independent experiments (bottom). Scale bar, 25 µm. (B) Autophagic flux was determined using cyto-ID under microplate reader. (C) Immunoblotting of cell lysates against LC3B and SQSTM1 was performed and quantified (bottom). N, vector; B, TMBIM6; M, TMBIM6D213A. (D) RFP-GFP-LC3 puncta formation was analyzed in vector, TMBIM6, and TMBIM6D213A/HT1080 cells under starvation or torin or PP242-treatment for 3 h. The yellow puncta (autophagosome) and red puncta (autolysosome) formation were quantified (bottom). Scale bar: 15 μm. The data are represented as the mean ± SEM from n = 3 independent experiments. Asterisks indicate significant differences from the vector treatment. Hash indicates significant differences between TMBIM6 and TMBIM6D213A
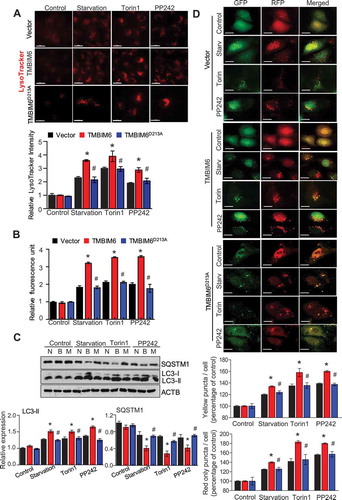
To confirm autophagosome and autolysosome formation, we performed tandem RFP-GFP-LC3 fluorescence analysis [Citation35,Citation36]. In this assay, RFP fluorescence is more stable in acidic compartments, whereas GFP fluorescence is rapidly quenched; thus, autophagosomes show yellow (RFP and GFP) puncta, while autolysosomes exhibit only red (RFP) puncta. In tandem RFP-GFP-LC3-transfected TMBIM6/HT1080 and MEF+/+ cells, starvation, torin1, or PP242 induced more accumulation of yellow and red puncta compared with that in the corresponding control cells ( and S9A). In the presence of bafilomycin A, which blocks autophagosome fusion with lysosomes, the RFP and GFP puncta were co-localized, more significantly showing yellow puncta in the tandem RFP-GFP-LC3-transfected TMBIM6/HT1080 and MEF+/+ cells than in the corresponding control cells (Fig. S9A and B). LysoTracker fluorescence was abrogated in all the bafilomycin A1-treated conditions (Fig. S9 C). Together, these results suggest that TMBIM6 enhances the autophagic flux in starvation-exposed or MTORC1-inhibited conditions. We also examined the presence of autophagic vacuoles (AVs), which generally refer to autophagosomes and autolysosomes [Citation37]. In electron microscopy, a larger number of AVs could be identified as membrane-bound vesicles containing cytoplasmic material or organelles under starvation conditions in TMBIM6-overexpressing cells and MEF+/+ cells than in the starved counter cells (Fig. S10A and B).
To extend our in vitro observations to an in vivo system, we established conditions of autophagy in Tmbim6+/+ mouse tissues. Nutrient starvation significantly increased LC3-II expression in the liver and kidney during the 24-h treatment period (Fig. S10 C). To compare endogenous GFP-LC3-II puncta in Tmbim6+/+ mice and tmbim6−/- mice, we crossed tmbim6−/- mice and GFP-LC3 mice. Tmbim6+/+ GFP-LC3 mice showed a drastically increased number of GFP-LC3-II puncta in kidney and liver tissues compared with that in the tmbim6−/- GFP-LC3 mice (). We also compared the expression of SQSTM1 proteins in the tissues of Tmbim6+/+ and tmbim6−/- mice exposed to starvation. Under the starvation condition, protein expression of SQSTM1 was reduced in Tmbim6+/+ compared with that in the tmbim6−/- mice tissues (), suggesting that TMBIM6 enhances autophagic flux in vivo, consistent with in vitro analysis.
Figure 7. TMBIM6 increases autophagy flux under starvation conditions in vivo. (A-B) GFP-LC3 puncta formation was analyzed in the liver or kidney (A) of nutrient-starved GFP-LC3/Tmbim6+/+ and GFP-LC3/tmbim6−/- mice after 24 h (n = 5). GFP-LC3 puncta formation was quantified (B). Scale bar: 100 μm. The data are represented as the mean ± SEM from n = 5 per group. (C-D) Immunohistochemistry analysis of SQSTM1 was performed in the kidney and liver from control and 24-h starved Tmbim6+/+ and tmbim6−/- mice (C). The SQSTM1 expression levels were quantified (D). Scale bar: 100 μm. The data are represented as the mean ± SEM from n = 5 per group. (E) HT1080 cells were transfected with or without TMBIM6 or ITPR siRNA together with EGFP-HTTQ74 for 24 h. The percentage of cells with EGFP-positive aggregates is shown. Scale bar: 25 µm. (F) EGFP-HTTQ74 clearance was analyzed in transfected HT1080 cells vector, TMBIM6, and TMBIM6D213A cells. Scale bar: 25 µm. The data are represented as the mean ± SEM from n = 3 independent experiments
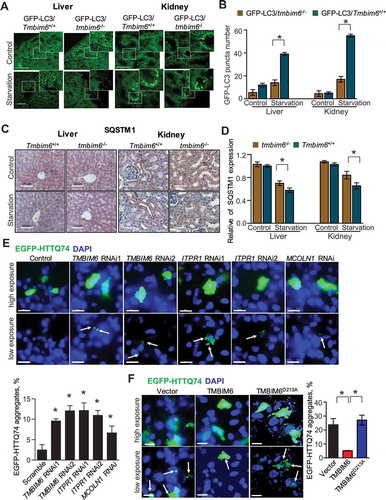
In order to test the physiological and clinical relevance, we investigated the effect of TMBIM6 overexpression and knockdown on the autophagic flux using autophagic substrate polyglutamine-expanded mutant forms of HTT (huntingtin; eGFPHTTQ74), whose clearance is highly dependent on autophagy [Citation38]. The eGFP fluorescence, indicating the accumulation of eGFPHTTQ74, was increased in TMBIM6 knockdown cells and decreased in TMBIM6-overexpressing cells compared with that in the control and TMBIM6D213A cells (). These results suggest that TMBIM6-associated autophagy may have protective effects against pathological diseases, specifically neurodegenerative diseases such as Huntington disease.
Discussion
In this study, we uncovered an ER-localized TMBIM6-mediated Ca2+ signaling pathway between the ER and the lysosome that regulates autophagy through Ca2+-dependent calcineurin-mediated TFEB nuclear translocation. Notably, we observed a high concentration of TMBIM6-associated lysosomal Ca2+ and the related lysosomal biogenesis transcription factor TFEB and conditions of nutrient starvation or treatment with MTORC1 inhibitor, torin1 or PP242 highly induced its downstream autophagy-related genes. These results indicate that the presence of TMBIM6 increases autophagosome and autolysosome formation, enhancing autophagy flux. Collectively, our results showed that TMBIM6-associated Ca2+ leak controls lysosomal Ca2+ physiology, where the calcineurin and TFEB activation contribute to the enhanced autophagy mechanism in TMBIM6-expressing conditions.
Intracellular Ca2+ signaling is an important mechanism regulating autophagy flux. TMBIM6, a recently identified Ca2+ channel protein or channel-like protein [Citation20,Citation39], contributes to lysosomal Ca2+ linked to autophagy flux. The traditionally established ER-Ca2+ channel, ITPR-mediated Ca2+ signaling, was shown to inhibit or stimulate autophagy, although this is still debatable [Citation40]. TMBIM6 mediates Ca2+ flux across ER membranes through ITPR and plays a critical role in Ca2+ signaling [Citation15]. In this study, in both TMBIM6- and ITPR-depleted cells, resting lysosomal Ca2+ concentration and the response to ML-SA1, a TRPML lysosomal channel agonist, were significantly decreased compared with that in control cells (). In addition, the resting lysosomal Ca2+ concentration in these cells was significantly decreased to almost an undetectable level, suggesting that an ITPR-independent role of TMBIM6 might contribute to lysosomal Ca2+ status, although the involvement of ITPR in TMBIM6-associated lysosomal Ca2+ concentration regulation cannot be ruled out. The recently reported TMBIM6 Ca2+ pore sequence mutant D213A [Citation13], which inhibits Ca2+ leakage through TMBIM6, also showed regulation of lysosomal Ca2+ (.E). Consistently, the response to ML-SA1 was significantly increased in the presence of TMBIM6 in ITPR TKO cells (Fig. S2 H), indicating that the endogenous TMBIM6 characteristics, such as ITPR-independent Ca2+ channel or Ca2+ channel-like effect, contributes to the lysosomal Ca2+ status.
In the presence of TMBIM6, the ER to lysosome Ca2+ transfer is associated with membrane contact between subcellular organelles. We addressed the following issue – “Does TMBIM6-specific leaky Ca2+ or general ER Ca2+ release contribute to ER-lysosome membrane contact?” to clarify the essential role of TMBIM6 in the physical contact between the two organelles. Interestingly, we observed close contact between ER and lysosome clearly in the TKO DT40 cells, suggesting that even in the absence of ITPR-associated local Ca2+, the ER-lysosome contact is maintained stably (Fig. S3E) [Citation30]. In contrast, BAPTA-AM treatment of TMBIM6-overexpressing cells resulted in a significantly decreased number of ER-lysosome contact sites and the D213A mutant showed the inhibition pattern of the contact sites in PLA analysis (Fig. S3D), suggesting that TMBIM6-specific leaky Ca2+, but not general ER leaky Ca2+, contribute to the ER-lysosome contact sites. The contacts between ER and mitochondria also increased in the TMBIM6-expressing cells (data not shown). The close physical contact between ER and the other organelles, including mitochondria or lysosome, might be due to the specific binding of TMBIM6 with ACTB/β-actin which controls the movement of subcellular organelles [Citation41–43]. In our previous study, ACTB polymerization was increased through the interaction with TMBIM6 [Citation44].
In this study, the lysosomal Ca2+ was highly maintained in the TMBIM6-expressing cells, while the mitochondrial Ca2+ showed relatively low Ca2+ concentration compared with that in the control cells. It has been reported that ER stress increased mitochondrial Ca2+ to a lesser extent in TMBIM6–overexpressing cells than in control cells, most likely as a result of lower basal levels of intra-ER Ca2+ and the impaired mitochondrial Ca2+ intake ability, which involves mitochondrial Ca2+-dependent K+ channel opening, a unique mitochondria cation maintenance characteristic [Citation19,Citation45]. This observation indicates a possible mechanism through which mitochondrial Ca2+ intake is reduced, leading to a low level of mitochondria Ca2+ in the TMBIM6-expressing cells.
TMBIM6 consistently showed enhanced autophagy flux in vitro and in vivo, probably linked to the highly maintained lysosomal Ca2+ levels. There have been inconsistent data on TMBIM6-induced autophagy [Citation18,Citation19,Citation46,Citation47]. The interaction of TMBIM6 with ERN1 and its role in autophagy is controversial. However, the unique role of TMBIM6-mediated Ca2+ channel or channel-like effect [Citation13,Citation20] has been reported in autophagy [Citation19,Citation47]. Consistently, the TMBIM6-specific ER leaky Ca2+ is suggested to contribute to lysosome Ca2+, its lysosomal activity, and the resultant autophagy. Lysosomal enzyme activities, including that of lysosomal V-ATPase, were also highly increased in the presence of TMBIM6 [Citation48]. In the case of mitochondria, the ER Ca2+-associated regulation of mitochondrial Ca2+ leading to low mitochondria ATP and high AMPK activity has been suggested as a parallel mechanism to explain BI-1 enhanced autophagy [Citation19,Citation49]. Compared with mitochondria, the lysosome has a high Ca2+ reserving capacity and also considered as another Ca2+ store in addition to ER [Citation50]. This study was set up under the specific metabolic state of MTORC1 inhibition to focus on the lysosome status. Starvation or MTOR inhibition triggers local Ca2+ signals by the lysosome, rather than global calcium changes by ER [Citation2,Citation10]. Notably, torin1 or PP242 treatment did not affect ER Ca2+ content [Citation51]. Lysosomal MCOLN1 channels are potently upregulated by nutrient starvation or torin1 [Citation11]. Under starvation or MTOR inhibition, Ca2+ was increasingly released via MCOLN1 channels in TMBIM6 overexpressing cells, which activated calcineurin, leading to dephosphorylation of TFEB and subsequent promotion of autophagy (). Since we completely blocked MTORC1 activity throughout this study (Fig. S8), the lysosome biogenesis transcription factor, TFEB, which is downstream signaling under MTORC1 inhibition [Citation52], is proposed to be independent of MTOR activity in this study. TFEB-related genes were also enhanced under these stimuli, especially in the presence of TMBIM6. Together, we propose that the ER protein, TMBIM6 mediates continuous Ca2+ leak from ER, which affects the Ca2+ concentration and the associated physiology of the juxtaposed subcellular organelles, namely mitochondria and lysosomes, ultimately enhancing autophagy and autophagy flux.
In conclusion, TMBIM6 induces autophagy through a process that involves lysosomal Ca2+ and TFEB activation. These autophagy-enhancing characteristics might explain TMBIM6-associated anti-apoptosis, ER stress regulation, and enhanced lysosomal activity. This study contributes to the understanding of the cellular response associated with ER Ca2+ leak and its clinical relevance in diseases such as neurodegenerative diseases.
Materials and methods
Reagents
In this study, we used the following chemicals from Sigma-Aldrich (St Louis, MO): PP242 (P0037), EBSS (Earle’s Balanced Salt Solution; E2888), thapsigargin (T9033), bafilomycin A1 (B1793), A23187 (C7522), ionomycin (I0634), glycyl-L-phenylalanine2-naphthylamide (GPN, G9512), ML-SA1 (SML0627), and carbonyl cyanide 3-chlorophenylhydrazone (CCCP, C2759). LysoTracker (L7528), Fura-2 acetoxymethyl ester (Fura-2 AM; F1221), BAPTA-AM (B1205), and ProLong™ Gold Antifade Mountant with DAPI (P10144) were obtained from Life Technologies. Torin1 (4247) was purchased from Tocris (Bristol, UK). Antibodies against p-RPS6 KB1/S6K (9234), RPS6KB/S6K (9202), p-RPS6/S6 (2211, 2215), p-ULK1 (6888), LAMP1 (9091), CANX (calnexin) (2679), TFEB (4240), PPP3 CA/calcineurin A (2614), SQSTM1/p62 (39749), and histone (9717) were obtained from Cell Signaling Technology. Antibodies against ACTB/actin (sc-47778), GAPDH (sc-47724), TUBA/tubulin (sc-5286), ITPR1 (sc-271197), ITPR2 (sc-398434), and ITPR3 (sc-7277) were obtained from Santa Cruz Biotechnology. Antibodies against MCOLN1/TRPML1 (ab28508) and RAB7A (ab50533) were obtained from Abcam. Antibody against HA (11867423001) was from Roche Diagnostics. Antibody against TFE3 (HPA023881) was purchased from Sigma-Aldrich. ZFYVE27 (LS-C660718) was from LS-Bio. Antibody against LC3B (NB600-1384) was from Novus.
Cell culture
For the establishment of stable cell lines of human fibrosarcoma cells (HT1080, Korean Cell Line Bank, 10121, Republic of Korea) expressing TMBIM6, cells were incubated with 8 μg/mL of polybrene (Santa Cruz Biotechnology, sc-134220) and lentiviral particles harboring each gene followed by selection with puromycin dihydrochloride (Santa Cruz Biotechnology, sc-108071) for 1 week. The fresh puromycin-containing medium was replaced every 3 to 4 d. Established HT1080 cell lines were as follows: pLenti CMV/TO puro DEST (670–1; vector HT1080 cells), pLenti CMV/TO puro DEST (670-1)-TMBIM6 (TMBIM6 HT1080 cells), and pLenti CMV/TO puro DEST (670-1)-TMBIM6-GCaMP3 (TMBIM6-GCaMP3 HT1080 cells). pLenti CMV/TO puro DEST (670–1) were obtained from Addgene (#17293). For GCaMP3-ML1-vector and TMBIM6 or G-CEPIAer stable cell lines, cells were transfected and selected with blasticidin (Gibco, A1113903) or G418 (Duchefa Biochemie, G0175) for 2 weeks, respectively. HA-TMBIM6D213A was generated using the QuikChange XL Site-Directed Mutagenesis Kit (Stratagene, 200521) according to the manufacturer’s instructions. Cells were maintained in Dulbecco’s modified Eagle’s medium (DMEM; Gibco, 11965–092) containing 10% fetal bovine serum (FBS; Gibco, 16000044), 100 U/mL penicillin, and 100 μg/mL streptomycin (Gibco, 15140122). DT40 and TKO DT40 cells were maintained in RPMI 1640 media (Gibco, 11875093) supplemented with 10% FBS, 1% chicken serum (Gibco, 16110082), 50 μM 2-mercaptoethanol (Sigma-Aldrich, M3148) 100 U/mL penicillin, and 100 μg/mL streptomycin at 39.5°C and 5% CO2. Cells were transfected using lipofectamine 3000 (Invitrogen, L3000-150) according to the manufacturer’s specifications. For nutrient starvation, the cells were incubated with EBSS (without serum) for the indicated time.
Isolation and culture of mouse embryonic fibroblast cells
Tmbim6+/+ and tmbim6−/- mouse embryonic fibroblast (MEF) cells were isolated from embryos at day 13.5 of development (E13.5), as described previously with some modifications [Citation53]. Briefly, placental membranes, amniotic sac, head, and primordial blood organs were removed. The remaining carcass was washed and minced in 3 mL phosphate-buffered saline (PBS; Gibco, 10010–023), and the fragments were trypsinized in 2 mL 0.25% trypsin for 20 min. The cell suspension was centrifuged at 1,500 × g for 5 min. The obtained cell pellet was suspended in DMEM, 10% FBS, 100 U/mL penicillin, and 100 μg/mL streptomycin and placed in a 10-cm culture dish. Each culture was derived from a single embryo. Early passage (P2-P5) MEF cells were used in all the experiments.
RNAi transfection
Cell silencing with siRNA oligonucleotides was performed using lipofectamine 3000 (Invitrogen, L3000-150) or Lipofectamine™ RNAiMAX Transfection Reagent (Invitrogen, 13778150) for 48 h according to the manufacturer’s instructions. The sequences of siRNA used were as follows: ITPR1-RNAi1, 5ʹ-GAGAAUUUCCUUGUAGACAUCUGCA-3ʹ; ITPR1-RNAi2, 5ʹ-CAGGAUAAAGAGCACACAU-3ʹ; TMBIM6-RNAi1, 5ʹ-GUGCUAUCCUACGAAAUCA-3ʹ; TMBIM6-RNAi2, 5ʹ-AAGGCACUGCAUUGAUCUCUU-3ʹ; MCOLN1-RNAi, 5ʹ-CCCACAUCCAGGAGUGUAA-3ʹ.
Calcium measurement
GCaMP3-ML-1 Ca2+ imaging
Lysosome calcium measurement was performed using methods described previously [Citation10]. Briefly, 2 × 10⁵ HT1080 cells stably expressing GCaMP3-ML1 were cultured in a 35-mm confocal dish (SPL Life Sciences, 100350). Changes in cytosolic Ca2+ levels were monitored by following changes in GCaMP3-ML1 fluorescence for 15 min upon addition of 200 μM GPN in Ca2+-free external solution containing 145 mM NaCl, 5 mM KCl, 3 mM MgCl2, 10 mM glucose, 1 mM EGTA (Sigma-Aldrich, E3889), 20 mM HEPES (Gibco, 15630080), pH 7.4, using the real-time mode of epifluorescence microscopy (Applied Precision DeltaVision Elite, Applied Precision Inc., USA). Data Inspection Program provided by the DeltaVision software was used to measure the intensity of GCaMP3-ML1 fluorescence, and the mean fluorescence intensity was monitored at 488 nm. The acquired epifluorescence images were numerically deconvolved using DeltaVision algorithms (Applied Precision Inc., USA).
Fura-2 Ca2+ imaging
HT1080 cells or Tmbim6+/+ and tmbim6−/- MEFs were cultured in 35-mm confocal dishes in a CO2 incubator at 37°C for 24 h. Cells were loaded with 5 μM Fura-2 AM in the culture medium at 37°C for 1 h. Fura-2 AM-loaded cells were washed three times with Ca2+-free external solution (145 mM NaCl, 5 mM KCl, 3 mM MgCl2, 10 mM glucose, 1 mM EGTA, 20 mM HEPES, pH 7.4) and incubated at 37°C in an imaging chamber for 10 min. Changes in cytosolic Ca2+ levels were monitored by following changes in the Fura-2 ratio (F340/F380) upon addition of 1–5 μM thapsigargin, 50 nM bafilomycin A1, and 1 μM A23187 in Ca2+-free external solution for 5 min using the real-time mode of the PTI system (PTI Delta Ram, New Brunswick, USA). Lysosomal Ca2+ release was monitored using the PTI system to follow changes in the Fura-2 ratio (F340/F380) over 5 min upon the addition of 200 μM GPN, followed by 1–5 μM thapsigargin or 1 μM ionomycin to Ca2+-free external solution. Ca2+ concentrations were calculated as described previously [Citation20]. The equation is [Ca2+]i = Kd(F380max/F380 min)(R − Rmin)/(Rmax − R); a Kd value of 229 nM was assumed for the binding of Ca2+ to Fura-2/AM. Rmax and Rmin were determined for each experimental group following consecutive addition of 30 µM Triton (Sigma-Aldrich, T8787, Rmax) and 50 mM EGTA (Rmin).
Oregon green 488 BAPTA-1 dextran (OG-BAPTA-dextran) or Rhod-dextran imaging
Lysosomes of all cells were detected by endocytosis of a calcium probe. Briefly, cells were incubated with 100 μg/mL OG-BAPTA-dextran (Thermo Fisher Scientific, O6798) or 200 μg/mL Rhod-dextran (AAT Bioquest, 20451) at 37°C in the culture medium for 4–12 h, and then pulsed/chased for additional 9–16 h with phenol red-free DMEM to allow for lysosome staining. The cells were then washed twice with phenol red-free DMEM, and fluorescence was measured using epifluorescence microscopy (Applied Precision DeltaVision Elite, Applied Precision Inc., USA). The intensity of calcium fluorescence was quantified by ImageJ software (National Institutes of Health, Bethesda, MD, USA; http://imagej.nih.gov/).
Oregon green 488 BAPTA-1 AM imaging
HT1080 cells were cultured in a 35-mm confocal disc in a CO2 incubator at 37°C for 24 h. After overnight culture, cells were loaded with OG-BAPTA-AM (Thermo Fisher Scientific, O6807) in the culture medium at 37°C for 1 h. OG-BAPTA-AM-loaded cells were washed thrice with Ca2+-free external solution and incubated at 37°C in an imaging chamber for 10 min. The release of lysosomal Ca2+ was monitored by following changes in OG-BAPTA-AM fluorescence (494 nm/523 nm) over 15 min upon the addition of 200 μM GPN using real-time mode. Ca2+ responses were recorded using a DeltaVision microscope (Applied Precision Inc., USA). Data Inspection Program provided by the DeltaVision software was used to measure the intensity of OG-BAPTA-AM fluorescence at 488 nm, and the mean fluorescence intensity was calculated. The acquired epifluorescence images were numerically deconvolved using DeltaVision algorithms.
Immunoblotting
Immunoblotting was performed, as described previously with some modifications [Citation54]. For the preparation of whole-cell lysates, cells were lysed for 30 min on ice through the addition of RIPA lysis buffer (ELPIS Biotech, EBA1149) plus protease inhibitor cocktail (Sigma, P8340) and phosphatase inhibitor cocktail (Sigma, P0044, P5726). Centrifugation was performed at 12,000 × g for 30 min at 4°C, and the supernatants were collected and used as protein extracts. Protein extracts were added to sample buffer, boiled for 5 min, and stored at – 80°C until use. Samples containing 20–40 µg of protein extract were separated on a polyacrylamide gel and transferred to a PVDF membrane (Bio-rad, 162–0177), which was blocked with 5% nonfat dry milk (Bio-rad, 170–6404) in 0.05% Tween-Tris-buffered saline (T-TBS; 20 mM Tris, 150 mM NaCl, 0.05% Tween 20 (Sigma-Aldrich, P9416), pH 7.5) for 60 min at room temperature (RT). Blots were probed overnight at 4°C with the relevant antibodies, washed, and probed again with species-specific horseradish peroxidase-conjugated secondary antibodies (Santa Cruz Biotechnology, sc-2004, sc-2005, sc-2006). Protein signals were visualized using an enhanced chemiluminescence reagent.
Electron microscopy
HT1080 cells and MEF cells were fixed using the conventional method (2% glutaraldehyde, and 2% formaldehyde in 0.05 M sodium cacodylate buffer, pH 7.2) [Citation55,Citation56]. Fixed samples were embedded in Spurr’s resin (Sigma, EM0300), and thin sections (80 nm) were cut and stained with uranyl acetate and lead citrate for observation under a transmission electron microscope (H7650, accelerating voltage 100 kV, Hitachi) at the Center for University-wide Research Facilities (Chonbuk National University, Jeonju, Korea). The numbers of lysosomes and autophagic vacuoles in cells were counted under the microscope. Autophagy was quantified from at least 10 cells in each sample and was confirmed by two additional independent experiments. The distance between ER and lysosome was measured by ImageJ software (NIH).
Animal experiments
Mice were housed in groups of 5 animals at 21 ± 1°C and 55 ± 5% humidity under a 12 h/12 h light/dark cycle. Mice were maintained in specific pathogen-free housing conditions and were cared for in accordance with the regulations of the Care and Use of Laboratory Animals guide of Chonbuk National University with approval from the Institutional Animal Care and Use Committee of Chonbuk National University laboratory animal center (CBNU 2016–51). The Tmbim6+/+ and tmbim6−/- mice used in this study have been described previously [Citation12]. The GFP-LC3 transgenic mice used in this study were obtained from the RIKEN Bioresource Center, Japan57. Tmbim6+/+ or tmbim6−/- GFP-LC3 mice were obtained by crossing tmbim6−/- mice with GFP-LC3 mice. Tmbim6+/+ or tmbim6−/- GFP-LC3 mice aged 8 to 12 weeks were used for assessment of autophagy in vivo following nutrient starvation. For the study of the effects of starvation, mice were deprived of food for 48 h. These mice had free access to drinking water. We intraperitoneally injected mice with 1 mg/mL PP242 for 24 h to study the effect of PP242.
Tissue samples for GFP observation were prepared as previously described [Citation57,Citation58]. We anesthetized mice with ketamine and immediately fixed with perfusion of PBS through the left ventricle to prevent the induction of autophagy during tissue preparation. Tissues were harvested and further fixed with 4% paraformaldehyde for 24 h, followed by treatment with 15% sucrose in PBS for 4 h and then with 30% sucrose solution overnight. Tissue samples were embedded in Tissue-Tek OCT compound (Sakura Finetechnical Co., Ltd., Japan) and stored at – 70°C. The samples were sectioned to have 5–7 μm thickness with a cryostat (CM3050 S, Leica, Deerfield, IL), air-dried for 30 min, washed in PBS, and mounted on glass slides. The number of GFP-LC3 puncta per unit area of tissue was quantified under fluorescence microscopy.
Immunohistochemistry
Immunohistochemistry was performed as described previously [Citation59,Citation60]. All major organs were removed from the mouse and fixed in 4% paraformaldehyde for 24 h. Paraffin sections (4 μm) were deparaffinized and rehydrated following standard procedures. Antigen retrieval was achieved by heating with a pressure cooker in Target Retrieval Solution, pH 6.0 (Dako, REAL™ S1699) for 3 min, followed by cooling for 20 min on ice. The sections were washed with 1X Tris-buffered Saline (Labcore, Seoul, Korea, 200219) and treated with Dako REAL™ Blocking Solution (X0909) for 10 min prior to incubation with primary antibody (SQSTM1/p62; Abcam, ab56416; 1:100 in Dako REAL™ Antibody Diluent, S3022) at 4ºC in a humidified chamber. Sections were rinsed and incubated with biotinylated secondary antibody for 30 min at RT. REAL™ AEC Substrate Solution (K3461) was used as a chromogen (incubation for <5 min), leading to a reddish-brown reaction product. The sections were rinsed in distilled water, counterstained with hematoxylin (Sigma, HHS32), rinsed in tap water, and mounted with Aqueous-Mount (AML060, ScyTek).
Immunofluorescence assays
Cells were cultured in 35-mm confocal dishes in a CO2 incubator at 37°C for 24 h, at 50% to 60% confluence. The cells were fixed for 15 min with ice-cold methanol at – 20°C, after which they three times with PBS and blocked with 0.3% Triton X-100 (Sigma, T8787), 5% normal serum (Cell Signaling Technology, 5425) in PBS for 1 h at room temperature. After aspirating the blocking buffer, the dishes were incubated with primary antibody diluted in PBS overnight at 4°C. The next day, the dishes were rinsed three times with PBS for 5 min and incubated with FITC or TRITC secondary antibodies (Jackson Laboratory, 715-095-151, 715-025-151, 711-025-152, 711-095-152) for 2 h at RT in the dark. The slides were washed four times with PBS and then mounted on glass coverslips. The samples were analyzed using the high-solution microscopy imaging system (FV1200-OSR, Olympus Corporation, Tokyo, Japan) or confocal laser scanning microscope LSM 510 META and LSM 880 (Carl Zeiss) installed in the Center for University-Wide Research Facilities (CURF) at Chonbuk National University.
RFP-GFP-LC3 plasmid transfection
Autophagy flux was analyzed using fluorescence microscopy by monitoring the distribution and alteration of RFP-GFP-LC3 fluorescent signals [Citation61]. RFP-GFP-LC3 plasmid encoding the tandem fluorescent reporter was generated in the laboratory of Dr. Tamotsu Yoshimori, Osaka University, Japan [Citation35], and obtained from Addgene (21074). Cultured HT1080 cells (vector/HT1080 and TMBIM6/HT1080) or MEF cells (Tmbim6+/+ and tmbim6−/-) seeded in cover-glass bottom dishes were transfected with RFP-GFP-LC3 plasmid using lipofectamine 3000 (Invitrogen) for 24 h. After the designated treatments, live cell images were obtained using a DeltaVision microscope imaging system (Applied Precision). For quantification of autophagic cells, GFP-LC3 and RFP-LC3 punctate dots were assessed in triplicate by counting a total of more than 30 cells [Citation36].
Lysotracker staining
Cells were cultured in 35-mm confocal dishes in a CO2 incubator at 37°C for 24 h, at 50% to 60% confluence. The cells were stained with 100 nM LysoTracker Red DND-99 (Invitrogen, L7528) for 30 min at RT. Lysosomal intensities were analyzed by fluorescence microscopy (Applied Precision).
Proximity ligation assay (PLA)
The PLA assay was performed using the Duolink in situ reagents (Sigma) according to the manufacturer’s protocol. Antibodies used in this study were from the following sources: mouse anti-TFEB antibody (MBS120432; 1:50) from MyBioSource and rabbit anti-PPP3CA/calcineurin A antibody (2614; 1:50) from Cell Signaling Technology. Immunofluorescence experiments were performed as described above. For image analyzes, cells were acquired with the same laser parameters using the same image magnification.
Autophagy flux detection
Autophagy flux was estimated using the CYTO-ID Autophagy detection kit (Enzo Life Sciences, ENZ-51031) according to the manufacturer’s protocol.
ROS measurement
For ROS detection, the ROS-ID Total ROS detection kit (Enzo Life Sciences, ENZ-51011) was used according to the manufacturer’s instructions.
Real-time PCR analysis
Total RNA was isolated from MEF cells, HT1080 cells, or liver and kidney tissues using Trizol reagent (Invitrogen, 15596–018). First-strand cDNA was synthesized with a SuperScript III first-strand synthesis system (Invitrogen, 18080–051), following the manufacturer’s instructions. The primer pairs and references used in this study are listed in Table S1. For ITPR1-3 primer pairs (P292789 V, P167323 V, P158942 V) were obtained from BIONEER (Daejeon, Korea). The real-time PCR mixture (10 μL) contained 1 μL of cDNA, appropriate primers, and 5 μL of Power SYBR green PCR master mix (Applied Biosystems, 4367659). The reaction conditions using a PE Biosystems ABI PRISM 7700 Sequence Detection System were as follows: initial denaturation at 95°C for 5 min, followed by 40 cycles at 94°C for 10 s, 51 to 55°C for 10 s, and 72°C for 30 s. The data were normalized to ACTB and GAPDH to determine relative expression levels.
Subcellular fractionation
Nuclear and cytoplasmic fractions were prepared using the NE-PER kit (Thermo Scientific, 78833) according to the manufacturer’s protocol. Lysosome isolation was performed using a lysosome isolation kit (Sigma-Aldrich, LYSISO1) according to the manufacturer’s manual.
Preparation of detergent resistant membrane (DRM)
DRM and non-DRM fractions were separated, as described previously [Citation62]. Briefly, cells contained in a 2 × 10 cm dish were lysed in 500 μL of TNE buffer (50 mM Tris–HCl, pH 7.4, 150 mM NaCl, 2 mM EDTA, phosphatase inhibitors and 500 μL of 0.25% Triton X-100) at 4°C. The homogenates were adjusted to contain 40% sucrose (Sigma, S0389) by adding 56% sucrose, after which the samples were loaded at the bottom of a centrifuge tube containing continuous sucrose gradient with 35% – 5% sucrose in TNE buffer. The lysate was separated by ultracentrifugation at 271,000 × g for 18 h at 4°C. The solutions were collected into 10 fractions and subjected to immunoblotting with indicated antibodies.
Statistical analysis
All data are presented as mean ± SEM. Student’s t-tests and one-way ANOVA with Tukey post hoc were applied to examine the statistical significance of differences between groups. Origin 8.0 software (OriginLab® Corp, USA) and GraphPad Prism 5.01 (La Jolla, CA, USA) were used for statistical calculations. A value of p < 0.05 was considered statistically significant.
Supplemental Material
Download Zip (39.6 MB)Disclosure statement
The authors declare no competing interests.
Supplementary materials
Supplementary data for this article can be accessed here.
Additional information
Funding
Related Research Data
References
- Wang W, Gao Q, Yang M, et al. Up-regulation of lysosomal TRPML1 channels is essential for lysosomal adaptation to nutrient starvation. Proc Natl Acad Sci U S A. 2015;112:E1373–81.
- Medina DL, Di Paola S, Peluso I, et al. Lysosomal calcium signalling regulates autophagy through calcineurin and TFEB. Nat Cell Biol. 2015;17:288–299.
- Sardiello M, Palmieri M, Di Ronza A, et al. A gene network regulating lysosomal biogenesis and function. Science. 2009;325:473–477.
- Settembre C, Di Malta C, Polito VA, et al. TFEB links autophagy to lysosomal biogenesis. Science. 2011;332:1429–1433.
- Ferron M, Settembre C, Shimazu J, et al. A RANKL-PKCbeta-TFEB signaling cascade is necessary for lysosomal biogenesis in osteoclasts. Genes Dev. 2013;27:955–969.
- Settembre C, Zoncu R, Medina DL, et al. A lysosome-to-nucleus signalling mechanism senses and regulates the lysosome via mTOR and TFEB. Embo J. 2012;31:1095–1108.
- Roczniak-Ferguson A, Petit CS, Froehlich F, et al. The transcription factor TFEB links mTORC1 signaling to transcriptional control of lysosome homeostasis. Sci Signal. 2012;5:ra42.
- He C, Klionsky DJ. Regulation mechanisms and signaling pathways of autophagy. Annu Rev Genet. 2009;43:67–93.
- Lloyd-Evans E, Platt FM. Lysosomal Ca(2+) homeostasis: role in pathogenesis of lysosomal storage diseases. Cell Calcium. 2011;50:200–205.
- Garrity AG, Wang W, Collier CM, et al. The endoplasmic reticulum, not the pH gradient, drives calcium refilling of lysosomes. eLife. 2016;5:e15887.
- Xu Q, Reed JC. Bax inhibitor-1, a mammalian apoptosis suppressor identified by functional screening in yeast. Mol Cell. 1998;1:337–346.
- Chae HJ, Kim HR, Xu C, et al. BI-1 regulates an apoptosis pathway linked to endoplasmic reticulum stress. Mol Cell. 2004;15:355–366.
- Bultynck G, Kiviluoto S, Henke N, et al. The C terminus of Bax inhibitor-1 forms a Ca2+-permeable channel pore. J Biol Chem. 2012;287:2544–2557.
- Guo G, Xu M, Chang Y, et al. Ion and pH Sensitivity of a TMBIM Ca(2+) Channel. Structure. 2019;27:1013–21 e3.
- Chang Y, Bruni R, Kloss B, et al. Structural basis for a pH-sensitive calcium leak across membranes. Science. 2014;344:1131–1135.
- Kiviluoto S, Schneider L, Luyten T, et al. Bax inhibitor-1 is a novel IP(3) receptor-interacting and -sensitizing protein. Cell Death Dis. 2012;3:e367.
- Lisbona F, Rojas-Rivera D, Thielen P, et al. BAX inhibitor-1 is a negative regulator of the ER stress sensor IRE1alpha. Mol Cell. 2009;33:679–691.
- Castillo K, Rojas-Rivera D, Lisbona F, et al. BAX inhibitor-1 regulates autophagy by controlling the IRE1alpha branch of the unfolded protein response. Embo J. 2011;30:4465–4478.
- Sano R, Hou YC, Hedvat M, et al. Endoplasmic reticulum protein BI-1 regulates Ca(2)(+)-mediated bioenergetics to promote autophagy. Genes Dev. 2012;26:1041–1054.
- Kim HR, Lee GH, Ha KC, et al. Bax Inhibitor-1 Is a pH-dependent regulator of Ca2+ channel activity in the endoplasmic reticulum. J Biol Chem. 2008;283:15946–15955.
- Lloyd-Evans E, Morgan AJ, He X, et al. Niemann-Pick disease type C1 is a sphingosine storage disease that causes deregulation of lysosomal calcium. Nat Med. 2008;14:1247–1255.
- Morgan AJ, Davis LC, Galione A. Imaging approaches to measuring lysosomal calcium. Methods Cell Biol. 2015;126:159–195.
- Shen D, Wang X, Li X, et al. Lipid storage disorders block lysosomal trafficking by inhibiting a TRP channel and lysosomal calcium release. Nat Commun. 2012;3:731.
- Nada S, Hondo A, Kasai A, et al. The novel lipid raft adaptor p18 controls endosome dynamics by anchoring the MEK-ERK pathway to late endosomes. Embo J. 2009;28:477–489.
- Varnai P, Balla A, Hunyady L, et al. Targeted expression of the inositol 1,4,5-triphosphate receptor (IP3R) ligand-binding domain releases Ca2+ via endogenous IP3R channels. Proc Natl Acad Sci U S A. 2005;102:7859–7864.
- Suzuki J, Kanemaru K, Ishii K, et al. Imaging intraorganellar Ca2+ at subcellular resolution using CEPIA. Nat Commun. 2014;5:4153.
- Rosemblit N, Moschella MC, Ondriasova E, et al. Intracellular calcium release channel expression during embryogenesis. Dev Biol. 1999;206:163–177.
- Ambudkar IS. Polarization of calcium signaling and fluid secretion in salivary gland cells. Curr Med Chem. 2012;19:5774–5781.
- Subedi KP, Singh TD, Kim JC, et al. Cloning and expression of a new inositol 1,4,5-trisphosphate receptor type 1 splice variant in adult rat atrial myocytes. Cell Mol Biol Lett. 2012;17:124–135.
- Atakpa P, Thillaiappan NB, Mataragka S, et al. IP3 receptors preferentially associate with ER-lysosome contact sites and selectively deliver Ca(2+) to lysosomes. Cell Rep. 2018;25:3180–93 e7.
- Pena-Llopis S, Brugarolas J. TFEB, a novel mTORC1 effector implicated in lysosome biogenesis, endocytosis and autophagy. Cell Cycle. 2011;10:3987–3988.
- Stewart AA, Ingebritsen TS, Manalan A, et al. Discovery of a Ca2+- and calmodulin-dependent protein phosphatase: probable identity with calcineurin (CaM-BP80). FEBS Lett. 1982;137:80–84.
- Zhang X, Cheng X, Yu L, et al. MCOLN1 is a ROS sensor in lysosomes that regulates autophagy. Nat Commun. 2016;7:12109.
- Guo S, Liang Y, Murphy SF, et al. A rapid and high content assay that measures cyto-ID-stained autophagic compartments and estimates autophagy flux with potential clinical applications. Autophagy. 2015;11:560–572.
- Kimura S, Noda T, Yoshimori T. Dissection of the autophagosome maturation process by a novel reporter protein, tandem fluorescent-tagged LC3. Autophagy. 2007;3:452–460.
- Ni HM, Bockus A, Wozniak AL, et al. Dissecting the dynamic turnover of GFP-LC3 in the autolysosome. Autophagy. 2011;7:188–204.
- Eskelinen EL. Fine structure of the autophagosome. Methods Mol Biol. 2008;445:11–28.
- Korolchuk VI, Saiki S, Lichtenberg M, et al. Lysosomal positioning coordinates cellular nutrient responses. Nat Cell Biol. 2011;13:453–460.
- Lisak D, Schacht T, Gawlitza A, et al. BAX inhibitor-1 is a Ca(2+) channel critically important for immune cell function and survival. Cell Death Differ. 2016;23:358–368.
- Kania E, Roest G, Vervliet T, et al. IP3 receptor-mediated calcium signaling and its role in autophagy in cancer. Front Oncol. 2017;7:140.
- Zhang Y, Sheng X, Meng X, et al. The circular F-actin bundles provide a track for turnaround and bidirectional movement of mitochondria in arabidopsis root hair. PloS One. 2014;9:e91501.
- Akkerman M, Overdijk EJ, Schel JH, et al. Golgi body motility in the plant cell cortex correlates with actin cytoskeleton organization. Plant Cell Physiol. 2011;52:1844–1855.
- Lavoie JN, Landry MC, Faure RL, et al. Src-family kinase signaling, actin-mediated membrane trafficking and organellar dynamics in the control of cell fate: lessons to be learned from the adenovirus E4orf4 death factor. Cell Signal. 2010;22:1604–1614.
- Lee GH, Ahn T, Kim DS, et al. Bax inhibitor 1 increases cell adhesion through actin polymerization: involvement of calcium and actin binding. Mol Cell Biol. 2010;30:1800–1813.
- Lee GH, Lee HY, Li B, et al. Bax inhibitor-1-mediated inhibition of mitochondrial Ca2+ intake regulates mitochondrial permeability transition pore opening and cell death. Sci Rep. 2014;4:5194.
- Xu G, Wang S, Han S, et al. Plant Bax Inhibitor-1 interacts with ATG6 to regulate autophagy and programmed cell death. Autophagy. 2017;13:1161–1175.
- Yadav RK, Lee GH, Lee HY, et al. TMBIM6 (transmembrane BAX inhibitor motif containing 6) enhances autophagy and reduces renal dysfunction in a cyclosporine A-induced nephrotoxicity model. Autophagy. 2015;11:1760–1774.
- Lee GH, Kim DS, Kim HT, et al. Enhanced lysosomal activity is involved in Bax inhibitor-1-induced regulation of the endoplasmic reticulum (ER) stress response and cell death against ER stress: involvement of vacuolar H+-ATPase (V-ATPase). J Biol Chem. 2011;286:24743–24753.
- Lee GH, Yan C, Shin SJ, et al. BAX inhibitor-1 enhances cancer metastasis by altering glucose metabolism and activating the sodium-hydrogen exchanger: the alteration of mitochondrial function. Oncogene. 2010;29:2130–2141.
- Churchill GC, Okada Y, Thomas JM, et al. NAADP mobilizes Ca(2+) from reserve granules, lysosome-related organelles, in sea urchin eggs. Cell. 2002;111:703–708.
- Seo SU, Woo SM, Lee HS, et al. mTORC1/2 inhibitor and curcumin induce apoptosis through lysosomal membrane permeabilization-mediated autophagy. Oncogene. 2018;37(38):5205–5220.
- Pena-Llopis S, Vega-Rubin-de-Celis S, Schwartz JC, et al. Regulation of TFEB and V-ATPases by mTORC1. Embo J. 2011;30:3242–3258.
- Kim JH, Lee ER, Jeon K, et al. Role of BI-1 (TEGT)-mediated ERK1/2 activation in mitochondria-mediated apoptosis and splenomegaly in BI-1 transgenic mice. Biochim Biophys Acta. 2012;1823:876–888.
- Lee GH, Kim HR, Chae HJ. Bax inhibitor-1 regulates the expression of P450 2E1 through enhanced lysosome activity. Int J Biochem Cell Biol. 2012;44:600–611.
- Park KH, Kim BJ, Kang J, et al. Ca2+ signaling tools acquired from prostasomes are required for progesterone-induced sperm motility. Sci Signal. 2011;4:ra31.
- Nishida Y, Arakawa S, Fujitani K, et al. Discovery of Atg5/Atg7-independent alternative macroautophagy. Nature. 2009;461:654–658.
- Mizushima N, Yamamoto A, Matsui M, et al. In vivo analysis of autophagy in response to nutrient starvation using transgenic mice expressing a fluorescent autophagosome marker. Mol Biol Cell. 2004;15:1101–1111.
- He C, Bassik MC, Moresi V, et al. Exercise-induced BCL2-regulated autophagy is required for muscle glucose homeostasis. Nature. 2012;481:511–515.
- Parkhitko A, Myachina F, Morrison TA, et al. Tumorigenesis in tuberous sclerosis complex is autophagy and p62/sequestosome 1 (SQSTM1)-dependent. Proc Natl Acad Sci U S A. 2011;108:12455–12460.
- Lackner C, Gogg-Kamerer M, Zatloukal K, et al. Ballooned hepatocytes in steatohepatitis: the value of keratin immunohistochemistry for diagnosis. J Hepatol. 2008;48:821–828.
- Ragazzoni Y, Desideri M, Gabellini C, et al. The thiazole derivative CPTH6 impairs autophagy. Cell Death Dis. 2013;4:e524.
- Lingwood D, Simons K. Detergent resistance as a tool in membrane research. Nat Protoc. 2007;2:2159–2165.