
 ?Mathematical formulae have been encoded as MathML and are displayed in this HTML version using MathJax in order to improve their display. Uncheck the box to turn MathJax off. This feature requires Javascript. Click on a formula to zoom.
ABSTRACT
Dysfunction of macroautophagy/autophagy has been postulated as a major cellular toxicological response to nanomaterials. It has been reported that excessive autophagy activation, induced by silica nanoparticles (SiNPs), contributes to autophagy dysfunction, whereas little is known how SiNPs trigger autophagy activation. Here, we treated normal rat kidney (NRK) cells using 3 different sizes of SiNPs (16, 29, and 51 nm) and observed that 16-nm SiNPs, with a final concentration of 60 μg/mL, dramatically induce autophagy activation without reducing cell viability. We further conducted a transcriptomic, proteomic, and phosphoproteomic profiling, and detected 23 autophagy-related (Atg) genes and 35 autophagy regulators regulated on at least one omic layer. To identify key regulators from the multi-omics data, we developed a new algorithm of computational prediction of master autophagy-regulating kinases (cMAK) to detect 21 candidates and revealed the CDK7-CDK4 cascade to be functional. The silence or inhibition of Cdk7 or Cdk4 significantly attenuated autophagic activation but not influenced autophagic flux blockage induced by 16-nm SiNPs. Further computational modeling indicated that the CDK7-CDK4 signaling axis potentially triggers autophagy activation by phosphorylating RB1 (RB transcriptional corepressor 1), activating two critical transcription factors, E2F1 (E2F transcription factor 1) and FOXO3 (forkhead box O3), and enhancing the transcriptional levels of at least 8 Atg genes and autophagy regulators in response to SiNPs. Our studies not only established a powerful method for predicting regulatory kinases from the multi-omics data but also revealed a potential mechanism of SiNP-triggered autophagy activation through modulating the CDK7-CDK4 cascade.
Abbreviations: 3-MA: 3-methyladenine; Atg: autophagy-related; BECN1: beclin 1; CCK-8: cell counting kit-8; CDK4: cyclin dependent kinase 4; CDK7: cyclin dependent kinase 7; cMAK: computational prediction of master autophagy-regulating kinases; CQ: chloroquine; DMEM: Dulbecco’s modified Eagle’s medium; DMSO: dimethyl sulfoxide; E-ratio: enrichment ratio; E2F1: E2F transcription factor 1; EBSS: Earle’s balanced salt solution; ER: endoplasmic reticulum; FOXO3: forkhead box O3; FPKM: fragments per kilobase of exon per million fragments mapped; GO: gene ontology; H2O2: hydrogen peroxide; iGPS: in vivo GPS; KEGG: Kyoto Encyclopedia of Genes and Genomes; LC-MS/MS: liquid chromatography–tandem mass spectrometry; LDH: lactate dehydrogenase; MAP1LC3B/LC3: microtubule associated protein 1 light chain 3 beta; NRK: normal rat kidney; p-site: phosphorylation site; PBS: phosphate-buffered saline; PDI: polydispersity index; PTM: post-translational modification; QKS: quantitative kinase state; RB1: RB transcriptional corepressor 1; RBHs: reciprocal best hits; RNA-Seq: RNA sequencing; ROS: reactive oxygen species; rSiNPs: SiNPs fluorescently labeled with rhodamine B; SEM: scanning electronic microscopy; SiNPs: silica nanoparticles; siRNA: small interfering RNA; SQSTM1/p62: sequestosome 1; ssKSR: site-specific kinase-substrate relation; TEM: transmission electron microscopy; tfLC3: mRFP-GFP tandem fluorescent-tagged LC3.
Introduction
Macroautophagy (hereafter referred to as autophagy) is a highly conserved lysosome-based degradative pathway in eukaryotic cells [Citation1–5]. Autophagy plays an important role in the removal of damaged organelles, misfolded proteins, aggregates, and/or intercellular pathogens [Citation1–6]. The process of autophagy begins at phosphatidylinositol synthase-enriched endoplasmic reticulum (ER) subdomains, following with the engulfment of cytoplasmic contents by the autophagosomes, which are then delivered and fused with the lysosomes to form autolysosomes [Citation5,Citation7,Citation8]. Lysosomal enzymes subsequently digest the engulfed intercellular contents, and the degradation products are eventually recycled for reuse in the cytoplasm [Citation5,Citation8,Citation9]. As the core machinery of autophagy, protein products of autophagy-related (Atg) genes synergistically orchestrate the autophagic process, and their cellular functions are dynamically regulated by multiple types of post-translational modifications (PTMs), such as phosphorylation, ubiquitination, and acetylation [Citation3,Citation4]. Autophagy can be induced by various stimuli, including nutrient deprivation, oxidative stress, hypoxia, and chemical reagents [Citation4,Citation5,Citation10]. In particular, excessive autophagy activation and the inhibition of autophagic flux usually result in autophagy dysfunction, which is closely associated with a large number of human diseases, such as neurodegenerative disorders, autoinflammatory diseases, and cancer [Citation5,Citation11,Citation12].
With the advance of nanotechnology, silica nanoparticles (SiNPs) have been widely utilized as engineered nanomaterials and have attracted great interests in a variety of biomedical applications, such as biosensing, bioimaging, drug delivery, disease diagnosis, and therapy [Citation13–16]. The cellular uptake of different types of SiNPs is mainly mediated by 3 distinct endocytic pathways [Citation13,Citation14,Citation17–20]. SiNPs larger than 0.2 μm enter phagocytes and non-phagocytic cells by phagocytosis and macropinocytosis, respectively [Citation18–20]. SiNPs less than 200 nm are mainly endocytosed via clathrin-mediated process, whereas SiNPs less than 80 nm can be internalized through caveolae/lipid raft-mediated endocytosis [Citation17–20]. Internalized SiNPs show cytotoxic effects and enhance a variety of stress stimuli, such as DNA damage stress, ER stress, and reactive oxygen species (ROS) [Citation13,Citation14,Citation18,Citation20–25]. Also, SiNPs induce autophagy activation in various mammalian cell lines, such as human lung epithelium cell line BEAS-2B [Citation14], colon cancer cell line HCT-116 [Citation17], normal hepatic cell line L-02 [Citation22], as well as murine RAW264.7 macrophages [Citation24] and preosteoblast cell line MC3T3-E1 [Citation19]. The induction of autophagy activity depends on size, dose, time, and/or cell type [Citation18,Citation21,Citation25–27], and excessive autophagy activation was demonstrated to be involved in autophagy dysfunction, which has been proposed as a major cellular toxicological response to the treatment of SiNPs [Citation20–23,Citation25]. The triggering mechanisms of SiNP-induced autophagy activation remained to be dissected.
In this work, we first evaluated the biological consequences of normal rat kidney (NRK) cells treated with 3 sizes of SiNPs, including 16 ± 2.3 nm, 29 ± 3.3 nm, and 51 ± 4.5 nm with a final concentration of 60 or 120 μg/mL. Although all tested SiNPs triggered autophagy, 16-nm SiNPs at 60 μg/mL dramatically induced autophagy activation potently without significantly cytotoxic effects on cell survival. To dissect the triggering mechanisms of SiNP-induced autophagy activation, here, we systematically conducted a time-course quantification of transcriptomes, proteomes, and phosphoproteomes in NRK cells treated with 16-nm SiNPs at 60 μg/mL for 0, 8, 16, 20, and 24 h. From the multi-omics data, we detected 6,059 genes, 1,452 proteins, and 1,660 phosphoproteins differentially regulated by the treatment of 16-nm SiNPs. The enrichment analyses of gene ontology (GO) annotations indicated that numerous biological processes were simultaneously regulated on ≥ 2 omic layers, and the results suggested a synergistic regulation of activated signaling pathways on different layers in response to 16-nm SiNPs. Strikingly, we found up to 23 Atg genes, and 35 autophagy regulators were significantly modulated in at least one omic layer. To reveal key regulators, namely, protein kinases, in signaling pathways, we developed a new algorithm of computational prediction of master autophagy-regulating kinases (cMAKs) for the integration and analysis of the multi-omics data. Using cMAK, 21 protein kinases were predicted to be potentially involved in the regulation of autophagy activation induced by SiNPs. We performed additional experiments to validate the 21 predicted kinases. Unexpectedly, we discovered two kinases, CDK4 (cyclin dependent kinase 4) and CDK7 (cyclin dependent kinase 7) [Citation28], to be functionally essential for autophagy activation triggered by 16-nm SiNPs. Knockdown or inhibition of Cdk4 or Cdk7 blocked the lipidation of an autophagy marker, MAP1LC3B/LC3 (microtubule associated protein 1 light chain 3 beta), to greatly diminish the protein expression of LC3-II and decreased the number of GFP-LC3 puncta upon SiNP treatment, without influencing autophagic flux blockage induced by 16-nm SiNPs. Together, our studies not only revealed that the CDK7-CDK4 axis plays a potential role in regulating SiNP-induced autophagy but also produced a highly powerful approach for the inference of regulatory kinases from the multi-omics data. We anticipate such a strategy of multi-omics profiling, coupled with bioinformatics predictions, can be extended for analyzing the biological effects of other types of autophagy modulators.
Results
The induction of autophagy by SiNPs is size- and dose-dependent
As previously described, 3 sizes of carboxylated SiNPs were synthesized via the Stöber method [Citation29]. Surface engineering with carboxylate was performed in an alkaline solution. The morphology of SiNPs was directly observed by scanning electronic microscopy (SEM), and the diameters of synthesized SiNPs were determined as 16 ± 2.3 nm, 29 ± 3.3 nm, and 51 ± 4.5 nm, respectively (). The zeta potentials, hydrodynamic diameters, and polydispersity index (PDI) values of the 3 sizes of SiNPs were measured by dynamic light scattering, respectively (Table S1). The negative zeta potentials of all SiNPs were less than −29 mV (Table S1), indicating the stability of SiNPs in dispersed media [Citation30]. To further evaluate the stability of synthesized SiNPs in a near-physiological environment, the 3 sizes of SiNPs were individually incubated in Dulbecco’s modified Eagle’s medium (DMEM) in the absence or presence of 10% fetal bovine serum. From the results, no significant protein corona formation and SiNP agglomeration were observed based on dynamic light scattering detection [Citation24], which ensured the consistency between the solution and cellular environment ().
Figure 1. The effect of SiNPs with different sizes and doses on the induction of autophagy activation. (A) The morphology of 16-nm, 29-nm, or 51-nm SiNPs was observed using SEM. (B) The stability of synthesized SiNPs in near-physiological environment. (C) GFP-LC3 NRK cells were treated with 3 different sizes of SiNPs for 0, 16, 20, and 24 h and observed under the confocal microscopy. Scale bar: 5 μm. (D) NRK cells were incubated with the 3 sizes of SiNPs for 24 h or EBSS for 3 h, and (E) the protein levels of LC3-II were analyzed by immunoblotting. The relative expression of LC3-II was evaluated by the ratio of LC3-II:ACTB. (F) GFP-LC3 NRK cells were incubated with 16-nm rSiNPs at 60 μg/mL for 0, 3, 8, 16, 20, and 24 h, stained by Hoechst 33342 and imaged by laser scanning confocal microscopy. The rSiNP (red), GFP-LC3 (green), and Hoechst 33342 staining of the nuclei (blue) were shown. Scale bar: 5 μm. (G) TEM images of NRK cells treated with 16-nm SiNPs at 60 μg/ml for 24 h. Red arrow, double-membrane autophagosome; Yellow arrow, single-membrane autolysosome. (H) NRK cells were treated with the 3 sizes of SiNPs for 24 h with a final concentration of 0, 60, 120, 240 or 480 μg/mL, and the cell viability was measured by CCK-8 assay. * p < 0.05; ** p < 0.01
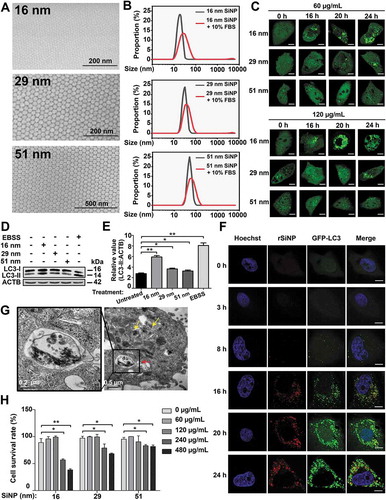
To analyze the cellular effect induced by SiNPs with different sizes, NRK cells stably expressing GFP-LC3 (GFP-LC3 NRK cells) were treated with SiNPs for 0, 16, 20, and 24 h with a final concentration of 60 or 120 μg/mL. All the 3 sizes of SiNPs can induce autophagy activation (), and the results were consistent with previous studies [Citation14,Citation17–19,Citation23,Citation24]. Also, we found that 16-nm SiNPs could efficiently induce the accumulation of GFP-LC3 puncta more potently in contrast with other sizes of SiNPs (). Next, we monitored autophagy induction through detecting LC3-II in NRK cells treated with the 3 sizes of SiNPs with the final concentration of 60 μg/mL for 24 h, respectively. The immunoblotting analysis showed that all SiNPs robustly enhanced the LC3-II level. Again, 16-nm SiNPs promoted the accumulation of LC3-II to a much stronger extent (). By using protein bands of ACTB in , the band detection was verified to be within a linear range (Figure S1A).
To analyze the spatial and temporal distribution of 16-nm SiNPs after the cellular uptake, we synthesized 16-nm SiNPs fluorescently labeled with rhodamine B (rSiNPs), which were incubated with GFP-LC3 NRK cells for 0, 3, 8, 16, 20, and 24 h, respectively. From the confocal images, we found that the amount of internalized SiNPs had been gradually increased since 3 h (). At time points of 16, 20, and 24 h, we observed that 16-nm SiNPs at 60 μg/mL were extensively dispersed in the cytosol without entering the nuclei, and a strong colocalization between rSiNPs and GFP-LC3 were detected (). In particular, the increase of numbers of GFP-LC3 puncta during the autophagic process indicated that 16-nm SiNPs potentially induced autophagosome accumulation after autophagy activation (). Furthermore, we obtained transmission electron microscopy (TEM) images from NRK cells treated with 16-nm SiNPs after 24 h. We found that electron-dense SiNPs were highly accumulated in autophagosomes and autolysosomes, as well as distributed in the cytoplasm (). Thus, SiNPs were potentially engulfed by the autophagosomes and then fused with the lysosomes, and the results were consistent with previous reports [Citation22,Citation25].
In addition, to assess the biosafety of SiNPs, NRK cells were separately treated with the 3 sizes of SiNPs for 24 h with a final concentration of 0, 60, 120, 240, or 480 μg/mL. For each assay, the cell viability was evaluated by using cell counting kit-8 (CCK-8) and LDH (lactate dehydrogenase) assays, respectively ( and S1B). We observed that the incubation of the 3 sizes of SiNPs at 60 or 120 μg/mL did not influence the NRK cell survival, which was dramatically decreased upon the increased concentration of 240 or 480 μg/mL ( and S1B). Also, 16-nm SiNPs at 240 or 480 μg/mL reduced the cell viability to a more significant extent in contrast with the other sizes of SiNPs ( and S1B). Thus, our results supported that SiNPs reduced cell viability in both size- and dose-dependent manners.
16-nm SiNPs block autophagic flux through inhibiting lysosomal degradation
It was proposed that autophagosome accumulation might be attributed to enhanced autophagy activation or autophagic flux blockage [Citation5,Citation18,Citation22]. To test whether SiNPs block autophagic flux, we measured the protein expression of SQSTM1/p62 (sequestosome 1), a widely used marker for monitoring autophagic flux, in NRK cells treated with the 3 sizes of SiNPs with a final concentration of 60 μg/mL for 24 h, respectively. We found that only 16-nm SiNPs significantly upregulated the SQSTM1 level and potentially blocked autophagic flux (). To evaluate autophagy activation and inhibition of autophagic flux, NRK cells were incubated with 16-nm SiNPs at 60 μg/mL for 0, 8, 16, 20, and 24 h, respectively. The immunoblotting results showed that the protein level of LC3-II had been significantly enhanced since the 16th hour (). In contrast, the SQSTM1 expression level had been statistically upregulated since the 8th hour (). In this regard, both enhanced autophagy activation and autophagic flux blockage might contribute to autophagosome accumulation.
Figure 2. The 16-nm SiNPs block autophagic flux through inhibiting lysosomal degradation. (A) NRK cells were incubated with the 3 sizes of SiNPs for 24 h or EBSS for 3 h, and (B) the protein levels of SQSTM1 were analyzed by immunoblotting. The relative expression of SQSTM1 was evaluated by the ratio of SQSTM1:ACTB. (C) NRK cells were stimulated with 16-nm SiNPs at 60 μg/mL for 0, 8, 16, 20, and 24 h. The total protein levels of (D) LC3-II and (E) SQSTM1 were measured by immunoblotting, and the relative expression of LC3-II or SQSTM1 was evaluated by the ratio of LC3-II:ACTB or SQSTM1:ACTB, respectively. (F) tfLC3 NRK cells were treated with EBSS for 2 h or 16-nm SiNPs at a final concentration of 60 μg/mL for 0, 3, 8, 16, and 24 h. Fluorescent images were shown, while numbers of red dots and total dots (yellow and red dots) were quantified per cell. Scale bar: 5 μm. (G) In each treatment, ≥ 30 cells were counted, whereas the ratio of autophagic flux vs. autophagy induction was determined by using untreated cells for normalization. (H) NRK cells were pre-treated with 5 mM 3-MA for 8 h and followed by 16-nm SiNP treatment at a final concentration of 0, 30, 60, or 90 μg/mL for 24 h. The protein levels of (I) LC3-II and (J) SQSTM1 were measured by immunoblotting assay, and the relative expression of LC3-II or SQSTM1 was calculated by the ratio of LC3-II:ACTB or SQSTM1:ACTB, respectively. (K) NRK cells were pre-incubated by 10 μM CQ for 8 h, and then incubated by 16-nm SiNPs at a final concentration of 0, 30, 60, or 90 μg/mL for 24 h. The protein levels of (L) LC3-II and (M) SQSTM1 were measured by immunoblotting assay, and the relative expression of LC3-II or SQSTM1 was calculated by the ratio of LC3-II:ACTB or SQSTM1:ACTB, respectively. * p < 0.05
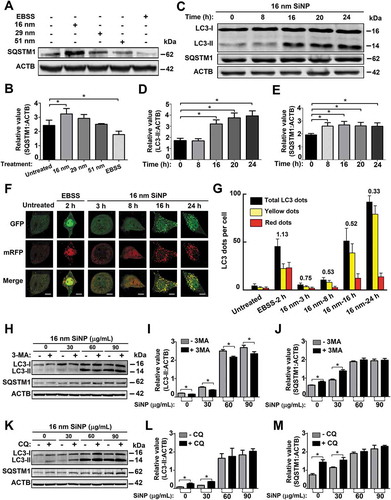
Next, we simultaneously monitored the autophagy activation and autophagic flux by performing the monomeric RFP (mRFP)-GFP tandem fluorescent-tagged LC3 (tfLC3) fluorescence analysis [Citation5,Citation31,Citation32]. In this assay, the GFP fluorescence will be rapidly quenched in the acidic and/or proteolytic conditions of lysosomal compartments. In contrast, mRFP is more stable and continues to fluoresce in red. In the merged fluorescent images, yellow and red puncta could be measured for the quantification of autophagosomes and autolysosomes, respectively. Then, the value of red dots:total dots (yellow and red dots) could be calculated as the ratio of autophagic flux vs. autophagy induction [Citation5,Citation31,Citation32]. Using untreated cells as the control, NRK cells expressing tfLC3 were treated with Earle’s balanced salt solution (EBSS) for 2 h, and 16-nm SiNPs at 60 μg/mL for 3, 8, 16, and 24 h (). After normalization with untreated cells, the ratio of autophagic flux vs. autophagy induction in EBSS-induced autophagy was determined as 1.13, and the ratio values were decreased to 0.75, 0.53, 0.52, and 0.33 in 16-nm SiNP-treated cells for 3, 8, 16, and 24 h, respectively (). These results supported that 16-nm SiNPs promoted autophagy induction but blocked autophagic flux.
Next, NRK cells were treated with 16-nm SiNPs with a final concentration of 0, 30, 60, or 90 μg/mL for 24 h, in the absence or presence of the 8 h pre-treatment with 3-methyladenine (3-MA), an inhibitor of the class III phosphatidylinositol 3-kinase (PtdIns3 K) that blocks autophagic/lysosomal protein degradation [Citation5]. In the context of the 3-MA pre-treatment, the protein level of LC3-II was reduced in untreated and SiNP-treated cells (), indicating the early stage of autophagy was blocked by 3-MA [Citation5]. However, we found that the protein expression of SQSTM1 was only increased in cells treated with 16-nm SiNPs at 0 and 30 μg/mL but not at higher doses (). Thus, a lower dose of 16-nm SiNPs influenced autophagic flux to a much less extent, whereas higher doses effectively blocked autophagic flux that was not additionally inhibited by 3-MA. Moreover, we treated NRK cells with 16-nm SiNPs at 0, 30, 60, or 90 μg/mL for 24 h, with or without the 8 h pre-treatment of chloroquine (CQ), an inhibitor of autophagic flux or lysosomal degradation [Citation5]. With the CQ pre-treatment, the LC3-II and SQSTM1 levels were not significantly changed in cells treated with 60 and 90 μg/mL SiNPs, in contrast with lower doses (). Thus, SiNPs with higher doses efficiently blocked autophagic flux through the inhibition of lysosomal degradation. Together, 16-nm SiNPs at 60 μg/mL could not only induce autophagy activation but also block autophagic flux by inhibiting lysosomal degradation, and the results were consistent with previous reports [Citation20–23].
A time-series multi-omics profiling of NRK cells treated with 16-nm SiNPs at 60 μg/mL
From the above results, we found that 16-nm SiNPs with a final concentration of 60 μg/mL could efficiently induce autophagy activation and block autophagic flux ( and 2), without significantly influencing the viability of NRK cells ( and S1B). To probe the molecular changes during SiNP-induced autophagy, we conducted a time-series quantification of transcriptomes, proteomes, and phosphoproteomes in NRK cells treated with 16-nm SiNPs with 60 μg/mL for 0, 8, 16, 20 and 24 h (). To ensure the data quality and reproducibility, 3 biological replicates were performed. Transcriptomes of the 15 cell samples were profiled by using the RNA sequencing (RNA-Seq) technology, and we mapped 1.17 × 10⁹ sequenced reads to the genome of Rattus norvegicus (). In total, 17,655 rat genes (61.45% of the coding transcriptome) were mapped with at least one read, with an average of 15,700 genes per sample (Figure S1C). For each mapped gene, the fragments per kilobase of exon per million fragments mapped (FPKM) value was calculated (Table S2), and the distribution of gene expression profiles was quite similar at 5 different time points, with an average FPKM value of 53.0 ().
Figure 3. Experimental procedure of the study. (A) A multistep flowchart of sample preparation, multi-omics profiling, data integration, potentially autophagy-regulating kinase prediction, and experimental validation for SiNP-induced autophagy. (B) The computational analyses of the transcriptomic, proteomic and phosphoproteomic data
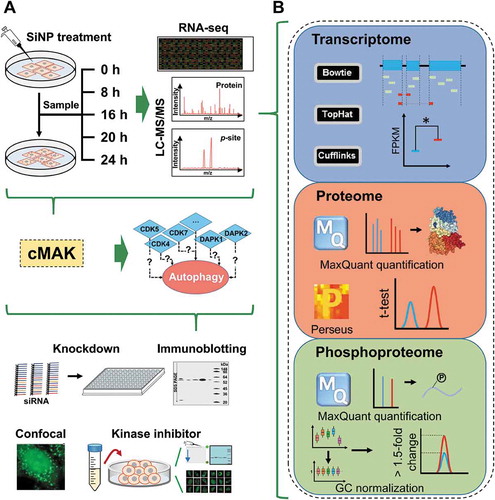
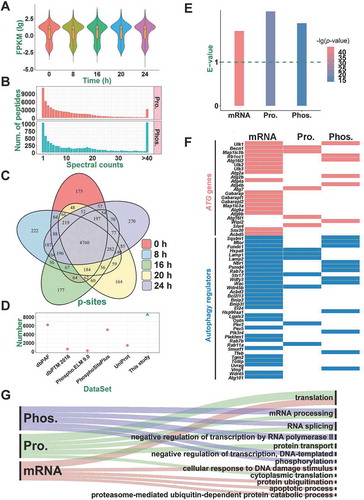
Figure 4. A summary of quantified transcriptomes, proteomes, and phosphoproteomes. (A) The distribution of FPKM values for the identified mRNAs during SiNP-induced autophagy. (B) The distribution of MS/MS spectral counts of non-phosphorylated peptides (Pro.) and phosphopeptides (Phos.) quantified in this study. (C) The overlap of p-sites quantified at 5 time points. (D) The comparison of p-sites quantified in this study with known p-sites in public databases. (E) The enrichment of known and potential autophagy regulators in differentially regulated mRNAs, proteins (Pro.), and phosphoproteins (Phos.). (F) Atg genes and autophagy regulators differentially altered in at least one omic level. (G) The GO-based enrichment results of biological processes that were differentially regulated on the mRNA, protein, and phosphoprotein levels
The label-free technology was adopted to quantify proteomes and phosphoproteomes through liquid chromatography–tandem mass spectrometry (LC-MS/MS) (). MaxQuant [Citation33], a mainstream proteomics software package, was utilized for processing the proteomic and phosphoproteomic data (). In total, 58,141 non-phosphorylated peptides and 7,355 phosphopeptides were quantitatively identified from the 15 samples. To test the reliability of the data, we checked the raw MS/MS data and found that 46,979 protein peptides (80.80%) and 6,324 phosphopeptides (85.98%) could be traced and matched by ≥ 2 spectral counts (). The average spectral counts were 12.7 and 20.8 for all non-phosphorylated peptides and phosphopeptides, indicating most of the quantification results to be highly reliable. For the proteomic data, all peptides were mapped to their corresponding protein sequences. Then, we obtained 6,205 unique proteins (Table S3), and 94.33% of them were mapped with ≥ 2 peptides (Figure S1D). We also mapped phosphopeptides to proteins and obtained 8,362 non-redundant phosphorylation sites (p-sites) of 2,673 proteins (Figure S1E and Table S4), including 7,222 phosphoserine (p-S), 1,090 phosphothreonine (p-T) and 50 phosphotyrosine (p-Y) residues (Figure S1F). A comparison of the p-sites across the 5 time points demonstrated that similar numbers of phosphorylation events were quantified during SiNP-triggered autophagy (), and a similar result was also observed at the phosphoprotein level (Figure S1G). To further assess the reliability of phosphoproteomic profiling, all quantified p-sites were compared to 5 public phosphorylation databases, including dbPAF [Citation34], dbPTM [Citation35], Phospho.ELM [Citation36], PhosphoSitePlus [Citation37], and UniProt [Citation38]. From the results, we found that 6,180 (72.33%) of our p-sites were covered by at least one database (), and such a high overlapping rate indicated most of the identifications to be highly confident p-sites.
The analysis of differentially regulated mRNAs, proteins and p-sites during autophagy
Using the 0 h data as the background, differentially regulated biomolecules in 8, 16, 20, and 24 h were computationally detected in mRNA, protein, and phosphorylation levels. Two widely used tools, Cufflinks [Citation39] and Perseus [Citation40], were adopted for detecting the differentially regulated genes and proteins, separately (). For the phosphoproteomic data, a well-established normalization strategy of global centering was individually used to normalize the average intensity value of all p-sites into 1 (Mean = 1) for each sample [Citation41] (). Then, p-sites with phosphorylation changes of > 1.5- or < 0.67-fold were directly taken as potentially up- or downregulated p-sites in 8, 16, 20, or 24 h against the 0 h, respectively. Finally, we identified 6,059 genes, 1,452 proteins, and 3,564 p-sites in 1,660 phosphoproteins to be preferentially altered after the exposure to SiNPs, respectively.
To exploit the correlation between autophagy and differentially regulated molecules, we first took 1,060 rat proteins potentially involved in autophagy from a previously developed database of THANATOS [Citation3]. Using the hypergeometric test, the enrichment analyses demonstrated that differentially regulated mRNAs, proteins, and phosphoproteins were all statistically associated with autophagy (p-value < 10−15, ). Moreover, we compiled a high-quality benchmark data set containing 34 Atg genes and 55 well-documented autophagy regulators from previous studies (Table S5) [Citation3,Citation42]. Strikingly, we found that up to 23 (67.65%) Atg genes and 35 (63.64%) autophagy regulators were differentially regulated on at least one omic layer ().
Next, GO-based enrichment analyses were performed to detect the top 5 biological processes potentially regulated by SiNPs (p-value < 10−11, ). Interestingly, we observed that 3 biological processes, including RNA splicing (GO: 0008380), mRNA processing (GO: 0006397), and translation (GO: 0006412), were simultaneously enriched at two omic layers. Thus, our results demonstrated that the activated signaling pathways at different omic levels might be synergistically orchestrated in response to SiNPs. Collectively, our results not only characterized the dynamic landscape of Atg genes and autophagy regulators during SiNP-induced autophagy but also pinpointed the altered biological pathways dramatically disturbed by nanoparticles.
Prediction of autophagy-regulating kinases from the multi-omics data
In this study, we developed a 3-step algorithm of cMAK to integrate the transcriptomic, proteomic, and phosphoproteomic data sets for the computational inference of potentially key regulators, namely, protein kinases that participate in regulating SiNP-induced autophagy (). First, we adopted a previously developed tool of in vivo GPS (iGPS 1.0) [Citation43] to predict the site-specific kinase-substrate relations (ssKSRs) for all quantified p-sites. In our results, 349 rat kinases were predicted to modify at least one p-site, and 1,325 p-sites (15.51%) were predicted to be regulated by at least one kinase. Since phosphorylation events faithfully memorize the actions of their regulatory kinases, the change of a kinase state can be intuitively reflected from the changes of its substrates, together with phosphorylation levels. Thus, we raised a concept of quantitative kinase state (QKS), which was calculated by adding normalized intensity values for p-sites of each kinase. In the second step, by using the 0 h phosphoproteomic data as the control, we carried out a pairwise determination of kinases with significantly changed QKS values in 8, 16, 20, and 24 h (p-value < 0.0001). To ensure the data quality, only 29 differentially altered kinases detected in ≥ 3 time points were reserved ().
Figure 5. The overview of the 3-step cMAK algorithm. First, ssKSRs were predicted for all quantified p-sites to pinpoint potential substrates for each kinase. Then, the QKS value of each kinase was calculated, and the total QKS score was summed up for each time point. The statistical significance was evaluated through Yate’s chi-squared test. Finally, the transcriptomic, proteomic, and phosphoproteomic data of predicted kinases, as well as the literature evidence, were considered to reduce potentially false-positive hits
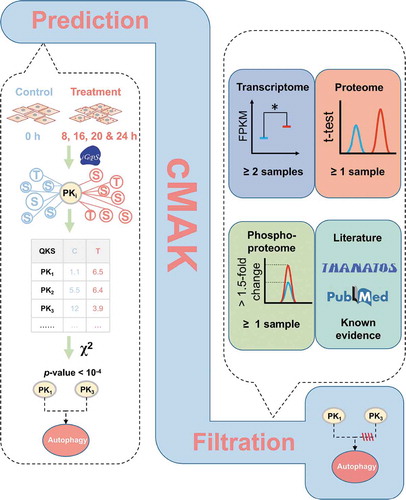
Figure 6. The prediction of potentially regulatory kinases in SiNP-induced autophagy. (A) Among the 4 samples of 8, 16, 20, and 24 h, QKS values of 29 kinases were significantly changed in ≥ 3 time points, against the 0 h sample. (B) Predicted kinases without any additional evidence were removed, and in total, 21 kinases were prioritized as potentially regulatory kinases. (C) The network between 21 kinases and their substrates was predicted by iGPS. (D) The KEGG-based enrichment analysis of biological pathways for the substrates of the 21 kinases
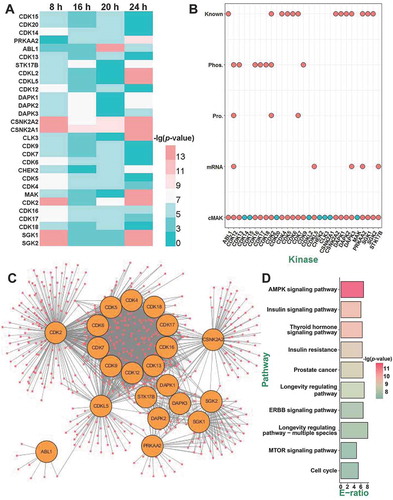
The QKS value is an indirect measurement of the kinase state. Previous studies indicated that the protein kinase expression at transcriptional and translational levels, as well as its own phosphorylation, were essential for sustaining its appropriate biological functions [Citation44,Citation45]. Thus, the changes in mRNA, protein, and phosphorylation levels of kinases should be considered. From the 29 predicted kinases, we found 5, 3, and 7 kinases with significantly changed mRNAs, proteins, and p-sites, respectively (). In addition, we carefully curated the literature and found that 13 kinases were previously reported in regulating autophagy (). For example, Zalckvar et al. discovered DAPK1 (death associated protein kinase 1) phosphorylates BECN1 (beclin 1) at T119 to promote autophagy induction [Citation46]. Also, Ber et al. reported that DAPK2 (death associated protein kinase 2) represses the mechanistic target of rapamycin kinase complex 1 (MTORC1) to increase autophagy activation [Citation47]. These kinases might also play roles in SiNP-triggered autophagy activation. Finally, 8 predicted kinases without any additional evidence were singled out, and the remaining 21 kinases were taken as potential autophagy-regulating kinases ( and Table S6).
From our predictions, a network was illustrated to investigate the relations between the 21 kinases and their 299 predicted substrates. We found that up to 12 kinases belong to the CDK kinase family, including CDK2, CDK4, CDK5, CDK6, CDK7, CDK9, CDK12, CDK13, CDK16, CDK17, CDK18, and CDKL5, indicating a potential role of CDKs in SiNP-induced autophagy (). For a better understanding of the regulatory roles of the 21 kinases, a Kyoto Encyclopedia of Genes and Genomes (KEGG)-based enrichment analysis was performed for their phosphorylated substrates, and numerous biological pathways were detected to be significantly enriched (p-value < 10−7). Interestingly, we found that most of these signaling pathways were validated to be closely associated with autophagy. For example, the most enriched pathway was the AMPK signaling pathway (KEGG ID: 04152), which was reported to be crucial in autophagy activation [Citation4]. Moreover, both the insulin signaling pathway (KEGG ID: 04910) and the insulin resistance pathway (KEGG ID: 04931) were also known to participate in regulating autophagy [Citation48,Citation49]. Thus, our analyses not only supported the reliability of cMAK predictions but also indicated that one or multiple candidate kinases might be important in SiNP-autophagy ().
CDK4 and CDK7 are essential for SiNP-induced autophagy activation
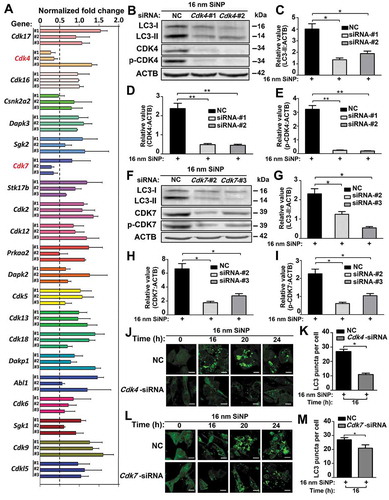
Based on the data analysis of cMAK, we predicted 21 protein kinases to be potentially involved in SiNP-induced autophagy activation. To verify the predictions, we used a small interfering RNA (siRNA) library by designing 3 different siRNA duplexes for targeting each predicted kinase. In total, 63 siRNAs were generated (Table S7A), and NRK cells were individually transfected and incubated with a siRNA duplex for 48 h, followed by the treatment of 16-nm SiNPs with a final concentration of 60 μg/mL for 24 h. As a readout of autophagy activation, the protein level of LC3-II was detected by the immunoblotting analysis, and 3 independent experiments were conducted for each siRNA-mediated knockdown assay. From the results, we found that the knockdown of 4 kinases, including Cdk4, Csnk2a2 (casein kinase 2 alpha 2), Cdk7, and Prkaa2 (protein kinase AMP-activated catalytic subunit alpha 2), induced a > 2-fold decrease of the LC3-II level upon SiNP treatment, with at least one siRNA (). Since the potential functional roles of only Cdk4 and Cdk7 were supported by 2 siRNAs, we anticipated the 2 kinases to be bona fide regulators in SiNP-induced autophagy activation, with higher confidence.
Figure 7. Two kinases CDK4 and CDK7 function in autophagy activation induced by SiNPs. (A) NRK cells were transfected with siRNA for 48 h and then incubated with 16-nm SiNPs at 60 μg/mL for 24 h. The protein level of LC3-II was detected by immunoblotting, and the relative expression of LC3-II was measured by the ratio of LC3-II:ACTB. (B) The effect of Cdk4 knockdown on LC3-II accumulation in NRK cells incubated with 16-nm SiNPs. The protein levels of (C) LC3-II, (D) CDK4, and (E) p-CDK4 were measured by immunoblotting, and the relative expression of LC3-II, CDK4, or p-CDK4 were calculated by the ratio of LC3-II:ACTB, CDK4:ACTB, or p-CDK4:ACTB. (F) The effect of Cdk7 knockdown on LC3-II accumulation in NRK cells incubated with 16-nm SiNPs. The protein levels of (G) LC3-II, (H) CDK7, and (I) p-CDK7 were measured by immunoblotting, and the relative expression of LC3-II, CDK7, or p-CDK7 was calculated by the ratio of LC3-II:ACTB, CDK7:ACTB, or p-CDK7:ACTB. (J) GFP-LC3 NRK cells were transfected with Cdk4-specific siRNAs and followed by 16-nm SiNPs treatment. Scale bar: 10 μm. (K) The GFP-LC3 puncta were observed and measured by confocal microscopy, and the number of GFP-LC3 puncta was quantified in ≥ 30 cells at 16 h. (L) GFP-LC3 NRK cells were transfected with Cdk7-specific siRNA and followed by 16-nm SiNPs treatment at 60 μg/mL. Scale bar: 10 μm. (M) The GFP-LC3 puncta were observed and measured by confocal microscopy, while the number of GFP-LC3 puncta was quantified in ≥ 30 cells at 16 h. NC, negative control; * p < 0.05; ** p < 0.01
The biological functions of protein kinases mainly depend on their kinase activities. If CDK4 and CDK7 are truly involved in the regulation of SiNP-induced autophagy activation, their kinase activities might exhibit significant changes upon SiNP treatment. Previously, CDK4 was demonstrated to be activated and phosphorylated by CDK7 at T172, and CDK7 was activated and modified by CDK2 at T170 in Homo sapiens [Citation28,Citation50,Citation51]. Thus, their equivalent p-sites in rat CDK4 and CDK7 are T172 and T171, of which phosphorylation levels are positively correlated with their corresponding kinase activities. From the phosphoproteomic data, the phosphorylation of CDK4 T172 was not found, and the phosphorylation of CDK7 T171 was only detected in the 20 h samples (Table S4). Since the phosphoproteomic data was far from integrative, we probed the phosphorylation levels of CDK4 T172 and CDK7 T171 by using the immunoblotting assay. At the same time, the protein expressions of the 2 kinases were also detected in the following studies.
To further confirm the potential roles of CDK4 and CDK7, we next assessed whether the silence of endogenous Cdk4 and Cdk7 would repress autophagy activation upon 16-nm SiNP treatment. We used 3 Cdk4- or Cdk7-specific siRNAs to interfere with the Cdk4 or Cdk7 expression for 48 h, respectively, and revealed that 2 of the 3 siRNAs effectively inhibited the protein expression of endogenous CDK4 (Figure S2A) or CDK7 (Figure S2B). Using effective siRNAs, we found that the knockdown of Cdk4 dramatically reduced the LC3-II level, as well as protein and phosphorylation levels of CDK4, when NRK cells were treated with 16-nm SiNPs at 60 μg/mL for 24 h (). The similar results were obtained after knocking down Cdk7, in which the protein and phosphorylation levels of CDK7 and the LC3-II level were significantly decreased (). In addition, we analyzed whether CDK4 and CDK7 are critical for SiNP-induced autophagy activation in other mammalian cells. Two human cell lines, including HeLa and HepG2 cells, were separately transfected with siRNAs specifically designed for human CDK4 or CDK7 (Table S7B) and followed by the treatment of 16-nm SiNPs at 60 μg/mL for 24 h. Besides the decrease of protein and phosphorylation levels, knocking down CDK4 or CDK7 significantly reduced the protein expression of LC3-II in the 2 cell lines (Figure S2C–R). In this regard, our results demonstrated that both CDK4 and CDK7 are essential for SiNP-induced autophagy activation in mammalian cells.
Next, we examined the effects of Cdk4 or Cdk7 knockdown in autophagosome accumulation. After the silence of Cdk4 or Cdk7 for 48 h, GFP-LC3 NRK cells were treated with 16-nm SiNPs at 60 μg/mL for 0, 16, 20, and 24 h. We found the knockdown of Cdk4 or Cdk7 had significantly reduced the GFP-LC3 puncta since the 16th hour (). Furthermore, we used rSiNPs to treat Cdk4 or Cdk7 silenced GFP-LC3 NRK cells for 0, 16, 20, and 24 h, respectively. Besides the decrease of GFP-LC3 puncta, we also observed a decreased number of yellow dots merged from the co-localization of rSiNPs and the GFP-LC3 puncta (Figure S3A–D). The results indicated CDK4 and CDK7 contribute to autophagosome accumulation through SiNP-induced autophagy activation.
To determine whether CDK4 and CDK7 are also involved in the autophagic flux blockage, we knocked down the Cdk4 or Cdk7 mRNAs of NRK cells in the absence or presence of 8 h pre-treatment with CQ and followed by the treatment of 16-nm SiNPs at 60 μg/mL for 24 h. Upon the CQ pre-treatment, the immunoblotting results showed that knockdown of Cdk4 or Cdk7 did not influence the significant decrease of the LC3-II level in SiNP-treated cells (Figure S3E–J). In this regard, our results supported that Cdk4 and Cdk7 were required for autophagy activation but not autophagic flux blockage in NRK cells treated with SiNPs.
The kinase inhibitor specific for CDK4 or CDK7 blocks SiNP-induced autophagy activation
Next, we investigated whether inhibition of the kinase activity of CDK4 or CDK7 would block or attenuate SiNP-induced autophagy activation by using two small-molecule compounds of ON123300 and THZ1 that specifically inhibit CDK4 and CDK7, respectively [Citation52,Citation53]. The GFP-LC3 NRK cells were incubated with the inhibitor ON123300 for 24 h, followed by the treatment of 16-nm SiNPs for 0, 12, 16, 20, and 24 h, respectively. From the results, we observed that the number of GFP-LC3 puncta in cells treated with ON123300 was significantly diminished over that of untreated cells after 12 and 16 h (). A similar result was also obtained when GFP-LC3 cells NRK were incubated with ON123300 and followed by the treatment of rSiNPs (Figure S4A,B). The immunoblotting analysis revealed that the protein level of LC3-II was reduced, whereas both protein and phosphorylation levels of CDK4 were also decreased with the incubation of ON123300, followed by the treatment of 16-nm SiNPs (). In the context of 8 h pre-treatment with CQ, we found that the inhibition of Cdk4 did not influence the significant decrease of the LC3-II level in SiNP-treated cells (Figure S4C–F).
Figure 8. The inhibition of CDK4 or CDK7 by kinase inhibitors blocks autophagy activation induced by SiNPs. (A) GFP-LC3 NRK cells were incubated with the inhibitor ON123300 for 24 h, and then treated with 16-nm SiNP at 60 μg/mL for 0, 12, 16, 20 or 24 h. Scale bar: 10 μm. (B) The GFP-LC3 puncta were observed and measured by confocal microscopy, and the number of GFP-LC3 puncta was quantified in ≥ 30 cells. (C) The immunoblotting analysis of the LC3-II expression in NRK cells, which were treated with ON123300 or DMSO for 24 h and then stimulated by 16-nm SiNPs. The relative expression of (D) LC3-II, (E) CDK4 or (F) p-CDK4 was calculated by the ratio of LC3-II:ACTB, CDK4:ACTB or p-CDK4:ACTB, respectively. (G) GFP-LC3 NRK cells were incubated with the inhibitor THZ1 for 24 h and then treated with 16-nm SiNP at 60 μg/mL for 0, 12, 16, 20 or 24 h. Scale bar: 10 μm. (H) The GFP-LC3 puncta were observed and measured by confocal microscopy, and the number of GFP-LC3 puncta was quantified in ≥ 30 cells. (I) The immunoblotting analysis of LC3-II in NRK cells, which were treated with THZ1 or DMSO and then stimulated by 16-nm SiNPs. The relative expression of (J) LC3-II, (K) CDK7 or (L) p-CDK7 was calculated by the ratio of LC3-II:ACTB, CDK7:ACTB or p-CDK7:ACTB, respectively. * p < 0.05; *** p < 0.001
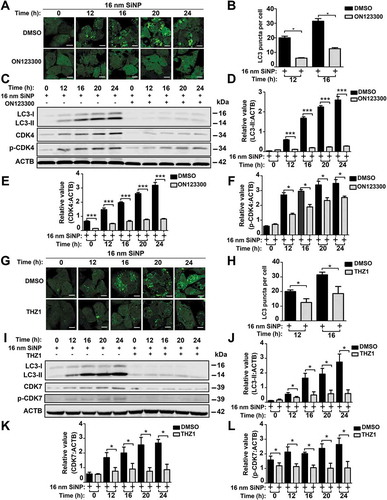
The same procedure was conducted for CDK7 by using its specific inhibitor of THZ1. The fluorescent assay demonstrated that autophagosome accumulation was greatly slowed down when the cells were exposed to THZ1 for 24 h (). When THZ1 blocked CDK7 in GFP-LC3 NRK cells with rSiNP treatment, we also observed that there was a significant decrease in the number of GFP-LC3 puncta, as well as yellow dots merged from the co-localization of rSiNPs and GFP-LC3 puncta (Figure S5A,B). Further immunoblotting results indicated that the inhibition of CDK7 decreased the LC3-II level (). In the absence or presence of 8 h pre-treatment with CQ, we found that the inhibition of Cdk7 did not alter the significant decrease of the LC3-II level in SiNP-treated cells (Figure S5C–F).
Together, our results demonstrated that the inhibition of CDK4 or CDK7 kinase activity dramatically attenuated autophagy activation by SiNPs. We concluded that protein kinases CDK4 and CDK7 play an important role in the regulation of SiNP-induced autophagy activation but not autophagic flux blockage.
SiNP-induced intracellular stresses contribute to CDK7 and CDK4 activation
It has been reported that various intracellular stresses, including DNA damage stress, ER stress, and ROS, can be stimulated by internalized nanoparticles to participate in triggering excessive autophagy activation [Citation17,Citation22,Citation23]. Thus, there might be a potential link between SiNP-induced stresses and the activation of CDK7 and CDK4 for autophagy induction.
According to the GO- and KEGG-based enrichment analyses for the multi-omics data, we found that a GO biological process of cellular response to DNA damage stimulus (GO: 0006974) ( and S6A) and a KEGG pathway of base excision repair (KEGG ID: 03410) were enriched in at least one omic layer (Figure S6B). Thus, DNA damage stimulus might be involved in the activation of CDK7 or CDK4 upon SiNP treatment. To test this hypothesis, we incubated NRK cells for 24 h with etoposide, a widely used DNA damage inducer [Citation5], in the absence or presence of 8 h pre-treatment with CQ. We found that etoposide incubation significantly enhanced the protein level of LC3-II and promoted the protein and phosphorylation levels of CDK7 and CDK4 (–F). The blockage of autophagic flux by CQ did not influence the molecular changes of CDK7 and CDK4 ().
Figure 9. SiNP-induced intracellular stresses contribute to CDK7 and CDK4 activation in NRK cells. (A) NRK cells were pre-incubated with 10 μM CQ for 8 h, and then stimulated by 0.1 μM etoposide for 24 h. The relative expression of (B) LC3-II, (C) CDK4, (D) p-CDK4, (E) CDK7, or (F) p-CDK7 was calculated by the ratio of LC3-II:ACTB, CDK4:ACTB, p-CDK4:ACTB, CDK7:ACTB, or p-CDK7:ACTB, respectively. (G) NRK cells were pre-treated with 10 μM CQ for 8 h, and followed by 0.1 μg/mL tunicamycin treatment for 6 h. The relative expression of (H) LC3-II, (I) CDK4, (J) p-CDK4, (K) CDK7, or (L) p-CDK7 was calculated by the ratio of LC3-II:ACTB, CDK4:ACTB, p-CDK4:ACTB, CDK7:ACTB, or p-CDK7:ACTB, respectively. (M) NRK cells were pre-incubated with 10 μM CQ for 8 h, and then stimulated by 10 μM H2O2 for 6 h. The relative expression of (N) LC3-II, (O) CDK4, (P) p-CDK4, (Q) CDK7, or (R) p-CDK7 was calculated by the ratio of LC3-II:ACTB, CDK4:ACTB, p-CDK4:ACTB, CDK7:ACTB, or p-CDK7:ACTB, respectively. * p < 0.05
Also, we observed a GO term of response to endoplasmic reticulum stress (GO: 0034976) and a KEGG pathway of protein processing in the endoplasmic reticulum (KEGG ID: 04141) were statistically over-represented in 2 omic layers (Figure S6A,B). Previously, Wei et al. reported SiNPs accumulated in the ER to trigger autophagy activation [Citation17]. In order to test whether ER stress contributes in activating CDK7 or CDK4, we treated NRK cells for 6 h with tunicamycin, an ER stress inducer [Citation5], in the absence of or presence of CQ pre-treatment for 8 h. Upon tunicamycin treatment, the LC3-II level was increased, and protein levels of both CDK7 and CDK4 were elevated (–L). However, the phosphorylation level of CDK7 but not CDK4 was increased, indicating that the kinase activity of CDK7 was upregulated by tunicamycin. Again, adding CQ did not influence the results of CDK7 and CDK4 ().
Moreover, a GO term of response to reactive oxygen species (GO: 0000302) and a KEGG pathway of oxidative phosphorylation (KEGG ID: 00190) were enriched in at least one omic layer (Figure S6A,B), indicating that ROS might also participate in CDK4 or CDK7 activation. Thus, we used hydrogen dioxide (H2O2), a commonly used ROS inducer [Citation54], to treat NRK cells for 6 h in the absence or presence of CQ pre-incubation for 8 h. Our results showed that H2O2 treatment increased the LC3-II level, as well as the protein levels of both CDK7 and CDK4 (). It should be noted that H2O2 activated only CDK4 but not CDK7, and the pre-treatment of CQ did not alter the results of CDK7 and CDK4 ().
In addition, we observed a GO term or KEGG pathway named endocytosis (GO: 0006897 and KEGG ID: 04144) were significantly over-represented at the mRNA, protein, and phosphorylation levels (Figure S6A,B). Thus, after the internalization of SiNPs, various cellular stimuli, such as DNA damage stress, ER stress, and ROS, might be induced to promote CDK7 and CDK4 activation synergistically.
Discussion
Autophagy plays important but divergent roles in various physiological and pathological processes, such as embryonic development, nutrient deficiency, neurodegenerative disorders, and cancer [Citation1–5]. Previous studies reported that the endocytosis of SiNPs elevates a variety of stress stimuli, such as ROS, ER stress, and DNA damage [Citation13,Citation14,Citation18,Citation20–25], and subsequently induces autophagy activation in mammalian cells [Citation14,Citation17,Citation19,Citation22,Citation24]. It was reported that both excessive autophagy activation and autophagic flux blockage contribute to SiNP-mediated autophagy dysfunction [Citation20,Citation22,Citation25], and SiNPs block autophagic flux through inhibiting lysosomal acidification and degradation [Citation20–23]. Although the exact mechanisms of how SiNPs activate autophagy are not clear, it was reported that at least 4 ATG genes including ATG5, ATG12, BECN1, and LC3, as well as 3 autophagy regulators, including SQSTM1, MTOR, and BCL2 (B cell leukemia/lymphoma 2 apoptosis regulator), are affected upon SiNP treatment [Citation19,Citation22,Citation23,Citation25,Citation27,Citation42]. Here, we carried out a multi-omics profiling of transcriptomes, proteomes, and phosphoproteomes during SiNP-induced autophagy, and observed that 23 Atg genes and 35 autophagy regulators were significantly changed in at least one omic layer ( and Table S5). Four previously reported genes of Becn1, Lc3, Sqstm1, and Mtor were covered by our results.
Size, dose, and time are crucial factors to determine SiNP-triggered cellular responses, which can be very different upon various treatments in distinct mammalian cells [Citation18,Citation19,Citation21,Citation25,Citation27]. For example, Li et al. found that cytotoxic effects were significantly induced in human BEAS-2B cells, which were treated with 40-nm or 60-nm SiNPs with a final concentration of 12.5 or 25 μg/mL for 24 h. Under the same conditions, the 2 sizes of SiNPs induced autophagy dysfunction through excessive autophagy activation and autophagy flux blockage [Citation25]. Also, Marquardt et al. revealed that the induction of autophagy activation after treatment by SiNPs was time- and dose-dependent in RAW264.7 macrophages and a low concentration of 30 μg/mL with 6 h treatment significantly reduced cell survival [Citation24]. It should be noted that they used 12-nm SiNPs, which were agglomerated with a hydrodynamic diameter of 220 nm in DMEM. Thus, the 3 sizes of SiNPs used in our study might be internalized mainly through the caveolae/lipid raft-mediated endocytosis. In contrast, Marquardt’s 220-nm SiNPs might enter the RAW264.7 macrophages through phagocytosis and/or the clathrin-mediated process. In addition, Zhao et al. generated a pulmonary fibrosis animal model by anesthetizing the Institute of Cancer Research male mice at 6 weeks with chloral hydrate and instilling the mice with 27-nm SiNPs at a dose of 5.0 mg/kg that was reported to induce a fibrogenic effect [Citation55]. They found 27-nm SiNPs were accumulated in instilled mouse lung tissues, and that autophagy dysfunction and subsequent apoptosis in the alveolar epithelial cells were involved in SiNPs-induced pulmonary fibrosis [Citation55].
In contrast to autophagy dysfunction, SiNP-induced autophagy can also be non-cytotoxic or even beneficial to cells. For example, Nowak et al. discovered 20-nm SiNPs induced autophagy activation in human A549 cells but did not show significant cytotoxic effects with a final concentration of < 250 μg/mL at 72 h [Citation27]. Also, Ha et al. treated murine MC3T3-E1 cells by 50-nm SiNPs at 60 μg/mL for 20 h, which induced autophagy activation and autophagosome formation to increase bone mineral density and promote differentiation and mineralization of osteoblasts, with a therapeutic but not a cytotoxic effect [Citation19]. Interestingly, they individually inhibited the 3 endocytic pathways and found that only the caveolae/lipid raft-mediated pathway was required for the internalization of SiNPs in the osteoblasts [Citation19]. Previously, we synthesized 8 types of silica sub-microspheres with a diameter of 0.1, 0.2, 0.5, 0.7, 0.9, 1.1, 1.4, and 2.1 μm. Treated with a final concentration of 60 μg/mL for 24 h, we found that 0.5–0.7 μm silica particles induced the highest levels of autophagy activity among all particles, and typical structures of micropinocytosis were observed by SEM imaging during the endocytic process of silica sub-microspheres [Citation18]. Thus, nano- and submicron-sized silica particles enter cells dependent on the different endocytic pathways, which differentially influence the following autophagic effects [Citation18,Citation20].
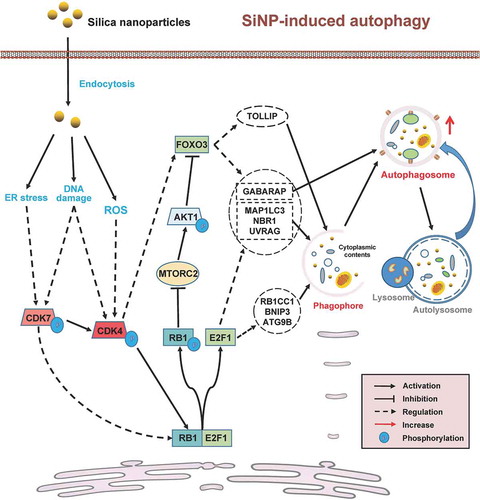
From the results, we observed that 16-nm SiNPs efficiently entered GFP-LC3 NRK cells after 3 h (). Thus, 16-nm SiNPs might fit the caveolae/lipid raft-mediated pathway better than larger sizes, have strength in cellular uptake efficiency on the premise of the same concentration and be relatively induce autophagy activation easier. Also, we found that 16-nm SiNPs at 60 μg/mL promote autophagy activation but inhibit autophagic flux ( and 2) without decreasing cell survival ( and S1B). With the help of cMAK, we predicted and discovered two protein kinases, CDK4 and CDK7, in regulating SiNP-triggered autophagy activation. Our results also showed that the protein and phosphorylation levels of CDK4 and CDK7 are potentiated upon SiNP stimulation. The activation of human CDK7 subsequently phosphorylates and activates its substrate, CDK4, which was reported to modify T821 and T826 residues in RB1 [Citation56]. The phosphorylation of RB1 enables the release of the transcription factor E2F1 (E2F transcription factor 1) from the RB1-E2F1 complex [Citation57]. Free E2F1 molecules enhance the transcriptional activation of numerous Atg genes and autophagy regulators [Citation58] (). Alternatively, phosphorylated RB1 interacts with MAPKAP1/SIN1 to repress the MTORC2 activity [Citation59]. MTORC2 inhibition increases autophagy activity by maintaining the transcriptional activity of FOXO3 (forkhead box O3) [Citation60] (). We carefully checked the potential substrates of CDK7 and CDK4 predicted by iGPS (Table S8). We found that a CDK4-specific p-site of rat RB1 T813, an equivalent p-site of human RB1 T821, was significantly upregulated by SiNPs with a 1.51-fold increase at the 16 h time point (Table S8). In addition, we observed a p-site of the rat FOXO3 at S283 was obviously upregulated by the nanomaterials, with a 2.38-fold increase at the 16 h time point. This p-site was predicted to be specifically modified by CDK4 (Table S8), and the result suggested that FOXO3 might also be directly regulated by CDK4. Since both E2F1 and FOXO3 are transcription factors, we further predicted their substrates from the multi-omics data and found that up to eight Atg genes and autophagy regulators, such as Atg9a, Lc3, Uvrag (UV radiation resistance associated gene), and Gabarap (GABA type A receptor-associated protein), were computationally characterized to be transcriptionally regulated by E2F1 or FOXO3 (). Interestingly, we found that all of these predicted genes are essential for phagophore initiation and autophagosome maturation [Citation42]. Thus, our results proposed that the CDK7-CDK4 signaling axis potentiates SiNP-induced autophagy by phosphorylating RB1, activating of E2F1 and FOXO3, and enhancing mRNA expression levels of a number of Atg genes and autophagy regulators ().
Figure 10. A computational model of SiNP-induced autophagy through the upregulation of the CDK7-CDK4 signaling axis. After SiNPs internalized by endocytosis, multiple cellular stresses, including DNA damage, ER stress, and ROS, were triggered to facilitate CDK7 or CDK4 activation synergistically. The activation of the CDK7-CDK4 cascade might potentiate SiNP-induced autophagy through phosphorylating RB1, activating of E2F1 and FOXO3, and enhancing mRNA expression levels of a number of Atg genes and autophagy regulators
Previous studies reported that CDK4 and CDK7 are essential in controlling cell cycle progression to promote human cancer [Citation28], and the two oncogenic kinases have been potent targets for cancer therapy [Citation52,Citation53,Citation61]. In our results, the activation of CDK4 and CDK7 might be harmful and might participate in tumorigenesis if deleterious somatic mutations were further harbored to maintain or enhance the aberrant kinase activities. In this regard, more attention should be paid to the application of bio-nanomaterials. Together, our studies not only identified key regulators in SiNP-induced autophagy but also developed a highly useful algorithm to integrate and analyze the multi-omics data. We anticipate cMAK can be extended to elucidate the mechanisms of the biological effects when cells are treated with other types of nanomaterials.
Materials and Methods
Cell culture and reagents
NRK and GFP-LC3 NRK cells were gifts from Prof. Li Yu (Tsinghua University). HepG2 cells were gifts from Prof. Ping Xu (National Center for Protein Sciences, China). HeLa cells were obtained from Prof. Xiaojun Xia (Sun Yat-Sen University). The cell lines were maintained in DMEM (Hyclone, SH30022.01) and supplemented with 10% fetal bovine serum (Gibco, 10060141), 100 U/mL penicillin and 100 mg/mL streptomycin (Hyclone, SV30010) at 37°C with 5% CO2 incubation. EBSS (24010-043) and BCA Protein Assay Kit (23225) were purchased from Thermo Fisher Scientific. Anti-LC3 (18725-AP) and anti-SQSTM1/p62 (18420-1-AP, 55274-1-AP) antibodies were purchased from Proteintech Group. Anti-LC3 (NB100-2220) antibodies were purchased from Novus Biologicals. Anti-CDK4 (A0366), anti-p-CDK4 (T172; AP0593), anti-CDK7 (A12942) and anti-ACTB (AC026) antibodies were from ABclonal Technology. Anti-p-CDK7 (T170; SAB4504143) antibody and dimethyl sulfoxide (DMSO; D2650), 3-MA (M9281), CQ (C6628) and H2O2 (88597) were from Sigma-Aldrich; Etoposide (T0132) was purchased from TargetMol. ON123300 (HY-12624), THZ1 (HY-80013), and tunicamycin (HY-A0098) were from MedChemExpress.
The preparation and characterization of SiNPs
The 3 sizes of SiNPs were prepared as previously described [Citation29]. First, 9.1 mg L-arginine (Sigma-Aldrich, W381918) was dissolved sufficiently into 6.9 mL water, and then 0.45 mL cyclohexane (Sigma-Aldrich, 227048) was supplemented into the water-arginine solution. The reaction was heated to 60°C by a water bath under a magnetic stirring apparatus. Second, adding 0.55 mL tetraethyl orthosilicate (TEOS; Sigma-Aldrich, 333859) into the reaction solution and keeping the reaction at the constant stirring and temperature for 20 h. Then, the smallest silica seeds were produced. The silica seeds with larger sizes were prepared using the regrowth approach. The carboxyl groups were carried on the surfaces of SiNPs. The size and particle morphology of synthesized SiNPs were characterized under the observation of TEM (JEM-1400, JEOL). The zeta potentials, hydrodynamic diameters, and PDI values of the SiNPs were determined by Zetasizer (Nano-ZS90, Malvern).
The rSiNPs were prepared by a modified Stöber method, as described before [Citation22,Citation29]. In brief, 5.4 mg rhodamine B (Solarbio Life Science, R8040-25) and 5 μL (3-aminopropyl)triethoxysilane (Sigma-Aldrich, A3648) was added to 1 mL absolute ethyl alcohol with a reaction time of 12 h at room temperature. Then, 260 mg L-arginine, 40 mL H2O, 180 mL ethyl alcohol and 10 mL SiNPs were mixed and heated to 45°C. After that, 16 g TEOS and 5 μL rhodamine B-coupled (3-aminopropyl)triethoxysilane were added into a mixed solution for further reaction. The mixture was centrifuged, and particles were washed, and they were finally dispersed in pure water.
Cell viability assay
The viability of NRK cells to SiNPs exposure was measured by using CCK-8 and LDH kit (Dojindo Laboratories, CK04 and CK12), respectively. The NRK cells (2.5 x 10⁴ cells/well) were seeded into a 96-well plate. Then, the cells were treated with a final concentration of 0, 60, 120, 240, or 480 μg/mL for 24 h. The CCK-8 or LDH solution was added to each well of the 96-well plate and was incubated for 1.5 h at 37°C by following the manufacturer’s instruction. The absorbance at 490 nm was detected using a microplate reader (Thermo Fisher Scientific, Multiskan FC).
Immunoblotting analysis
Cells were lysed with RIPA lysis buffer (Thermo Fisher Scientific, 89900) with complete protease inhibitor (Roche, 4693116001) and phosphatase inhibitors (Roche, 4906837001). The prepared samples were separated by SDS-PAGE gels, and the proteins were transferred to polyvinylidene difluoride (Millipore, ISEQ00010) membranes. The membranes were blocked with 5% nonfat milk (Solarbio Life Science, D8340) for 2 h and then incubated with the appropriate primary and secondary antibodies. The protein bands were detected by using the Li-COR Odyssey system, and the protein expression levels were quantified and analyzed by Image Studio software (LI-COR, Odyssey). The experiments were independently repeated ≥ 3 times. To ensure the band detection within a linear range, the protein bands of ACTB in was used as an example. The image brightness was gradually fine-tuned from light to dark, and the intensity value of ACTB was repeatedly calculated. A threshold was selected to allow the band detection within the linear range.
Transmission electron microscopy
The NRK cells were treated with 16-nm SiNPs for 24 h. Then, SiNP-treated cells were washed 3 times by phosphate-buffered saline (Thermo Fisher Scientific, 10010049). The cell pellets were fixed with glutaraldehyde resolved in PBS solution and washed 3 times with PBS, and then postfixed in osmium tetroxide solution, washed with PBS, dehydrated in a graded series of ethanol (MACKLIN, E809061), and embedded in SPI-Pon 812 resin (Structure Probe, 02660-AB). The ultrathin sections were cut using an ultramicrotome and stained by aqueous uranyl acetate and aqueous lead citrate, and then imaged with TEM.
Fluorescence microscopy
The 4 × 10⁴ GFP-LC3 NRK cells were seeded into the confocal dish. Then, the cells were transfected with siRNAs for 48 h or incubated with kinase inhibitors for 24 h, and then followed by 16-nm SiNPs or rSiNPs treatment for various time points. The fluorescence images were captured by using fluorescence microscopy (Olympus, FV1000). For detecting cellular uptake of SiNPs, the GFP-LC3 NRK cells were treated with 16-nm rSiNPs at 60 μg/mL for 0, 3, 8, 16, 20, and 24 h, and then fixed by polyformaldehyde solution and permeabilized by Triton X-100 (Sigma-Aldrich, T8787). The 200 uL Hoechst 33342 (Invitrogen, H3570) was used to stain nuclei for 10 min. Finally, the cells were washed 3 times with PBS, and images were analyzed using laser scanning confocal microscopy (Leica, Leica TCS SP5).
The measurement of autophagic flux vs. autophagy induction
An adenoviral vector carrying tfLC3 (HB-AP2100001) was purchased from HanBio (Shanghai, China). NRK cells expressing tfLC3 were generated by following the manufacturer’s instruction. The 4 × 10⁴ tfLC3 NRK cells were plated into the confocal dish for 24 h and treated with 16-nm SiNPs at 60 μg/mL for 0, 3, 8, 16, and 24 h. The fluorescence microscopy (Olympus, FV1000) was used to capture the fluorescence images. In each condition, numbers of red dots and yellow dots were quantified and analyzed in ≥ 30 tfLC3 NRK cells. The total dots were calculated as the sum of red dots and yellow dots. In untreated cells, the average numbers of red dots and total dots were counted as R0 and T0, respectively. In tfLC3 NRK cells treated with EBSS or SiNPs, the average numbers of red dots and total dots were counted as Ri and Ti, respectively. Then the ratio of autophagic flux vs. autophagy induction was calculated as below:
Cell sample preparation for the multi-omics profiling
NRK cells were treated with 16-nm SiNPs at the final concentration of 60 μg/mL for 0, 8, 16, 20, and 24 h, respectively. At each time point, >2 × 10⁶ cells were collected and resolved in TRIzol (Thermo Fisher Scientific, 15596018) for RNA extraction. For proteomic and phosphoproteomic quantification, >2 × 10⁷ cells were harvested and frozen with liquid nitrogen for protein extraction. For each time point, 3 independent biological replicates were prepared.
RNA-Seq library preparation and sequencing
The concentration (ng/μL) and quality (A260/A280) of the total RNAs were determined using a Nanodrop 2000 spectrophotometer (Thermo Fisher Scientific, USA) and the integrity of the RNAs was tested on an Agilent Technologies 2100 Bioanalyzer. High quality total RNAs in an equal amount per sample was used to construct the RNA-Seq libraries. Each RNA-Seq library was constructed by VAHTS Stranded mRNA-seq Library Prep Kit for Illumina (Vazyme, NR602-02). The library products were sequenced on the HiSeq 4000 system (Illumina, San Diego, CA).
Total protein extraction
Cell pellets were lysed with lysis buffer (8 M urea; Sigma-Aldrich, 554693) supplemented with Phosphatase Inhibitor Cocktail (Merck, 524625) and Protease Inhibitor Cocktail (Merck, 539137) on ice using a high-intensity ultrasonic processor (Scientz) for 10 min. The supernatants were collected after centrifuging at 20,000 x g for 10 min at 4°C. The protein concentration was determined with a BCA kit (Thermo Fisher Scientific, 23225).
HPLC fractionation and phosphopeptide enrichment
After digestion with trypsin (MACKLIN, T819144), the sample was fractionated by high-pH reverse-phase HPLC using the Thermo Fisher Scientific BETASIL C18 column (5 μm particles, 4.6 mm, 250 × 10 mm, SN: 10428834). The peptides were separated into 80 fractions with a gradient of 8% to 32% acetonitrile (Sigma-Aldrich, 271004) over 90 min. Then, the peptides were combined into 16 fractions and dried by vacuum centrifugation.
The peptide mixtures were first incubated with Ti4+-immobilized metal affinity chromatography (J&K Scientific, 2749380) microsphere suspension with vibration in loading buffer (50% acetonitrile (Sigma-Aldrich, 271004) and 6% trifluoroacetic acid (Sigma-Aldrich, T6508). The IMAC microspheres with enriched phosphopeptides were collected by centrifugation, and the supernatant was removed. To remove nonspecifically adsorbed peptides, the IMAC microspheres were washed 3 times sequentially with 50% acetonitrile, 6% trifluoroacetic acid, 30% acetonitrile, and 0.1% trifluoroacetic acid. Then, the elution buffer containing 10% NH4OH (MACKLIN, A801009) was added, and the enriched phosphopeptides were eluted. The supernatant containing phosphopeptides was collected and lyophilized for LC-MS/MS analysis.
LC-MS/MS analysis
The tryptic peptides were dissolved in 0.1% formic acid (solvent A; Sigma-Aldrich, 27001), all at a constant flow rate of 700 nL/min on an EASY-nLC 1000 ultra-performance liquid chromatography system. The gradient was comprised of an increase from 5% to 8% solvent B (0.1% formic acid in 98% acetonitrile) for 13 min, 8% to 18% in 30 min, 19% to 32% in 22 min, finally holding at 95% for the last 30 min. The peptides were subjected to NSI source followed by MS/MS in Q ExactiveTM Plus (Thermo Fisher Scientific) coupled online to the ultra-performance liquid chromatography. The electrospray voltage applied was 2.0 kV. The m/z scan range was 350 to 1600 for full scan, and intact peptides were detected in the Orbitrap at a resolution of 60,000. Then, peptides were selected for MS/MS using NCE, and the fragments were detected in the Orbitrap at a resolution of 30,000. Fixed first mass was set as 100 m/z. Automatic gain control was set at 5E4. A data-dependent procedure alternated between one MS scan followed by 20 MS/MS scans with 15.0 s dynamic exclusion.
Database Search
For the proteomic and phosphoproteomic data, the raw MS/MS data were processed using the MaxQuant search engine (v.1.5.3.30). The rat proteome sequence set was downloaded from Ensembl (http://asia.ensembl.org/index.html) [Citation62]. For one gene with multiple alternatively splicing isoforms, only the longest protein sequence was reserved. After the redundancy clearance, 21,945 unique rat proteins were reserved. To ensure the data quality, we constructed a reference database by using only genes with a considerably higher expression level (FPKM ≥ 1 in at least one sample). In total, the reference database was constructed with 10,813 unique rat protein sequences. Trypsin/P was specified as the cleavage enzyme. The mass tolerance for precursor ions was set as 20 ppm in the First search and 4.5 ppm in the Main search. Carbamidomethylation on Cys was specified as fixed modification. Oxidation on Met, acetylation protein N-termini, and pS/pT/pY modifications were specified as variable modifications. Instrument type was Orbitrap. The false discovery rates for the peptide-spectrum match, protein and p-site decoy fraction were all set to < 1%, and the minimum score for modified peptides was set to > 40. All the other parameters in MaxQuant were set to default values.
Detection of differentially regulated genes, proteins and p-sites
Here, we used the 0 h data as the background, and compared with the transcriptomic, proteomic and phosphoproteomic data sets of 8, 16, 20, and 24 h samples to detect differentially regulated mRNAs, proteins and p-sites, respectively. For the transcriptional level, Bowtie, TopHat, and Cufflinks were used for gene alignment, assembly, and quantification [Citation39]. The FPKM value was adopted and calculated to estimate the mRNA expression levels of genes. The genes with significantly changed FPKM values for at least one time point were regarded as differentially regulated genes, based on the output results of Cufflinks.
For the proteomic data, Perseus, a widely used shotgun proteomics data analysis tool, was adopted here for the statistical analysis. The significant changes of protein intensities were detected by using Student’s t-test (p-value < 0.05) integrated with Perseus [Citation40]. For the raw phosphoproteomic data, we first merged 3 replicates into a single data set. For p-sites identified in only one experiment, their corresponding phospho-peptide intensities were directly adopted. For p-sites identified in 2 replicates, the average values of phosphopeptide intensities were used. For p-sites identified in 3 replicates, the median intensity values were reserved. Then, the global centering normalization strategy was used [Citation41], and the average intensity value of all p-sites was first normalized to 1 (mean = 1) for each time point. A factor of 1.5 (> 1.5-fold or < 0.67-fold) was used as the threshold for detecting differentially regulated p-sites.
Public phosphorylation databases
Experimentally identified p-sites in R. norvegicus were downloaded from 5 public phosphorylation databases, including dbPAF [Citation34], dbPTM [Citation35], Phospho.ELM [Citation36], PhosphoSitePlus [Citation37], and UniProt [Citation38]. Different data sets were integrated, and redundancy was cleared. In total, we obtained 32,275 non-redundant p-sites from 7,750 rat phosphoproteins.
The collection of Atg genes and autophagy regulators
Previously, we developed a comprehensive data resource of THANATOS for the collection, annotation, and biocuration of proteins and PTMs involved in autophagy and cell death pathways [Citation3]. Here, 34 known or potentially orthologous Atg genes in R. norvegicus were directly taken from THANATOS (http://thanatos.biocuckoo.org/) [Citation3]. All collected autophagy regulators in R. norvegicus, H. sapiens, and Mus musculus were obtained from THANATOS [Citation3]. For human and mouse proteins, their potential rat orthologues were computationally determined through a classical approach of reciprocal best hits (RBHs) [Citation63]. In total, 1,060 known and potential autophagy regulators in R. norvegicus were integrated for further analyses. In addition, we referred to a previously published review and selected 55 well-known autophagy regulators [Citation42].
The enrichment analyses
To evaluate whether the 1,060 known and potential autophagy regulators were statistically enriched in differentially regulated mRNAs, proteins and phosphoproteins, here we defined:
N = number of rat genes (N = 21,945)
n = number of rat autophagy regulators (n = 1,060)
M = number of differentially regulated mRNAs, proteins or phosphoproteins
m = number of autophagy regulators in differentially regulated mRNAs, proteins or phosphoproteins
Then, the enrichment ratio (E-ratio) of each level was computed, and the p-value was calculated with the hypergeometric distribution as below:
(E-ratio ≥ 1), or
(E-ratio < 1)
The hypergeometric test was also adopted for the GO- and KEGG-based enrichment analyses. GO annotation files (on 7 November 2018) were downloaded from the Gene Ontology Consortium Web site (http://www.geneontology.org/) and contained 17,638 rat proteins annotated with at least one GO term [Citation64]. KEGG annotation files (released on 1 July 2018) were downloaded from the ftp server of KEGG (ftp://ftp.bioinformatics.jp/) [Citation65], which contained 7,592 annotated genes in R. norvegicus.
The cMAK algorithm
The first step of cMAK was the prediction of potential ssKSRs for all quantified p-sites by using a previously developed tool of iGPS, which supported five eukaryotes, including H. sapiens, M. musculus, D. melanogaster, C. elegans, and S. cerevisiae [Citation43]. Due to the absence of R. norvegicus in iGPS, here, we directly chose the human predictor with default parameters of the “Low threshold” and “Experiment/STRING PPI.” From the prediction results, the orthologues of the human kinases in R. norvegicus were computationally determined by RBHs [Citation63].
Second, we formalized a new concept of QKS to measure a kinase state by considering the sum of normalized intensity values of p-sites in its substrates based on the hypothesis that the numbers and phosphorylation levels of substrates might reflect the kinase importance. For each time point, the raw intensity value of each p-site (IVP) in the merged data set was first normalized and divided by 1 × 10⁶. Then, the QKS score of a kinase i in sample A was calculated as below:
Here, n is the number of substrates of the kinase i. Then, the QKS value of all kinases (k) in sample A was calculated as below:
Using the 0 h data set as the control (C), we compared it in a pairwise manner to time points of 8, 16, 20, and 20 h (Treatment, T). The Yate’s chi-squared test was then used to compare the QKS values between control and treatment following a Chi-square 2 × 2 contingency table:
Table
The χ2 was calculated as below:
The p-values (< 0.0001) were computed through the Excel function of CHIDIST(x2, degree_freedom), and the degree_freedom is equal to 1. Only kinases with significant p-values in ≥ 3 time points were reserved.
In the final step, the transcriptional, proteomic, and phosphoproteomic data of predicted kinases were considered to reduce potentially false-positive hits. The predicted kinases with differentially regulated mRNAs in ≥ 2 time points, changed proteins in ≥ 1 time point, or altered p-sites in ≥ 1 time point were reserved. Additionally, we carefully checked the literature and reserved kinases that were previously reported to be involved in autophagy. Predicted kinases without any additional evidence were discarded.
RNA interference and kinase inhibitor treatment
Cells were transfected with 100-nm siRNAs by Lipofectamine RNAi Max (Invitrogen, 13778150) for 48 h according to the manufacturer’s instructions, and then treated with 16-nm SiNPs at 60 μg/mL for 24 h. For 3-MA or CQ treatment, cells were incubated with 3-MA or CQ for 8 h, and then followed by 16-nm SiNP treatment for 24 h. For kinase inhibitor treatment, cells were incubated with 3 μM ON123300 (kinase inhibitor for CDK4) or 50 nM THZ1 (kinase inhibitor for CDK7) for 24 h, and then stimulated with 16-nm SiNPs at 60 μg/mL for 24 h. The immunoblotting analysis was performed as previously described [Citation66], and the number of GFP-LC3 puncta was observed by the confocal microscopy (Olympus, FV1000) and calculated as previously described [Citation67].
The prediction of transcription factor targets
The potential substrates of E2F1 and FOXO3 in H. sapiens were downloaded from a recently developed database hTFtarget (http://bioinfo.life.hust.edu.cn/hTFtarget#!/), which was a comprehensive resource of human transcription factor targets. Their orthologous genes in R. norvegicus were computationally determined by RBHs [Citation63]. To ensure the data quality, the transcriptomic data were re-analyzed and only predicted targets with significant changes of mRNAs in ≥ 3 time points were considered to be bona fide substrates of E2F1 and FOXO3 in R. norvegicus, with high confidence.
Data Availability
The RNA-seq data were deposited into NCBI Sequence Read Archive (SRA, https://www.ncbi.nlm.nih.gov/sra) with the dataset identifier SRP160412. The raw mass spectrometric data of proteomes and phosphoproteomes was submitted into the integrated proteome resources (iProX, http://www.iprox.org/) [Citation68] with the dataset identifier PXD012196.
Statistical analysis
For all experiments, statistical analyses were performed by using the one-tail student’s t-test. Mean value and standard deviation (S.D.) were calculated ≥ 3 independently repeated experiments. The error bars indicate the S.D, and p-value < 0.05 was considered to be statistically significant.
Supplemental Material
Download Zip (84.3 MB)Acknowledgments
The authors would like to thank Prof. Li Yu (Tsinghua University), Prof. Cong Yi (Zhejiang University), Prof. Ping Xu (National Center for Protein Sciences, China) and Prof. Xiaojun Xia (Sun Yat-Sen University) for their great help on cells and reagents sharing, and helpful suggestions on experiments. This work was supported by grants from the Special Project on Precision Medicine under the National Key R&D Program (2017YFC0906600 and 2018YFC0910500), the Natural Science Foundation of China (31930021, 31970633, 81701567, 21771148, 31671360 and 31801095), Young Changjiang Scholars Program of China, the program for HUST Academic Frontier Youth Team, the Fundamental Research Funds for the Central Universities (20720180033, 20720200005, 2017KFXKJC001 and 2019kfyRCPY043), and China Postdoctoral Science Foundation (2018M642816, 2018M632870, and 2019T120648). The manuscript has been edited by American Journal Experts (AJE) prior to submission.
Disclosure statement
No potential conflict of interest was reported by the authors.
Supplementary material
Supplemental data for this article can be accessed here
Correction Statement
This article has been republished with minor changes. These changes do not impact the academic content of the article.
Additional information
Funding
References
- Ohsumi Y. Historical landmarks of autophagy research. Cell Res. 2014;24:9–23. PMID:24366340.
- Xie Y, Kang R, Sun X, et al. Posttranslational modification of autophagy-related proteins in macroautophagy. Autophagy. 2015;11:28–45. PMID:25484070.
- Deng W, Ma L, Zhang Y, et al. THANATOS: an integrative data resource of proteins and post-translational modifications in the regulation of autophagy. Autophagy. 2018;14:296–310. PMID:29157087.
- Yu L, Chen Y, Tooze SA. Autophagy pathway: cellular and molecular mechanisms. Autophagy. 2018;14:207–215. PMID:28933638.
- Klionsky DJ, Abdelmohsen K, Abe A, et al. Guidelines for the use and interpretation of assays for monitoring autophagy (3rd edition). Autophagy. 2016;12:1–222. PMID:26799652.
- Nakagawa I, Amano A, Mizushima N, et al. Autophagy defends cells against invading group A Streptococcus. Science. 2004;306:1037–1040. PMID:15528445.
- Nishimura T, Tamura N, Kono N, et al. Autophagosome formation is initiated at phosphatidylinositol synthase-enriched ER subdomains. Embo J. 2017;36:1719–1735. PMID:28495679.
- Xie Z, Klionsky DJ. Autophagosome formation: core machinery and adaptations. Nature Cell Biol. 2007;9:1102–1109. PMID:17909521.
- Yu L, McPhee CK, Zheng L, et al. Termination of autophagy and reformation of lysosomes regulated by mTOR. Nature. 2010;465:942–946. PMID:20526321.
- Ma X, Wu Y, Jin S, et al. Gold nanoparticles induce autophagosome accumulation through size-dependent nanoparticle uptake and lysosome impairment. ACS Nano. 2011;5:8629–8639. PMID:21974862.
- Levine B, Kroemer G. Autophagy in the pathogenesis of disease. Cell. 2008;132:27–42. PMID:18191218.
- Jiang P, Mizushima N. Autophagy and human diseases. Cell Res. 2014;24:69–79. PMID:24323045.
- Tang F, Li L, Chen D. Mesoporous silica nanoparticles: synthesis, biocompatibility and drug delivery. Adv Mater. 2012;24:1504–1534. PMID:22378538.
- Chou CC, Chen W, Hung Y, et al. Molecular elucidation of biological response to mesoporous silica nanoparticles in vitro and in vivo. ACS Appl Mater Interfaces. 2017;9:22235–22251. PMID:28608695.
- Lee SB, Kim HL, Jeong HJ, et al. Mesoporous silica nanoparticle pretargeting for PET imaging based on a rapid bioorthogonal reaction in a living body. Angew Chem Int Ed Eng. 2013;52:10549–10552. PMID:23956036.
- Castillo RR, Lozano D, Gonzalez B, et al. Advances in mesoporous silica nanoparticles for targeted stimuli-responsive drug delivery: an update. Expert Opin Drug Deliv. 2019;16:415–439. PMID:30897978.
- Wei F, Wang Y, Luo Z, et al. New findings of silica nanoparticles induced ER autophagy in human colon cancer cell. Sci Rep. 2017;7:42591. PMID:28195184.
- Huang D, Zhou H, Gong X, et al. Silica sub-microspheres induce autophagy in an endocytosis dependent manner. RSC Adv. 2017;7:12496–12502.
- Ha SW, Weitzmann MN, Beck GR Jr. Bioactive silica nanoparticles promote osteoblast differentiation through stimulation of autophagy and direct association with LC3 and p62. ACS Nano. 2014;8:5898–5910. PMID:24806912.
- Stern ST, Adiseshaiah PP, Crist RM. Autophagy and lysosomal dysfunction as emerging mechanisms of nanomaterial toxicity. Part Fibre Toxicol. 2012;9:20. PMID:22697169.
- Zabirnyk O, Yezhelyev M, Seleverstov O. Nanoparticles as a novel class of autophagy activators. Autophagy. 2007;3:278–281. PMID:17351332.
- Wang J, Li Y, Duan J, et al. Silica nanoparticles induce autophagosome accumulation via activation of the EIF2AK3 and ATF6 UPR pathways in hepatocytes. Autophagy. 2018;14:1185–1200. PMID:29940794.
- Mohammadinejad R, Moosavi MA, Tavakol S, et al. Necrotic, apoptotic and autophagic cell fates triggered by nanoparticles. Autophagy. 2019;15:4–33. PMID:30160607.
- Marquardt C, Fritsch-Decker S, Al-Rawi M, et al. Autophagy induced by silica nanoparticles protects RAW264.7 macrophages from cell death. Toxicology. 2017;379:40–47. PMID:28161448.
- Li Q, Hu H, Jiang L, et al. Cytotoxicity and autophagy dysfunction induced by different sizes of silica particles in human bronchial epithelial BEAS-2B cells. Toxicol Res (Camb). 2016;5:1216–1228. PMID:30090427.
- Hua Y, Shen M, McDonald C, et al. Autophagy dysfunction in autoinflammatory diseases. J Autoimmun. 2018;88:11–20. PMID:29108670.
- Nowak JS, Mehn D, Nativo P, et al. Silica nanoparticle uptake induces survival mechanism in A549 cells by the activation of autophagy but not apoptosis. Toxicol Lett. 2014;224:84–92. PMID:24140553.
- Schachter MM, Merrick KA, Larochelle S, et al. A Cdk7-Cdk4 T-loop phosphorylation cascade promotes G1 progression. Mol Cell. 2013;50:250–260. PMID:23622515.
- Hartlen KD, Athanasopoulos AP, Kitaev V. Facile preparation of highly monodisperse small silica spheres (15 to >200 nm) suitable for colloidal templating and formation of ordered arrays. Langmuir. 2008;24:1714–1720. PMID:18225928.
- Heurtault B, Saulnier P, Pech B, et al. Physico-chemical stability of colloidal lipid particles. Biomaterials. 2003;24:4283–4300. PMID:12853260.
- Ni HM, Bockus A, Wozniak AL, et al. Dissecting the dynamic turnover of GFP-LC3 in the autolysosome. Autophagy. 2011;7:188–204. PMID:21107021.
- Kimura S, Noda T, Yoshimori T. Dissection of the autophagosome maturation process by a novel reporter protein, tandem fluorescent-tagged LC3. Autophagy. 2007;3:452–460. PMID:17534139.
- Tyanova S, Temu T, Cox J. The MaxQuant computational platform for mass spectrometry-based shotgun proteomics. Nat Protoc. 2016;11:2301–2319. PMID:27809316.
- Ullah S, Lin S, Xu Y, et al. dbPAF: an integrative database of protein phosphorylation in animals and fungi. Sci Rep. 2016;6:23534. PMID:27010073.
- Huang KY, Su MG, Kao HJ, et al. dbPTM 2016: 10-year anniversary of a resource for post-translational modification of proteins. Nucleic Acids Res. 2016;44:D435–46. PMID:26578568.
- Dinkel H, Chica C, Via A, et al. Phospho.ELM: a database of phosphorylation sites–update 2011. Nucleic Acids Res. 2011;39:D261–7. PMID:21062810.
- Hornbeck PV, Zhang B, Murray B, et al. PhosphoSitePlus, 2014: mutations, PTMs and recalibrations. Nucleic Acids Res. 2015;43:D512–20. PMID:25514926.
- UniProt Consortium T. UniProt: the universal protein knowledgebase. Nucleic Acids Res. 2018;46:2699. PMID:29425356.
- Trapnell C, Roberts A, Goff L, et al. Differential gene and transcript expression analysis of RNA-seq experiments with TopHat and Cufflinks. Nat Protoc. 2012;7:562–578. PMID:22383036.
- Tyanova S, Temu T, Sinitcyn P, et al. The Perseus computational platform for comprehensive analysis of (prote)omics data. Nat Methods. 2016;13:731–740. PMID:27348712.
- Kauko O, Laajala TD, Jumppanen M, et al. Label-free quantitative phosphoproteomics with novel pairwise abundance normalization reveals synergistic RAS and CIP2A signaling. Sci Rep. 2015;5:13099. PMID:26278961.
- Galluzzi L, Baehrecke EH, Ballabio A, et al. Molecular definitions of autophagy and related processes. EMBO J. 2017;36:1811–1836. PMID:28596378.
- Song C, Ye M, Liu Z, et al. Systematic analysis of protein phosphorylation networks from phosphoproteomic data. Mol Cell Proteomics. 2012;11:1070–1083. PMID:22798277.
- Kuo WL, Duke CJ, Abe MK, et al. ERK7 expression and kinase activity is regulated by the ubiquitin-proteosome pathway. J Biol Chem. 2004;279:23073–23081. PMID:15033983.
- Nolen B, Taylor S, Ghosh G. Regulation of protein kinases; controlling activity through activation segment conformation. Mol Cell. 2004;15:661–675. PMID:15350212.
- Zalckvar E, Berissi H, Mizrachy L, et al. DAP-kinase-mediated phosphorylation on the BH3 domain of beclin 1 promotes dissociation of beclin 1 from Bcl-XL and induction of autophagy. EMBO Rep. 2009;10:285–292. PMID:19180116.
- Ber Y, Shiloh R, Gilad Y, et al. DAPK2 is a novel regulator of mTORC1 activity and autophagy. Cell Death Differ. 2015;22:465–475. PMID:25361081.
- Zhang N, Cao MM, Liu H, et al. Autophagy regulates insulin resistance following endoplasmic reticulum stress in diabetes. J Physiol Biochem. 2015;71:319–327. PMID:25632827.
- Sunahara KK, Nunes FP, Baptista MA, et al. Insulin influences autophagy response distinctively in macrophages of different compartments. Cell Physiol Biochem. 2014;34:2017–2026. PMID:25562150.
- Garrett S, Barton WA, Knights R, et al. Reciprocal activation by cyclin-dependent kinases 2 and 7 is directed by substrate specificity determinants outside the T loop. Mol Cell Biol. 2001;21:88–99. PMID:11113184.
- Guo YP, Peng D, Zhou JQ, et al. iEKPD 2.0: an update with rich annotations for eukaryotic protein kinases, protein phosphatases and proteins containing phosphoprotein-binding domains. Nucleic Acids Res. 2019;47:D344–D50. PMID: 30380109.
- Divakar SK, Ramana Reddy MV, Cosenza SC, et al. Dual inhibition of CDK4/Rb and PI3K/AKT/mTOR pathways by ON123300 induces synthetic lethality in mantle cell lymphomas. Leukemia. 2016;30:86–93. PMID:26174628.
- Kwiatkowski N, Zhang T, Rahl PB, et al. Targeting transcription regulation in cancer with a covalent CDK7 inhibitor. Nature. 2014;511:616–620. PMID:25043025.
- Chen Y, McMillan-Ward E, Kong J, et al. Oxidative stress induces autophagic cell death independent of apoptosis in transformed and cancer cells. Cell Death Differ. 2008;15:171–182. PMID:17917680.
- Zhao X, Wei S, Li Z, et al. Autophagic flux blockage in alveolar epithelial cells is essential in silica nanoparticle-induced pulmonary fibrosis. Cell Death Dis. 2019;10:127. PMID:30755584.
- Takaki T, Fukasawa K, Suzuki-Takahashi I, et al. Preferences for phosphorylation sites in the retinoblastoma protein of D-type cyclin-dependent kinases, Cdk4 and Cdk6, in vitro. J Biochem. 2005;137:381–386. PMID:15809340.
- Rubin SM, Gall AL, Zheng N, et al. Structure of the Rb C-terminal domain bound to E2F1-DP1: a mechanism for phosphorylation-induced E2F release. Cell. 2005;123:1093–1106. PMID:16360038.
- Korah J, Canaff L, Lebrun JJ. The retinoblastoma tumor suppressor protein (pRb)/E2 promoter binding factor 1 (E2F1) pathway as a novel mediator of TGFbeta-induced autophagy. J Biol Chem. 2016;291:2043–2054. PMID:26598524.
- Liu P, Gan W, Inuzuka H, et al. Sin1 phosphorylation impairs mTORC2 complex integrity and inhibits downstream Akt signalling to suppress tumorigenesis. Nature Cell Biol. 2013;15:1340–1350. PMID:24161930.
- Mammucari C, Milan G, Romanello V, et al. FoxO3 controls autophagy in skeletal muscle in vivo. Cell Metab. 2007;6:458–471. PMID:18054315.
- Lapenna S, Giordano A. Cell cycle kinases as therapeutic targets for cancer. Nat Rev Drug Discov. 2009;8:547–566. PMID:19568282.
- Zerbino DR, Achuthan P, Akanni W, et al. Ensembl 2018. Nucleic Acids Res. 2018;46:D754–D61. PMID:29155950.
- Tatusov RL, Koonin EV, Lipman DJ. A genomic perspective on protein families. Science. 1997;278:631–637. PMID:9381173.
- The Gene Ontology C. Expansion of the Gene Ontology knowledgebase and resources. Nucleic Acids Res. 2017;45:D331–D8. PMID:27899567.
- Kanehisa M, Goto S, Sato Y, et al. Data, information, knowledge and principle: back to metabolism in KEGG. Nucleic Acids Res. 2014;42:D199–205. PMID:24214961.
- Peng D, Wang Z, Huang A, et al. A novel function of F-box protein FBXO17 in negative regulation of type I IFN signaling by recruiting PP2A for IFN regulatory factor 3 deactivation. J Immunol. 2017;198:808–819. PMID:27956528.
- Yi C, Tong J, Lu P, et al. Formation of a Snf1-Mec1-Atg1 module on mitochondria governs energy deprivation-induced autophagy by regulating mitochondrial respiration. Dev Cell. 2017;41:59–71e4. PMID:28399401.
- Ma J, Chen T, Wu S, et al. iProX: an integrated proteome resource. Nucleic Acids Res. 2019;47:D1211–D1217. PMID:30252093.