
ABSTRACT
Lysosomes, as primary degradative organelles, are the endpoint of different converging pathways, including macroautophagy. To date, lysosome degradative function has been mainly studied in interphase cells, while their role during mitosis remains controversial. Mitosis dictates the faithful transmission of genetic material among generations, and perturbations of mitotic division lead to chromosomal instability, a hallmark of cancer. Heretofore, correct mitotic progression relies on the orchestrated degradation of mitotic factors, which was mainly attributed to ubiquitin-triggered proteasome-dependent degradation. Here, we show that mitotic transition also relies on lysosome-dependent degradation, as impairment of lysosomes increases mitotic timing and leads to mitotic errors, thus promoting chromosomal instability. Furthermore, we identified several putative lysosomal targets in mitotic cells. Among them, WAPL, a cohesin regulatory protein, emerged as a novel SQSTM1-interacting protein for targeted lysosomal degradation. Finally, we characterized an atypical nuclear phenotype, the toroidal nucleus, as a novel biomarker for genotoxic screenings. Our results establish lysosome-dependent degradation as an essential event to prevent chromosomal instability.
Abbreviations: 3D: three-dimensional; APC/C: anaphase-promoting complex; ARL8B: ADP ribosylation factor like GTPase 8B; ATG: autophagy-related; BORC: BLOC-one-related complex; CDK: cyclin-dependent kinase; CENPE: centromere protein E; CIN: chromosomal instability; ConcA: concanamycin A; CQ: chloroquine; DAPI: 4,6-diamidino-2-penylinole; FTI: farnesyltransferase inhibitors; GFP: green fluorescent protein; H2B: histone 2B; KIF: kinesin family member; LAMP2: lysosomal associated membrane protein 2; MAP1LC3/LC3: microtubule associated protein 1 light chain 3; MEF: mouse embryonic fibroblast; MTOR: mechanistic target of rapamycin kinase; PDS5B: PDS5 cohesin associated factor B; SAC: spindle assembly checkpoint; PLEKHM2: pleckstrin homology and RUN domain containing M2; SQSTM1: sequestosome 1; TEM: transmission electron microscopy; ULK1: unc-51 like autophagy activating kinase 1; UPS: ubiquitin-proteasome system; v-ATPase: vacuolar-type H+-translocating ATPase; WAPL: WAPL cohesion release factor.
Introduction
Chromosomal instability (CIN) is defined as an abnormal gain or loss of chromosomes during cell division [Citation1] and positively correlates with poor cancer patient prognosis [Citation2]. The mechanisms underlying CIN remain poorly characterized but reflect abnormalities in kinetochore-microtubule attachment, sister chromatids cohesion, centrosome duplication, telomeres or the spindle assembly checkpoint (SAC) [Citation3].
To maintain genome integrity, the cell cycle must be tightly coordinated to ensure the faithful transmission of hereditary information between generations. Cells spend more than 90% of their time in interphase, and interphase length correlates with total length of the cell cycle [Citation4]. In contrast, mitosis time is extremely short, remarkably constant and uncoupled from the variability in other phases. Mitosis is the process by which a cell properly divides its genetic material and consists of five active phases from prophase to telophase. The major mitotic checkpoint known as SAC comprises the metaphase-to-anaphase transition, separating mitotic entry and exit. Coordination of the mitotic regulatory network relies on hierarchal phosphorylation cascades driven by cyclin-dependent kinases (CDKs) [Citation5,Citation6] and the ubiquitin-proteasome system (UPS) under the control of the anaphase-promoting complex (APC/C) [Citation7,Citation8]. During mitosis, known degradative functions are mainly restricted to UPS, specialized in ubiquitin-triggered protein degradation and presumably faster than lysosome-dependent degradation.
Lysosomes are acidic cytosolic vesicles responsible to enzymatically degrade all types of biological material. During macroautophagy/autophagy, double-membrane vesicles (autophagosomes) engulf cytosolic material, converge and fuse with lysosomes. The lysosomal proton pump vacuolar-type H+-translocating ATPase (v-ATPase) drives lumen acidification while the BLOC-one-related complex (BORC)-associated proteins, including KIF5B motor protein, is the main driver of anterograde lysosomal transport and also contributes to autophagosome-lysosome fusion [Citation9–11]. Autophagy-dependent degradation of cargos can either be nonselective (bulk) or targeted (selective). Receptor proteins, such as SQSTM1/p62 (sequestosome 1), regulate selective autophagy [Citation12,Citation13]. Being cytosolic vesicles, research on autophagy and lysosomes has mainly focused on interphase cells. As cells undergo mitosis, dramatic structural rearrangements of organelles occur [Citation14–16]. Recent studies present controversial observations about the function of lysosomes and autophagy in mitosis. Some of them claim that autophagy signaling is shut-down at mitotic entry, that autophagic structures are barely detected in dividing cells and that proteasome-dependent WIPI2 degradation upon mitotic induction suppresses autophagic flux [Citation17–20]. In contrast, lysosomal-dependent degradation has been implicated in CCNA2 (cyclin A2) proteolysis during mitosis [Citation21] and mitophagy has been shown to remain active in prophase [Citation22,Citation23]. ULK1 (unc-51 like autophagy activating kinase 1), an autophagy initiator protein, was shown to drive SAC recruitment to kinetochores through MAD1 L1 (mitotic arrest deficient 1 like 1) phosphorylation [Citation24]. Furthermore, selective autophagic degradation of centriolar satellites was recently demonstrated to support correct karyokinesis [Citation25,Citation26]. Loss of BECN1 (beclin 1), another key autophagic protein, induced gene amplification and consequent aneuploidy [Citation27]. Better understanding of the regulatory mechanisms driving mitotic transitions is crucial to prevent CIN and develop novel cancer treatment strategies.
Here, we show that correct mitotic progression does not rely only on UPS-dependent degradation. Dissecting the mitotic progression, we define a novel function of selective autophagy and lysosome-dependent degradation specifically in dividing cells and identify new mitotic lysosomal substrates. Furthermore, impairment of lysosome function during cell division triggers chromosome mis-segregation and induces a striking nuclear phenotype in progeny, the toroidal nucleus, which provides a new tool for genotoxicity tests.
Results
Lysosomes and autophagic vesicles are present and active during cell division
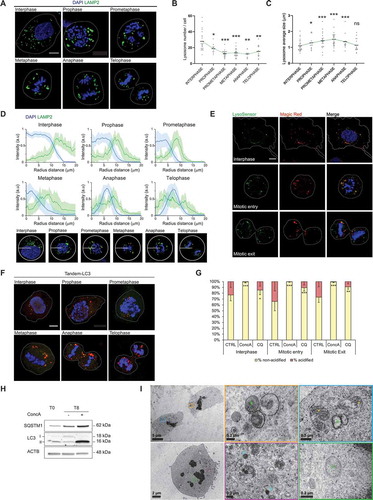
To investigate the presence of lysosomes in mitotic subphases, LAMP2-positive vesicles and DAPI-stained DNA were analyzed by immunofluorescence. Here, we showed that lysosomes are present and dynamic in all mitotic subphases ( and Video 1). Morphological analysis of mitotic lysosomes indicated that lysosomes decreased in number while increased in size from prophase to telophase, when they started recovering their interphase-like morphology ( and Video 1). In addition, lysosome distribution changed once cells proceeded into cell division. Mitotic lysosomes surrounded the chromosomes in prophase and moved to the edges of chromosomes during anaphase/telophase until chromosomes decondensed (). To analyze whether mitotic lysosomes maintain their degradation capacity during cell division, we stained live U2OS cells stably expressing Histone 2B-GFP (H2B-GFP U2OS) with LysoSensor for acidic organelle detection and Magic Red for lysosomal CTSB (cathepsin B) activation. Colocalization between LysoSensor and Magic Red supported the presence of functional lysosomes in dividing cells ( and S1A).
As we found that lysosomes are present and active in mitosis, we analyzed the autophagic flux during cell division. To this end, we detected and quantified acidified and non-acidified autophagic vesicles using MAP1LC3/LC3-tandem (RFP-GFP-LC3) reporter in mitotic cells treated or not with concanamycin A (ConcA) or chloroquine (CQ) ( and S1B). The presence of acidified autophagic vesicles (red-only vesicles) in control conditions confirmed that lysosome acidification takes place while cells progress through mitosis. Inhibition of autophagic flux by ConcA or CQ was supported by the significant increase of non-acidified autophagic vesicles throughout the mitotic subphases ( and S1B). Next, we analyzed the expression of SQSTM1 and the lipidated form of LC3 (LC3-II) in mitosis after inhibition of lysosomal acidification with ConcA. Established synchronization protocols, such as serum starvation or double-thymidine block, were insufficient to efficiently synchronize U2OS cells in G2. Therefore, based on the ability of CDK1-specific inhibitor RO3306 to reversibly block cells in G2, we established a synchronization-release protocol to obtain enriched mitotic population (Fig. S1C). After synchronization, cells released with ConcA treatment for 8 h showed specific accumulation of LC3-II and SQSTM1 ( and S1D). Time-course assay after cell synchronization and release demonstrated that both autophagic proteins gradually accumulated during mitosis transition upon acidification blockade (Fig. S1E and S1F). Subsequently, the upstream regulator of autophagy initiation, mechanistic target of rapamycin kinase complex 1 (MTORC1), was analyzed (Fig. S1G-J). Interestingly, MTORC1 activity, measured by the phosphorylation of RPS6KB1 and RPS6, increased in control cells at G1 reentrance while cells treated with ConcA displayed lower MTORC1 activity (Fig. S1G). Furthermore, analysis of MTORC1 status in mitotic cells compared to interphase cells, demonstrated that MTORC1 activity decreased, independently of ConcA treatment (Fig. S1H). Complementary immunofluorescence analysis showed a decreased recruitment of MTOR to the lysosomes upon mitotic entry, which was slowly recovered after cells entered mitotic exit (Fig. S1I and S1J). Together, our results suggested that MTORC1 lysosomal translocation also correlates with its activity during mitosis.
The presence of autophagic vesicles in dividing cells was corroborated by immunofluorescence analysis of both endogenous LC3 and SQSTM1 (Fig. S1K). Indeed, the number and the size of LC3-positive vesicles was significantly increased upon CQ treatment in interphase as well as in mitotic entry and mitotic exit, confirming an active autophagic flux in mitosis (Fig. S1K and S1L). Finally, double-membrane vesicles (autophagosomes), as well as dense single-membrane vesicles (autolysosomes/lysosomes), were detected by transmission electron microscopy (TEM) in mitotic cells (). Collectively, our results demonstrated that both autophagic vesicles and functional lysosomes are present and active in mitotic cells.
Figure 1. Autophagic flux and lysosome-dependent degradation are active in dividing cells. (A) Representative single focal plane (1Z) confocal images of U2OS cells undergoing mitosis labeled with lysosomal marker LAMP2 (green). Interphase cell and distinct mitotic subphases are detectable with DNA staining with DAPI (blue). Scale bar: 10 µm. (B-C) Quantification of lysosome number (B) and size (C) per cell in interphase compared to each mitotic subphase. Error bars represent S.D. of n ≥ 10 cells. (D) Upper panel: Analysis of the distribution of lysosomes (green) and DNA (blue) in interphase and for each mitotic subphase using Radial Profile Angle ImageJ plugin. A radius of 20 μm was maintained constant for the analysis. Lower panel: representative image of a cell in each analyzed phase. (E) Representative single focal plane confocal images of U2OS H2B-GFP stable cells in interphase or undergoing mitosis were stained with LysoSensor (green – arbitrary color) for lysosomes detection, Magic Red (red) for active CTSB, H2B-GFP (blue – arbitrary color) for DNA staining. Scale bar: 10 µm. (F) Representative single focal plane (1Z) confocal images of U2OS LC3-Tandem cells in interphase or undergoing mitosis. Presence of yellow and red vesicles indicates autophagosomes and autolysosomes, respectively. Nuclei were stained with DAPI for DNA detection. Scale bar: 10 µm. (G) U2OS cells stably expressing LC3-tandem construct were treated or not with ConcA (10 nM) or CQ (10 µM) for 24 h. Quantification of red (acidified) and yellow (non-acidified) autophagic vesicles in interphase and mitotic cells under the indicated conditions was performed. (H) Analysis of autophagic flux by western blot detection upon synchronization-release protocol (T0: G2 population; T8: G1 population after mitosis). Autophagic proteins SQSTM1 and LC3 were analyzed and ACTB/β-actin protein level was used as loading control. (I) Representative TEM images of mitotic cells. Green asterisks indicate autophagic vesicles, blue asterisks mark lysosomes and yellow asterisks point out mitochondria. Scale bars: as indicated. Panels B, C, and G, statistical significance between interphase and mitotic subphases is represented as: * p < 0.05, ** p < 0.005, *** p < 0.001, ns: non-significant
Lysosome acidification capacity and trafficking maintain correct mitotic progression
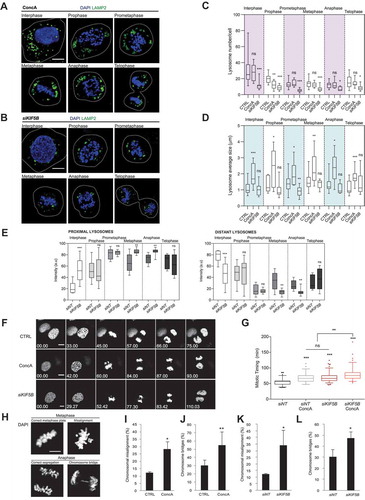
To investigate the role of lysosomes in cell division, we studied mitotic cells with impaired lysosomes either by inhibiting their degradative capacity or their intracellular trafficking. Impairment of lysosome acidification by the v-ATPase inhibitor ConcA led to an increase in mitotic lysosome size, according to a defective degradation capacity, without significantly affecting their number or LAMP2 protein levels ( and S2A). Next, we assessed the effect of the BORC-associated motor protein KIF5B depletion on lysosome morphology, number and distribution in mitotic cells (, S2B and S2C). In both interphase and mitotic cells, KIF5B depletion induced a reduction in the lysosomal number without dramatically affecting their size (). The distribution of lysosomes was strongly affected in cells depleted for KIF5B in interphase (), as previously reported [Citation11,Citation28]. Moreover, analysis of the distribution of lysosomes in the different mitotic subphases showed a change in the localization of lysosomes induced by KIF5B depletion (). Indeed, KIF5B-depleted cells lysosomes were closer to the DNA in metaphase cells compared to control cells, as shown by an increase in proximal lysosomes and a decrease in distant lysosomes (, S2D and S2E). In anaphase, an accumulation of lysosomes between the segregated chromosomes occurred upon KIF5B depletion, shown by an increase in proximal lysosomes versus distant lysosomes (, S2D and S2E). These results suggest the implication of this kinesin on the appropriate distribution of lysosomes during mitosis.
Mitotic timing is strictly regulated and remarkably constant among different cell types and species [Citation4], taking approximately 1 h in normal mitosis. Thus, after identifying active lysosomes in dividing cells, the direct implication of lysosomes in mitotic progression was tested. To this end, we used live-imaging to analyze H2B-GFP U2OS cells treated or not with ConcA or KIF5B-depleted and analyzed the mitotic timing from prophase (chromosome condensation) to telophase (chromosome decondensation). Mitosis was 22% slower in ConcA-treated cells compared to control, and KIF5B depletion delayed mitotic progression to the same extent ( and Videos 2–4). Combination of ConcA-treatment with KIF5B knockdown increased the average mitotic duration by 45% versus control (). In all, integrity of both lysosome transport and functionality is key for preserving mitotic schedule. To precisely characterize the involvement of lysosomes in mitotic progression, we separately analyzed the timing of mitotic entry (prophase to metaphase) and exit (metaphase to telophase). Interestingly, both episodes were delayed by treatments that impaired lysosomes. Consistently, the additive effect was reflected in both mitotic entry and exit (Fig. S2F).
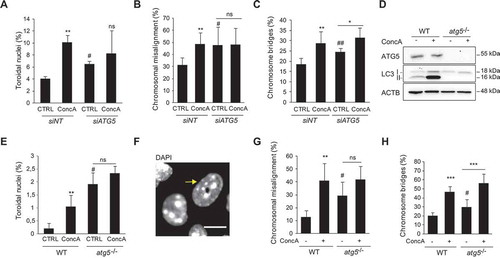
One of the main causes of mitotic delay is the accumulation of mitotic errors such as misaligned chromosomes at metaphase plate or chromosome bridges appearing during chromosome segregation in anaphase [Citation29] (). Thus, we next quantified the acquirement of mitotic errors in synchronized cells released with or without ConcA. Our results demonstrated that lysosome acidification blockade significantly induces the accumulation of misaligned chromosomes and chromosome bridges (). In parallel, we tested whether, beyond acidification, the protective role of lysosomes against mitotic errors also relies on trafficking. Depletion of the motor protein KIF5B significantly induced mitotic errors (). To corroborate that this effect was specific of lysosomal trafficking, other BORC-associated proteins were tested. To this end, ARL8B (ADP ribosylation factor like GTPase 8B) and PLEKHM2 (pleckstrin homology and RUN domain containing M2) were depleted, and mitotic errors were analyzed. Consistent with a role of lysosomal trafficking in mitosis progression, both chromosome misalignment and chromosomal bridge were increased upon ARL8B and PLEKHM2 depletion (Fig. S2G-I). Thus, active lysosomes are important organelles to ensure correct mitosis progression and limit CIN signature.
Figure 2. Lysosome impairment delays mitotic progression and leads to chromosomal instability. (A-B) U2OS cells were treated with ConcA 10 nM for 24 h (A) or transiently transfected with silencing RNA against KIF5B (siKIF5B) (B). Single plane confocal images show LAMP2-positive lysosomes (green) detected by immunofluorescence in cells undergoing mitosis. DNA is labeled with DAPI (blue). Scale bars: 10 µm. (C-D) Comparison of the number of lysosomes per cell (C) or average lysosome size (D) in interphase and each mitotic subphases in control, ConcA-treated or KIF5B-depleted cells. Line represents the mean and error bars correspond to 5–95 percentiles. n ≥ 10 images per condition. (E) Intracellular distribution of lysosomes (proximal and distant) in interphase and in each mitotic subphases in control and KIF5B-depleted cells. n ≥ 10 images per condition. (F) H2B-GFP U2OS cells were subjected to time-lapse imaging for 24 h every 6 min 33 s. Single focal plane of representative images of control cells, cells treated with ConcA 10 nM or depleted for KIF5B (siKIF5B) for 48 h undergoing mitosis are shown. H2B-GFP is depicted in grayscale (arbitrary color). Scale bars: 5 µm. (G) Quantification of mitotic timing of the indicated experimental conditions was performed from prophase (chromosomes condensation) to telophase (chromosomes decondensation). Error bars represent 5–95 percentiles of n ≥ 90 mitosis. (H) Representative images of misaligned metaphase plate and chromosome bridges. Scale bar: 5 µm. (I-J) U2OS cells were synchronized at late G2 phase and released with or without ConcA for 1 h to analyze chromosome misalignment compared to total metaphase (I) or 3 h for chromosomal bridges quantification compared to total anaphases (J). DAPI staining was used for DNA detection. Error bars represent S.D. of n = 3 independent experiments (> 200 cells). (K-L) U2OS cells depleted for KIF5B (siKIF5B) or transfected with siRNA control (siNT) were synchronized and released for 1 h to determine the percentage of chromosome misalignment (K) or 3 h for chromosome bridges (L) relative to the total number of cells undergoing metaphase or anaphase, respectively. Error bars represent S.D. of n = 3 experiments (> 150 cells). In panels C-E, G and I-L, statistical significance is represented as: * p < 0.05, ** p < 0.005, *** p < 0.001, ns: non-significant
Mitotic errors induced by lysosome impairment correlate with an abnormal nuclear phenotype: the toroidal nucleus
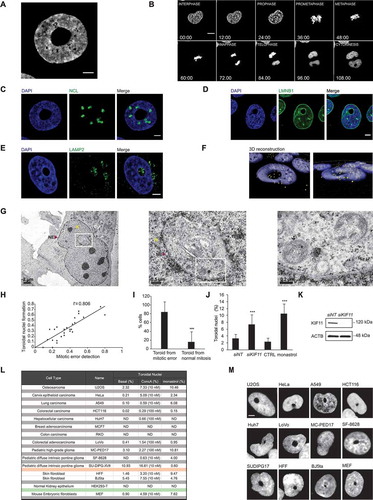
Defective mitotic progression generated a robust and striking nuclear phenotype in interphase cells. Precisely, we observed a DAPI-stained nucleus with a hole devoid of chromatin (). To understand how this structure was originated, we followed the DNA reorganization during mitosis by live-imaging using H2B-GFP U2OS cells. Our results showed that this unconventional nuclear phenotype forms upon mitosis, being detectable in at least one of the daughter cells once chromosomes decondensed ( and Video 5). To assure that this structure does not correspond to an enlarged nucleolus [Citation30], immunofluorescence analysis was performed and results showed that none of the tested nucleolar markers (NCL [nucleolin], FBL [fibrillarin] and UBTF [upstream binding transcription factor]) co-stained with the DAPI-free area ( and S3A). To resolve whether this section is nuclear or cytosolic, we imaged the nuclear envelope by immunofluorescence using LMNB1 (lamin B1) and nuclear pore complex (NPC) antibodies ( and S3B). Interestingly, the nuclear envelope was correctly formed around the DNA. Further immunofluorescence analysis showed that cytoskeleton filaments such as Phalloidin-stained actin fibers and microtubules, as well as LAMP2-positive lysosomes or LC3-SQSTM1-positive autophagosomes, were present within the void at the center of the nuclei (, S3C and S3D). To discard a nuclear invagination and/or an artifact, three-dimensional (3D) reconstruction of high-quality images using IMARIS software resulted in the characterization of a donut-like shaped structure that we refer to as a “toroidal nucleus” ( and Video 6). Ultrastructure analysis of these toroidal nuclei by TEM confirmed that cytosolic material, including autophagic vesicles and lysosomes, were present within the hole ().
This phenotype was once reported as donut-shaped nucleus [Citation31]. The authors proposed that farnesyltransferase inhibitors (FTI) induce the formation of toroidal nuclei by causing a PCNT (pericentrin)-related centrosome separation defect in HeLa cells. Thus, we tested whether FTI induced the formation of toroidal nuclei in our model. After confirming the increase of toroidal nuclei by FTI in HeLa cells (Fig. S3E, left), we demonstrated that U2OS cells did not respond to FTI (Fig. S3E, right). This contrasts with our results that impairment of lysosome acidification by ConcA, which significantly increased the percentage of toroidal nuclei in both cell types (Fig. S3E). To verify that FTI does not stimulate toroidal nuclei formation with different kinetics in U2OS, we analyzed U2OS cells treated for 24 h, 48 h and 72 h with FTI or ConcA. While ConcA gradually induced a robust increase of toroidal nuclei with time, FTI did not (Fig. S3F).
Next, we analyzed whether inhibition of lysosome acidification by ConcA or CQ induced the inhibition of farnesylation of LMNA (lamin A/C). Neither ConcA nor CQ impeded LMNA farnesylation like FTI (Fig. S3G). Based on these results, we hypothesized that the formation of toroidal nuclei is not due to the inhibition of farnesylation per se, but to a defect in mitotic progression regardless of its inducer. As toroidal nuclei were formed following karyokinesis, we examined by live imaging a putative link between the occurrence of mitotic errors and the formation of toroidal nuclei. The results showed a linear correlation between detectable mitotic errors and toroidal nucleus generation with a Pearson’s correlation coefficient of 0.806 (). Indeed, single-cell analysis demonstrated that more than 80% of cells with toroidal nuclei resulted from cells undergoing apparent defective mitosis (). Based on this, we next investigated the repercussion of mitotic stresses on generating toroidal nuclei. To this end, we depleted cells of KIF11, a kinesin required for bipolar spindle establishment [Citation32], and analyzed the formation of toroidal nuclei. Disruption of KIF11 by small interfering RNA (siKIF11) or by the KIF11-specific inhibitor monastrol induced a significant increase in toroidal nucleus frequency () without dramatically affecting lysosome morphology and localization (Fig. S3H).
Depletion of other kinesins implicated in chromosome segregation, such as siKIF2C/MCAK (kinesin family member 2 C) [Citation33] or siCENPE (centromere protein E) [Citation34] produced a 3.3- and 3.8-fold increase of toroidal nucleus population, respectively (Fig. S3I). In all conditions, siRNA efficiency was validated, and lysosomes morphology or distribution were not apparently perturbed (Fig. S3J and S3K). Furthermore, cells treated with nocodazole, a microtubule de-polymerizing agent, showed a 4.5-fold increased prevalence of toroidal nuclei accompanied by the expected lysosomal collapse (Fig. S3I and S3K). We next investigated whether this phenotype is a consequence of impaired nuclear envelope reformation. Live imaging of H2B-GFP U2OS cells stably expressing mCherry-LMNA, indicated that the reformation of the nuclear envelope preceded the formation of toroidal nuclei (Fig. S3L and Video 7). This nuclear phenotype is versatile in terms of size, nuclear localization and morphology (Fig. S3M i-iv). Furthermore, the nucleus could contain more than one void (Fig. S3M v, viii) and be accompanied by a micronucleus (Fig. S3M vi). After mitosis, one or both daughter cells could harbor this phenotype (Fig. S3M vii-viii).
We investigated whether toroidal nucleus was a common feature or specific to U2OS cells. To this end, we screened a panel of cell lines. Toroidal nuclei were detected under the tested conditions in more than 80% of cell lines assessed (). Among them, non-transformed human skin fibroblast (HFF) and embryonic mouse fibroblasts (MEF), as well as cancer cells from lung (A549), cervix (HeLa), colon carcinoma (HCT116 and LoVo) or diffuse intrinsic pontine glioma (SU-DIPG-XVII, MC-PED17 and SF-8628) [Citation35–38]. However, we could not detect toroidal nucleus in RKO, MCF7 or HEK293 T cell lines neither in basal population nor under ConcA or monastrol treatment. Interestingly, the detection of toroidal nuclei in all the other cell lines was evident (compare and S3N), but their sensitivity to induce this nuclear phenotype under the applied treatments varied (). Importantly, most cell lines responded to ConcA-induced blockade of lysosome acidification and to direct mitotic impairment by monastrol as observed by the increased population of toroidal nuclei (). Thus, toroidal nuclei emerge as a good read-out for mitotic errors in interphase cells.
Figure 3. Toroidal nucleus is a novel biomarker for chromosomal instability in interphase cells. (A) Representative image of toroidal nucleus. U2OS cells were fixed and stained with DAPI for DNA detection. Scale bar: 5 µm. (B) Live imaging of H2B-GFP U2OS cells undergoing cell cycle for 16 h every 93 s. Mosaic of single focal plane images indicate aberrant nucleus formation upon cell division. Scale bar: 10 µm. (C-E) U2OS cells were fixed and immunofluorescence was performed using NCL (nucleolin) antibody for nucleolus detection (C), LMNB1 (lamin B1) antibody for nuclear envelope staining (D) or LAMP2 antibody to mark lysosomes (E) and DAPI for DNA labeling. Scale bar: 5 µm. (F) 3D reconstruction using IMARIS software was performed from confocal images stack of toroidal nucleus (Z every 0.1 µm for 11 µm). Blue corresponds to DAPI-stained nucleus and yellow dots mark LAMP2-positive lysosomes. (G) U2OS cells were treated with ConcA for 24 h, fixed and prepared for TEM. Images show toroidal nucleus surrounded by the nuclear envelope. Abbreviations: NE: nuclear envelope, N: nucleus, Cyt: cytosol, AV: autophagic vesicles. Scale bars: as indicated. (H) Analysis of live imaging experiment of cycling H2B-GFP U2OS cells for 24 h every 9 min. The number of mitotic cells with detectable mitotic errors (misaligned chromosomes or chromosomal bridges) and toroidal nuclei per field were quantified. Linear regression was analyzed and Pearson’s coefficient (R) was calculated. (I) Analysis of the percentage of toroidal nucleus formed upon non-apparent mitotic error or after mitotic errors. Error bars represent S.D. of n = 295 mitosis. (J) U2OS cells were depleted for KIF11 for 48 h using silencing RNA or treated with monastrol 100 µM for 24 h. Quantification of toroidal nuclei was performed by detection of DAPI-stained nuclei. Error bars represent S.D. of n > 3 experiments (10 fields/experiment). (K) Samples from panel J were processed by western blot and KIF11 protein levels were analyzed for knockdown efficiency. ACTB was used as a loading control. (L) Table summarizing a screen for toroidal nuclei through various cell lines. Percentage of toroidal nuclei was analyzed in basal population and upon ConcA or monastrol treatments. (M) Representative images of toroidal nuclei in screened cell lines from panel K. Scale bar: 5 µm. Panels I and J statistical significance is represented as: * p < 0.05, ** p < 0.005, *** p < 0.001, ns: non-significant
Lysosome disruption induces the formation of toroidal nuclei
The presence of toroidal nuclei in interphase cells facilitates the analysis of mitotic impairment in whole-cell populations, favoring the toroidal nucleus as a powerful tool for quantitative analysis of chromosomal instability. Here, we aimed to screen for lysosome-specific stresses using toroidal nucleus as a biomarker for chromosomal instability. To this end, cells were treated with ConcA or depleted for KIF5B and toroidal nuclei frequency was quantified. Consistently, v-ATPase inhibition as well as blockage of lysosome transport led to a robust increase of toroidal nuclei population ( and S4A). To discard ConcA-side effects not related to v-ATPase inhibition, we genetically or chemically inhibited lysosome acidification. Thus, cells were treated with CQ or depleted of the V0C v-ATPase subunit (siATP6V0C). In agreement, inhibition of lysosome acidification increased the formation of toroidal nucleus by 2.5- to 3-fold ( and S4B). To validate treatment efficiency, both blockade of the autophagic flux and morphological analysis of lysosomes were assessed by western blot or immunofluorescence, respectively. Our results confirmed the expected accumulation of LC3-II protein levels and increase in lysosomal volume [Citation39] ( and S4A, S4B, respectively).
Both ConcA and CQ increased toroidal nucleus formation, but their kinetics differed (Fig. S4C). Indeed, ConcA treatment acted faster and produced a peak effect at 24 h, while CQ produced a similar effect after 48 h, and further increased at 72 h (Fig. S4C). We further asked whether defects in BORC-dependent lysosome trafficking would also induce the formation of toroidal nuclei. Cells genetically depleted of BORC-associated proteins ARL8B or PLEKHM2 also showed a significant increase in the population of toroidal nuclei (2.3- and 4.1-fold, respectively) confirming the importance of lysosomal trafficking for correct mitotic progression (). Depletion efficacy was corroborated by the perinuclear clustering of lysosomes (Fig. S4D) as well as by significant decrease of protein or mRNA levels (Fig. S2I). Additionally, we examined the specificity of the motor function of KIF5B in the formation of toroidal nucleus by complementing control or KIF5B-depleted cells with the neuronal form KIF5A, which resulted in a rescue of normal toroidal nucleus frequency (). Interestingly, depletion of other motor proteins involved in lysosomal trafficking such as KIF3A, KIF2A or KIF1A also led to a significant increase in toroidal nuclei (Fig. S4E-G). Parallel to the delay in mitotic timing, we found that simultaneous disruption of lysosome acidification (ConcA) and trafficking (siKIF5B or siPLEKHM2) had an additive effect on toroidal nucleus formation compared to single treatments (). In all, our results confirm that both v-ATPase-dependent lysosome acidification and BORC-associated lysosomal trafficking are required to preserve mitotic integrity.
Figure 4. Toroidal nucleus frequency increases upon impairment of lysosome trafficking and acidification capacity. (A) U2OS cells were treated with ConcA (10 nM) for 24 h or depleted for KIF5B for 48 h using silencing RNA. Error bars represent S.D. of n > 5 experiments. (B) U2OS cells were treated with CQ (10 µM) or depleted for the V0C subunit of the v-ATPase (siATP6V0C) for 48 h. Error bars represent S.D. of n > 3 experiments. (C) Western blot analysis of the indicated proteins to show efficiency of the treatments used in panel B. ACTB was used as a loading control. (D) Quantitative real-time PCR to analyze the efficiency of siATP6V0C. (E) U2OS cells were depleted for BORC-associated proteins PLEKHM2 (siPLEKMH2) or ARL8B (siARL8B) using silencing RNA for 48 h. Error bars represent S.D. of n > 3 experiments. (F) U2OS cells were transfected with KIF5B silencing RNA and/or with KIF5A-GFP overexpression plasmid. Error bars represent S.D. of n > 3 experiments. (G) U2OS cells were depleted for KIF5B or PLEKHM2 and the next day treated or not with ConcA for 24 h. Error bars represent S.D of n > 3 experiments. In panels A-B, and D-G nuclei were stained with DAPI for detection and quantification of toroidal nuclei compared to total number of cells. * represents the statistical significance of single treatment effect compared to control, while # represents the effects of the second treatment over control. * p < 0.05, ** p < 0.005, *** p < 0.001, ns: non-significant, # p < 0.05 and ## p < 0.005, ### p < 0.001
Impairment of lysosome functionality does not appear to prevent mitotic cells from progressing into G1 phase but leads to CIN. In cells synchronized and released specifically in mitosis, ConcA and CQ similarly led to toroidal nuclei formation (2.6- and 2.7-fold increase, respectively) (Fig. S4H and S4I), indicating that the different kinetics of toroidal nucleus formation might be due to the effect of the drugs in other phases of the cell cycle. Interestingly, neither MG132 nor monastrol induced toroidal nuclei in these conditions (Fig. S4H and S4I), but rather imped cells from properly concluding cell division as previously demonstrated [Citation40,Citation41], thus limiting the generation of subsequent daughter cells harboring toroidal nuclei (Fig. S4I). We confirmed that inhibition of proteasome-dependent degradation by MG132 arrests cells at G2, as showed by a significant decrease of the mitotic index as well as an increase in G2/M phase by flow cytometry analysis (Fig. S4J and S4K). These results further suggest that lysosomes are not required to complete mitosis, but chromosomal instability is triggered when lysosomes are impaired.
Autophagy is a key player in maintaining mitosis fidelity
As we have detected the presence of autophagic vesicles in mitosis and being that lysosomes are the endpoint of autophagy, we analyzed the involvement of macroautophagy for faithful mitotic progression by scoring for toroidal nucleus frequency after macroautophagy inhibition. Genetic depletion of ATG5 (siATG5) induced a 5.11-fold increase in the proportion of toroidal nuclei (1.6-fold increase) (), while ConcA did not significantly affect the formation of toroidal nucleus in this setting (). In agreement with the correlation between mitotic errors occurrence and formation of toroidal nuclei, the inhibition of autophagy by ATG5 depletion provoked a significant increase in misaligned chromosomes and chromosome bridges (). Protein depletion efficiency was monitored by western blot (Fig. S5A). Chemical inhibition of autophagy by 3-methyladenine (3-MA), a PtdIns3 K inhibitor, also resulted in an increase in toroidal nuclei frequency together with an enhanced detection of chromosomal misalignment (Fig. S5B and S5C). As U2OS is a cancer cell line already susceptible to genomic instability and chromosome alterations [Citation42], we used MEF to analyze the impact of defective autophagy on mitotic progression in a non-tumoral model. First, we validated ConcA efficiency and autophagic flux impairment by analyzing ATG5 and LC3 protein levels (). Then, we quantified the frequency of toroidal nuclei in WT (atg5+/+) and atg5 KO (atg5-/-) MEF. As expected, ConcA treatment significantly increased toroidal nuclei cell population in MEF WT (). Parallel to the depletion of ATG5 in U2OS cells, MEF atg5-/- presented a significantly increased percentage of toroidal nuclei under normal growing conditions, supporting that basal autophagy prevents CIN. MEF atg5-/- were significantly more susceptible to chromosomal misalignment and chromosomal bridges compared to MEF WT (2.36- and 1.48-fold increase, respectively) (). Inhibition of v-ATPase-dependent lysosomal acidification by ConcA clearly increased chromosome misalignment and chromosomal bridges in control MEF WT (). Interestingly, cells lacking ATG5 showed a milder response to inhibition of lysosomal acidification regarding both mitotic errors and toroidal nucleus formation (), suggesting that macroautophagy is the main responsible process for those phenotypes, although macroautophagy-independent lysosome degradation could also occur, as suggested by the residual effects of ConcA in MEF atg5-/-. Altogether, our results establish the involvement of macroautophagy machinery in correct mitotic progression.
Figure 5. Defective macroautophagy increases the occurrence of mitotic errors and toroidal nucleus formation. (A) U2OS cells were depleted for ATG5 for 48 h and treated or not with ConcA for 24 h. Error bars represent S.D. of n > 3 experiments. (B-C) Quantification of mitotic errors, including chromosome misalignment (B) and chromosome bridges (C) in U2OS cells control (siNT) or depleted for ATG5 (siATG5) for 48 h under normal growing condition (CTRL) or treated with ConcA 10 nM (24 h). Error bars represent S.D. of n = 4 experiments (>300 cells). (D) Validation of ATG5 depletion and ConcA efficacy in MEF WT and atg5-/- by western blot. ACTB was used as loading control. (E) MEF WT and atg5-/- were subjected or not to ConcA treatment for 24 h. DNA was labeled with DAPI and frequency of toroidal nuclei was quantified. Error bars represent S.D. of n = 3 experiments. (F) Representative image of normal and toroidal nucleus (yellow arrow) in MEF atg5-/- cells. Scale bar: 5 µm. (G-H) Quantification of mitotic errors, including chromosome misalignment (G) and chromosome bridges (H), respectively, in WT and atg5-/- MEF. Error bars represent S.D. of n = 5 experiments (>100 cells). Panels A-C, E and G-H, * represents the statistical significance of ConcA inhibitory effect compared to control, while # represents the effects of atg5 genetic depletion. * p < 0.05, ** p < 0.005, *** p < 0.001, ns: non-significant, # p < 0.05 and ## p < 0.005
Identification of novel lysosome substrates specifically during cell division
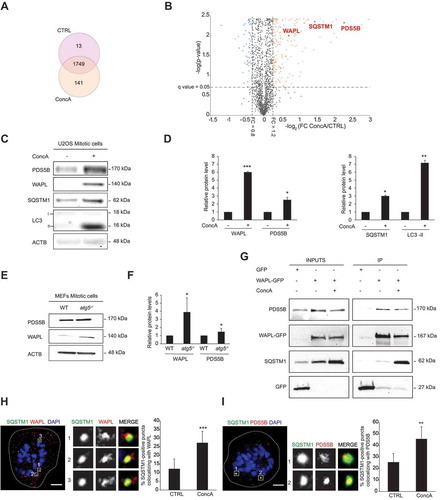
Based on the characterization of a remarkable role for lysosomes and autophagic vesicles in mitotic progression, we next aimed to identify novel substrates of the autophagic-lysosomal pathway specifically in mitosis by mass spectrometry analysis. Following synchronization of cells at G2, cells were released in control media or in media containing ConcA for 7 h. G1-enriched cell fractions were processed for mass spectrometry analysis. Drug efficacy was validated by LC3 and SQSTM1 accumulation in the three experimental replicates after ConcA treatment (Fig. S6A). Proteomic data analysis identified a total of 1749 peptides present in both ConcA and control fractions, while only 13 and 141 were uniquely detected in control and ConcA fractions, respectively (). Enrichment analysis validated 853 peptides being differently expressed (q-value<0.05) that were selected based on ± 1.2-fold change cut-off (). In accordance with its role in inhibiting lysosome-dependent degradation, ConcA significantly induced protein accumulation. The list of candidates was clustered into cellular functions using Reactome opensource database [Citation43,Citation44]. Reactome analysis highlighted that proteins accumulated after lysosome inhibition specifically during mitosis were mainly involved in cell cycle, vesicle-mediated transport or DNA repair (Fig. S6B and Table S1). As expected, SQSTM1 was significantly increased by 2.73-fold in the ConcA fraction compared to control (). Next, we focused on those candidates that clustered in functional annotations related to mitosis and cell cycle regulation based on gene ontology (GO) enrichment analysis (). A list of 20 proteins involved in mitotic cell cycle progress (GO: 1903047) were further studied to define the involvement of lysosomes in chromosome segregation (). Interestingly, among the principal enriched proteins, the two cofactors of the cohesin complex PDS5B (PDS5 cohesin associated factor B) and WAPL (WAPL cohesion release factor) were significantly increased by 4.78- and 1.64-fold, respectively ( and ). To validate the proteomic data, we isolated mitotic cells by shake-off after synchronization-release and evaluated protein levels in control and ConcA-treated cells. As expected, SQSTM1 and LC3-II autophagic proteins accumulated in ConcA-treated mitotic fraction ( and S6C). Significant increase of both WAPL and PDS5B proteins occurred in mitotic cells upon acute impairment of lysosomal acidification capacity (), indicating that both PDS5B and WAPL are novel putative lysosomal substrates specifically during mitotic progression. To validate our findings in another cell line as well as in a model of autophagy impairment, we obtained shake-off fractions from MEF WT and atg5-/-. Mitotic fractions of non-synchronized MEF corroborated that PDS5B and WAPL significantly accumulated in MEF atg5-/- cells compared to MEF WT ( and S6D). Thus, WAPL and PDS5B are potential lysosomal substrates degraded through the macroautophagy machinery.
Table 1. Table summarizing the 20 candidates identified by mass spectrometry that are clustered in the Gene Ontology (GO) group of mitotic cell cycle progress (GO: 1903047)
To determine by which mechanism WAPL and PDS5B could be recruited and sent to degradation, U2OS cells were transfected with exogenous WAPL-GFP plasmid and treated or not with ConcA for 3 h after synchronization. Mitosis-enriched fractions were then subjected to GFP-immunoprecipitation. First, we validated the binding between WAPL and its well-described partner PDS5B [Citation45] (). WAPL-GFP similarly interacted with PDS5B in control or ConcA-treated cells, suggesting that their interaction is maintained upon lysosomal inhibition. Interestingly, WAPL-GFP pulled down with the autophagic receptor protein SQSTM1 and this interaction significantly increased upon ConcA-treatment (). Interaction between SQSTM1 and WAPL and PDS5B was also supported by immunofluorescence analysis of the endogenous proteins in mitotic cells. Interestingly, bright foci containing SQSTM1 highly colocalized with both PDS5B and WAPL in dividing cells (). Furthermore, the number of colocalizing puncta was significantly increased upon ConcA treatment, supporting that WAPL and PDS5B are degraded by the lysosomes during mitosis, potentially through SQSTM1-mediated targeted degradation.
Figure 6. Identification of novel mitotic lysosomal substrates. (A) Venn diagram representing proteins detected by mass spectrometry of synchronized U2OS cells released in growing media (CTRL) or ConcA-containing media. (B) Volcano plot depicting fold-changes (FC) (log2) in protein abundances in cells treated with 10 nM ConcA. Three independent experiments were analyzed per condition. Dots denote the 1749 unique proteins detected in pre-filtered samples. Threshold at q-value < 0.05 depicts peptides significantly modified under experimental conditions. Blue dots represent peptides with FC < 0.8. Orange dots correspond to peptides presenting a FC > 1.2. Within these candidates, red dots indicate target proteins WAPL, SQSTM1 and PDS5B. (C) Western blot of synchronized U2OS mitotic cell fractions after mitotic cell enrichment by shake-off. Indicated proteins were analyzed. ACTB was used as loading control. (D) Quantification of WAPL, PDS5B, SQSTM1 and LC3-II band intensity in experimental conditions of panel D and normalized to ACTB protein level. Error bars represent S.D. of n = 3 experiments. (E) MEF WT and atg5-/- under normal growing conditions were subjected to shake-off. Mitotic enriched cell fractions were then analyzed by western blot and accumulation of WAPL and PDS5B was detected in MEF atg5-/-. ACTB was used as loading control. (F) Quantification of WAPL and PDS5B protein levels from panel F normalized to ACTB loading control. Error bars represent S.D. of n = 3 experiments. (G) Immunoprecipitation of exogenous WAPL-GFP in U2OS cells treated or not with 10 nM ConcA for 24 h. Cells only expressing exogenous GFP tag were used as negative control (H-I) Representative images of U2OS treated with ConcA (10 nM) for 24 h. Detection and localization of endogenous WAPL (H) or PDS5B (I) together with SQSTM1 were analyzed by immunofluorescence. Nuclei were stained with DAPI (blue). Scale bars: 10 µm. Magnification of SQSTM1-positive foci shows colocalization of WAPL with SQSTM1 (H) or PDS5B with SQSTM1 (I). Quantification of SQSTM1-containing foci colocalizing with WAPL (H, right panel) or PDS5B (I, right panel) in control and ConcA-treated cells for n ≥ 7 cells. In panels D, F, H-I, statistical significance is represented as: * p < 0.05, ** p < 0.005, *** p < 0.001, ns: non-significant
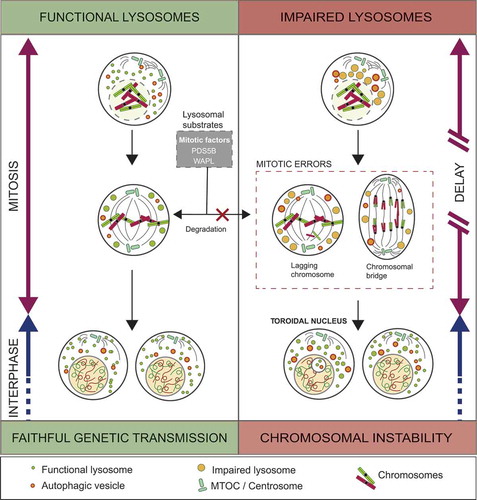
In all, our results shed light on a novel regulatory mechanism for accurate mitotic progression, depicting lysosomes as key players for correct chromosomal congression and faithful genetic transmission (). In addition, we identified the toroidal nuclei as a read-out of mitotic defects in interphase cells, and as such, as a novel biomarker of genotoxicity for cancer research.
Figure 7. Impairment of lysosomes in mitotic cells leads to CIN. Lysosomal function is required for the maintenance of correct cell division and faithful transmission of genetic material in the two daughter cells. Functional lysosomes degrade essential mitotic factors necessary for appropriate chromosome segregation. However, when lysosomes are dysfunctional either by impairment of their trafficking or acidification capacity, mitotic cells are prompt to accumulate mitotic errors, to generate progeny with toroidal nuclei and mitosis is delayed. These alterations are key features of CIN
Discussion
Faithful mitotic progression relies on autophagy and lysosomes
During mitosis, dramatic cellular rearrangement occurs to support proper chromosome segregation and productive partitioning of intracellular organelles. Many membranous compartments undergo massive spatiotemporal disruption [Citation16] and scheduled protein degradation is required. While the role of UPS has been extensively studied, the implication of lysosomes and autophagy in cell division still remains elusive [Citation17,Citation22,Citation23]. Although lysosome studies are mainly focused on interphase cells, endocytic vesicles (including lysosomes) were proposed to serve as a membrane source for plasma membrane extension and retraction during mitotic transition [Citation14,Citation15]. Recently, PCM1-driven selective degradation of centriolar satellites was shown to maintain centrosome function for correct mitotic progression [Citation25], and lysosome leakage was proposed to allow correct chromosome segregation [Citation46]. Here, our results agree with the persistence of a robust autophagic flux and lysosomal-dependent degradation during mitosis [Citation23].
Other publications demonstrated that initiation of autophagy is inhibited during mitosis, even under MTORC1 inactive state, due to CDK1-dependent phosphorylation of ULK1 [Citation20], or due to WIPI2 degradation [Citation19]. Our results clearly demonstrated that autophagosomes and lysosomes are acidified during mitotic progression. From the apparent contradiction of these results arises the concept that, while de novo autophagosome formation may be inhibited in mitosis, preexisting or precursor autophagic vesicles can still play a role in mitotic progression. The finding that under basal conditions MEF atg5-/- harbor a higher population of toroidal nuclei corroborates that autophagy is active and necessary for mitosis also in non-transformed cells. Interestingly, even in a context of macroautophagy impairment, such as in the case of ATG5 depletion, v-ATPase inhibition by ConcA treatment tends to increase the occurrence of mitotic errors and toroidal nucleus suggesting that other types of autophagy, such as microautophagy or chaperone-mediated autophagy (CMA), could also be active during mitosis to degrade other protein substrates. Among the identified lysosomal substrates in mitosis, SQSTM1, an autophagic receptor protein for ubiquitinated cargos, confirms an active macroautophagic flux and suggests a potential alternative route to the proteasome for the degradation of mitotic factors [Citation47,Citation48].
To note, PCM1 was not detected in our proteomic analysis of mitotic cells, supporting that various selective autophagy processes might coexist and be timely regulated during mitotic progression. Recently, SQSTM1 emerged as a potential pivotal player in the crosstalk between UPS and selective autophagosome-lysosome degradation [Citation49,Citation50]. Based on SQSTM1 bifunctionality and ubiquitin-lysine linkages diversity, we speculate that a potential interconnection between the two main degradative pathways exists to correctly distribute genetic material.
Control of sister chromatid cohesion during cell division is crucial for equal distribution of genetic material. The canonical evolutionary conserved cohesin complex is one of the main molecular entities involved in this process and consists of four subunits (SMC1, SMC3, RAD21 and STAG1/3) [Citation51]. Currently, most research focuses on cohesin loading processes during replication and cohesin-dependent extrusion of chromatin loops for DNA-damage repair [Citation52]. In mitosis, cohesin supports both mitotic entry and metaphase-to-anaphase transition. In prophase, cohesin complexes dissociate to allow chromatid condensation and separation. At that precise moment, cohesin complex disruption is triggered by WAPL and PDS5B along the chromatids arms [Citation53,Citation54]. WAPL-dependent dissociation at the centromeric region is inhibited by SGO (shugoshin) to prevent premature chromatin separation [Citation55,Citation56]. During metaphase-to-anaphase transition, chromosome dissociation at the centromeric region is regulated by APC/C-dependent PTTG1 (PTTG1 regulator of sister chromatid separation, securin) ubiquitination, leading to ESPL1 (extra spindle pole bodies like 1, separase) activation that cleaves RAD21 to culminate chromatid separation [Citation57].
Since lysosomes can degrade most biological material and, considering that in this study we identified more than 100 potential lysosomal protein substrates in mitotic cells, we favor the idea that the implication of lysosomes in cell division is a multifactorial process. Our finding that WAPL and PDS5B accumulate upon blockade of lysosomal acidification identifies them as potential lysosomal substrates specifically during mitosis. Our study reports for the first time the involvement of autophagy- and lysosomal-dependent degradation of cohesin cofactors. The identification of WAPL as a novel SQSTM1 interactor supports the model of selective degradation of WAPL and PDS5B by the lysosome during mitotic transition. However, additional studies are needed to better understand the interconnection between lysosome-dependent degradation and the regulation of chromatid cohesion during mitotic progression, as well as the precise mechanism by which WAPL is recognized by SQSTM1 during cell division, either through its ubiquitination or indirectly via other SQSTM1-interactors. Our findings are specially relevant in the context of cancer, as variations in PDS5B and WAPL expression correlate cohesin and chromosomal segregation defects with aneuploidy and cancer progression [Citation53,Citation58–61].
Toroidal nucleus, a new tool for genotoxicity screenings
The study of mitosis is challenging due to the velocity and architectural changes accompanying cell division. To escape these obstacles, most mitosis-focused studies take advantage of synchronization protocols. However, drugs used for cell synchronization, such as nocodazole, do not specifically target mitosis but rather essential cellular components like microtubules, thus altering organelles trafficking among other basic cellular functions. Currently, the only marker of defective mitosis detectable in non-mitotic cells is the micronucleus. Although micronuclei are a consequence of chromosome missegregation [Citation62], they can be reabsorbed during subsequent cell divisions or destroyed by autophagy [Citation63,Citation64]. Therefore, complementary read-outs in interphase cells are needed for the analysis of mitosis impairment. Here, we show that toroidal nuclei form upon inexact mitosis and linearly correlate with the occurrence of mitotic errors.
Inhibition of farnesylation was previously proposed to drive the formation of donut-shaped nuclei by affecting centrosome function [Citation31]. Here, we demonstrate that toroidal nuclei do not uniquely form upon inhibition of protein farnesylation. Indeed, FTI did not increase toroidal nucleus population in U2OS, while mitotic stressors, such as inhibition of lysosomal function or monastrol treatment, systematically increased the frequency of toroidal nuclei in various cell lines. In addition, our results reveal that toroidal nuclei form prior to the reformation of the nuclear envelope, as it was also described for micronucleus [Citation65].
The fate of micronuclei is still uncertain and four possibilities are under examination: degradation, reincorporation into the nucleus, extrusion or persistence in the cytoplasm leading to apoptosis or chromothripsis [Citation66]. We expect similarities for toroidal nuclei, but further studies are needed to decipher how cells cope with toroidal nuclei. We detected toroidal nuclei in several transformed and non-transformed cells, designating the presence of this structure as a conserved phenotype within most cell lines. However, the occurrence of toroidal nuclei likely depends on cell type specificities and/or genetic background. Variability in toroidal nucleus frequency might also correlate with basal autophagy levels, which are known to be cell-type-specific [Citation67]. In conclusion, the detection of toroidal nuclei is a new tool for the study of impaired mitosis in genotoxicity screenings.
Until now, the orchestrated degradation of mitotic factors has been mostly attributed to the UPS. Our data reveals an additional route in which active autophagy and lysosomes promote faithful genetic transmission. Given the promising results of lysosomotropic drugs for cancer treatment, our study opens an alternative line of research focusing on lysosomes modulation to exploit CIN for cancer therapy.
Materials and methods
Cell culture
U2OS, HeLa, A549, HCT116, RKO, LoVo, MCF7, BJ5ta, HFF and HEK293-T cell lines were obtained from American Type Culture Collection (HTB-96; CCL-2; CCL-185; CCL-247; CRL-2577; CCL-229; HTB-22; CRL-4001, SCRC-1041 and CRL-11268, respectively). Huh7 cells were purchased at JCRN Cell Bank (JCRB0403). MEF WT and atg5-/- were kindly provided by Dr. Boya (CIB, Spain). U2OS H2B-GFP cell line was kindly provided by Dr. Agell (University of Barcelona, Spain). SF-8628 were purchased from Millipore Sigma (SCC127 M). MC-PED17 cells were a gift from Dr. Daniels (Mayo Clinic, Rochester, MN, USA). SU-DIPG-XVII cells were a gift from Dr. Monje (Stanford University, Stanford, CA, USA). U2OS mCherry-LMNA and U2OS H2B-GFP LAMP1-RFP were generated in our laboratory by transient transfection of plasmids purchased in Addgene repository, LAMP1-GFP (34831; deposited by Esteban Dell’Angelica), LAMP1-mRFP-Flag (34611; deposited by David Sabatini) and mCherry-LMNA (55068; deposited by Michael Davidson). U2OS cell line stably expressing Tandem-LC3 reporter was also generated in our laboratory after transient transfection and further selection of plasmid shared by Dr. Boya. WAPL-GFP plasmid was kindly shared by Dr. Wang (Zhejiang University, China). Briefly, DNA transfection was performed following manufacturer’s instructions using Lipofectamine 2000 (Thermo Fisher Scientific, 11668019) in 1:5 opti-MEM:DMEM medium (Gibco, 31985070 and 41966052). Cells were selected using a fluorescence-activated cell sorter (MoFlo Atrios SORTER). Cells were grown in DMEM high glucose (Gibco, 41966052) (4 mM L-glutamine, 4.5 g/L glucose, 1 mM pyruvate) supplemented with 10% heat-inactivated fetal bovine serum (FBS; Thermo Fisher Scientific, A3382001). Cells were incubated at 37ºC, 5% CO2 and 90–95% of relative humidity. Specific experimental conditions are indicated in figure legends. All chemicals used in this study are reported in .
Table 2. List of reagents used in this study
Cell synchronization at G2
Cells were seeded the day before starting the synchronization in DMEM medium supplemented with FBS. Thymidine (Sigma-Aldrich, T1895) was added at a final concentration of 2 mM for 24 h to synchronize cells at late G1. After phosphate-buffered saline (PBS; Gibco, 10010056) washing, cells were released to S phase by adding complete DMEM for 2 h. Finally, RO3306 (CDK1 inhibitor; Sigma-Aldrich, SML0569) was added to cell culture medium at a final concentration of 9 μM for 12 h to arrest cells at late G2 (Fig. S1C). Experiments with synchronized cells were performed by releasing cells in complete DMEM with or without the corresponding drugs for the indicated times. For the obtention of shake-off fractions, synchronized cells were subjected to consecutive strokes to the dishes to detach specifically the mitotic cells while maintaining the integrity of the cell monolayer. See for reagents specifications.
Silencing RNA transfections
siRNA transfections were performed following manufacturer’s instructions in Opti-MEM medium (Gibco, 31985070) using Lipofectamine RNA-iMAX (Thermo Fisher Scientific, 13778150). Unless otherwise indicated, transfections were performed for 48 h. siRNA sequences and concentrations used in these studies are listed in Table S2.
Cell cycle analysis
Cells were trypsinized, counted and placed on ice. 500,000 cells were centrifuged at 800 x g at 4ºC for 5 min and cell pellet was washed with ice-cold PBS, fixed with 70% ethanol and placed at −20ºC for at least 24 h. Cells were then washed with ice-cold FACS buffer (0.1% BSA [Sigma-Aldrich, A2153], 5 mM EDTA in PBS) and centrifuged for 5 min at 800 x g at 4ºC. Supernatant was discarded and the cell pellet was resuspended in propidium iodide (PI) staining solution (PBS, 0.1% NP40 [Sigma-Aldrich, 74385], 20 µg/mL RNAse A [Invitrogen, 12091039], 40 µg/mL PI [Sigma-Aldrich, S7109]). Cell suspension was transferred to a 5 mL tube with cell strainer cap (Corning, 352235) and maintained at room temperature protected from light for 15 min. Samples were acquired using FACS Canto System (BD Biosciences, USA) and analyzed with ModFit LT software (Verity Software House).
Protein extraction and western blot
Cells were washed twice with ice-cold PBS, scraped and lysed on Lysis Buffer (20 mM Tris-HCl, pH 8, 10 mM EDTA, 150 mM NaCl, 1% Triton X-100 [Sigma-Aldrich, T8787]) supplemented with 1:100 protease inhibitor cocktail (Sigma-Aldrich, P8340) and 1:100 phosphatase inhibitors cocktails 2 and 3 (Sigma-Aldrich, P5726 and P0044). Cell lysates were centrifuged at 13000 x g for 10 min at 4ºC. Protein concentration was analyzed using Pierce BCA Protein Assay kit (Thermo Fisher Scientific, 23225) following manufacturer’s instructions. Equal amounts of protein lysates were resuspended in Laemmli SDS-sample buffer and incubated at 95ºC for 5 min. Proteins were separated on SDS-PAGE and transferred to PVDF membranes (Millipore, GE10600121). Membranes were blocked with 5% nonfat dry milk (BioRad, 1706404) in Tris-buffered saline containing 0.1% Tween-20 (Thermo Fisher Scientific, 28352; TBS-T) for 1 h at room temperature. Incubation of primary antibodies was performed overnight at 4ºC in 5% nonfat dry milk or 3.5% BSA. After three washes in TBS-T, membranes were incubated for 1 h at room temperature with secondary antibodies (1:5000) diluted in 5% nonfat milk. Upon incubation, membranes were washed three times with TBS-T and protein detection was performed by using enhanced chemiluminescence kit (GE Healthcare, GERPN2232). Blots were scanned with iBright detection system (Thermo Fisher Scientific, CL1000). All the antibodies used in this study are reported with the corresponding working concentrations in .
Table 3. List of primary and secondary antibodies used in this study
Immunoprecipitation
U2OS cells transfected with WAPL-GFP expression vector or GFP-empty vector as negative control were washed twice with ice-cold PBS and cellular pellets were kept at −80ºC before lysis. Cellular pellet was lysed in ice-cold IP-RIPA buffer (100 mM Tris-HCl, pH 7.5, 300 mM KCl, 10 mM MgCl2, 2 mM EGTA, 20% glycerol [Sigma-Aldrich, G5516], 1.6% NP40 [Sigma-Aldrich, 74385]) supplemented with protease inhibitors (2X), phosphatase inhibitors cocktails (1X), 1 mM PMSF (Sigma-Aldrich, 78830) and 1 mM DTT (Roche, 10708984001). After 5 min incubation on ice, collected samples were mechanically lysed with cold syringe and centrifuged at 13000 x g for 5 min at 4ºC. Soluble fraction was subjected to BCA Pierce protein quantification. Proteins (1500 µg per sample) were separated for immunoprecipitation at 1 μg/μL concentration. For the immunoprecipitation, 30 μL of GFP-Trap beads (ChromoTek, gtma-10) were added to each lysate and incubated by rotation overnight at 4ºC. Immunoprecipitates were washed three times with IP-RIPA buffer. Immunoprecipitated proteins were denatured by the addition of 2X sample buffer followed by boiling for 10 min, resolved by 4%-20% Criterion TGX Gel (BIO-RAD, 567–1094) electrophoresis and analyzed by immunoblotting. 20 μg of the total lysate were loaded as input to control.
Quantitative real-time PCR
Total RNA was extracted using TRIzol (Invitrogen, 93289) following manufacturer’s instructions. 1 μg of total RNA was subjected to reverse transcription and resulting cDNA samples were used in PCR amplification using LightCycler 96 SYBR Green I Master Mix (Roche Molecular Systems). Primers to amplify PLEKHM2 (F: 5ʹ-TCTCGCTGTCGGTGAAGAAG-3ʹ R: 5ʹ- AGGTCTTGCAGTCCGTACAG-3ʹ), KIF3A (F: 5ʹ-TGGCTGCAAAGTCAGAGATGG-3ʹ R: 5ʹ- ATCTGAAGTCGAAGCTCCCG −3ʹ) and ATP6V0C (F: 5ʹ-TCTACAAGAGCTTCCTCCAGC-3ʹ R: 5ʹ- CACCTCGGCGAAGATGAGAA-3ʹ) were used. Gene expression was normalized to the endogenous ACTB/β-actin (F: 5ʹ-AATGTGGCCGAGGACTTTGATTGC-3ʹ R: 5ʹ-AGGATGGCAAGGGACTTCCTGTAA-3ʹ).
Immunofluorescence
Cells were grown as monolayers on coverslips and subjected to the indicated conditions. Cells were fixed with 4% paraformaldehyde for 10 min at room temperature. After 5 min washing with PBS, cells were permeabilized using 0.1% Triton X-100 in PBS for 10 min at room temperature. Next, cells were blocked with 1% BSA/0.01% Triton X-100 in PBS plus 10 mM glycine (Sigma-Aldrich, G8898) for 30 min at room temperature. Cells were incubated with primary antibodies for one hour at room temperature or overnight at 4ºC. Following a series of PBS washes, cells were incubated with secondary antibodies for 45 min at room temperature. After two washes of 5 min with PBS, coverslips were mounted using Vectashield Mounting Solution containing DAPI (Vector Laboratories, H-1200). All the antibodies used in this study are reported with the corresponding working concentrations in .
Vesicle acidification and detection assays in live cells
U2OS cells were seeded onto glass coverslips and subjected to the indicated conditions. Live cells were washed once with PBS and Magic Red (Immunochemistry Technologies, 938) and LysoSensor (Invitrogen, L7545) were added to cover the cell layer following manufacturer’s instructions. Cells were incubated for 20 min under experimental conditions at room temperature before image acquisition.
U2OS cells stably expressing the reporter construct Tandem-LC3 (mRFP-GFP-LC3B) were seeded onto glass coverslips, treated with ConcA (10 nM) or CQ (10 μm) for 24 h and then fixed and mounted as previously explained. Autophagosomes are detected as yellow-positive vesicles (red + green) while red-only vesicles correspond to acidified autophagic vesicles (autolysosomes), as the pH-sensitive GFP fluorophore gets quenched in acidified vesicles.
Image acquisition and analysis
For detailed analysis, images acquisition was performed in Leica spectral confocal microscope TCS SP5 using a 63x N.A 1.4 objective and LAS AF software or Carl Zeiss LSM880 confocal microscope and Zeiss ZEN software (Oberkochen, Germany). Fluorophores were excited with Argon 488, DPSS 561, Diode 640 and Diode 405 lasers. Image analysis was performed using FIJI ImageJ software (NIH, USA).
For toroidal nucleus and mitotic errors quantification, images were acquired using Nikon Epifluorescence microscope using a 40x dry objective. Image analysis was performed using Cell counter plugin from FIJI ImageJ software. Pearson’s correlation coefficient was calculated based on confocal images using FIJI ImageJ plugin Intensity Correlation Analysis. Mitotic lysosomes size and number were analyzed with FIJI ImageJ fixing particle size from 0.3 μm2 to infinity. The distribution of mitotic lysosomes was calculated with FIJI ImageJ plugin Radial Profile Angle as previously described [Citation68].
3D reconstitution
Stacks of images acquired at optimal settings with Carl Zeiss LSM880 confocal microscope were processed with IMARIS Software (Bitplane, Zürich, Switzerland) for 3D image reconstruction and to generate in silico animations and images.
Live-cell time-lapse videos
For mitotic delay analysis, U2OS H2B-GFP cells were grown onto glass-bottom 8-well slides (IBIDI, 80827). After indicated treatments, medium was replaced by FluoroBrite medium (Gibco, A1896702) and live-cell imaging was performed on the Leica spectral confocal microscope TCS SP5. Images were taken every 6 min and 33 s for a total time of 24 h using the 63x glycerol objective.
For lysosome trafficking analysis, U2OS cells stably expressing LAMP1-RFP and H2B-GFP were grown onto glass-bottom 8-well slides (IBIDI, 80827). After indicated treatments, medium was replaced by FluoroBrite medium (Gibco, A1896702) and live-cell imaging was performed on Carl Zeiss LSM880 confocal microscope. Images were taken every 5 min for a total time of 24 h using the 63x glycerol objective.
For toroidal nucleus and nuclear lamina reformation assays, U2OS cells stably expressing H2B-GFP and mCherry-LMNA were grown onto bottom-glass 8 chambers slides (IBIDI, 80827). After addition of FluoroBrite with indicated treatments, mitotic cell division was analyzed on a Carl Zeiss LSM880 confocal microscope. For toroidal nucleus formation, images were taken every 93 s for 16 h using the 63x glycerol objective. For nuclear envelope reformation experiment, images were taken every 5 min for 16 h using the 63x glycerol objective.
Transmission electron microscopy (TEM)
U2OS cells with or without ConcA (10 nM) treatment for 24 h were fixed with glutaraldehyde 2.5% in sodium cacodylate trihydrate 0.1 M pH 7.2 for 2 h at 4ºC. After three washes with sodium cacodylate trihydrate 0.1 M of 15 min each, samples were incubated for 2 h with osmium tetroxide 1% in sodium cacodylate trihydrate 0.1 M at room temperature. Samples were washed three times for 15 min with sodium cacodylate trihydrate 0.1 M. Then, samples were processed through dehydration with ethanol 30% to 100% gradually. Samples were then embedded into resin epoxy. After sample orientation, polymerization occurred at 60ºC for 48 h. Samples were cut using ultramicrotome EM UC6 Leica, first in semithin of 250 nm and then ultrathin of 70 nm. Image acquisition was performed with TEM microscope JEOL JEM-1011. Images were analyzed and processed with FIJI ImageJ software (NIH, USA).
Mass Spectrometry
Three replicates of treated samples were processed for protein extraction in RIPA lysis buffer (Tris-HCl [pH 8; 50 mM], NaCl 150 mM, 1% NP-40, 0.5% sodium deoxycholate, 0.1% SDS). Protein concentration was determined and 50 μg of each sample was digested using a FASP (Filter-Aided Sample Preparation) approach. Briefly, proteins were reduced with dithiothreitol (10 mM; 60 min, 32ºC) and alkylated with iodoacetamide ([Sigma-Aldrich, A3221], 20 mM; 30 min at 25ºC in the dark). Samples were loaded onto an Amicon Ultra filter 10 kDa, 0.5 mL (Millipore, ACS501002) to remove interfering agents with 2 rounds of centrifugations/washes with 100 mM ammonium bicarbonate buffer (13,600 x g; 25 min at room temperature). Digestion was carried out in two steps: first, samples were digested (1:50 w sample/w enzyme) with Lys-C (Wako, 4548995075888) in 6 M urea buffer (Sigma-Aldrich, U5378) for 3 h at 35ºC. Then, the samples were diluted 10-fold with 100 mM ammonium bicarbonate buffer and digested with modified porcine trypsin (Promega, V5111) (1:25 w sample/w enzyme) for 16 h at 37ºC. The resulting peptide mixture was recovered by centrifuging the filter and later the filter was washed twice with 300 μL of 50 mM ammonium bicarbonate and once with 200 μL of 20% acetonitrile/50 mM ammonium bicarbonate (13,600 x g for 25 min at room temperature). All the fractions were pooled, and the final peptide mixture was acidified with formic acid. Finally, the final volume of the acidified peptide solution was reduced on a SpeedVac vacuum system (Thermo Fisher Scientific), and the peptide solution was desalinated with a C18 spin column (Thermo Fisher Scientific) following supplier’s indications.
Samples were analyzed in a Proxeon 1,000 liquid chromatographer coupled to an Orbitrap Fusion Lumos (Thermo Fisher Scientific) mass spectrometer. Samples were re-suspended in 0.5% formic acid in water, and 2 μL (1 μg/μL) were injected for LC-MS/MS analysis. Peptides were trapped on an NTCC-360/75-3-123 LC column and separated using a C18 reverse-phase LC column-Easy Spray (Thermo Fisher Scientific). The gradient used for the elution of the peptides was 1% to 35% in 90 min followed by a gradient from 35% to 85% in 10 min with 250 nL/min flow rate. Eluted peptides were subjected to electrospray ionization in an emitter needle (PicoTipTM, New Objective, Scientific Instrument Services) with an applied voltage of 2,000 V. Peptide masses (m/z 300–1,700) were analyzed in data-dependent mode where a full scan MS was acquired on the Orbitrap with a resolution of 60,000 FWHM at 400 m/z. Up to the 10 most abundant peptides (minimum intensity of 500 counts) were selected from each MS scan and then fragmented using collision-induced dissociation (CID) in the linear ion trap using helium as collision gas with 38% normalized collision energy. The scan time settings were full MS at 250 ms and MSn at 120 ms. Generated raw data files were collected with Thermo Xcalibur (v.2.2) (Thermo Fisher Scientific). MaxQuant 1.6.1.0 Software (Department for Proteomics and Signal Transduction, Max-Planck Institute for Biochemistry) was used to search the raw data obtained in the MS analyses against a SwissProt/Uniprot human database with Andromeda Search engine (1.5.6.0). A target and decoy database were used to assess the false discovery rate (FDR). Trypsin was chosen as enzyme and a maximum of two miscleavages were allowed. Carbamidomethylation (C) was set as a fixed modification, whereas oxidation (M) and acetylation (N-terminal) were used as variable modifications. Searches were performed using a peptide tolerance of 7 ppm and a product ion tolerance of 0.5 Da. Resulting data files were filtered for FDR <1%. Statistical analysis was performed in Perseus 1.6.2.1 (Department for Proteomics and Signal Transduction, Max-Planck Institute for Biochemistry).
Statistical analysis
Data was analyzed by Excel or GraphPad Prism8 software. Results are presented as Mean ± S.D., for the indicated (n) independent experiments. Experimental data sets were compared by: (i) Two-sampled, two-tailed Student’s t-test for two experimental conditions sharing normal distribution and variance (ii) One-way ANOVA test for more than 2 conditions sharing normal distribution and variance. Multiple comparisons corrected using Bonferroni test (iii) Kruskal-Wallis test for more than 2 conditions and data without assuming normal distribution. Multiple comparisons were corrected using Dunn’s test.
Supplemental Material
Download Zip (26.6 MB)Acknowledgments
We thank Dr. George Thomas, Dr. Sara Kozma, Dr. Antonio Gentilella and the rest of the members of the laboratory of Cancer Metabolism for scientific inputs and sharing reagents. We also would like to thank the undergraduate students Júlia Granell, Belen Hernandez and Laia Jordana for their punctual participation in the research project. We thank Dr. Neus Agell for providing H2B-GFP stable U2OS cells, Dr. Patricia Boya and Dr. Antonio Zorzano for MEF WT and atg5-/- and Dr. Cristina Muñoz for siRNAs siATG5 and siSQSTM1. We are grateful to Dr. Juan S. Bonifacino for sharing KIF5A-GFP plasmid and to Dr. Fangwei Wang for WAPL-GFP plasmid. We also thank the technical facilities at CCITUB for FACS analysis and confocal microscopy. We acknowledge the proteomic facility at IDIBELL for their help with the mass spectrometry experiment. We are grateful to Dr. Thomas Neufeld, Dr. Andrew Stephens and Dr. Terje Johansen for their constructive comments on the manuscript. We thank Dr. Carles Pons for his computational support during the revision. This study was supported by grants to A.T. from Ministerio de Economía, Industria y Competitividad (SAF2017-85561-R), which is part of Agencia Estatal de Investigación (Co-funded by European Regional Development Fund. ERDF, a way to build Europe), by joint grants to the Laboratory of Cancer Metabolism from Instituto de Salud Carlos III-Red Temática de Investigación Cooperativa en Cáncer (RD12/0036/0049), and from Generalitat de Catalunya- Suport als Grups de Recerca de Catalunya (2017SGR1743). E.A. was supported by Ministerio de Educación, Cultura y Deporte (FPU13/05400) and SAF2017-85561-R. C.D. was supported by Mayo Clinic/NIH training grant 5-T32-CA217836-02 and NIH grant RO1-HL125353 (through Edward Hinchcliffe). C.M. was supported by Juan de la Cierva fellowship (IJCI-2015-24716) from Ministerio de Ciencia, Innovación y Universidades and by European Union’s Horizon 2020 research and innovation program under the Marie Sklodowska-Curie grant agreement (M-Lysosomes, 799000). The authors declare no competing financial interests. We thank CERCA Program/Generalitat de Catalunya for institutional support to IDIBELL.
Disclosure statement
The authors declare no conflict of interest and no competing financial interests.
Supplementary material
Supplemental data for this article can be accessed here.
Additional information
Funding
Related Research Data
References
- McClelland SE. Role of chromosomal instability in cancer progression. Endocr Relat Cancer. 2017;24:T23–31.
- Bakhoum SF, Cantley LC. The multifaceted role of chromosomal instability in cancer and its microenvironment. Cell. 2018;174:1347–1360.
- Thompson SL, Bakhoum SF, Compton DA. Mechanisms of chromosomal instability. Curr Biol CB. 2010;20:R285–295.
- Araujo AR, Gelens L, Sheriff RSM, et al. Positive feedback keeps duration of mitosis temporally insulated from upstream cell-cycle events. Mol Cell. 2016;64:362–375.
- Sullivan M, Morgan DO. Finishing mitosis, one step at a time. Nat Rev Mol Cell Biol. 2007;8:894–903.
- Bloom J, Cross FR. Multiple levels of cyclin specificity in cell-cycle control. Nat Rev Mol Cell Biol. 2007;8:149–160.
- Peters J-M. The anaphase promoting complex/cyclosome: a machine designed to destroy. Nat Rev Mol Cell Biol. 2006;7:644–656.
- Pines J. Cubism and the cell cycle: the many faces of the APC/C. Nat Rev Mol Cell Biol. 2011;12:427–438.
- Jia R, Guardia CM, Pu J, et al. BORC coordinates encounter and fusion of lysosomes with autophagosomes. Autophagy. 2017;13:1648–1663.
- Guardia CM, Farías GG, Jia R, et al. BORC functions upstream of kinesins 1 and 3 to coordinate regional movement of lysosomes along different microtubule tracks. Cell Rep. 2016;17:1950–1961.
- Pu J, Schindler C, Jia R, et al. BORC, a multisubunit complex that regulates lysosome positioning. Dev Cell. 2015;33:176–188.
- Mancias JD, Kimmelman AC. Mechanisms of selective autophagy in normal physiology and cancer. J Mol Biol. 2016;428:1659–1680.
- Lamark T, Svenning S, Johansen T. Regulation of selective autophagy: the p62/SQSTM1 paradigm. Essays Biochem. 2017;61(6):609–624.
- Albertson R, Riggs B, Sullivan W. Membrane traffic: a driving force in cytokinesis. Trends Cell Biol. 2005;15:92–101.
- Boucrot E, Kirchhausen T. Endosomal recycling controls plasma membrane area during mitosis. Proc Natl Acad Sci. 2007;104:7939–7944.
- Jongsma MLM, Berlin I, Neefjes J. On the move: organelle dynamics during mitosis. Trends Cell Biol. 2015;25:112–124.
- Eskelinen E-L, Prescott AR, Cooper J, et al. Inhibition of autophagy in mitotic animal cells. Traffic Cph Den. 2002;3:878–893.
- Furuya T, Kim M, Lipinski M, et al. Negative regulation of Vps34 by Cdk mediated phosphorylation. Mol Cell. 2010;38:500–511.
- Lu G, Yi J, Gubas A, et al. Suppression of autophagy during mitosis via CUL4-RING ubiquitin ligases-mediated WIPI2 polyubiquitination and proteasomal degradation. Autophagy. 2019;15(11):1917–1934.
- Odle RI, Walker SA, Oxley D, et al. An mTORC1-to-CDK1 switch maintains autophagy suppression during mitosis. Mol Cell. 2020;77:228–240.e7.
- Loukil A, Zonca M, Rebouissou C, et al. High-resolution live-cell imaging reveals novel cyclin A2 degradation foci involving autophagy. J Cell Sci. 2014;127:2145–2150.
- Li Z, Zhang X. Autophagy in mitotic animal cells. Sci Bull. 2016;61:105–107.
- Liu L, Xie R, Nguyen S, et al. Robust autophagy/mitophagy persists during mitosis. Cell Cycle Georget Tex. 2009;8:1616–1620.
- Yuan F, Jin X, Li D, et al. ULK1 phosphorylates Mad1 to regulate spindle assembly checkpoint. Nucleic Acids Res. 2019;47:8096–8110.
- Holdgaard SG, Cianfanelli V, Pupo E, et al. Selective autophagy maintains centrosome integrity and accurate mitosis by turnover of centriolar satellites. Nat Commun. 2019;10:4176.
- Joachim J, Razi M, Judith D, et al. Centriolar satellites control GABARAP ubiquitination and GABARAP-mediated autophagy. Curr Biol. 2017;27:2123–2136.e7.
- Mathew R, Kongara S, Beaudoin B, et al. Autophagy suppresses tumor progression by limiting chromosomal instability. Genes Dev. 2007;21:1367–1381.
- Bonifacino JS, Neefjes J. Moving and positioning the endolysosomal system. Curr Opin Cell Biol. 2017;47:1–8.
- Rieder CL, Maiato H. Stuck in division or passing through: what happens when cells cannot satisfy the spindle assembly checkpoint. Dev Cell. 2004;7:637–651.
- Abella N, Brun S, Calvo M, et al. Nucleolar disruption ensures nuclear accumulation of p21 upon DNA damage. Traffic. 2010;11:743–755.
- Verstraeten VLRM, Peckham LA, Olive M, et al. Protein farnesylation inhibitors cause donut-shaped cell nuclei attributable to a centrosome separation defect. Proc Natl Acad Sci USA. 2011;108:4997–5002.
- Liu Y, Zhang Z, Liang H, et al. 2A (PP2A) regulates EG5 to control mitotic progression. Sci Rep. 2017;7(1):1630.
- Ishikawa K, Kamohara Y, Tanaka F, et al. Mitotic centromere-associated kinesin is a novel marker for prognosis and lymph node metastasis in colorectal cancer. Br J Cancer. 2008;98:1824–1829.
- Yao X, Abrieu A, Zheng Y, et al. CENP-E forms a link between attachment of spindle microtubules to kinetochores and the mitotic checkpoint. Nat Cell Biol. 2000;2:484–491.
- Hashizume R, Smirnov I, Liu S, et al. Characterization of a diffuse intrinsic pontine glioma cell line: implications for future investigations and treatment. J Neurooncol. 2012;110:305–313.
- Nagaraja S, Vitanza NA, Woo P, et al. Transcriptional dependencies in diffuse intrinsic pontine glioma. Cancer Cell. 2017;31:635–652.e6.
- Chan K-M, Fang D, Gan H, et al. The histone H3.3K27M mutation in pediatric glioma reprograms H3K27 methylation and gene expression. Genes Dev. 2013;27:985–990.
- Zhang L, Peterson TE, Lu VM, et al. Antitumor activity of novel pyrazole-based small molecular inhibitors of the STAT3 pathway in patient derived high grade glioma cells. PLoS ONE. 2019;14(7):e0220569.
- Mauvezin C, Nagy P, Juhász G, et al. Autophagosome–lysosome fusion is independent of V-ATPase-mediated acidification. Nat Commun. 2015;6:7007.
- Kim OH, Lim JH, Woo KJ, et al. Influence of p53 and p21Waf1 expression on G2/M phase arrest of colorectal carcinoma HCT116 cells to proteasome inhibitors. Int J Oncol. 2004;24:935–941.
- Huszar D, Theoclitou M-E, Skolnik J, et al. Kinesin motor proteins as targets for cancer therapy. Cancer Metastasis Rev. 2009;28:197–208.
- Pontén J, Saksela E. Two established in vitro cell lines from human mesenchymal tumours. Int J Cancer. 1967;2:434–447.
- Fabregat A, Jupe S, Matthews L, et al. The reactome pathway knowledgebase. Nucleic Acids Res. 2018;46:D649–55.
- Stein LD. Using the reactome database. Curr Protoc Bioinforma. 2004;7:8.7.1–8.7.16.
- Shintomi K, Hirano T. Releasing cohesin from chromosome arms in early mitosis: opposing actions of Wapl-Pds5 and Sgo1. Genes Dev. 2009;23:2224–2236.
- Hämälistö S, Stahl JL, Favaro E, et al. Spatially and temporally defined lysosomal leakage facilitates mitotic chromosome segregation. Nat Commun. 2020;11:229.
- Akutsu M, Dikic I, Bremm A. Ubiquitin chain diversity at a glance. J Cell Sci. 2016;129:875–880.
- Rogov V, Dötsch V, Johansen T, et al. Interactions between autophagy receptors and ubiquitin-like proteins form the molecular basis for selective autophagy. Mol Cell. 2014;53:167–178.
- Hewitt G, Carroll B, Sarallah R, et al. SQSTM1/p62 mediates crosstalk between autophagy and the UPS in DNA repair. Autophagy. 2016;12:1917–1930.
- Nam T, Han JH, Devkota S, et al. Emerging paradigm of crosstalk between autophagy and the ubiquitin-proteasome system. Mol Cells. 2017;40:897–905.
- Peters J-M, Nishiyama T. Sister chromatid cohesion. Cold Spring Harb Perspect Biol. 2012;4:a011130.
- Hassler M, Shaltiel IA, Haering CH. Towards a unified model of SMC complex function. Curr Biol. 2018;28:R1266–81.
- Haarhuis JHI, Elbatsh AMO, van den Broek B, et al. WAPL-mediated removal of cohesin protects against segregation errors and aneuploidy. Curr Biol CB. 2013;23:2071–2077.
- Losada A, Hirano M, Hirano T. Cohesin release is required for sister chromatid resolution, but not for condensin-mediated compaction, at the onset of mitosis. Genes Dev. 2002;16:3004–3016.
- Hara K, Zheng G, Qu Q, et al. Structure of cohesin subcomplex pinpoints direct shugoshin–Wapl antagonism in centromeric cohesion. Nat Struct Mol Biol. 2014;21:864–870.
- Nishiyama T, Ladurner R, Schmitz J, et al. Sororin Mediates Sister Chromatid Cohesion by Antagonizing Wapl. Cell. 2010;143:737–749.
- Nakajima M, Kumada K, Hatakeyama K, et al. The complete removal of cohesin from chromosome arms depends on separase. J Cell Sci. 2007;120:4188–4196.
- Misulovin Z, Pherson M, Gause M, et al. Brca2, Pds5 and Wapl differentially control cohesin chromosome association and function. PLoS Genet. 2018;14:e1007225.
- Oikawa K, Ohbayashi T, Kiyono T, et al. Expression of a novel human gene, human wings apart-like (hWAPL), is associated with cervical carcinogenesis and tumor progression. Cancer Res. 2004;64:3545–3549.
- Losada A. Functional contribution of Pds5 to cohesin-mediated cohesion in human cells and Xenopus egg extracts. J Cell Sci. 2005;118:2133–2141.
- Ohbayashi T, Oikawa K, Yamada K, et al. Unscheduled overexpression of human WAPL promotes chromosomal instability. Biochem Biophys Res Commun. 2007;356:699–704.
- Crasta K, Ganem NJ, Dagher R, et al. DNA breaks and chromosome pulverization from errors in mitosis. Nature. 2012;482:53–58.
- Rello-Varona S, Lissa D, Shen S, et al. Autophagic removal of micronuclei. Cell Cycle Georget Tex. 2012;11:170–176.
- Bartsch K, Knittler K, Borowski C, et al. Absence of RNase H2 triggers generation of immunogenic micronuclei removed by autophagy. Hum Mol Genet. 2017;26:3960–3972.
- Hatch EM, Fischer AH, Deerinck TJ, et al. Catastrophic nuclear envelope collapse in cancer cell micronuclei. Cell. 2013;154:47–60.
- Hintzsche H, Hemmann U, Poth A, et al. Fate of micronuclei and micronucleated cells. Mutat Res. 2017;771:85–98.
- Klionsky DJ, Abdelmohsen K, Abe A, et al. Guidelines for the use and interpretation of assays for monitoring autophagy (3rd edition). Autophagy. 2016;12:1–222.
- Chung JY-M, Steen JA, Schwarz TL. Phosphorylation-induced motor shedding is required at mitosis for proper distribution and passive inheritance of mitochondria. Cell Rep. 2016;16:2142–2155.