
ABSTRACT
Defective macroautophagy/autophagy and a failure to initiate the adaptive unfolded protein response (UPR) in response to the endoplasmic reticulum (ER) stress contributes to obesity-associated metabolic dysfunction. However, whether and how unresolved ER stress leads to defects in the autophagy pathway and to the progression of obesity-associated hepatic pathologies remains unclear. Obesity suppresses the expression of hepatic spliced XBP1 (X-box binding protein 1; sXBP1), the key transcription factor that promotes the adaptive UPR. Our RNA-seq analysis revealed that sXBP1 regulates genes involved in lysosomal function in the liver under fasting conditions. Chromatin immunoprecipitation (ChIP) analyzes of both primary hepatocytes and whole livers further showed that sXBP1 occupies the −743 to −523 site of the promoter of Tfeb (transcription factor EB), a master regulator of autophagy and lysosome biogenesis. Notably, this occupancy was significantly reduced in livers from patients with steatosis. In mice, hepatic deletion of Xbp1 (xbp1 LKO) suppressed the transcription of Tfeb as well as autophagy, whereas hepatic overexpression of sXbp1 enhanced Tfeb transcription and autophagy. Moreover, overexpression of Tfeb in the xbp1 LKO mouse liver ameliorated glucose intolerance and steatosis in mice with diet-induced obesity (DIO). Conversely, loss of TFEB function impaired the protective role of sXBP1 in hepatic steatosis in mice with DIO. These data indicate that sXBP1-Tfeb signaling has direct functional consequences in the context of obesity. Collectively, our data provide novel insight into how two organelle stress responses are integrated to protect against obesity-associated metabolic dysfunction.
Abbreviations: AAV8: adeno-associated virus serotype 8; ACTB: actin, beta; ANOVA: analysis of variance; ATF6: activating transcription factor-6; ATG: autophagy related; BECN1: beclin 1; BMI: body mass index; ChIP: chromatin immunoprecipitation; CLEAR: coordinated lysosomal expression and regulation; Cre: cre recombinase; DIO: diet-induced obesity; EBSS: Earle’s balanced salt solution; EIF2AK3/PERK: eukaryotic translation initiation factor 2 alpha kinase 3; ER: endoplasmic reticulum; ERN1/IRE1: endoplasmic reticulum (ER) to nucleus signaling 1; GAPDH: glyceraldehyde-3-phosphate dehydrogenase; GFP: green fluorescent protein; HFD: high-fat diet; h: hours; HSCs: hepatic stellate cells; INS: insulin; L/A: ammonium chloride and leupeptin; MAP1LC3B/LC3B: microtubule-associated protein 1 light chain 3 beta; mRNA: messenger RNA; NAFLD: nonalcoholic fatty liver disease; NASH: nonalcoholic steatohepatitis; RD: regular diet; RFP: red fluorescent protein; SERPINA7/TBG: serpin family A member 7; SQSTM1/p62: sequestome 1; sXbp1 LOE: liver-specific overexpression of spliced Xbp1; TFEB: transcription factor EB; TG: thapsigargin; TN: tunicamycin; UPR: unfolded protein response; wks: weeks; WT: wild type; XBP1: X-box binding protein 1; xbp1 LKO: liver-specific Xbp1 knockout.
Introduction
The endoplasmic reticulum (ER) is the main cellular site for the synthesis and processing of proteins, lipids and carbohydrates. Thus, it is critical in protecting cells against metabolic stresses such as starvation and nutrient overload [Citation1]. Perturbations of ER homeostasis lead to activation of the unfolded protein response (UPR), a complex network of adaptive responses that restore ER function. Disruption of ER homeostasis initiates the UPR through three canonical signaling pathways [Citation1]: the ERN1/IRE1 (endoplasmic reticulum [ER] to nucleus signaling 1) branch; the EIF2AK3/PERK (eukaryotic translation initiation factor 2 alpha kinase 3) branch; and the ATF6 (activating transcription factor 6) branch. Through these branches, the UPR controls a complex network of adaptive responses to restore normal ER function. ERN1 is the most conserved UPR regulator, and activation of ERN1 initiates unconventional splicing of the mRNA that encodes the transcription factor XBP1, producing sXBP1 [Citation2]. This factor then regulates the expression of ER chaperones as well as that of proteins involved in lipogenesis [Citation3,Citation4], hepatic glucose production, and INS (insulin) action [Citation5,Citation6]. Accumulated evidence from rodent studies has implicated that dysfunction of the XBP1 signaling cascade occurs in obesity-associated hyperglycemia [Citation6], hyperlipidemia [Citation7,Citation8] and atherogenesis [Citation9]. Notably, dysregulation of the UPR has been implicated in human nonalcoholic fatty liver disease (NAFLD) and nonalcoholic steatohepatitis (NASH) [Citation10–12], and in both obese mice and humans, the alleviation of ER stress by chemical or molecular chaperones improves metabolic control and INS sensitivity [Citation13,Citation14].
Also key to cellular metabolic adaptation is macroautophagy/autophagy, a conserved catabolic process whereby organelles and components of the cytoplasm are degraded within lysosomes [Citation15]. Under physiological conditions, autophagy plays an important role in maintaining cellular and metabolic homeostasis in the liver. At the cellular level, autophagy maintains organelle homeostasis by modulating mitophagy [Citation16], pexophagy [Citation17,Citation18], lipophagy [Citation19] and ER-phagy [Citation20]. Autophagy also regulates many metabolic processes that are essential for liver function, including glycogenolysis, lipolysis and protein catabolism, thereby contributing to the production of glucose, fatty acids, and amino acids [Citation21,Citation22]. In the setting of metabolic flux, the autophagy machinery is tightly regulated at the transcriptional level by TFEB (transcription factor EB), which activates genes that promote lysosomal biogenesis, lysosomal exocytosis and autophagy [Citation23]. Defective autophagy leads to metabolic defects such as increased food intake [Citation24], INS resistance [Citation25], hepatic steatosis [Citation19,Citation25], hyperinsulinemia [Citation26,Citation27] and muscle atrophy [Citation28]. Conversely, restoration of autophagy and TFEB activity in the liver of obese mice ameliorates obesity-induced INS resistance [Citation25,Citation29]. Currently, several preclinical trials targeting autophagy have been initiated in diverse liver diseases [Citation30].
Although ER stress and autophagy involve distinct pathways, they are tightly integrated. This is supported by studies in a variety of cell lines showing that in addition to providing the membrane material required for autophagosome formation [Citation31,Citation32], each of the three canonical branches of the UPR activates autophagy [Citation33–38], to restore ER homeostasis. A growing body of research has shown that the UPR and autophagy are integrated with the pathogenesis of chronic diseases such as inflammatory bowel diseases [Citation39,Citation40], neurogenerative diseases [Citation36,Citation41] and cancer [Citation42,Citation43]. In addition, it was recently demonstrated that the XBP1-autophagy signaling cascade is required for fibrogenic activation of hepatic stellate cells (HSCs) [Citation12]. In spite of these clear links between the UPR and autophagy, whether they are relevant in the liver in the context of obesity is largely unknown.
Obesity is characterized by organelle dysfunction that is concomitant with a maladaptive organelle stress response [Citation44,Citation45]. In both rodent models and humans, obesity and diabetes are characterized by both failure of the adaptive arms of the UPR and defective autophagy [Citation7,Citation25,Citation46–48]. Our study reveals how a diverse set of organelle stress responses are integrated in the liver. We show that sXBP1 directly drives TFEB-mediated transcriptional regulation of hepatic autophagy, and that obesity-mediated disruption of the sXBP1-Tfeb signaling contributes to impaired metabolic homeostasis.
Results
sXBP1 regulates the expression of genes involved in lysosomal function in the liver
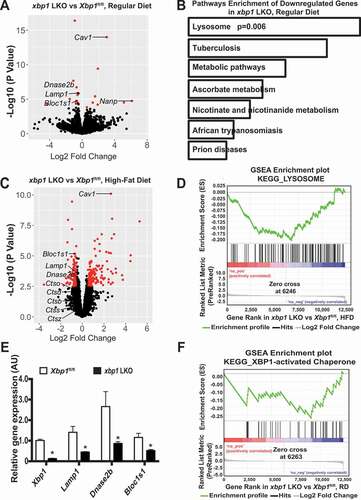
The ERN1-XBP1 branch of the UPR regulates hepatic lipid and glucose homeostasis in response to both preprandial and postprandial metabolic fluxes [Citation49,Citation50]. To obtain an unbiased view of the changes in gene expression that are governed by XBP1, we performed RNA-seq analysis in livers from Xbp1fl/fl (Xbp1tm2Glm) [Citation51] mice and mice with a liver-specific deletion of Xbp1 (xbp1 LKO, mediated by transduction with AAV8-Serpina7/Tbg [serpin family A member 7]-iCre). Under fasting conditions, xbp1 LKO mice fed a regular diet (RD) exhibited markedly lower expression of genes involved in lysosomal function compared to the Xbp1fl/fl controls (). Obesity is associated with the downregulation of XBP1 signaling [Citation5,Citation52,Citation53], which is correlated with impaired lysosomal function [Citation54–56]. We further found that the decrease in the expression of lysosomal genes in the livers from xbp1 LKO mice was more pronounced when mice were fed a high-fat diet (HFD; ). Quantitative RT-PCR validated the decrease in the expression of a subset of genes involved in lysosome function, including Lamp1 (lysosomal-associated membrane protein 1), Dnase2b (deoxyribonuclease 2 beta) and Bloc1s1 (biogenesis of lysosomal organelles complex 1 subunit 1), further supporting our findings from the RNA-seq analysis (). These data are consistent with a previous microarray study in plasma cells showing that XBP1 regulates the expression of genes encoding lysosomal proteins [Citation57]. In addition, we found that sXBP1-activated chaperone was downregulated in xbp1 LKO mice, further validating the efficacy of the Xbp1 liver-specific knockout system ().
Figure 1. XBP1 regulates genes involves in lysosome dynamics. (A) Volcano plot comparing RNA-seq data of livers from male xbp1 LKO mice vs. Xbp1fl/fl mice on a RD following a 16-h fast. The figure illustrates the relationship of FC (log base 2) to the p-value (-log base 10). The red dots represent differential expressed genes that have false discovery rate (FDR) <0.1 and absolute log2 fold-change>0.5. n = 3 mice/group. (B) Pathways that are significantly downregulated in the livers of xbp1 LKO vs. Xbp1fl/fl mice treated as in (A). KEGG categories are determined by Enrichr analysis. (C) Volcano plot comparing RNA-seq data of livers of male xbp1 LKO mice vs. Xbp1fl/fl mice on HFD (16 wks) following a 16-h fast. The figure illustrates the relationship of FC (log base 2) to the p-value (-log base 10). The red dots represent differential expressed genes that have false discovery rate (FDR) <0.1 and absolute log2 fold-change>0.5. n = 3 mice/group. (D) Gene Set Enrichment Analysis (GSEA) plot illustrates significant downregulation of the lysosomal pathway in livers of male xbp1 LKO mice compared with Xbp1fl/fl mice as in (C). (E) Levels of mRNAs encoding genes of interest in livers from mice on a RD following a 16-h fast as in (A), as assessed by quantitative RT-PCR. Data are presented as means ± SEM. * indicates the statistical significance of the difference between xbp1 LKO and Xbp1fl/fl mice, as determined by Student’s t-test (* p < 0.05, n = 3 mice/group). (F) GSEA plot showing significant downregulation of XBP1 target genes in livers from xbp1 LKO mice vs. Xbp1fl/fl mice as in (A)
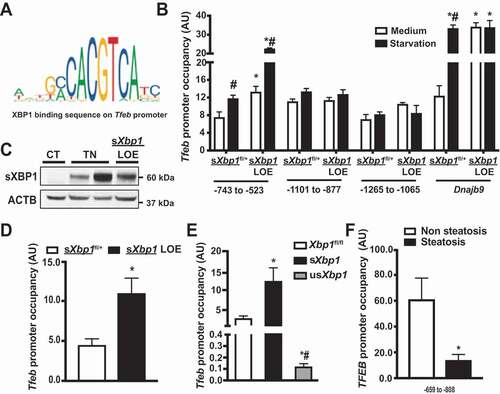
XBP1 is a member of the CEB/P family of transcription factors that bind to UPR elements (UPRE) on their target genes [Citation3]. We performed an in silico search for putative sXBP1 target genes whose protein products are known to be involved in lysosomal function under fasting conditions. Three putative binding sites (−743 to −523; −1,101 to −877; and −1,265 to −1,065) were identified within the promoter of the Tfeb gene (). TFEB is a transcription factor of the basic helix-loop-helix leucine-zipper family and governs the expression of genes that contribute to the regulation of lysosome biogenesis, exocytosis and autophagy [Citation23]. Collectively, our data provide evidence for a link between the sXBP1-mediated transcriptional network and the TFEB-mediated lysosomal autophagy process.
Figure 2. sXBP1 occupies the Tfeb promoter and regulates TFEB expression. (A) Schematic representation of conserved binding sequences identified in the promoter regions of Tfeb using JASPAR. (B) Occupancy of Tfeb promoter regions −743 to −523, −1101 to −877, and −1265 to −1065 by sXBP1, as determined by ChIP assay in primary hepatocytes from sXbp1fl/+ and sXbp1 LOE mice. Cells were treated with EBSS (starvation, 4 h). The known sXBP1 occupancy on the Dnajb9 promoter (−142 to −42) was used as a control. (C) Western blot of sXBP1 expression in livers from sXbp1fl/+ mice, sXbp1fl/+ mice administered with tunicamycin (TN, 0.5 mg/kg) and sXbp1 LOE mice. CT: vehicle control for TN. (D) Occupancy of Tfeb promoter (−743 to −523) by sXBP1 in livers from sXbp1fl/+ and sXbp1 LOE mice (16-h fasting), as determined by ChIP assay. (E) Occupancy of the Tfeb promoter (−743 to −523) by sXBP1 in livers from xbp1 LKO mice (CT) reconstituted with various forms of XBP1 (by adenovirus-mediated gene delivery; the Ad-GFP was used as a control virus in the Xbp1fl/fl group), as determined by ChIP assay. (F) Occupancy of the TFEB promoter (−659 to −808) by sXBP1 in livers from humans with or without steatosis. Data are presented as means ± SEM. For all ChIP assays, data were first normalized to 2% input and then to IgG. * indicates statistical significance as compared to (B and D) the sXbp1fl/+ group, (E) the Xbp1fl/fl group, and (F) the non-steatosis group; # indicates statistical significance compared to (B) treatment with the medium in the same type of cell, and (E) between sXbp1 and usXbp1 groups. Statistical significance was determined by Student’s t-test in D&F, and ANOVA followed by a Tukey’s multiple comparisons test in B and E. p < 0.05, n = 3, biological replicates. AU, arbitrary units
sXBP1 activates TFEB in response to nutrient deprivation
To determine whether sXBP1 can directly occupy the Tfeb promoter, we performed a chromatin immunoprecipitation (ChIP) analysis on primary hepatocytes isolated from conditional sXbp1 overexpression mice (Hprttm1(fl-STOP-fl-sXbp1)Hota; referred to as sXbp1fl/+; Figure S1A), and liver-specific sXbp1 overexpression mice (referred to as sXbp1 LOE; in which sXbp1 was overexpressed by transduction with AAV8-Serpina7-iCre). Under starvation conditions, the overexpression of sXbp1 significantly increased occupancy of sXBP1 within the −743 to −523 region of the Tfeb promoter, but not on the other two predicted sites (). Previous studies have shown that thapsigargin, a chemical inducer of ER stress, induces TFEB expression in epithelial cells [Citation58]. In line with these reports, we found that sXBP1 occupied all three predicted Tfeb promoter sites after primary hepatocytes were treated with thapsigargin (Figure S1B). We believe that the transcriptional regulatory complexes might differ between these two conditions. To identify the sites of sXBP1 binding on the Tfeb promoter in the liver, we performed an sXBP1 ChIP assay in livers from sXbp1 LOE mice under fasting conditions. Livers from sXbp1fl/+ mice treated with tunicamycin (TN, a chemical inducer of ER stress) were used as positive controls (). As shown in , sXBP1 occupied the −743 to −523 region of Tfeb promoter in the liver. In mammals, XBP1 can be translated, but the function of the resulting protein is largely unknown [Citation59]. To determine which forms of XBP1 regulate Tfeb expression, we reconstituted Xbp1-deficient livers with sXbp1 and a non-spliceable Xbp1 (usXbp1) [Citation60] and then performed a ChIP assay. As shown in , reconstitution with sXbp1 significantly increased the occupancy of the Tfeb promoter. Reconstitution with usXbp1 failed to do so and also led to a decrease in occupancy (). This is consistent with previous suggestions that XBP1 binds to and sequesters sXBP1, preventing it from binding to DNA [Citation60,Citation61]. Both sXBP1 and TFEB have been reported to be inactivated in livers from NASH patients with severe steatosis [Citation11,Citation62]. To determine the pathological relevance of the sXBP1-Tfeb axis, we performed sXBP1 ChIP assay in livers from patients with steatosis using an antibody specific against sXBP1. Steatosis led to a decrease in hepatic expression of sXBP1 (Figure S1C and S1D), and this was associated with a reduction in occupancy of the −659 to −808 site of the TFEB promoter with sXBP1 ().
To determine whether sXBP1 regulates the expression of Tfeb, we examined transcript levels in livers from xbp1 LKO mice fasted for 16 h. As shown in , levels of Tfeb were lower in livers from these mice compared to Xbp1fl/fl controls. Further experiments using isolated primary hepatocytes showed that Xbp1 deletion abolished Tfeb expression, which could be partially rescued by restoration of sXbp1 expression (, S2A and S2B). Conversely, expression of the Tfeb mRNA and TFEB targets was increased in primary hepatocytes from sXbp1 LOE mice (Figure S2C). Finally, to determine whether the sXBP1-mediated expression of Tfeb is directly modulated by the binding of sXBP1 to its promoter, we generated Tfeb reporter constructs that either contain or lack the sXBP1 binding site (−743 to −523). Overexpression of sXbp1 resulted in significantly higher activity of the wild-type (WT) Tfeb reporter, whereas only a modest increase in activity of the mutant Tfeb reporter was observed ().
Figure 3. sXBP1 activates TFEB in the liver. (A and B) Levels of mRNAs encoding tested proteins in (A) liver and (B) primary hepatocytes isolated from Xbp1fl/fl mice and xbp1 LKO mice as assessed by quantitative RT-PCR. Data are normalized to Hprt. * indicates statistical significance compared to (A) Xbp1fl/fl, and (B) treatment of medium in the same cell type. # indicates statistical significance compared to the Xbp1fl/fl group with the same treatment; and & indicates statistical significance between xbp1 LKO groups in (B) (n = 3–4, biological replicates). (C) Activity of the Tfeb promoter in primary hepatocytes from sXbp1fl/+ and sXbp1 LOE mice following transfection with the indicated Tfeb-Luc constructs for 48 h and subsequent treatment with EBSS (starvation, 4 h). The data were normalized to Renilla luciferase. * indicates statistical significance compared to WT construct within the same genotype, and # indicates statistical significance compared to sXbp1fl/+ cells with the same construct (n = 4, biological replicates). AU, arbitrary units. (D) Activity of TFEB in primary hepatocytes from Xbp1fl/fl mice and xbp1 LKO mice transduced with the indicated adenoviral constructs; the Ad-GFP was used as a control virus. Cells were isolated and then transfected with 4XCLEAR luciferase reporter construct for 48 h and subsequently treated with EBSS (starvation, 4 h). The data were normalized to those for Renilla luciferase. * indicates statistical significance compared to the Xbp1fl/fl group with same treatment, # indicates statistical significance compared to treatment with medium in cells with same construct, and & indicates statistical significance between xbp1 LKO groups with the same treatment (n = 4, biological replicates). AU, arbitrary units. (E) Representative confocal images (63X) of TFEB staining in livers of Xbp1fl/fl and xbp1 LKO mice fed a RD or HFD (16 wks on HFD, fasted for 16 h). Red, TFEB; blue, DAPI. -Ab: no anti-TFEB controls. Scale bar: 20 μm. (F) Quantification of co-localization of TFEB staining in livers in (E). * indicates the statistical significance compared to the Xbp1fl/fl group, and # indicates the statistical significance between RD and HFD in the same genotype of mice (8 fields/group; n = 3, biological replicates). (G) Western blot analysis showing expressions of XBP1 and TFEB in nuclear fractions from livers of sXbp1fl/+ and sXbp1 LOE mice following fast for 16 h. (H) Quantification of TFEB and sXBP1 nuclear expression in livers from sXbp1fl/+ and sXbp1 LOE mice as in (G). All data are shown as means ± SEM. * indicates the statistical significance compared to the sXbp1fl/+ group (n = 3–4 biological replicates). Statistical significances were determined by Student’s t-test in A and H, and ANOVA followed by Tukey’s multiple comparisons test in B-D and F, p < 0.05
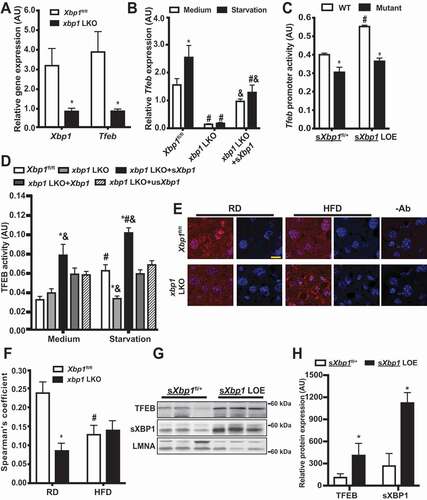
TFEB regulates target genes by binding to the coordinated lysosomal expression and regulation (CLEAR) sequence [Citation63]. We next determined the functional effects of sXBP1-mediated Tfeb expression using a 4xCLEAR construct [Citation64]. As shown in , loss of Xbp1 inhibited starvation-induced TFEB activity in primary hepatocytes. To determine whether TFEB activity is regulated by XBP1 or sXBP1, we reconstituted the livers of xbp1 LKO mice with Xbp1, sXbp1 or usXbp1. Interestingly, only reconstitution with sXbp1 enhanced both basal and starvation-induced TFEB activation in primary hepatocytes from xbp1 LKO mice (). Under conditions of nutrient deprivation, TFEB is dephosphorylated and translocates to the nucleus. We thus examined the nuclear expression of TFEB in livers from xbp1 LKO and sXbp1 LOE mice in the context of fasting. We found that the nuclear localization of TFEB was lower in the livers of xbp1 LKO mice than in control Xbp1fl/fl counterparts, regardless of whether they were fed the RD or HFD (). In contrast, sXBP1 overexpression resulted in an increase in nuclear localization of TFEB compared to sXbp1fl/+ controls (, S2D and S2E). Together, these data demonstrated that sXBP1 activates Tfeb in the liver.
sXBP1 regulates hepatic autophagy
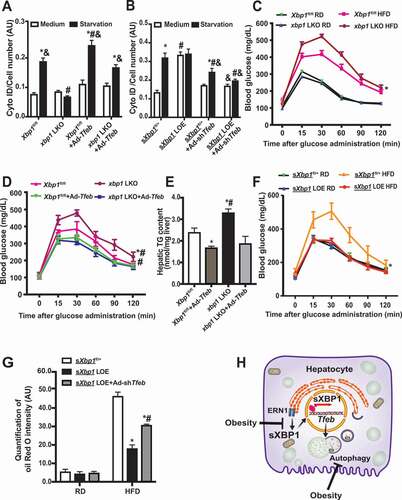
TFEB is a master transcription factor that controls the transcriptional autophagy program [Citation23]. To determine whether XBP1-mediated activation of TFEB regulates autophagy, we measured autophagy in live primary hepatocytes from xbp1 LKO mice reconstituted with Xbp1, sXbp1 or usXbp1, using an autophagosomotropic dye (Cyto-ID). Loss of Xbp1 abolished, whereas reconstitution with sXbp1, rescued both basal and starvation-induced autophagy in xbp1 LKO primary hepatocytes (). To determine whether XBP1-mediated activation of Tfeb regulates autophagic flux, we measured the conversion of MAP1LC3B/LC3B (microtubule-associated protein 1 light chain 3B) from the form I to II, as well as SQSTM1 expression, in primary hepatocytes from Xbp1fl/fl and xbp1 LKO mice. As shown in , starvation induced the conversion of LC3B and treatment with lysosomal inhibitor increased the level of SQSTM1 in mouse primary hepatocytes under starvation conditions. These effects were dampened in cells lacking Xbp1, whereas restoration of sXbp1 significantly improved hepatic autophagic flux (). We also evaluated XBP1-mediated regulation of hepatic autophagic flux in primary hepatocytes using the RFP-GFP-LC3 reporter assay [Citation65]. As shown in Figure S3A and S3B, lysosome-mediated GFP degradation was significantly impaired in xbp1 LKO hepatocytes. To further assess the effects of Xbp1 deletion on autophagy in an in vivo setting, we examined autophagic markers in livers from fasted (16 h) Xbp1fl/fl and xbp1 LKO mice. As shown in , LC3B conversion and the degradation of SQSTM1 were impaired by Xbp1 deletion. In contrast, overexpression of sXbp1 enhanced starvation-induced autophagy in primary hepatocytes (Figure S3C–F). To specifically address whether the regulation of XBP1-mediated autophagy is TFEB-dependent, XBP1-deficient cells were reconstituted with Tfeb by adenovirus-mediated gene delivery. As shown in , TFEB partially rescued hepatic autophagy. In contrast, shRNA-mediated suppression of Tfeb in hepatocytes overexpressing sXbp1 resulted in decreased starvation-induced autophagy (). Collectively, these data indicate that sXBP1 activates hepatic autophagy by regulating the expression of the Tfeb.
Figure 4. sXBP1 regulates hepatic autophagy. (A) Intensity of autophagosomotropic dye (Cyto-ID) in live primary hepatocytes from Xbp1fl/fl mice and xbp1 LKO mice transduced with the indicated adenoviral constructs, the Ad-GFP was used as a control virus. Cells were isolated then subsequently treated with EBSS (starvation, 4 h). * indicates statistical significance compared to treatment with the medium in cells harboring the same construct, # indicates statistical significance compared to the Xbp1fl/fl group with the same treatment, and & indicates statistical significance between xbp1 LKO groups with the same treatment (n = 4, biological replicates). (B) Representative western blots of converted LC3B (arrow marks LC3-II) and SQSTM1 protein in primary hepatocytes from Xbp1fl/fl mice and xbp1 LKO mice as in (A). L/A: ammonium chloride and leupeptin, 4 h. Each lane contains protein lysate from an individual mouse. (C and D) Densitometric analysis of western blot in (B). The data were normalized to those of ACTB. * indicates statistical significance compared to the medium group in the same type of cells, and # indicates statistical significance between starvation groups in the same type of cells (n = 3 biological replicates). (E) Representative western blots and densitometric analysis (F) of LC3B and SQSTM1 in livers from Xbp1fl/fl and xbp1 LKO mice under fasting (16 h) conditions. The data were normalized to ACTB. *indicates statistical significance compared to the Xbp1fl/fl group (n = 4–5 biological replicates). All data are presented as means ± SEM. Statistical significance was determined by ANOVA followed by Tukey’s multiple comparisons test in A, C and D, and Student’s t-test in F, p < 0.05
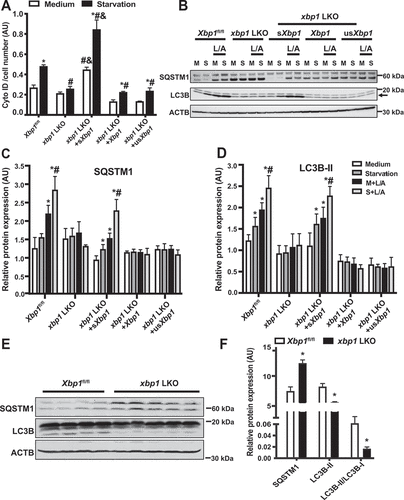
Figure 5. Impairment of XBP1-TFEB axis contributes to obesity-associated INS resistance. (A) Intensity of Cyto-ID in live primary hepatocytes from Xbp1fl/fl mice and xbp1 LKO mice following transduction of the indicated adenoviral constructs for 48 h and subsequent treatment with EBSS (starvation) for 4 h. * indicates statistical significance compared to treatment of medium groups in cells with the same construct, # indicates statistical significance compared to the Xbp1fl/fl groups with the same treatment, and & indicates statistical significance compared to xbp1 LKO groups with same treatment (n = 3, biological replicates). (B) Intensity of Cyto-ID in live primary hepatocytes from sXbp1fl/+ mice and sXbp1 LOE mice following transduction of the indicated adenoviral constructs and subsequent treatment with EBSS (starvation) for 4 h. * indicates statistical significance compared to treatment of medium groups in cells with the same type of construct, # indicates statistical significance compared to the sXbp1fl/+ groups with same treatment, and & indicates statistical significance compared to the sXbp1 LOE groups with the same treatment (n = 3, biological replicates). (C) Glucose tolerance test in Xbp1fl/fl mice transduced with AAV8-Serpina7-eGFP (Xbp1fl/fl) or AAV8-Serpina7-iCre (xbp1 LKO) and fed a RD or HFD (12 wks on HFD). * indicates statistical significance between Xbp1fl/fl and xbp1 LKO groups (n = 6–8 mice/group). (D) Glucose tolerance test in Xbp1fl/fl mice and xbp1 LKO mice fed HFD followed by transduction with Ad-Tfeb. * indicates statistical significance between Xbp1fl/fl and xbp1 LKO groups, and # indicates statistical significance compared to Ad-Tfeb groups in same type of mice (n = 6–8 mice/group). (E) Hepatic triglyceride (TG) levels in livers from mice in (D). * indicates statistically significant difference compared to the Xbp1fl/fl group, and # indicates statistically significant difference between the xbp1 LKO groups (n = 4–5 mice/group). (F) Glucose tolerance in sXbp1fl/+ mice transduced with AAV8-Serpina7-eGFP (sXbp1fl/+) or AAV8-Serpina7-iCre (sXbp1 LOE) and fed a RD or HFD (12 wks on HFD). * indicates statistical significance between the HFD groups (n = 6–8 mice/group). (G) Quantification of Oil Red O intensity in livers from sXbp1fl/+ mice and sXbp1 LOE mice fed with HFD (12 wks on HFD) followed by transduction with Ad-shTfeb. * indicates statistically significant difference relative to the sXbp1fl/+ group, and # indicates statistically significant difference between the sXbp1 LOE groups (n = 3, biological replicates). (H) Working model of this study. In the liver, the ER and autophagy are functionally coupled at the transcriptional level via sXBP1-mediated Tfeb expression. Loss of the crosstalk between the UPR and lysosomal dynamics leads to impaired hepatic autophagy and insulin resistance in the context of obesity. All data are presented as means ± SEM. Statistical significance was determined by ANOVA followed by Tukey’s multiple comparisons test in A&B&E&G, and by ANOVA followed by Tukey’s multiple comparisons test of area under a curve (AUC) in C, D and F, p < 0.05
sXBP1 ameliorates obesity-associated metabolic dysfunction by regulating TFEB
Previous studies from our group and others showed that obesity suppresses the expression of sXBP1 [Citation11,Citation53], and that this state coexists with defective hepatic autophagy [Citation25]. A recent study in mice also demonstrated that obesity leads to inactivation of TFEB in the liver, whereas overexpression of TFEB improves glucose homeostasis in obese mice [Citation66]. To determine the pathophysiological role of hepatic sXBP1-Tfeb signaling in the context of obesity, we examined glucose homeostasis in xbp1 LKO mice fed the RD or HFD. Loss of Xbp1 in the liver significantly worsened obesity-associated glucose intolerance (). To determine whether this metabolic effect of hepatic sXBP1 was TFEB-dependent, we overexpressed Tfeb in the livers of xbp1 LKO mice. As shown in and S3G, obesity-induced glucose intolerance and hepatic steatosis were potentiated in the xbp1 LKO mice, whereas gain of TFEB function in the liver ameliorated these obesity-associated metabolic dysfunctions. Conversely, we knocked down Tfeb in the livers of sXbp1 LOE mice by adenovirus-mediated gene silencing [Citation55]. We found that gain of the sXBP1 function in the liver significantly improved obesity-associated glucose intolerance (). Furthermore, knockdown of Tfeb significantly reduced the improvement in steatosis in the sXbp1 LOE mice fed with the HFD ( and S3H). Together, these data indicate that XBP1 protects against obesity-associated hepatic insulin resistance, in part by modulating Tfeb transcription ().
Discussion
Obesity is characterized by disturbed organelle homeostasis [Citation44,Citation45]. Although dysfunction of the ER and autophagy contributes to obesity-associated liver pathologies, how these organelles interact to initiate the stress response in the context of obesity is largely unknown. The work reported here reveals that the ER and autophagy are functionally coupled at the transcriptional level via XBP1-mediated activation of Tfeb. Our study further establishes that loss of this crosstalk between the UPR and lysosomal dynamics leads to impaired hepatic autophagy and INS resistance in the context of obesity ().
ER stress-induced autophagy plays an important role in cell survival [Citation67] and minimizes the detrimental impact of ER stress [Citation20]. In mouse embryonic fibroblasts and HEK 293T cells subjected to ER stress, ATF6 upregulates Becn1 (Beclin1) [Citation34] as well as Atg9a [Citation38]. In addition, activation of the EIF2AK3 axis induces the expression of several key regulators of autophagy such as Atg5 and Becn1 [Citation33]. For the ERN1-XBP1-mediated UPR branch, it has been reported that XBP1 could induce autophagy by activation of Becn1 [Citation35] or suppress FOXO-dependent induction of autophagy in neuronal and cancer cell lines [Citation36,Citation37]. However, many of these pathways were established in various cell lines and tissues in response to diverse stress stimuli, the relevance of these interactions in the liver under the pathophysiological conditions that characterize obesity are largely unknown. In the livers of both obese mice and humans, the production of key downstream effectors of the ER stress defenses (e.g. sXBP1 and ATF6) is disproportionately low despite robust engagement of upstream signaling molecules such as EIF2AK3 [Citation46,Citation52]. Recently, we demonstrated that obesity-associated nitrosative stress impairs ERN1-mediated XBP1 signaling [Citation53], whereas suppression of nitrosative stress by NOS2-deletion increases sXbp1 [Citation53] and activates TFEB [Citation68]. In the current study, we identify the molecular mechanism that links the impaired adaptive UPR and defective autophagy signaling cascades. We found that, in the context of obesity, downregulation of XBP1-mediated activation of the transcription factor that regulates autophagy, TFEB, led to impaired autophagy in the liver. Our data further improve our understanding of previous findings from a recent study demonstrating that overexpression of sXBP1 increases hepatic autophagy in a genetic model of obesity, the ob/ob mouse [Citation69]. Although we did not detect an alteration of Becn1 transcription in livers overexpressing sXbp1 (data not shown), we believe that this regulation is likely context-dependent. Indeed, it has been demonstrated that Xbp1 deficiency activates autophagy and protects against amyotrophic lateral sclerosis in mice [Citation41], and that XBP1-mediated autophagy activates HSCs [Citation12].
Given that the regulation of autophagy involves many steps and regulators, it has been suggested that a number of conditions, such as hyperinsulinemia [Citation70], hyperactivation of MTOR (mechanistic target of rapamycin kinase) [Citation71], and lipid-induced blockage of the fusion of autophagosomes and lysosomes [Citation72] cause the defects in hepatic autophagy that are associated with obesity. We previously showed that calpain-dependent degradation of ATG7 [Citation25] and inflammation-mediated impairment of lysosome function [Citation54] lead to defects in hepatic autophagy in obese mice. At the transcriptional level, it has been demonstrated that PPARA (peroxisome proliferator activated receptor alpha) induces the expression of autophagy genes [Citation73], whereas GPBAR1 (G protein-coupled bile acid receptor 1) represses autophagy in the liver [Citation74]. In the current study, we found that sXBP1 binds to Tfeb and activates its transcriptional activity in hepatocytes. This is in line with recent studies in C. elegans, demonstrating that neuronal sXBP1 regulates genes involve in lysosomal function and promotes longevity [Citation75,Citation76]. Together, these studies provide novel insights into the mechanisms by which transcriptional networks control hepatic autophagy under conditions of nutritional flux.
In response to ER stress in the liver, XBP1 is processed into a spliced form, sXBP1, producing a transcription factor that reestablishes ER homeostasis, regulates glucose and lipid metabolism [Citation4,Citation6], and controls postprandial transcriptional programs [Citation49]. Recent studies indicated that starvation also activates hepatic sXBP1, resulting in modulation of mitochondrial beta-oxidation via PPARA [Citation50], a major regulator of energy expenditure. In this study, we demonstrated that, in addition to promoting autophagy, sXBP1 activates TFEB under fasting conditions. This finding implicates the important function of sXBP1 in both pre- and post-prandial responses in the liver. Moreover, ER stress has been implicated in the induction of TFEB expression [Citation58]. Although we found that chemically induced ER stress leads to the occupancy of several sites within the Tfeb promoter by sXBP1, in the context of starvation, the occupancy is distinct (). These data support the notion that the contribution of sXBP1 to transcriptional regulation is specific for various stressors. In support of this notion, a recent study identified an anti-lipogenic role for sXBP1 in ob/ob mice in the context of refeeding [Citation69], which is opposite to the lipogenic function of sXBP1 in the presence of a chemical inducer of ER stress [Citation4]. Future in vivo studies are required to determine how XBP1 controls different gene expression programs in the context of distinct forms of metabolic stress.
Upon its activation, cytosolic TFEB relocates to the nucleus and induces the expression of autophagy genes, as well as genes involved in the lysosomal biogenesis. In addition, TFEB controls lipid metabolism by transcriptional activation of PPARGC1A (PPARG coactivator 1 alpha), promoting beta-oxidation [Citation66]. Thus, TFEB could potentially influence metabolism through multiple regulatory pathways. Here, we show that the gain of TFEB function in xbp1 LKO mice protected DIO mice from glucose intolerance and steatosis, whereas loss of TFEB function in sXbp1 LOE mice augmented obesity-associated steatosis (). Although this regulation is involved in the modulation of autophagy, we could not completely rule out an autophagy-independent role of the sXBP1-Tfeb signaling cascade on hepatic lipid metabolism. Therefore, future studies will focus on dissecting the contributions of each of the TFEB-regulated pathways. Lastly, our discovery that hepatic steatosis suppresses sXBP1 expression in the human liver samples (Figure S1C) is in contrast with the findings of a previous study demonstrating an increase in the sXBP1 signature in livers from humans with NAFLD, NASH, and advanced NASH [Citation12]. It should be noted that although sXBP1 occupies the TFEB promoter (), how sXBP1 is regulated in human liver diseases is complex. Therefore, a study utilizing a large number of human samples at various stages of NAFLD will be required to define the pathophysiological impact of the interaction between sXBP1 and Tfeb in the context of human diseases.
In response to stress, all cells have developed a powerful integrated network of organelle stress responses to reestablish cellular and systemic homeostasis. Our study demonstrates that the UPR regulates hepatic autophagy by coordinating two transcriptional programs. Ultimately, understanding the sXBP1-Tfeb signaling cascade network will help determine how organelle stress responses integrate with metabolic pathways in the context of the pathophysiological conditions associated with obesity.
Limitations
One limitation of the current study is that it was performed by using very small number of mice and human patients. Although our data clearly show that sXBP1 occupies the TFEB promoter (), the upstream regulation of sXBP1 in human liver diseases is complex and remains unclear. A study utilizing large numbers of mouse and human samples will be required to define the pathophysiological impact of the interaction between sXBP1 and Tfeb in the context of obesity. A second limitation of the current study is that it was performed in a single mouse strain (C57BL/6 J) at a single mouse facility. Thus, the impact of genetic background and environment on the effectiveness of sXBP1-Tfeb signaling in systemic metabolic hemostasis in the context of obesity remains to be determined.
Acknowledgments
We are grateful to Dr. Albert La Spada (University of California, San Diego) for providing the 4XCLEAR-luciferase construct. We also thank Dr. Laurie H. Glimcher (Dana-Farber Cancer Institute) for providing the Xbp1fl/fl mice, the University of Kansas Medical Center Liver Center for providing us the human liver tissues, the patients who donated their specimens for research, and the physicians, nurses, and researchers who procured the specimens.
Materials and methods
Cell culture
Primary hepatocytes were isolated from mice using the collagenase type X (Wako, 039–17864) perfusion method [Citation53]. Briefly, the cells were washed with hepatocyte wash medium (Thermo Fisher Scientific, 17704024), purified by Percoll (GE Healthcare Life Sciences, 17089101) density gradient separation, and resuspended in William’s E medium (Thermo Fisher Scientific, 12551032) with 5% FBS (Gibco, 26140079), 10 nM dexamethasone (Sigma-Aldrich, D1756), and 20 nM INS (insulin, Sigma-Aldrich, I5500). They were then seeded on COL1A1/collagen I (Corning, 354236)-coated plates at a final density of 3.5 × 10⁴ cells/cm2. After 4 h, attached cells were cultured with fresh medium and transduced with the indicated adenoviruses. Primary hepatocytes were treated with Earle’s Balanced Salt Solution (EBSS; Sigma-Aldrich, E3024) for 4 h to induce autophagy; with 200 nM thapsigargin (Sigma-Aldrich, T9033) for 4 h to induce ER stress; and with 20 mM ammonium chloride (Sigma-Aldrich, A9434) and 100 mM leupeptin (Sigma-Aldrich, L5793) were used to inhibit lysosomal degradation.
Mouse models
Animal care and experimental procedures were performed with approval from the University of Iowa’s Institutional Animal Care and Use Committee. C57BL/6 J mice (The Jackson Laboratory, 000664), Xbp1fl/fl mice (provided from Dr. Laurie H. Glimcher at the Dana-Farber Cancer Institute), and sXbp1fl/+ mice (Hprttm1(fl-STOP-fl-sXbp1)Hota; generated by genOway, France). Briefly, embryonic stem (ES) cells containing a 35 kb Hprt gene deletion (encompassing the 5ʹ UTR to intron 2) were generated. The knock-in vector was constructed by inserting the transgene (composed of the CAG promoter, sXbp1 cDNA, and transcriptional STOP cassette) into the genOway’s “Quick Knock-in” vector. The ES cells were then electroporated with the knock-in vector. After screening, the ES cell clones containing recombined transgenes were expanded and selected for injection into blastocysts. The founder mice were bred with WT (C57BL/6 J) mice, and the F1 mice carrying the transgenic gene were selected and backcrossed to the C57BL/6 J background for more than 9 generations. Mice were kept on a 12 h light cycle and were fed the RD (Teklad global diet, 7913). Mice used in generating the DIO model were placed on a 60% kCal high-fat diet (Research Diets, D12492) immediately after weaning, at 3 wks of age. AAV8-Serpina7-iCre and AAV8-Serpina7-eGFP were purchased from Vector Biolabs and delivered via retro-orbital injection at a titer of 1.25 × 10¹¹ GC/mouse [Citation55,Citation68]. Adenovirus-shTfeb, adenovirus-Tfeb, adenovirus-GFP, adenovirus-shLacZ, adenovirus-sXbp1, adenovirus-Xbp1 and adenovirus-usXbp1 (Table S1) were delivered via retro-orbital injection at a titer of 1 × 10¹¹ ifu/mouse [Citation53,Citation55,Citation68]. Tunicamycin was administrated intraperitoneally to mice at 0.5 mg/kg in 150 mM dextrose [Citation53]. After 6 h, tissues were harvested, frozen in liquid nitrogen, and kept at −80°C until processing.
Human liver samples
The specimens used in this study were provided by the University of Kansas Liver Center Tissue Bank. The use of human liver tissues was approved by the University of Iowa Institutional Review Board as non-human subjects research. All of the donors are non-diabetic. The non-steatosis donors are, age, 20–64 years; BMI, 21.5–29.96; males, three; and females, one. The steatosis donors are: age,17–58; BMI, 24.3–69.6; males, 3; females, one; steatosis, 10–70%.
Oil red o staining
Frozen liver sections were fixed with 10% formalin (Sigma-Aldrich, HT501128), and stained with 0.3% Oil red O (Sigma-Aldrich, O0625) solution. The images were observed under a Nikon microscope (20X) and quantified using Fiji/ImageJ (NIH).
Immunoblotting
Primary antibodies for immunoblotting were anti-LC3B (Novus, NB600) used at a 1:3,000 dilution, anti-ACTB (Abcam, ab8227) used at a 1:2,000 dilution, anti-SQSTM1 (Abnova, H00008878-M03 for primary hepatocytes; MBL, PM066 for liver tissue), anti-TFEB (Bethyl, A303-673A), and anti-LMNA (lamin A; Cell Signaling Technology, 4777) used at a 1:1,000 dilution. Secondary antibodies were horseradish peroxidase-conjugated goat-anti-mouse-IgG (Santa Cruz Biotechnology, sc-2005), horseradish peroxidase-conjugated mouse-anti-rabbit-IgG (Santa Cruz Biotechnology, sc-2357), or horseradish peroxidase-conjugated goat-anti-guinea pig-IgG (Santa Cruz Biotechnology, sc-2438). Signal was detected using the ChemiDoc Touch Imaging System (Bio-Rad), and densitometry analyses of western blot images were performed by using the Image Lab software (Bio-Rad).
Nuclear fractionation
The nuclear fractions were prepared as previously described [Citation53]. Briefly, 150 mg liver tissue was homogenized in hypotonic buffer: 250 mM sucrose (Sigma-Aldrich, S7903), 20 mM HEPES (Sigma-Aldrich, H3375), pH 7.5, 10 mM KCl (Sigma-Aldrich, P9333), 1.5 mM MgCl2 (Sigma-Aldrich, 208,337), 1 mM EDTA (Sigma-Aldrich, EDS), 1 mM EGTA (Sigma-Aldrich, E3889) followed by filtering through 100 μm cell strainer. The cell lysates were centrifuged at 825 g for 20 min at 4°C. The pellets were dissolved in NE buffer (20 mM HEPES, pH 7.9, 1.5 mM MgCl2, 0.5 M NaCl (Sigma-Aldrich, S7653), 0.2 mM EDTA, 20% glycerol (Sigma-Aldrich, G5516) and passed through 32 G needle. The lysate was further cleared by spinning at 18,000 g for 15 min at 4°C.
ChIP assay
The chromatin immunoprecipitation assay was performed using the SimpleChIP Enzymatic Chromatin IP Kit (Cell Signaling Technology, 9003) with some modifications. Briefly, 50 mg liver tissue or primary hepatocytes were crosslinked with 1% formaldehyde (Sigma-Aldrich, F8775), after which the reaction was stopped by washing with ice-cold PBS (Gibco, 14,190,144) containing 0.125 M glycine (americanBio, AB00730-10,000) and protease inhibitor (Sigma-Aldrich, P8849). Nuclei were then isolated, and the chromatin was immunoprecipitated with protein A/G magnetic beads (Thermo Fisher Scientific, 88,802) conjugated with anti-IgG (Cell Signaling Technology, 2729), anti-XBP1 s from Cell Signaling Technology (12,782) for mouse samples, and anti-XBP1 s (BioLegend, 647,502) for human samples, overnight at 4°C. The DNA was eluted from the beads and subjected to PCR analysis. The primers used for ChIP assays are Tfeb promoter (mouse): −743 to −523: forward 5ʹ-TCAGGGGACTTGCATTCCTA-3ʹ, reverse 5ʹ-CTTCTTCACCTCCTCCGAGA-3ʹ; −1,101 to −877: forward 5ʹ-GGCTGTCCCTGAGAAGTCAC-3ʹ, reverse 5ʹ-ACCCACAGGCAGAGAATCAC-3ʹ; −1,265 to −1,065: forward 5ʹ-GCTTGACCAAGGTCACATAACA-3ʹ, reverse 5ʹ- GGAAAGAGCAGAACCCAGTG-3ʹ. Dnajb9 promoter (mouse): −142 to −42: forward 5ʹ- AGTGACGCAAGGACCAAACG-3ʹ, reverse 5ʹ- CTACACGAAACGCTTCCCCA-3ʹ [Citation4]. Tfeb promoter (human): −659 to −808: forward 5ʹ- TGGGAGGATTTCTGGAACAG-3ʹ, reverse 5ʹ- AGGTTTAACCACCAGGCTGA-3ʹ.
Immunohistology and immunocytochemistry
Frozen liver sections were fixed with 4% paraformaldehyde and subsequently stained with an anti-TFEB antibody (Bethyl, A303-673A) and an Alexa-488-conjugated secondary antibody (Invitrogen, A11008). Images were taken while viewing samples through a Zeiss 700 confocal microscope, and signal was quantified using the ImarisColoc software (Bitplane).
Quantitative real-time RT-PCR
Total RNA was isolated using the Trizol reagent (Invitrogen, 15,596,026) and reverse transcribed into cDNA using an iScript cDNA synthesis kit (BioRad, 1,708,891). Quantitative real-time RT-PCR analysis was performed using SYBR Green (BioRad, 1,725,121). The primers used in the mouse study were Gapdh: forward 5ʹ- TGTGTCCGTCGTGGATCTGA-3ʹ, reverse 5ʹ-CCTGCTTCACCACCTTCTTGAT-3ʹ; Hprt: forward 5ʹ-CAGTCCCAGCGTCGTGATTA-3ʹ, reverse 5ʹ-GGCCTCCCATCTCCTTCATG-3ʹ; Xbp1: forward 5ʹ-AGCAGCAAGTGGTGGATTTG-3ʹ, reverse 5ʹ-GAGTTTTCTCCCGTAAAAGCTGA-3ʹ; sXbp1: forward 5ʹ-GGTCTGCTGAGTCCGCAGCAGG-3ʹ, reverse 5ʹ-AGGCTTGGTGTATACATGG-3ʹ; Lamp1: forward 5ʹ-CAGCACTCTTTGAGGTGAAAAAC-3ʹ, reverse 5ʹACGATCTGAGAACCATTCGCA-3ʹ; Dnase2b: forward 5ʹ-ACACCAGAAATCTCATGCAGAAA-3ʹ, reverse 5ʹ-GGAGTCCAGGTACAGGTACTG-3ʹ; Bloc1s1: forward 5ʹ-TCCCGCCTGCTCAAAGAAC-3ʹ, reverse 5ʹ-GAGGTGATCCACCAACGCTT-3ʹ; Tfeb: forward 5ʹ- CCAGAAGCGAGAGCTCACAGAT-3ʹ, reverse 5ʹ-TGTGATTGTCTTTCTTCTGCCG-3ʹ; Map1lc3b: forward 5ʹ-GACCGGCCTTTCAAGCAG-3ʹ, reverse 5ʹ-TGGGACCAGAAACTTGGTCT-3ʹ; and Sqstm1: forward 5ʹ-TGGGCAAGGAGGAGGCGACC-3ʹ, reverse 5ʹ-CCTCATCGCGGTAGTGCGCC-3ʹ. For human, sXBP1: forward5ʹ-GGTCTGCTGAGTCCGCAGCAGG-3ʹ, reverse 5ʹ-GGGCTTGGTATATATGTGG-3ʹ. HPRT1: forward 5ʹ-CATTATGCTGAGGATTTGGAAAGG-3ʹ, reverse 5ʹ- CTTGAGCACACAGAGGGCTACA-3ʹ.
Adenovirus transduction, mutagenesis and luciferase assay
The detailed information for plasmids, adenovirus and adeno-associated virus (AAV) is included in Table S1.
Primary hepatocytes were transduced with adenovirus-mRFP-GFP-Lc3 at a multiplicity of infection (MOI) of 2, adenovirus-shTfeb and adenovirus-shLacZ at an MOI of 10, as well as adenovirus-Tfeb at an MOI of 5 for 48 h [Citation55]. The Tfeb 1 kb promoter containing putative sXBP1 binding site was amplified with PCR (Tfeb−1kb-F1: 5ʹ-GAGCTCGCTAGCATGCCGAGTTGCCTGCCC-3ʹ, Tfeb-1kb-F1: 5ʹ-ATTGCCAAGCTTCAAGTTCCCTGAGTTCTAG-3ʹ) and cloned into pGL4.15 (Promega, E6701) luciferase reporter vector digested with NheI and HindIII. We use overlap PCR to delete the putative binding site of XBP1 in the Tfeb promoter (Tfeb-dACGT-F1: 5ʹ-GACATGGAATAACAATAACAAAATAAGAAGCAAAAA-3ʹ, Tfeb-dACGT-R1: 5ʹ-TTTTTGCTTCTTATTTTGTTA TTGTTATTCCATGTC-3ʹ). Primary hepatocytes were transfected with the 0.6 µg/well 4X-CLEAR luciferase reporter [Citation64] and 0.15 µg/well Renilla luciferase vector (Promega, E2261) using polyethylenimine (PEI, Polysciences INC, 23,966). At 48 h post-transfection, the activities of firefly luciferase and Renilla luciferase were measured using the Dual-Glo Luciferase Assay (Promega, E2920).
Cyto-ID analysis
Primary hepatocytes were stained with Cyto-ID following the manufacturer’s protocol (ENZO Life Sciences, ENZ-51,031) [Citation55]. Briefly, Cyto-ID Green Detection Reagent was added to primary hepatocytes, and the cells were incubated at 37°C for 30 min. The level of autophagy was expressed as fluorescence intensity and normalized to nuclear intensity. The nuclei were stained with Hoechst 33,258 (Thermo Fisher Scientific, H3569).
Glucose tolerance test, INS tolerance test, hepatic triglyceride content, and INS infusion
Glucose tolerance was tested by intraperitoneal glucose injection (1 g/kg body weight, 50% dextrose, Hospra Inc, 0409–6648-02). INS tolerance was tested by intraperitoneal INS injection (0.75 IU/kg, Humulin, Lilly USA, LLC, 002–8215-01). The triglyceride content of the liver tissue was measured by using a Triglyceride Quantification Colorimetric/Fluorometric Kit (BioVision, K622).
RNA-seq and data analysis
For each test group, total RNA was extracted from frozen liver samples from 3 mice. Generation of the RNA-seq library and sequencing were performed by the University of Iowa Genomics Core. RNA-seq reads were quality checked using the FastQC tool (http://www.bioinformatics.babraham.ac.uk/projects/fastqc). Low-quality and adapter sequences were trimmed using the Trimmomatic [Citation77]. Expression of transcripts was quantified using the Salmon tool [Citation78], and estimates of transcript abundance for gene-level analysis were imported and summarized using the tximport [Citation79] function of the R/Bioconductor software suite [Citation80]. Differentially expressed genes (DEGs) were identified by applying the R/Bioconductor package Deseq2 [Citation81]. Enriched pathways represented by the DEGs were identified by gene set enrichment analysis (GSEA) [Citation82] and Enrichr [Citation83]. The sequence data from this study have been deposited in the National Center for Biotechnology Information Gene Expression Omnibus (NCBI GEO). For in silico analysis, we first analyzed a select set of genes that are downregulated in the livers of xbp1 LKO mice and whose protein products are involved in lysosomal function. As a second step, we identified direct interacting partners of these proteins in the STRING protein-protein interaction database [Citation84]. As a third step, we used the Find Individual Motif Occurrences (FIMO) software to identify putative binding sites of XBP1 in the promoters of these genes [Citation85].
Putative binding-site analysis
Xbp1 motifs were downloaded from the Jaspar database (MA0844.1) [Citation86]. The DNA sequences of promoters (−2,000 bp to +150 bp) were downloaded from the UCSC genome browser. FIMO from the MEME suite was applied to scan promoters for putative XBP1 binding sites. We used a p-value of 10−3 as a selection cutoff.
Statistical analysis
Results are expressed as the mean ± the standard error of the mean (SEM); n represents the number of individual mice (biological replicates) or individual experiments (technical replicates) as indicated in the figure legends. We performed the Shapiro-Wilk Normality test in experiments that have a relatively large sample size (n > 5) and found that these data pass the normality test (alpha = 0.05). Data were further analyzed with two-tailed Student’s and Welch’s t-test for two-group comparisons, ANOVA for multiple comparisons. For both One-Way ANOVA and Two-Way ANOVA, Tukey’s post-hoc multiple comparisons were applied as recommended by Prism. In all cases, GraphPad Prism (GraphPad Software Prism 8, San Diego, CA) was used for the calculations.
Supplemental Material
Download Zip (12.6 MB)Disclosure statement
No potential conflict of interest was reported by the authors.
Supplementary material
Supplemental data for this article can be accessed here.
Additional information
Funding
Related Research Data
References
- Ron D, Walter P. Signal integration in the endoplasmic reticulum unfolded protein response. Nat Rev Mol Cell Biol. 2007 Jul;8(7):519–529.
- Sidrauski C, Walter P. The transmembrane kinase Ire1p is a site-specific endonuclease that initiates mRNA splicing in the unfolded protein response. Cell. 1997 Sep 19;90(6):1031–1039.
- Lee AH, Iwakoshi NN, Glimcher LH. XBP-1 regulates a subset of endoplasmic reticulum resident chaperone genes in the unfolded protein response. Mol Cell Biol. 2003 Nov;23(21):7448–7459.
- Lee AH, Scapa EF, Cohen DE, et al. Regulation of hepatic lipogenesis by the transcription factor XBP1. Science. 2008 Jun 13;320(5882):1492–1496.
- Park SW, Zhou Y, Lee J, et al. The regulatory subunits of PI3K, p85alpha and p85beta, interact with XBP-1 and increase its nuclear translocation. Nat Med. 2010 Apr;16(4):429–437.
- Zhou Y, Lee J, Reno CM, et al. Regulation of glucose homeostasis through a XBP-1-FoxO1 interaction. Nat Med. 2011 Mar;17(3):356–365.
- Ozcan U, Cao Q, Yilmaz E, et al. Endoplasmic reticulum stress links obesity, insulin action, and type 2 diabetes. Science. 2004 Oct 15;306(5695):457–461.
- Zhang K, Wang S, Malhotra J, et al. The unfolded protein response transducer IRE1alpha prevents ER stress-induced hepatic steatosis. Embo J. 2011 Apr 6;30(7):1357–1375.
- Zeng L, Zampetaki A, Margariti A, et al. Sustained activation of XBP1 splicing leads to endothelial apoptosis and atherosclerosis development in response to disturbed flow. Proc Natl Acad Sci U S A. 2009 May 19;106(20):8326–8331.
- Puri P, Mirshahi F, Cheung O, et al. Activation and dysregulation of the unfolded protein response in nonalcoholic fatty liver disease. Gastroenterology. 2008 Feb;134(2):568–576.
- Wang JM, Qiu Y, Yang Z, et al. IRE1alpha prevents hepatic steatosis by processing and promoting the degradation of select microRNAs. Sci Signal. 2018 May 15;11(530):eaao4617.
- Kim RS, Hasegawa D, Goossens N, et al. The XBP1 arm of the unfolded protein response induces fibrogenic activity in hepatic stellate cells through autophagy. Sci Rep. 2016 Dec 20;6(1):39342.
- Ozcan U, Yilmaz E, Ozcan L, et al. Chemical chaperones reduce ER stress and restore glucose homeostasis in a mouse model of type 2 diabetes. Science. 2006 Aug 25;313(5790):1137–1140.
- Kars M, Yang L, Gregor MF, et al. Tauroursodeoxycholic acid may improve liver and muscle but not adipose tissue insulin sensitivity in obese men and women. Diabetes. 2010 Aug;59(8):1899–1905.
- Ohsumi Y. Molecular dissection of autophagy: two ubiquitin-like systems. Nat Rev Mol Cell Biol. 2001 Mar;2(3):211–216.
- Koyano F, Okatsu K, Kosako H, et al. Ubiquitin is phosphorylated by PINK1 to activate parkin. Nature. 2014 Jun 05;510(7503):162–166.
- Iwata J, Ezaki J, Komatsu M, et al. Excess peroxisomes are degraded by autophagic machinery in mammals. J Biol Chem. 2006 Feb 17;281(7):4035–4041.
- Tripathi DN, Walker CL. The peroxisome as a cell signaling organelle. Curr Opin Cell Biol. 2016 Apr;39:109–112.
- Singh R, Kaushik S, Wang Y, et al. Autophagy regulates lipid metabolism. Nature. 2009 Apr 30;458(7242):1131–1135.
- Bernales S, Schuck S, Walter P. ER-phagy: selective autophagy of the endoplasmic reticulum. Autophagy. 2007 May-Jun;3(3):285–287.
- Schneider JL, Cuervo AM. Liver autophagy: much more than just taking out the trash. Nat Rev Gastroenterol Hepatol. 2014 Mar;11(3):187–200.
- Ueno T, Komatsu M. Autophagy in the liver: functions in health and disease. Nat Rev Gastroenterol Hepatol. 2017 Mar;14(3):170–184.
- Settembre C, Di Malta C, Polito VA, et al. TFEB links autophagy to lysosomal biogenesis. Science. 2011 Jun 17;332(6036):1429–1433.
- Kaushik S, Rodriguez-Navarro JA, Arias E, et al. Autophagy in hypothalamic AgRP neurons regulates food intake and energy balance. Cell Metab. 2011 Aug 3;14(2):173–183.
- Yang L, Li P, Fu S, et al. Defective hepatic autophagy in obesity promotes ER stress and causes insulin resistance [research support, N.I.H., extramural research support, non-U.S. gov’t]. Cell Metab. 2010 Jun 9;11(6):467–478.
- Ebato C, Uchida T, Arakawa M, et al. Autophagy is important in islet homeostasis and compensatory increase of beta cell mass in response to high-fat diet. Cell Metab. 2008 Oct;8(4):325–332.
- Jung HS, Chung KW, Won Kim J, et al. Loss of autophagy diminishes pancreatic beta cell mass and function with resultant hyperglycemia. Cell Metab. 2008 Oct;8(4):318–324.
- Masiero E, Agatea L, Mammucari C, et al. Autophagy is required to maintain muscle mass. Cell Metab. 2009 Dec;10(6):507–515.
- Arai C, Miyake M, Matsumoto Y, et al. Trehalose prevents adipocyte hypertrophy and mitigates insulin resistance in mice with established obesity. J Nutr Sci Vitaminol (Tokyo). 2013;59(5):393–401.
- Allaire M, Rautou PE, Codogno P, et al. Autophagy in liver diseases: time for translation? J Hepatol. 2019 May;70(5):985–998.
- Hayashi-Nishino M, Fujita N, Noda T, et al. A subdomain of the endoplasmic reticulum forms a cradle for autophagosome formation. Nat Cell Biol. 2009 Dec;11(12):1433–1437.
- Tooze SA, Yoshimori T. The origin of the autophagosomal membrane. Nat Cell Biol. 2010 Sep;12(9):831–835.
- B’Chir W, Maurin AC, Carraro V, et al. The eIF2alpha/ATF4 pathway is essential for stress-induced autophagy gene expression. Nucleic Acids Res. 2013 Sep;41(16):7683–7699.
- Gade P, Ramachandran G, Maachani UB, et al. An IFN-gamma-stimulated ATF6-C/EBP-beta-signaling pathway critical for the expression of death associated protein kinase 1 and induction of autophagy. Proc Natl Acad Sci U S A. 2012 Jun 26;109(26):10316–10321.
- Margariti A, Li H, Chen T, et al. XBP1 mRNA splicing triggers an autophagic response in endothelial cells through BECLIN-1 transcriptional activation. J Biol Chem. 2013 Jan 11;288(2):859–872.
- Vidal RL, Figueroa A, Court FA, et al. Targeting the UPR transcription factor XBP1 protects against huntington’s disease through the regulation of FoxO1 and autophagy. Hum Mol Genet. 2012 May 15;21(10):2245–2262.
- Zhao Y, Li X, Cai MY, et al. XBP-1u suppresses autophagy by promoting the degradation of FoxO1 in cancer cells. Cell Res. 2013 Apr;23(4):491–507.
- Zhou Y, Zhang S, Dai C, et al. Quinocetone triggered ER stress-induced autophagy via ATF6/DAPK1-modulated mAtg9a trafficking. Cell Biol Toxicol. 2016 Apr;32(2):141–152.
- Adolph TE, Tomczak MF, Niederreiter L, et al. Paneth cells as a site of origin for intestinal inflammation. Nature. 2013 Nov 14;503(7475):272–276.
- Hampe J, Franke A, Rosenstiel P, et al. A genome-wide association scan of nonsynonymous SNPs identifies a susceptibility variant for crohn disease in ATG16L1. Nat Genet. 2007 Feb;39(2):207–211.
- Hetz C, Thielen P, Matus S, et al. XBP-1 deficiency in the nervous system protects against amyotrophic lateral sclerosis by increasing autophagy. Genes Dev. 2009 Oct 1;23(19):2294–2306.
- Cubillos-Ruiz JR, Silberman PC, Rutkowski MR, et al. ER stress sensor XBP1 controls anti-tumor immunity by disrupting dendritic cell homeostasis. Cell. 2015 Jun 18;161(7):1527–1538.
- Ma XH, Piao SF, Dey S, et al. Targeting ER stress-induced autophagy overcomes BRAF inhibitor resistance in melanoma. J Clin Invest. 2014 Mar;124(3):1406–1417.
- Hotamisligil GS. Endoplasmic reticulum stress and the inflammatory basis of metabolic disease. Cell. 2010 Mar 19;140(6):900–917.
- Lowell BB. Mitochondrial dysfunction and type 2 diabetes. Science. 2005 Jan 21;307(5708):384–387.
- Engin F, Nguyen T, Yermalovich A, et al. Aberrant islet unfolded protein response in type 2 diabetes [research support, non-U.S. gov’t]. Sci Rep. 2014;4(1):4054.
- Gonzalez-Rodriguez A, Mayoral R, Agra N, et al. Impaired autophagic flux is associated with increased endoplasmic reticulum stress during the development of NAFLD. Cell Death Dis. 2014 Apr;17(5):e1179.
- Kashima J, Shintani-Ishida K, Nakajima M, et al. Immunohistochemical study of the autophagy marker microtubule-associated protein 1 light chain 3 in normal and steatotic human livers. Hepatol Res. 2014 Jul;44(7):779–787.
- Deng Y, Wang ZV, Tao C, et al. The Xbp1s/GalE axis links ER stress to postprandial hepatic metabolism [research support, N.I.H., extramural research support, non-U.S. gov’t]. J Clin Invest. 2013 Jan 2;123(1):455–468.
- Shao M, Shan B, Liu Y, et al. Hepatic IRE1alpha regulates fasting-induced metabolic adaptive programs through the XBP1s-PPARalpha axis signalling. Nat Commun. 2014 Mar 27;5(1):3528.
- Hetz C, Lee AH, Gonzalez-Romero D, et al. Unfolded protein response transcription factor XBP-1 does not influence prion replication or pathogenesis. Proc Natl Acad Sci U S A. 2008 Jan 15;105(2):757–762.
- Wang Y, Vera L, Fischer WH, et al. The CREB coactivator CRTC2 links hepatic ER stress and fasting gluconeogenesis. Nature. 2009 Jul 23;460(7254):534–537.
- Yang L, Calay ES, Fan J, et al. METABOLISM. S-nitrosylation links obesity-associated inflammation to endoplasmic reticulum dysfunction [research support, N.I.H., extramural research support, non-U.S. gov’t]. Science. 2015 Jul 31;349(6247):500–506.
- Inami Y, Yamashina S, Izumi K, et al. Hepatic steatosis inhibits autophagic proteolysis via impairment of autophagosomal acidification and cathepsin expression. Biochem Biophys Res Commun. 2011 Sep 09;412(4):618–625.
- Qian Q, Zhang Z, Orwig A, et al. S-nitrosoglutathione reductase dysfunction contributes to obesity-associated hepatic insulin resistance via regulating autophagy. Diabetes. 2018 Feb;67(2):193–207.
- Schneider JL, Suh Y, Cuervo AM. Deficient chaperone-mediated autophagy in liver leads to metabolic dysregulation. Cell Metab. 2014 Sep 2;20(3):417–432.
- Shaffer AL, Shapiro-Shelef M, Iwakoshi NN, et al. XBP1, downstream of Blimp-1, expands the secretory apparatus and other organelles, and increases protein synthesis in plasma cell differentiation. Immunity. 2004 Jul;21(1):81–93.
- Martina JA, Diab HI, Brady OA, et al. TFEB and TFE3 are novel components of the integrated stress response. Embo J. 2016 Mar 1;35(5):479–495.
- Nekrutenko A, He J. Functionality of unspliced XBP1 is required to explain evolution of overlapping reading frames. Trends Genet. 2006 Dec;22(12):645–648.
- Tirosh B, Iwakoshi NN, Glimcher LH, et al. Rapid turnover of unspliced Xbp-1 as a factor that modulates the unfolded protein response. J Biol Chem. 2006 Mar 3;281(9):5852–5860.
- Yoshida H, Oku M, Suzuki M, et al. pXBP1(U) encoded in XBP1 pre-mRNA negatively regulates unfolded protein response activator pXBP1(S) in mammalian ER stress response. J Cell Biol. 2006 Feb 13;172(4):565–575.
- Zhang H, Yan S, Khambu B, et al. Dynamic MTORC1-TFEB feedback signaling regulates hepatic autophagy, steatosis and liver injury in long-term nutrient oversupply. Autophagy. 2018;14(10):1779–1795.
- Palmieri M, Impey S, Kang H, et al. Characterization of the CLEAR network reveals an integrated control of cellular clearance pathways. Hum Mol Genet. 2011 Oct 1;20(19):3852–3866.
- Cortes CJ, Miranda HC, Frankowski H, et al. Polyglutamine-expanded androgen receptor interferes with TFEB to elicit autophagy defects in SBMA. Nat Neurosci. 2014 Sep;17(9):1180–1189.
- Kimura S, Noda T, Yoshimori T. Dissection of the autophagosome maturation process by a novel reporter protein, tandem fluorescent-tagged LC3. Autophagy. 2007 Sep-Oct;3(5):452–460.
- Settembre C, De Cegli R, Mansueto G, et al. TFEB controls cellular lipid metabolism through a starvation-induced autoregulatory loop. Nat Cell Biol. 2013 Jun;15(6):647–658.
- Ogata M, Hino S, Saito A, et al. Autophagy is activated for cell survival after endoplasmic reticulum stress. Mol Cell Biol. 2006 Dec;26(24):9220–9231.
- Qian Q, Zhang Z, Li M, et al. Hepatic lysosomal iNOS activity impairs autophagy in obesity. Cell Mol Gastroenterol Hepatol. 2019;8(1):95–110.
- Herrema H, Zhou Y, Zhang D, et al. XBP1s is an anti-lipogenic protein. J Biol Chem. 2016 Aug 12;291(33):17394–17404.
- Liu HY, Han J, Cao SY, et al. Hepatic autophagy is suppressed in the presence of insulin resistance and hyperinsulinemia: inhibition of FoxO1-dependent expression of key autophagy genes by insulin. J Biol Chem. 2009 Nov 6;284(45):31484–31492.
- Kang JW, Cho HI, Lee SM. Melatonin inhibits mTOR-dependent autophagy during liver ischemia/reperfusion. Cell Physiol Biochem. 2014;33(1):23–36.
- Koga H, Kaushik S, Cuervo AM. Altered lipid content inhibits autophagic vesicular fusion. Faseb J. 2010 Aug;24(8):3052–3065.
- Lee JM, Wagner M, Xiao R, et al. Nutrient-sensing nuclear receptors coordinate autophagy. Nature. 2014 Dec 04;516(7529):112–115.
- Seok S, Fu T, Choi SE, et al. Transcriptional regulation of autophagy by an FXR-CREB axis. Nature. 2014 Dec 04;516(7529):108–111.
- Imanikia S, Ozbey NP, Krueger C, et al. Neuronal XBP-1 activates intestinal lysosomes to improve proteostasis in C. elegans. Curr Biol. 2019 Jul 22;29(14):2322–2338 e7.
- Imanikia S, Sheng M, Castro C, et al. XBP-1 remodels lipid metabolism to extend longevity. Cell Rep. 2019 Jul 16;28(3):581–589 e4.
- Bolger AM, Lohse M, Usadel B. Trimmomatic: a flexible trimmer for illumina sequence data. Bioinformatics. 2014 Aug 1;30(15):2114–2120.
- Patro R, Duggal G, Love MI, et al. Salmon provides fast and bias-aware quantification of transcript expression. Nat Methods. 2017 Apr;14(4):417–419.
- Soneson C, Love MI, Robinson MD. Differential analyses for RNA-seq: transcript-level estimates improve gene-level inferences. F1000Res. 2015;4:1521.
- Gentleman RC, Carey VJ, Bates DM, et al. Bioconductor: open software development for computational biology and bioinformatics. Genome Biol. 2004;5(10):R80.
- Love MI, Huber W, Anders S. Moderated estimation of fold change and dispersion for RNA-seq data with DESeq2. Genome Biol. 2014;15(12):550.
- Subramanian A, Tamayo P, Mootha VK, et al. Gene set enrichment analysis: a knowledge-based approach for interpreting genome-wide expression profiles. Proc Natl Acad Sci U S A. 2005 Oct 25;102(43):15545–15550.
- Kuleshov MV, Jones MR, Rouillard AD, et al. Enrichr: a comprehensive gene set enrichment analysis web server 2016 update. Nucleic Acids Res. 2016 Jul 8;44(W1):W90–7.
- Szklarczyk D, Gable AL, Lyon D, et al. STRING v11: protein-protein association networks with increased coverage, supporting functional discovery in genome-wide experimental datasets. Nucleic Acids Res. 2019 Jan 8;47(D1):D607–D613.
- Grant CE, Bailey TL, Noble WS. FIMO: scanning for occurrences of a given motif. Bioinformatics. 2011 Apr 1;27(7):1017–1018.
- Fornes O, Castro-Mondragon JA, Khan A, et al. JASPAR 2020: update of the open-access database of transcription factor binding profiles. Nucleic Acids Res. 2020 Jan 8;48(D1):D87–D92.