
ABSTRACT
Immune selection drives tumor cells to acquire refractory phenotypes. We previously demonstrated that cytotoxic T lymphocyte (CTL)-mediated immune pressure enriches NANOG+ tumor cells with stem-like and immune-refractory properties that make them resistant to CTLs. Here, we report that the emergence of refractory phenotypes is highly associated with an aberrant macroautophagic/autophagic state of the NANOG+ tumor cells and that the autophagic phenotype arises through transcriptional induction of MAP1LC3B/LC3B by NANOG. Furthermore, we found that upregulation of LC3B expression contributes to an increase in EGF secretion. The subsequent hyperactivation of EGFR-AKT signaling rendered NANOG+ tumor cells resistant to CTL killing. The NANOG-LC3B-p-EGFR axis was preserved across various types of human cancer and correlated negatively with the overall survival of cervical cancer patients. Inhibition of LC3B in immune-refractory tumor models rendered tumors susceptible to adoptive T-cell transfer, as well as PDCD1/PD-1 blockade, and led to successful, long-term control of the disease. Thus, our findings demonstrate a novel link among immune-resistance, stem-like phenotypes, and LC3B-mediated autophagic secretion in immune-refractory tumor cells, and implicate the LC3B-p-EGFR axis as a central molecular target for controlling NANOG+ immune-refractory cancer.
Abbreviations: ACTB: actin beta; ATG7: autophagy related 7; BafA1: bafilomycin A1; CASP3: caspase 3; CFSE: carboxyfluorescein succinimidyl ester; ChIP: chromatin immunoprecipitation; CI: confidence interval; CIN: cervical intraepithelial neoplasia; CSC: cancer stem cell; CTL: cytotoxic T lymphocyte; EGF: epidermal growth factor; EGFR: epidermal growth factor receptor; FIGO: International Federation of Gynecology and Obstetrics; GFP: green fluorescent protein; GZMB: granzyme B; HG-CIN: high-grade CIN; IHC: immunohistochemistry; LG-CIN: low-grade CIN; LN: lymph node; MAP1LC3B/LC3B: microtubule associated protein 1 light chain 3 beta; MCL1: myeloid cell leukemia sequence 1; MLANA/MART-1: melanoma antigen recognized by T cells 1; MUT: mutant; NANOG: Nanog homeobox; PDCD1/PD-1: programmed cell death 1; PMEL/gp100: premelanosome protein; RTK: receptor tyrosine kinase; TMA: tissue microarray; WT: wild type
Introduction
Cancer immune therapy, in particular, T cell-based therapeutic methods, such as adoptive T cell transfer and immune checkpoint blockades, has made tremendous progress in the field of anti-cancer therapy. Although cancer immunotherapy has emerged as a potentially powerful approach to cancer treatment, the presence of immunotherapeutic resistance limits its clinical application [Citation1]. In this regard, results from recent studies emphasized that cancer immunoediting drove the adaptation of tumor cells to host immune surveillance, thereby contributing to a generation of cancer cells with better survival advantages [Citation2–5]. Therefore, it is necessary to improve our understanding of the molecular mechanisms by which immune editing promotes the immune-refractory phenotypes of tumor cells in order to develop more effective immune-based cancer therapies.
In an effort to elucidate the molecular mechanisms underlying cancer immunoediting, we previously found that cytotoxic T lymphocyte (CTL)-mediated immune selection caused the enrichment of a subset of cells with high expression of NANOG (Nanog homeobox) [Citation5]. These NANOG+ cells exhibited stem-like and anti-apoptotic properties and were resistant to CTL killing by hyperactivation of the AKT signaling pathway, indicating an important role of NANOG signaling in these refractory phenotypes of immune-resistant tumor cells [Citation5–7]. Thus, these results propose a rationale whereby strategies impeding NANOG may overcome not only the problem of immune resistance but also that of the stem-like state of tumor cells. Given that clinically available NANOG pharmacologic inhibitors have not yet been developed, it is necessary to identify additional pathways that can be targeted to enhance the efficacy of immunotherapy.
Autophagy is a fundamental biological process that maintains intracellular homeostasis by degrading proteins and cytosolic contents and is induced by various forms of cellular stress including nutrient deprivation [Citation8,Citation9]. The process requires sequestration of cytoplasmic material by a transient compartment termed the phagophore, which matures into a double-membrane autophagosome [Citation10]. The role of autophagy in cancer is quite complicated and still somewhat controversial; it appears to be tumor suppressive during cancer development, but it is required for tumor maintenance and the progression to advanced disease [Citation11,Citation12]. The tumor-promoting functions of autophagy are largely ascribed to its importance as a survival pathway in response to diverse environmental stresses [Citation13,Citation14]. For example, enhanced autophagy has been observed in cancer stem cells (CSCs), a subset of stem-like tumor cells with an undifferentiated phenotype contributing to initial tumor formation and recurrence, and the maintenance of metabolic homeostasis and cell viability, which promoted the resistance of CSCs to micro-environmental stresses, such as hypoxia, starvation or anti-cancer treatment [Citation15,Citation16]. Moreover, inhibition of autophagy can promote apoptosis and sensitize tumor cells to chemotherapy, radiotherapy, or immunotherapy [Citation17–19]. Despite the crucial roles of autophagy in the maintenance of the stem-like state, as well as the survival of tumor cells against therapeutic multi-modalities, the potential link between immune resistance and autophagy is poorly established.
Here, we demonstrate for the first time to our knowledge that immune selection causes enrichment of a subset of tumor cells with aberrant autophagic phenotypes. The phenotype of these cells was critically dependent on MAP1LC3B/LC3B, which is a direct transcriptional target of NANOG. Unexpectedly, we observed that LC3B upregulation led to an increase of autophagosome abundance within tumor cells, which contributed to EGF (epidermal growth factor) secretion and, consequentially, activation of the EGFR (epidermal growth factor receptor)-AKT signaling pathway. Importantly, the inhibition of LC3B using siRNA could sensitize the refractory tumor to T-cell based immunotherapy, as well as the immune checkpoint blockade, by reversing the immune resistance of tumor cells to CTL killing and re-invigorating the cancer-immunity cycle. Thus, our findings indicate that LC3B inhibition is a promising strategy to control NANOG+ immune-refractory cancer, particularly in the context of immune-based therapy.
Results
Immune-resistant tumor cells exhibit aberrant accumulation of autophagosomes under starvation
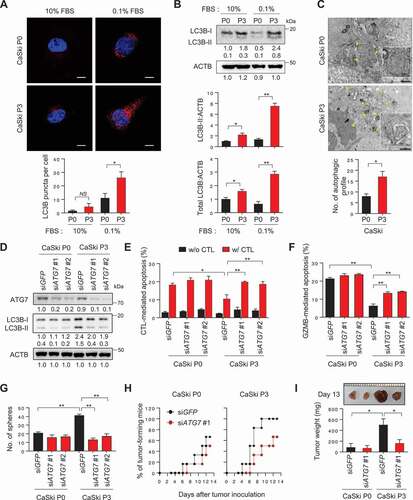
Previously, we established a highly immune-resistant cervical cancer cell line, CaSki P3 (termed P3), which was generated from its immune susceptible parental cell line, HLA-A2+ CaSki P0 (termed P0), through three rounds of in vitro selection by mixing P0 cells pulsed with the HLA-A2-restricted MLANA/MART-1 peptide together with MLANA-specific T cells (clone KKM) [Citation20]. To examine whether immune-selection affects autophagy, we monitored autophagosome formation in CaSki tumor cells, before (P0) or after (P3) immune-selection. There was no considerable difference in autophagosome abundance between the P0 and P3 cells under normal serum conditions (). However, in the serum-starved condition, autophagosome abundance was significantly increased in P3 cells compared to P0 cells (). Because the lipidated form (LC3B-II) of LC3B is correlated with autophagosome abundance, we also estimated the absolute level of LC3B-II (normalized by ACTB/actin beta) under normal serum conditions or serum-starved conditions by western blot analysis. Relative to P0 cells, P3 cells exhibited elevated LC3B-II levels under starvation conditions, especially (). Furthermore, transmission electron microscopy (TEM) analysis revealed that relative to P0 cells, P3 cells exhibited an extensive accumulation of double and multi-membraned structures with a broad range of morphologies, presumably corresponding to stalled autophagosomes or autolysosomes (). Interestingly, there was no significant alteration in autophagic flux in P3 cells compared to P0 cell (Fig. S1). Instead, the increase in the amount of LC3B-II occurred in parallel with the change in the amount of total cellular LC3B in P3 cells relative to P0 cells (). Therefore, our data suggest that immune-selection facilitates enrichment of a subset of tumor cells having an increase in autophagosome abundance rather than autophagy flux.
Figure 1. Inhibition of autophagosome formation reverses CSC-like and immune-resistant phenotypes in immune-refractory tumor cells. (A and B) CaSki P0 and P3 cells were incubated in medium supplemented with 10% or 0.1% FBS for 48 h. (A) The cells were stained with anti-LC3B (Red) antibodies and then visualized by confocal microscopy. DAPI was used to stain nuclei. The images are representative of three separate experiments. Scale bar: 10 µm. The graph depicts the experimental quantitation of puncta. (B) The protein levels of LC3B were determined by western blot analysis (numbers below each blot are densitometric values). The graphs represent quantification for absolute level of LC3B-II (upper) and total LC3B level (lower), respectively. (C) CaSki P0 and P3 cells starved for 48 h in medium supplemented with 0.1% FBS were fixed and imaged by transmission electron microscopy (TEM). Yellow arrows indicate autophagic vacuoles. Scale bar: 1 µm. The graph shows the number of autophagic vacuole profiles per cell area. (D-G) CaSki P0 and P3 cells were transfected with siRNA targeting GFP or ATG7. (D) The protein levels of ATG7 and LC3B were determined by western blot analysis. ACTB was included as an internal loading control. Numbers below the blot images indicate the expression as measured by fold-change. (E and F) Flow cytometry analysis of the frequency of apoptotic (active CASP3+) cells (E) after incubation with or without MLANA-specific CTLs at a 1:1 ratio for 4 h or (F) after intracellular delivery of GZMB for 4 h. (G) The degree of CSC-like phenotypes was assessed by the sphere-forming capacity in low-density suspension culture. The experiments were performed in triplicate. (H and I) At 16 h after siRNA transfection, 105 cells were subcutaneously inoculated into NOD/SCID (n = 6). (H) Tumor formation was monitored for 13 d. (I) At 13 d after injection, the tumor burden was excised and weighed. *p < 0.01, **p < 0.001 and ***p < 0.0001 by two-way ANOVA (E, F, G and I) or by 2-tailed Student’s t-test (A-C). The data represent the mean ± SD
Knockdown of ATG7 reverses immune resistant and CSC-like phenotypes in immune-refractory tumor cells
We previously demonstrated that the P3 tumor cells were refractory to apoptotic death by cognate CTLs, whereas the parental P0 tumor cells remained sensitive to these CTLs [Citation20–22]. Because P3 tumor cells exhibit increased autophagosome abundance, we postulated that autophagy could contribute to immune-resistant phenotype of tumor cells. To directly link autophagy to the phenotype of P3 tumor cells, we silenced the autophagy-related gene ATG7 in P3 cells using siRNAs (). Knockdown of ATG7 nearly abolished starvation-induced autophagy, shown by the markedly decreased conversion of LC3B-I to LC3B-II and the defect in autophagosome formation ( and S2). Notably, autophagy inhibition by ATG7 knockdown increased the sensitivity of P3 cells to apoptosis induced by antigen-specific CTLs ( and S3), suggesting a crucial role of autophagy regulator ATG7 in resistance of the tumor cells to CTLs-mediated apoptosis.
It is conceivable that autophagy inhibition in tumor cells influences the antigen-presentation pathway, which could account for decreased sensitivity to apoptosis by CTLs. Indeed, increased autophagy in tumor cells was reported to affect the loss of MHC class I level on tumor cells [Citation23]. We observed a slight or significant loss of the surface MHC class I level in tumor cells following immune selection (P0 vs. P3) or starvation (10% FBS vs. 0.1% FBS), respectively. However, it seems that the loss of MHC class I in P3 cells is independent of autophagy, as evidenced by failure to cause a change in the level of MHC class I upon knockdown of ATG7 or LC3B (Fig. S4). Importantly, P3 cells were also resistant to in vitro liposomal delivery of GZMB (granzyme B), which is a key component in CTL-mediated apoptosis and the resistant phenotype was reversed by ATG7 depletion (). Thus, our data indicate that autophagy renders immune-refractory tumor cells impervious to apoptotic death by CTLs, regardless of T-cell recognition.
Besides immune-resistance, P3 tumor cells have more tumorigenic and CSC-like properties relative to parental P0 tumor cells [Citation21]. Notably, siATG7-treated P3 cells decreased in vitro sphere-forming capacity and reduced tumor-initiating property when transplanted into NOD-SCID mice (), suggesting that autophagy is important for maintenance of CSC-like properties of P3 tumor cells. In contrast, ATG7 knockdown did not alter susceptibility to CTL and GZMB, sphere-forming capacity and tumor-initiating property of P0 cells (). Taken together, these results suggest that, not necessarily autophagic flux per se, core autophagy regulator ATG7 plays an important role in immune-resistance and the CSC-like phenotype of P3 tumor cells.
NANOG regulates autophagosome abundance in tumor cells
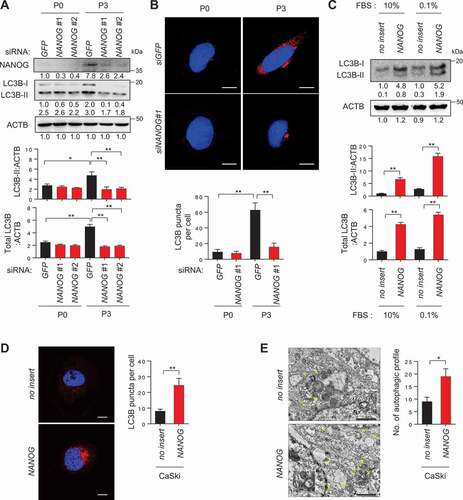
We next attempted to elucidate the underlying mechanism responsible for an increase in autophagosome abundance in immune-resistant tumor cells. We previously discovered that NANOG is a key transcription factor driving the multi-modal resistance and CSC-like phenotype in immune-resistant P3 tumor cells [Citation5,Citation21]. Recently, it has also been reported that NANOG contributes to the activation of autophagy under metabolic stress, such as hypoxia [Citation19]. As NANOG was upregulated upon immune-selection of CaSki cells (), we hypothesized that NANOG might be responsible for increased autophagosome abundance in P3 cells. Indeed, knockdown of NANOG in P3 cells led to significant decrease in LC3B-II levels and autophagosome abundance (), suggesting a crucial role of NANOG in determining the autophagic state of P3 cells. We then asked whether NANOG expression in P0 cells could similarly induce the autophagic properties of P0 cells to resemble those of P3 cells. Notably, delivery of NANOG to P0 cells raised the levels of LC3B-II, which was accompanied by increased levels of total LC3B but not by autophagy flux ( and S5), and increased autophagosome abundance under starvation conditions (). Given these data, we conclude that NANOG is a critical mediator that could contribute to increase of autophagosome abundance in tumor cells facing starvation.
Figure 2. NANOG regulates autophagosome abundance in tumor cells. (A and B) CaSki P0 and P3 cells were transfected with siRNA targeting GFP or NANOG and were incubated in medium supplemented with 0.1% FBS for 48 h. (A) The protein levels of NANOG and LC3B were determined by western blot analysis (numbers below each blot are densitometric values). The graphs represent quantification for absolute level of LC3B-II (upper) and total LC3B level (lower), respectively. (B) The cells were stained with anti-LC3B (red) antibodies and then visualized by confocal microscopy. DAPI was used to stain nuclei. The images are representative of three separate experiments. Scale bar: 10 µm. The graph depicts the experimental quantitation of LC3B puncta. (C) CaSki-no insert and CaSki-NANOG cells were incubated in medium supplemented with 10% or 0.1% FBS for 48 h. The protein levels of LC3B were determined by western blot analysis (numbers below each blot are densitometric values). The graphs represent quantification for absolute level of LC3B-II (upper) and total LC3B level (lower), respectively. (D and E) CaSki-no insert and CaSki-NANOG cells were incubated in medium supplemented with 0.1% FBS for 48 h. (D) The cells were stained with anti-LC3B (red) antibodies and then visualized by confocal microscopy. DAPI was used to stain nuclei. The images are representative of three separate experiments. Scale bar: 10 µm. The graph depicts the experimental quantitation of LC3B puncta. (E) The cells were fixed and imaged by transmission electron microscopy (TEM). Yellow arrows indicate autophagic vacuoles. Scale bar: 2 µm. The graph shows the number of autophagic vacuole profiles per cell area. *p < 0.01 and **p < 0.001, by two-way ANOVA (A and B) or by 2-tailed Student’s t-test (C, D and E). All experiments were performed in triplicate. The data represent the mean ± SD
NANOG directly regulates LC3B through promoter occupancy.
To gain insights into understanding the mechanisms by which NANOG regulates autophagosome abundance in the immune-refractory tumor cells, we performed genome-wide total RNA-sequencing analysis in the P0 and P3 cells and compared the data with the ChIP-ChIP profiles for NANOG [Citation24] in order to screen for putative NANOG target genes. Further, we compared the expression of genes involved in autophagosome formation among the putative NANOG target genes, upregulated in P3 cells relative to P0 cells (). Among the four autophagosome-related genes screened in this analysis, only LC3B expression was reversed by NANOG knockdown (), indicating a NANOG-dependent upregulation.
Figure 3. NANOG directly regulates LC3B through promoter occupancy. (A) Venn diagram showing the overlap of genes with upregulated in CaSki P3 versus P0 (red), NANOG target genes from ChIP-ChIP data (blue) and autophagosome formation-related genes (black). (B) CaSki P0 and P3 cells were transfected with siRNA targeting GFP or NANOG, as indicated. mRNA expressions of LC3B, HSPA5, FEZ1 and FOXO1 were analyzed by qRT-PCR. (C and D) CaSki P0 or HEK 293 cells were transfected with empty vector (no insert), FLAG-NANOG wild type (NANOG WT), or FLAG-NANOGE264G;E268G;E272A (NANOG MUT). (C) LC3B mRNA levels were measured by qRT-PCR. (D) Levels of LC3B and FLAG-NANOG proteins were confirmed by western blot. (E) Diagram of the human LC3B promoter region containing the NANOG binding element. The arrows indicate qChIP-PCR amplicon. (F) The cross-linked chromatin from CaSki or HEK 293 cells transfected with empty vector or FLAG-NANOG was immunoprecipitated with mouse IgG or anti-FLAG antibodies. Relative enrichment of FLAG-NANOG on the LC3B promoter region was assessed by qChIP-PCR analysis with primers that amplify genomic region indicated above. The value of ChIP data represents relative ratio to the input. (G) Relative enrichment of NANOG on the LC3B promoter in CaSki P0 and P3 cells was determined by ChIP using anti-NANOG antibody, followed by qPCR analysis. All experiments were performed in triplicate under starved conditions with 0.1% FBS media. *p < 0.01 and **p < 0.001, by one-way ANOVA (B, C and D) or 2-tailed Student’s t-test (F and G). The data represent the mean ± SD
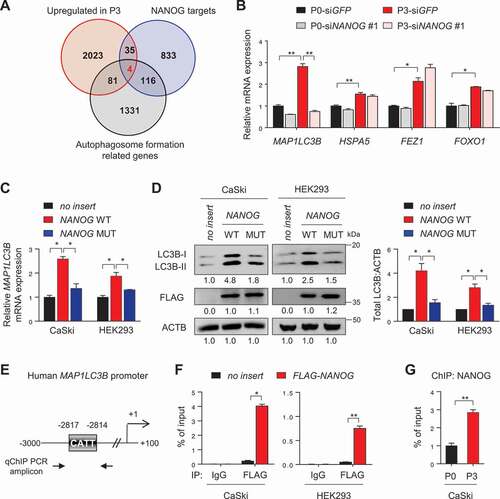
We next investigated whether NANOG regulates LC3B expression through its transcriptional function. To address this, we used a mutant form of NANOG (NANOGE264G,E268G,E272A, NANOG MUT) that was previously found to have weak transcriptional activity [Citation5]. When we transfected CaSki and HEK293 cells with wild-type NANOG (NANOG WT), mRNA and protein of LC3B were profoundly increased, while NANOG MUT had no significant impact on either mRNA or protein levels of LC3B (), indicating that NANOG regulates LC3B expression through its transcriptional function. To further elucidate the underlying mechanism by which NANOG regulated LC3B transcription, we identified the LC3B promoter region containing a putative NANOG-binding site (), suggesting the possibility that NANOG was a direct transcriptional activator of LC3B. Notably, chromatin immunoprecipitation (ChIP) assays confirmed the direct binding of NANOG to the regulatory region of the LC3B gene (), which was also validated in the CaSki P0 and P3 cells, where we noted more NANOG occupancy in P3 cells, relative to the P0 cells (). These findings demonstrate that NANOG upregulates LC3B transcription by directly binding to its promoter region.
LC3B promotes NANOG-dependent aggressive phenotypes through AKT signaling pathway
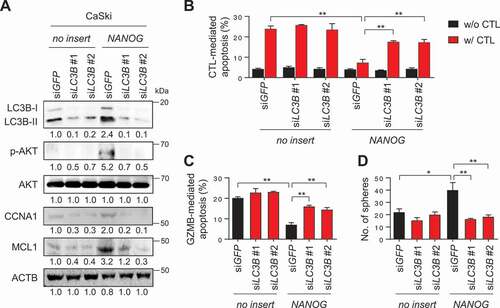
We then asked whether LC3B potentiates NANOG-mediated phenotypes. To directly link LC3B to these phenotypes, we silenced LC3B expression in CaSki-NANOG cells (). Notably, overexpression of NANOG in P0 cells decreased sensitivity of P0 cells to CTLs or GZMB without changing the level of MHC class I (Fig. S6) that could subsequently be reversed by LC3B knockdown ( and S7A-S7C). Likewise, LC3B knockdown reduced CSC-like property of CaSki-NANOG cells (). Previously, we demonstrated that NANOG promotes tumorigenicity and immune-resistance of tumor cells through AKT-dependent upregulation of CCNA1/cyclin A and MCL1 (MCL1 apoptosis regulator, BCL2 family member), respectively [Citation5]. Consistently, levels of p-AKT1, CCNA1, and MCL1 increased by NANOG were robustly dampened upon LC3B knockdown (). These results indicate that LC3B plays a crucial role in the AKT-dependent aggressive phenotypes of NANOG+ tumor cells.
Figure 4. LC3B promotes NANOG-dependent aggressive phenotypes through the AKT signaling pathway. (A-D) CaSki-no insert cells and CaSki-NANOG cells were transfected with siGFP, siLC3B #1 or siLC3B #2 then incubated in medium supplemented with 0.1% FBS for 48 h. (A) The levels of LC3B, p-AKT1, AKT1, CCNA1, and MCL1 protein in these cells were analyzed by western blots. (B-C) Flow cytometry analysis of the frequency of apoptotic (active CASP3+) cells (B) after incubation with or without MLANA-specific CTLs at a 1:1 ratio for 4 h or (C) after intracellular delivery of GZMB for 4 h. (D) The degree of CSC-like phenotypes was assessed by the sphere-forming capacity in low-density suspension culture. All experiments were performed in triplicate. *p < 0.01 and **p < 0.001, by two-way ANOVA (B, C and D). The data represent the mean ± SD
LC3B is involved in EGF secretion resulting in activation of EGFR-AKT signaling
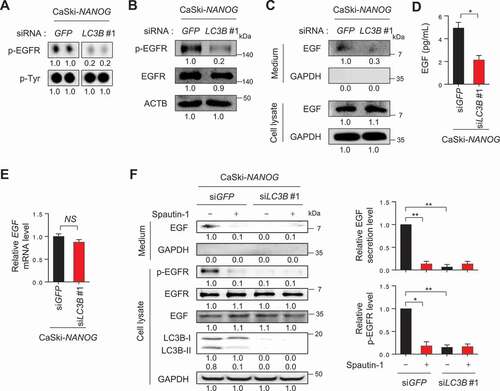
We next aimed to elucidate the role of LC3B in the NANOG-induced activation of AKT signaling. Since multiple receptor tyrosine kinases (RTKs) can mediate AKT signaling in tumor cells, a phosphor RTK antibody array was performed to identify the potential RTK responsible for AKT activation mediated by the NANOG-LC3B axis. From this analysis, we noted that the phosphorylation level of EGFR in the CaSki-NANOG cells was decreased by LC3B knockdown (Fig. S8 and 5A), and this was then confirmed by western blot analysis (). It has been documented that activation of the EGFR signaling pathway is mediated by EGF and its related ligands and that increased stimulation of EGFR through the autocrine growth factor loops plays an important role in human cancers [Citation25]. In this regard, we observed that levels of secreted EGF in the CaSki-NANOG cells were decreased by LC3B knockdown (). Notably, EGF secretion by LC3B was regulated primarily at the post-translational level, rather than the transcriptional or translational levels, evidenced by the failure of LC3B knockdown to cause a change in mRNA or intracellular protein levels of EGF (). It had been shown that the secretion of several proteins is associated with the autophagy-based unconventional secretory pathway and that metabolic stress triggered unconventional protein secretion [Citation26,Citation27]. Consistently, our confocal microscopy analysis revealed that a part of intracellular EGF localized in the LC3B-positive puncta in tumor cells and that their co-localization was increased upon NANOG overexpression (Fig. S9). Likewise, we observed increased co-localization of EGF with LC3B-positive puncta in P3 cells, compared to P0 cells (Fig. S10). We further investigated which stages of the autophagy pathway is involved in EGF secretion using two other autophagy inhibitors, spautin-1 and bafilomycin A1 (BafA1). Spautin-1 is a specific inhibitor of the PtdIns3K catalytic subunit (PIK3C3/VPS34) that is responsible for autophagosome formation, whereas BafA1 is an inhibitor of V-ATPase, which blocks the fusion of autophagosomes to lysosomes [Citation28]. Interestingly, increased EGF secretion in P3 tumor cells after immune-selection was strongly lessened by treatment with spautin-1 but not with BafA1 (Fig. S11A and S11B), indicating that autophagosome formation is important for EGF secretion in P3 cells, but late autophagy components involved in autophagosome-lysosome fusion appear to be dispensable in the process. Notably, similar to LC3B knockdown, spautin-1 treatment reduced EGF secretion and dampened the level of p-EGFR in NANOG-overexpressed tumor cells as well as P3 cells ( and S11C). Taken together, these results suggest that LC3B upregulation by NANOG promotes autophagosome-mediated EGF secretion, thereby activating the EGFR signaling pathway in tumor cells.
Figure 5. LC3B is involved in EGF secretion resulting in activation of EGFR. (A-F) CaSki-NANOG cells were transfected with siGFP or siLC3B #1, then incubated in medium supplemented with 0.1% FBS for 48 h. (A) Representative dot images from the phospho-RTK array for p-EGFR levels in these cells. p-Tyr was included as an internal loading control. (B) The levels of p-EGFR, EGFR, and ACTB were confirmed by western blots. (C) The protein levels of secreted EGF and internal EGF were evaluated by western blot analysis of the conditioned medium and lysate of these cells. (D) The amount of EGF secreted into the media was measured by ELISA. (E) LC3B mRNA expression was analyzed by qRT-PCR. (F) In the cells treated with or without spautin-1, the protein levels of secreted EGF and internal EGF, p-EGFR, EGFR, LC3B and GAPDH were confirmed by western blots. The graphs represent quantification for relative levels of secreted EGF (upper) or p-EGFR (lower), respectively. All experiments were performed in triplicate. *p < 0.01, by 2-tailed Student’s t-test (D and E) and two-way ANOVA (F). NS, not significant. The data represent the mean ± SD
NANOG-LC3B-p-EGFR expression in human cervical neoplasia correlates with tumor progression and disease outcome
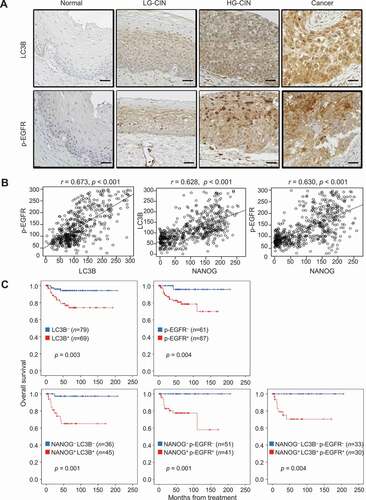
We previously observed that the expression level of NANOG correlates with tumor progression and poor outcome of patients with cervical cancer [Citation5,Citation29]. To determine the clinical relevance of the NANOG-LC3B-p-EGFR axis in human cancer, we first performed immunohistochemistry for LC3B and p-EGFR in cervical tissue specimens from patients with cervical intraepithelial neoplasia (CIN) (Table S1) and further analyzed their relationship with previously reported NANOG [Citation29]. We found that the levels of LC3B and p-EGFR were increased as tumor progressed from normal to low-grade CIN to high-grade CIN to cancer ( and S12). Consistent with our in vitro experimental results, the level of LC3B showed a strong positive correlation with that of p-EGFR (Spearman’s rho = 0.673, p < 0.001), and that of NANOG was also positively correlated with LC3B (Spearman’s rho = 0.628, p < 0.001) and p-EGFR (Spearman’s rho = 0.630, p < 0.001) (). We next examined the relationship of each protein level with patient survival outcomes. Kaplan-Meier plots demonstrated that patients with high levels of LC3B or p-EGFR showed significantly worse overall survival than patients with low levels of LC3B or p-EGFR (). Furthermore, patients with combined NANOG+ LC3B+, NANOG+ p-EGFR+, or LC3B+ p-EGFR+ showed significantly worse overall survival than patients with NANOG− LC3B−, NANOG− p-EGFR−, or LC3B− p-EGFR− (). Similarly, patients with combined NANOG+ LC3B+ p-EGFR+ showed decreased overall survival compared to NANOG− LC3B− p-EGFR− patients (). Remarkably, the Cox proportional hazards model revealed that high LC3B, p-EGFR levels and the combined levels of NANOG, LC3B, and p-EGFR were independent prognostic factors for overall survival (). Taken together, we conclude that the NANOG-LC3B-p-EGFR axis is conserved in patients with cancer and serves as an important prognostic factor in human cervical cancer.
Table 1. Univariate and multivariate analyzes of overall survival in cervical cancer patients
Figure 6. LC3B and p-EGFR significantly correlate with NANOG in human cervical neoplasia specimens. (A) Representative images of IHC staining of LC3B and p-EGFR in cervical tissue from normal, LGCIN, HGCIN, and cervical carcinoma patients. Scale bar: 25 µm. CIN, cervical intraepithelial neoplasia; LG-CIN, low-grade CIN; HG-CIN, high-grade CIN. (B) Correlation between each parameter. LC3B histoscore compared with NANOG and p-EGFR histoscores using a simple scatter plot. (C) Overall survival of cervical cancer patients was analyzed in Kaplan-Meier plots. Patients with high levels of LC3B and p-EGFR expression showed reduced overall survival (log-rank test, p = 0.003 and p = 0.004, respectively) compare with patients with low levels of LC3B and p-EGFR expression. Notably, patients with combined NANOG+ LC3B+, NANOG+ p-EGFR+, NANOG+ LC3B+ p-EGFR+ expression was showed significantly worse overall survival (log-rank test, p = 0.001, p = 0.002, and p = 0.005, respectively) than patients with NANOG− LC3B−, NANOG− p-EGFR−, NANOG− LC3B− p-EGFR− expression. LC3B+, histoscore > 145; p-EGFR+, histoscore > 172. The p-values by Spearman correlation (R) (B) or Log-rank (Mantel-Cox) test (C) were indicated
LC3B promotes immune-resistance and CSC-like properties via the EGF-EGFR-AKT axis
Given the crucial role of the LC3B in NANOG-mediated aggressive phenotypes, we reasoned that LC3B expression alone could promote these properties. Indeed, transfection of CaSki P0 cells with LC3B (LC3B WT) induced the phosphorylation of EGFR and AKT, and increased levels of CCNA1 and MCL1 protein (). Furthermore, overexpression of LC3B WT in P0 cells induced resistance to CTLs or GZMB without any change of the MHC class I level ( and S13A), and conferred a CSC-like phenotype (). Interestingly, we didn’t observe any changes in the levels of the stemness factors including NANOG upon LC3B overexpression (Fig. S13B), suggesting that LC3B is capable of inducing these phenotypes, regardless of stemness factor upregulation in tumor cells.
Figure 7. LC3B promotes immune-resistance and CSC-like properties through the EGF-EGFR-AKT axis. (A-E) CaSki P0 cells were transfected with empty vector (no insert), GFP-LC3B wild-type (WT), or GFP-LC3B ΔG120, then incubated in medium supplemented with 0.1% FBS for 48 h. (A) The levels of GFP-LC3B, p-EGFR, EGFR, p-AKT1, AKT1, CCNA1, and MCL1 were analyzed by western blots. Numbers below the blots are densitometric values. (B-C) Flow cytometry analysis of the frequency of apoptotic (active CASP3+) cells (B) after incubation with or without MLANA-specific CTLs at a 1:1 ratio for 4 h or (C) after intracellular delivery of GZMB or 4 h. (D) The degree of CSC-like phenotypes was assessed by the sphere-forming capacity in low-density suspension culture. (E) The amount of EGF secreted into the media was measured by ELISA. (F) CaSki-no insert and CaSki-LC3B cells were treated with IgG or anti-EGF antibodies, as indicated. The levels of p-EGFR, EGFR, p-AKT1, and AKT1 were analyzed by western blots. Numbers below the blots are densitometric values. (G-I) CaSki-no insert and CaSki-LC3B cells were transfected with siGFP or siEGFR, as indicated. (G) The levels of p-EGFR, EGFR, p-AKT1, and AKT1 were analyzed by western blots. Numbers below the blots are densitometric values. (H) Flow cytometry analysis of the frequency of apoptotic (active CASP3+) cells in the cells after intracellular delivery of GZMB for 4 h. (I) The degree of CSC-like phenotypes was assessed by the sphere-forming capacity in low-density suspension culture. All experiments were performed in triplicate. *p < 0.01 and **p < 0.001, by two-way ANOVA (B, H and I) or one-way ANOVA (C, D, and E). The data represent the mean ± SD
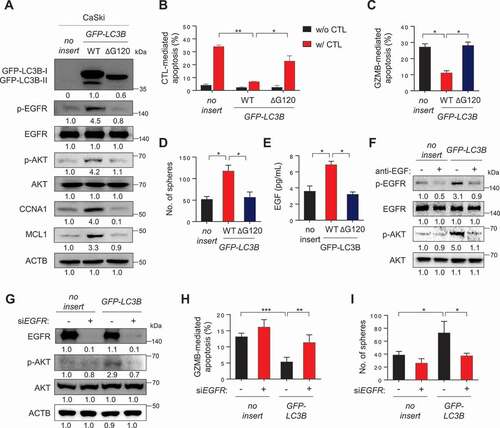
However, addition of LC3B lacking the C-terminal glycine (LC3BΔG120), a mutant that cannot be lipidated [Citation30], failed to markedly induce the activation of EGFR-AKT signaling as well as immune-resistance and CSC-like phenotype (), indicating an important role of LC3B lipidation on those properties. Notably, knockdown of ATG7, an autophagy-related E1-like enzyme essential for LC3B lipidation, robustly reduced the level of p-EGFR and p-AKT, increased GZMB-mediated apoptosis, and, consistently, decreased sphere-forming capacity of CaSki-LC3B cells (Fig. S14A-S14C). These data further support a crucial role of LC3B lipidation, dependent upon core ATG genes such as ATG7, in immune resistance and CSC-like property of tumor cells.
Notably, LC3B WT-transfected cells had markedly higher levels of EGF secretion, compared with empty vector- or LC3BΔG120-transfected cells (). The neutralization of secreted EGF by its specific monoclonal antibody led to a significant decrease in the phosphorylation levels of EGFR and AKT in CaSki-LC3B cells, suggesting a direct role for EGF in the LC3B-induced EGFR signaling pathway (). Furthermore, knockdown of EGFR reversed the resistance of LC3B-transfected tumor cells to GZMB and diminished the sphere-forming capacity of these tumor cells with a concomitant reversal of AKT activation (). Taken together, our findings indicate that LC3B by itself was sufficient to confer immune-resistance and CSC-like phenotypes of tumor cells via EGF-EGFR-AKT signaling axis, dependent on its lipidation by core ATG genes.
LC3B inhibition sensitizes NANOG+ immune-refractory tumor to adoptive transfer of T cell clone
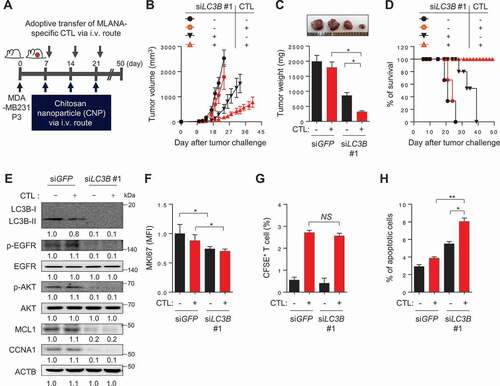
Given our observations in vitro, we reasoned that inhibition of LC3B could serve as an interventional strategy for reversing the resistance of tumor cells to T cell-based immunotherapy. To evaluate this idea, we used human MLANA-specific T cells (clone KKM), specific for the HLA-A2-restricted epitope (M27) of the tumor-associated antigen, MLANA. Because CaSki cells rarely express MLANA antigen, we chose another immune-resistant human cancer cell line, MDA-MB231 P3, which was previously established by three rounds of in vivo selection with MLANA-specific CTLs from its parental HLA-A2+ MDA-MB231 cells, which highly expressed the MLANA antigen [Citation21]. To demonstrate the therapeutic value of inhibiting LC3B, we inoculated MLANA+ MDA-MB231 P3 cells into NOD-SCID mice and intravenously administered chitosan nanoparticles (CNPs) carrying LC3B- or GFP (green fluorescent protein)-targeting siRNA 10 d later (). Eleven days after the tumor challenge, the mice received an adoptive transfer of MLANA-specific CTLs (). While immunotherapy alone had no effect on tumor growth, the delivery of siLC3B elicited a moderate therapeutic effect (). Importantly, combined therapy with siLC3B and adoptive transfer profoundly retarded tumor growth () and prolonged survival of the mice (). In agreement with our in vitro results, we observed reduced levels of p-EGFR, p-AKT, MCL1, and CCNA1 in tumor tissue from siLC3B-treated mice compared with those from siGFP-treated mice (). Additionally, the siLC3B-treated tumors contained fewer proliferating cells than the siGFP-treated tumors, measured by MKI67 staining, and this was unaffected by adoptive transfer (). We assessed the antigen-specific CTL infiltration into the tumor by labeling the T cells with carboxyfluorescein succinimidyl ester (CFSE) prior to adoptive transfer, then counting the number of CFSE+ cells inside the tumor following the transfer. The frequency of tumor-infiltrating T cells in the tumors from siLC3B-treated mice was not significantly different from that in siGFP-treated mice ( and S15). However, the CTL-mediated cytotoxic effects, which indicated the percentage of apoptotic tumor cells, were greater after delivery of the siLC3B relative to after the delivery of siGFP (), suggesting that enhanced cytotoxic effect of CTLs is not as a result of difference in CTL infiltration, but rather due to increased susceptibility of tumor cells to CTLs. Taken together, we conclude that inhibition of LC3B is able to reverse the resistant phenotype of the immune-refractory tumor cells and represents an attractive, widely applicable strategy for the control of human cancer, either as a sole modality or synergistically as part of a T cell-based immunotherapy.
Figure 8. In vivo targeting of autophagy in immune-refractory tumor cells potentiates the antitumor effects of CTL in a preclinical cancer model. (A) Schematic of the therapy regimen in mice implanted with MDA-MB231 P3 cells. (B) Tumor growth, (C) mass (at 21 d after challenge), and (D) survival of mice inoculated with MDA-MB231 P3 treated with the indicated reagents. (E) Western blot analysis of LC3B, p-EGFR, EGFR, p-AKT1, AKT1, MCL1, and CCNA1 protein in mice administered siGFP or siLC3B #1, with or without adoptive transfer of MLANA-specific CTLs. (F) The proliferation index of cells inside the tumor, as measured by the mean fluorescence intensity of MKI67 staining. (G) Flow-cytometric analysis of the frequency of CFSE-labeled MLANA-specific CTL in the tumors of mice with or without adoptive transfer of CFSE-labeled MLANA-specific CTL. (H) The frequency of apoptotic cells in the tumors of siGFP- or siLC3B #1-treated mice, with or without adoptive transfer of MLANA-specific CTL. For the in vivo experiments, five mice from each group were used. *p < 0.01 and **p < 0.001, by two-way ANOVA (B), one-way ANOVA (C, F, and H), or log-rank test (D) or 2-tailed Student’s t-test (G). The data represent the mean ± SD
Lc3b inhibition renders NANOG+ immune-refractory tumor susceptible to anti-PDCD1-mediated anti-tumor immunity
We next assessed whether the NANOG-LC3B axis would also be responsible for the refractoriness to immune checkpoint blockade (ICB) therapy. To do this, we selected B16-F10 murine tumor cell line with high levels of NANOG and LC3B (). Indeed, the murine tumor cells were previously reported to be relatively refractory to ICB therapy [Citation31]. Consistently, knockdown of Nanog robustly dampened the levels of LC3B as well as p-EGFR and p-AKT (Fig. S16A). Notably, knockdown of Lc3b resulted in identical effects on the level of these molecules compared with treatment with siNanog, although it did not affect NANOG protein level (Fig. S16A). Furthermore, siNanog- or siLc3b-treated B16F10 cells were more susceptible to GZMB-mediated apoptosis, and they also had diminished sphere-forming capacity, compared with siGFP-treated tumor cells (Fig. S16B and S16C). These results demonstrate that the biochemical and functional properties of immune-refractory NANOG-LC3B axis are conserved in B16F10 cells, and that LC3B is a key molecule downstream of NANOG signaling and capable of phenocopying NANOG.
Figure 9. LC3B inhibition renders the tumor susceptible to anti-PDCD1-mediated anti-tumor immunity. (A) Western blot analysis of LC3B and NANOG expression in various mouse cancer cell lines. (B) Schematic of the therapy regimen in mice implanted with B16F10 cells. (C) Tumor growth, (D) mass at 20 d after challenge, and (E) the survival of the mice inoculated with B16F10 treated with the indicated reagents. (F) The frequency of apoptotic cells in the tumors of siGFP- or siLc3b #1-treated mice, with or without anti-PDCD1 treatment. (G) Flow cytometry profiles of tumor-infiltrating CD3+ and CD8A+ T cells. (H) The ratio of GZMB+ to tumor-infiltrating CD3+ CD8A+ T cells. (I) Quantification of antigen-specific CTLs in tumors (left), draining lymph nodes (middle), or spleens (right) derived from the tumor-bearing mice. For the in vivo experiments, 10 mice from each group were used. *p < 0.01 and **p < 0.001, by two-way ANOVA (C, D and F-I), or log-rank test (Mantel-Cox) (E). The data represent the mean ± SD
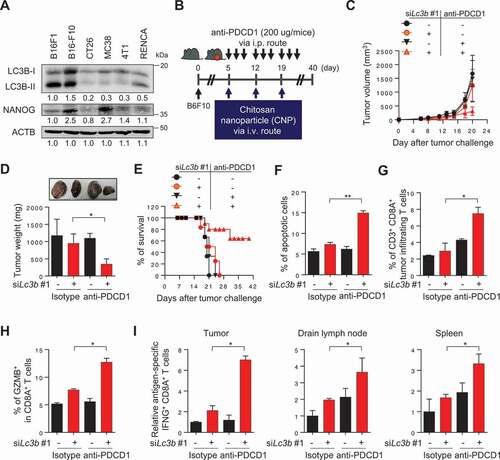
To investigate whether inhibition of LC3B could overcome the resistance to ICB therapy in vivo, we treated B16-F10 tumor-bearing mice with anti-PDCD1 antibody along with siLc3b (). Consistent with our in vitro results, we observed reduced levels of p-EGFR, p-AKT1, MCL1, and CCNA1, without changing the levels of stemness factors including NANOG in tumor tissues from siLc3b-treated mice compared with that from siGFP-treated mice (Fig. S17A-S17C). The combination of siLc3b and anti-PDCD1 antibody conferred a remarkable therapeutic effect and improved survival compared to either treatment alone (), indicating that Lc3b inhibition reversed the refractory phenotype of tumor cells to ICB therapy. Moreover, we found that the percentage of apoptotic tumor cells was increased in the combined treatment compared to either treatment alone (). Accumulating evidence suggests that tumor cell death in anti-tumor therapy can lead to the release of tumor antigens that prime the subsequent auto-loop of anti-tumor immune responses (known as “the cancer-immunity cycle”) [Citation32–34]. Therefore, we postulated that Lc3b inhibition, along with anti-PDCD1 treatments, inflames tumor immune environments by reversing the resistance of immune-refractory tumor cells to T cell-mediated cytotoxicity. Indeed, the number of overall CD8A+ T cells and tumor-reactive CD8A+ T cells with GZMB were significantly higher in the combined treatment group compared to the other treatment groups (, S18A and S18B), indicating that the infiltration of tumor-reactive CD8A+ T cells was enhanced by the combined treatment. To test whether the generation of tumor-reactive T cells was affected by dual treatment, we isolated cells from tumors, draining lymph nodes, and spleens of mice who received therapy and were then stimulated ex vivo with either DMSO (control) or PMEL/gp100 peptide. Notably, the number of PMEL/gp100-specific CD8A+ T cells was drastically increased in the combined treatment group compared to the other treatment groups ( and S18C-S18E). Taken together, our results demonstrate that Lc3b inhibition enhanced the response to ICB therapy by switching immune phenotypes from “immune deserts” to “inflamed”, as well as by reversing the resistance of tumor cells to ICB therapy.
Discussion
Immunological pressures drive the adaptation of tumor cells to host immune surveillance. This adaptation may occur through host-intrinsic events, such as the induction of tumor antigen-specific T-cell tolerance or the establishment of an immunosuppressive-tumor microenvironment by recruiting Tregs or myeloid-derived suppressor cells [Citation35]. Alternatively, it may be controlled by tumor-intrinsic events, such as loss of antigen or MHC class I, or gain of CD274/PD-L1 expression or resistance to apoptosis [Citation36–38]. Accumulating evidence indicate that immune selection also closely linked to the emergence of tumor cells refractory to multiple clinical interventions, including immunotherapy [Citation22,Citation36,Citation39]. Notably, the selection by immune system, together with clonal evolution of malignant cells, contributes to the generation of cancer cells that have better survival advantages and eventually leads to the enrichment of immune-refractory cancer cells with unique features including CSC-like properties [Citation2,Citation5]. Here, we showed that the refractory phenotypes of tumor cells over the course of immune-selection are closely linked to an aberrant autophagy state accompanied by autophagosome accumulation via transcriptional induction of LC3B by a stem cell factor NANOG. Further, to our knowledge, we are the first to report a role of NANOG-LC3B axis in immune-refractory cancer.
An intriguing question that remains to be answered is the precise role of autophagy in the process of tumor adaptation to host immune defense. It had been documented that autophagy may act as a negative regulator of MHC class I molecule, critical to immune recognition [Citation23]. Despite a slight loss of the surface MHC class I level in cancer cells over the course of immune-selection, the level of MHC-I was not reversed by depletion of autophagy component ATG7 or LC3B, suggesting other mechanisms that may contribute to the loss of MHC-I during immune-selection. Indeed, regulation of MHC expression occurs through a combination of cytokines, transcription factors, and epigenetic modifications [Citation40–42]. Importantly, besides resistance to CTLs, P3 tumor cells were also resistant to GZMB, a key component in CTL-mediated apoptosis. Consistent with our results from CTL assay, these resistant phenotypes were reversed by depletion of autophagy component ATG7 or LC3B. The results indicate the crucial roles of autophagy process in anti-apoptotic properties tumor cells, regardless of T cell recognition.
The upregulation of LC3B has been reported in multiple human carcinomas [Citation43–45]. However, its regulatory mechanism, particularly in the course of cancer evolution, has not yet been extensively studied. In this regard, we noted that immune pressure imposed by immunotherapeutic agents, such as vaccination and Ag-specific CTLs, drives the acquisition of NANOG, a master transcription factor that mediates the emergence of a stem-like cancer cell state and immune evasion [Citation3–5]. In this study, we demonstrated that LC3B is a novel NANOG transcriptional target, suggesting that NANOG facilitates autophagosome accumulation by directly upregulating LC3B expression. Importantly, our results also demonstrate that LC3B is a key component of several NANOG-dependent phenotypes. Notably, after the depletion of LC3B, the CSC-like and immune-resistant phenotype of NANOG-transduced P0 cells was almost entirely lost. These results provide insights into the direct link between the NANOG-induced aggressive phenotypes and LC3B-mediated autophagic states in tumor cells.
Given the crucial role of the NANOG-LC3B axis in the development of immune-resistant phenotypes, we believe that inhibition of LC3B may be an effective strategy to control immune-refractory tumor cells. We provided proof of this concept by knocking down LC3B in a xenograft mouse model with two kinds of immune-refractory tumor cells. Expectedly, knockdown of LC3B in MDA-MB231 P3 tumor cells following immune-selection restored sensitivity to CTL killing and effectively controlled tumor growth in mice transferred with tumor-specific CTLs. Furthermore, LC3B inhibition enhanced the anti-tumor effects of anti-PDCD1 therapy in B16F10 tumors, which had no significant response to anti-PDCD1 therapy. Intriguingly, the combination of LC3B inhibition and anti-PDCD1 therapy further increased the trafficking of effector CD8A+ T cells to the tumors, indicating a shift of tumor immune environments to “inflamed-tumor.” In this regard, it has been well-documented that tumor cell death by T cells could lead to the release of tumor antigens that prime subsequent immune responses, known as the cancer-immunity cycle [Citation32–34]. Accumulating evidence suggests that initiating or re-invigorating the cancer-immunity cycle triggers the switch of immune phenotypes from “immune-excluded” or “immune deserts” to “inflamed tumor” [Citation46–48]. Thus, our results indicate that LC3B inhibition induces “inflamed” immune phenotypes by reversing the resistance to T-cell-mediated cytotoxicity in tumor microenvironments, indicating the re-invigoration of the cancer-immunity cycle.
Studies have reported that LC3B was associated with disease progression, chemo-resistance, and metastatic potential in multiple human cancers [Citation43,Citation49]. With regard to the autophagy phenomenon, this raises the obvious questions: (a) How does LC3B contribute to immune-resistance and the CSC-like phenotype and (b) is LC3B alone capable of promoting these features? Our study focused on a growing appreciation for a novel role of autophagy in cellular secretion [Citation50]. In particular, we found that NANOG-LC3B axis contributed to the secretion of EGF, thereby activating EGFR signaling. Furthermore, LC3B expression by itself was sufficient to confer these aggressive phenotypes in a lipidation-dependent manner. Notably, after knockdown of EGFR, the CSC-like and immune-resistant phenotype of LC3B-transduced P0 cells was almost entirely lost, indicating that the EGFR pathway was one of primary routes through which LC3B acted to promote these phenotypes. Although it will be important in future studies to assess the precise underlying mechanisms by which LC3B regulates EGF secretion, this connection immediately hints at several potentially promising therapeutic targets to control immune-refractory cancer in the clinic.
It is important to note that the role of autophagy in the maintenance of CSC-like features within cancer cells remains complex and controversial. Previous studies reported that autophagy can have a tumor suppressor function and is often downregulated in specific CSCs [Citation51,Citation52]. Nevertheless, it is well documented that CSCs are characterized by elevated levels of autophagy compared to non-CSCs [Citation51]. Accumulating evidence indicates that autophagy helps to maintain the stemness of CSCs and results in the failure of anticancer therapy [Citation53]. Interestingly, although inhibition of LC3B leads to a significant decrease in CSC-like property of immune-refractory tumor cells, LC3B did not influence the levels of stemness factors including NANOG. In light of this, our data propose that gain of LC3B might be a result of the immune selection of NANOG+ immune-refractory tumor cells but not a cause at least during immune selection. We don’t exclude the possibility, however, that the gain of LC3B may confer survival advantage to NANOG+ tumor cells by enabling a better autophagic response to limited nutrient supply.
Notably, we found that the level of LC3B protein, in addition to NANOG [Citation3], was elevated in multiple types of human cancer cells. This underscores the value of LC3B as a prognostic factor in cervical neoplasia, and it strongly suggests that the functions of LC3B in tumor cells that were observed in vitro hold true for cancer patients, as well. Importantly, LC3B levels in cervical cancer tissues were positively correlated with levels of NANOG and EGFR phosphorylation, thus validating the proposed biochemical pathway. The molecular axis of NANOG-LC3B-p-EGFR may also be critically related to the progression of cervical neoplasia, as we have supporting data showing that the degree of the molecular axis was correlated with cervical cancer phenotypes and worse prognosis in patients.
Taken together, in this report, we propose that NANOG+ cancer cells enriched by immune selection preferentially expressed LC3B via transcriptional regulation. In the selection process, LC3B promoted immune resistant and CSC-like phenotypes through hyperactivation of the EGFR-AKT functional axis. Therefore, our data provide evidence that the inhibition of LC3B may be a promising strategy that will help combat NANOG+ immune-refractory tumors, particularly in regard to immune-based cancer therapy.
Materials and Methods
Mice
Six- to eight-week-old female NOD-SCID or C57BL/6 mice were purchased from Central Lab. Animal Inc. (Seoul, Korea). All mice were maintained and handled under the protocol approved by the Korea University Institutional Animal Care and Use Committee (KOREA-2017-0141). All animal procedures were performed in accordance with recommendations for the proper use and care of laboratory animals.
Cell lines
CaSki, MDA-MB231, HEK293, and B16F10 cell lines were purchased from American Type Culture Collection (CRL-1550, HTB-26, CRL-1573 and CRL-6475). All cell lines were obtained between 2010 and 2014, and tested for mycoplasma using the Mycoplasma Detection Kit (Thermo Fisher Scientific, 4460626). The identities of the cell lines were confirmed by short tandem repeat (STR) profiling by IDEXX Laboratories Inc. and were used within six months for testing. The generation and maintenance of the immune-resistant CaSki P3 [Citation20] and MDA-MB P3 [Citation21] cell lines have been previously described. The CaSki-NANOG cell line has been previously described [Citation21]. All cells were grown at 37°C in a 5% CO2 incubator/humidified chamber.
Chemical reagents
The following chemical reagents were used in this study: spautin-1 (Selleckchem, S78880) and bafilomycin A1 (Sigma-Aldrich, B1793-2UG).
siRNA constructs
Synthetic small interfering RNAs (siRNAs) specific for GFP, ATG7, NANOG, LC3B, EGFR, Nanog and Lc3b were purchased from Bioneer (Korea): nonspecific GFP (green fluorescent protein), 5ʹ-GCAUCAAGGUGAACUUCAA-3ʹ (sense), 5ʹ-UUGAAGUUCACCUUGAUGC-3ʹ (antisense); ATG7 #1, 5ʹ-CAGCUAUUGGAACACUGUA-3ʹ (sense), 5ʹ-UACAGUGUUCCAAUAGCUG-3ʹ (antisense); ATG7 #2, 5ʹ-CAGCUAUUGGAACACUGUA-3ʹ (sense), 5ʹ-UACAGUGUUCCAAUAGCUG-3ʹ (antisense); NANOG #1, 5ʹ-GCAACCAGACCUGGAACAA-3ʹ (sense), 5ʹ-UUGUUCCAGGUCUGGUUGC-3ʹ (antisense); NANOG #2 5ʹ-CUAAACUACUCCAUGAACA-3ʹ (sense), 5ʹ-UGUUCAUGGAGUAGUUUAG-3ʹ (antisense); EGFR, 5ʹ-GAUCCACAGGAACUGGAUA-3ʹ (sense), 5ʹ- UAUCCAGUUCCUGUGGAUC-3ʹ (antisense); LC3B #1, 5ʹ-CAUAAAGACACCACUCAAA-3ʹ (sense), 5ʹ-UUUGAGUGGUGUCUUUAUG-3ʹ (antisense); LC3B #2, 5ʹ-CAUAAAGACACCACUCAAA-3ʹ (sense), 5ʹ-UUUGAGUGGUGUCUUUAUG-3ʹ (antisense); and Lc3b #1, 5ʹ-UCAGGUACAAGGAACUUUGUU-3ʹ (sense), 5ʹ-CAAAGUUCCUUGUACCUGAUU-3ʹ (antisense); Lc3b #2 5ʹ-GUGGUUGUCAAGUGGUAGA-3ʹ (sense), 5ʹUCUACCACUUGACAACCAC-3ʹ (antisense; Nanog 5ʹ-CAGAUAGGCUGAUUUGGUU-3ʹ (sense), 5ʹ-AACCAAAUCAGCCUAUCUG-3ʹ (antisense). For in vitro delivery, the cells were transfected with 100 pmol of synthesized siRNAs using Lipofectamine 2000 (Invitrogen, 11,668,027) according to the manufacturer’s instructions. For the systemic in vivo delivery of siRNA into tumor cells, we prepared the characterized CNP as described previously [Citation54].
DNA constructs
The pMSCV-FLAG-NANOG WT and pMSCV-FLAG-NANOGE264G;E268G;E272A plasmids have been described previously [Citation5]. The pEX-GFP-hLC3WT and the pEX-GFP-hLC3ΔG120 plasmid was a gift from Isei Tanida (Addgene, 24987, 24988) [Citation30].
Immunofluorescence
Cells grown on 4-well cell culture slides (SPL life science, 30404) were fixed with 4% paraformaldehyde (Wako, 30525–89-4) in phosphate-buffered saline (PBS; Biosesang, P2007-1) for 20 min, and then blocked with 5% normal goat serum (NGS, Thermo Fisher Scientific, 50062Z) in PBS for 1 h. The cells were incubated with primary antibodies and appropriate secondary antibodies conjugated to Alexa Fluor 488 or 555 (Invitrogen, A11001, A21429). Confocal fluorescence images were obtained using a Zeiss LSM700 confocal microscope (Carl Zeiss). Image analysis was performed using ImageJ. For calculation of the Pearson correlation coefficient, single cells were marked and analyzed with the JACoP plugin for ImageJ (NIH).
Electron microscopy analysis
Cells were incubated in medium supplemented with 0.1% FBS for 48 h. The cells were washed with 0.1 M PBS (pH 7.0) and fixed with a buffer containing 2% paraformaldehyde and 2.5% glutaraldehyde (Electron microscopy sciences, 16310) in PBS at room temperature for 30 min. After washing with PBS, cells were post-fixed with 1% osmium tetroxide (Heraeus, 89.740.219) for 90 min, dehydrated and then embedded with Epoxy resin mixture (epon-812; Electron microscopy sciences, 14120). Thin sections of 70 nm were collected on 200-mesh nickel grid (Electron microscopy sciences, EMS200-Ni) and stained with uranyl acetate (Electron microscopy sciences, 22400) followed by lead citrate. Electron microscopy observation for general morphology was performed using a Hitachi H-7650 electron microscopy (Hitachi High-Technology Co.) with 80 kV acceleration voltage.
Real-time quantitative RT-PCR
Total RNA was isolated using the RNeasy Micro kit (Qiagen, 74004), and the cDNAs were synthesized by reverse transcriptase (RT) using the iScript cDNA synthesis kit (Bio-Rad, 1708891), according to the manufacturer’s recommended protocol. Real-time quantitative PCR was performed using iQ SYBR Green Supermix (Bio-Rad, 1708882AP) with the following specific primers: LC3B, 5ʹ-TGTCCGACTTATTCGAGAGCAG-3ʹ (forward) and 5ʹ-TCACTCATGTTGACATGGTCAGG-3ʹ (reverse); FEZ1, 5ʹ-GCTTTCGGAACTACAACGCC-3ʹ (forward) and 5ʹ-CATCCCAAACCTCCTCGTCC-3ʹ (reverse); FOXO1, 5ʹ-GTGGAGATCGACCCGGACTT-3ʹ (forward) and 5ʹ-CCGAGTTGGACTGGCTAAAC-3ʹ (reverse); HSPA5, 5ʹ- AGACGGGCAAAGATGTCAGG-3ʹ (forward) and 5ʹ-GCCCGTTTGGCCTTTTCTAC-3ʹ (reverse); EGF, 5ʹ-GGATGGGATGTCCTCTTGCC-3ʹ (forward) and 5ʹ- ACCCAGGAGCCAGGGATAA-3ʹ (reverse); and ACTB, 5ʹ-CGACAGGATGCAGAAGGAG −3ʹ (forward) and 5ʹ-TAGAAGCATTTGCGGTGGAC −3ʹ (reverse) in a CFX96 real-time PCR detection system. All real-time quantitative PCR experiments were performed in triplicate and quantification cycle (Cq) values were determined using Bio-Rad CFX96 Manager 3.0 software. Relative quantification of the mRNA levels was performed using the comparative Ct method with ACTB as the reference gene.
Western blot analysis
Lysate extracted from a total of 1 × 10⁵ cells was used to perform western blot analysis as described previously [Citation55]. Primary antibodies against LC3B (2775S), ATG7 (8558S), p-AKT1 (9271), AKT1 (9272), MYC/c-MYC (D84C12), p-EGFR (3777S), EGFR (4267S) were purchased from Cell Signaling Technology. Primary antibodies against FLAG (M185-3 L), GFP (2555) and ACTB (M177-3) were purchased from Medical & Biological Laboratories. Primary antibodies against MCL1 (sc-819), KLF4 (sc-20,691), POU5F1/OCT4 (sc-9081) were purchased from Santa Cruz Biotechnology. Primary antibodies against NANOG (Bethyl Laboratories, A300-397A) and EGF (Abcam, ab206106) were also used in western blot analysis, followed by the appropriate secondary antibodies conjugated with horseradish peroxidase. The immunoreactive bands were developed using the chemiluminescence ECL detection system (Elpis Biotech, EBP1073), and the signals were detected using a luminescent image analyzer (LAS-4000 Mini, Fujifilm). ACTB was included as an internal loading control. The intensity of the western blot signals was quantified using Multi-gauge software (Fujifilm).
Quantitative ChIP (qChIP) assays
The ChIP kit (Millipore, 17–295) was used according to the manufacturer’s instructions and the ChIP assay was performed as described previously [Citation56]. Immunoprecipitation was carried out by incubation with 1 µg of anti-NANOG (Bethyl Laboratories, A300-397A), anti-FLAG (Medical & Biological Laboratories, M185-3 L) antibodies or rabbit IgG (Millipore, PP64) for 16 h, and then the immunoprecipitated DNA was quantified by real-time qPCR using the following primer sets: 5ʹ-CAGAGTAACCCTGGCCCATT-3ʹ (forward) and 5ʹ-ATTTTCCCACCCTTGGGCAT-3ʹ (reverse). Each sample was assayed in triplicate, and the amount of precipitated DNA was calculated as the percentage of the input sample.
Antibody arrays of phospho-RTK
Phospho-RTK arrays were performed according to the manufacturer’s recommendations (Human phospho-RTK Array Kit, R&D Systems, ARY001B). Briefly, phospho-RTK array membranes were blocked with 5% BSA (Biosesang, 9048–46-8) in TBS (0.01 M Tris-HCl, pH 7.6) for 1 h. Then, the membranes were incubated with 200 μg of total protein for 16 h at 4°C. After extensive washing with TBS, the membranes were incubated with anti-phospho-tyrosine HRP antibody for 2 h at room temperature. The unbound HRP antibody was washed out with TBS containing 0.1% Tween-20 (Biosesang, TR1027-500-00). Finally, each array membrane was developed using the chemiluminescence ECL detection system (Elpis Biotech, EBP1073), and signals were detected using a luminescent image analyzer (Fujifilm, LAS-4000 Mini).
EGF assessment of medium supernatants
The cells were grown in 6-well plates and incubated with medium containing 0.1% FBS for 48 h at 37°C. The supernatants were collected and centrifuged to remove cell debris. The EGF levels in the supernatants were measured by the Quantikine Human EGF ELISA kit (R&D Systems, DEG00). For western blot analysis, the supernatants were further concentrated 30X by Centricon Plus-70 centrifugal Filter Units-3 kDa (Millipore, UFC800324).
CTL-mediated apoptosis assay
For CTL-mediated apoptosis assay, MLANA-specific KKM CTL clone [Citation57], specific for the HLA-A2-restricted epitope (M27) of the tumor-associated MLANA antigen was used. HLA-A2+ CaSki cells were labeled with 10 μM of CFSE (Sigma-Aldrich, 21888) in DMEM supplemented with 0.1% FBS. The CFSE-labeled cells were pulsed with HLA-A2–restricted MLANA M27 peptide (AAGIGILTV, 1 μg/ml) or NY-ESO-1 peptide (SLLMWITQC, 1 μg/ml) for 1 h, then mixed with cognate MLANA-specific CD8A+ CTLs at a 1:1 ratio and incubated for 4 h at 37°C. The cells were stained for active CASP3 (caspase 3, BD biosciences, 51–68655X) as an index of apoptosis and examined by flow cytometry as described previously [Citation5].
GZMB-mediated apoptosis assay
Human GZMB (Enzo Life Sciences, BML-SE238-5000) was introduced into cells with the BioPORTER QuikEase Protein Delivery Kit (Sigma-Aldrich, BPQ96). 1 × 10⁵ cells per well were plated in 12-well plates and cultured overnight at 37°C. Cells were washed, and 100 ng of GZMB in Opti-MEM (Thermo Fisher Scientific, 31985070) was added to each well. After incubation for 4 h at 37°C, the frequency of apoptotic cells was determined by staining with anti-active CASP3 antibody (BD biosciences, 51–68655X) and performing flow cytometry.
MHC class I expression measurement
To confirm expression of the class I molecule of the major histocompatibility complex (MHC), CaSki cells were stained with PE Mouse anti-human leukocyte antigen-A2 (HLA-A2), (BD biosciences, 558,570) or isotype control (BD biosciences, 555,743) in cold PBS with 0.1% BSA for 30 min at 4°C. A BD FACSVerse™ was used to carry out flow cytometry analysis.
Tumor sphere-forming assay
The cells were seeded at 1 × 10³ cells per well in 24-well ultra-low attachment plate (Corning, 3473) containing serum-free DMEM-F12 (GE Healthcare Life Sciences, SH30023.01) supplemented with 20 ng/ml of EGF (Gibco, PHG0315), 20 ng/ml of basic FGF (Gibco, 13,256–029), and 1X B27 (Gibco, 17,504–044). The medium was replaced every 3 d to replenish nutrients. Colonies more than 50 um in diameter were counted under a microscope.
In vivo tumorigenicity assay
The cells were harvested by trypsin treatment, then washed and resuspended in Opti-MEM. NOD/SCID mice were subcutaneously injected with 105 cells. Tumor formation was monitored every 2 d. After 12 d, tumor tissue was excised and weighed.
Total RNA sequencing
For control and test RNAs, rRNA was removed using the Ribo-Zero Magnetic Kit (Epicenter, MRZ116 C) from each 5 μg of total RNA. A library was constructed using the SENSE Total RNA-Seq Library Prep Kit (Lexogen, 009.24) according to the manufacturer’s instructions. The library production was initiated by the random hybridization of starter/stopper heterodimers to the remaining RNA. These starter/stopper heterodimers contained Illumina-compatible linker sequences. A single-tube reverse transcription and ligation reaction extended the starter to the next hybridized heterodimer, where the newly synthesized cDNA insert was ligated to the stopper. Second-strand synthesis was performed to release the library from the beads, and the library was then amplified. Barcodes were introduced when the library was amplified. High-throughput sequencing was performed as paired-end 100 sequencing using HiSeq 2000 (Illumina Inc.). Total RNA-Seq reads were mapped using TopHat software tool in order to obtain bam file (alignment file). Read counts mapped on transcripts region were extracted from the alignment file using bedtools (v2.25.0) and Bioconductor that uses R (version 3.2.2) statistical programming language [Citation58]. The alignment file also was used for assembling transcripts, estimating their abundances and detecting differential expression of genes. And we used the fragments per kilobase of exon per million (FPKM) fragment as the method of determining the expression level of the gene regions. Global normalization method was used for comparison between samples. The accession number for the sequencing data reported in this article is GEO: GSE128729.
Tissue samples and immunohistochemistry
Tissue samples were prospectively collected via surgery from the Department of Obstetrics and Gynecology of Gangnam Severance Hospital between 1996 and 2010. Some of the paraffin blocks were provided by the Korea Gynecologic Cancer Bank through the Bio & Medical Technology Development Program of the Ministry of Education, Science and Technology, Korea (NRF-2017M3A9B8069610). Tumor specimens from 398 patients with primary cervical cancer or cervical intraepithelial neoplasia (CIN) and 245 matched normal epithelium tissues were constructed into Tissue tissue microarrays (TMAs) as previously described [Citation5]. Written informed consent was obtained from all patients who enrolled in this study. This study was approved by the Institutional Review Board of Gangnam Severance Hospital (Seoul, South Korea) and all procedures were conducted in accordance with the guidelines of the Declaration of Helsinki.
Immunohistochemistry (IHC) was performed on the TMA slides as described elsewhere. Sections (5 µm) were cut from the TMA block and deparaffinized in xylene and rehydrated through a graded alcohol series. Antigen retrieval was performed using a pressure chamber (Pascal; Dako) with pH 6.0 Target Retrieval Solution (Dako, GV80511-2). Endogenous peroxidase activity was blocked by incubation in 3% H2O2 (Milipore, 7722–84-1) for 10 min. The sections were incubated with anti-LC3B antibodies (Abcam, ab48394) diluted 1:1000 for 1 h or anti-p-EGFR antibodies (Cell Signaling Technology, 2236S) diluted 1:100 for 1 h. Subsequently, the antigen-antibody reaction was detected with the EnVision+ Dual Link System-HRP (Dako, K406311-2) and visualized with 3,3-diaminobenzidine (DAB+; Dako, K3468) for 10 min. The TMA sections were lightly counterstained in a Mayer’s hematoxylin bath and examined by light microscopy. Negative control immunoglobulin G (IgG) was used in place of primary antibody to evaluate nonspecific staining and the TMA included appropriate positive control specimens. NANOG levels were previously examined in the same cohort [Citation29].
The stained TMA sections were digitized using the NanoZoomer 2.0 HT (Hamamatsu Photonics K.K.) at X20 objective magnification. Digital analysis of the images was performed using the Visiopharm Integrator System v6.5.0.2303 (VIS; Denmark). The percentage of stained cells was recorded for each intensity of staining (from 0 to 3) for each TMA core and the histoscore (range; 0 to 300) was obtained by multiplying the intensity and the percentage.
Tumor treatment experiments
NOD/SCID mice were inoculated subcutaneously with 2 × 10⁶ MDA-MB231 P3 cells per mouse. Ten days following the tumor challenge, siGFP- or siLC3B #1-loaded CNPs (7 μg/mouse) were administered via intravenous route. The day after siRNA treatment, the mice have received an adoptive transfer of 2 × 10⁶ MLANA-specific CTLs. This treatment regimen was repeated for three cycles. To assess the frequency of tumor-infiltrating MLANA-specific CTLs, MLANA-specific CTLs were labeled with CFSE and adoptively transferred into the mice at the last injection. The mice were monitored for tumor burden and survival for 20 and 40 d after the challenge, respectively. C57BL/6 mice were inoculated subcutaneously with 1 × 10⁵ B16-F10 cells per mouse. Five days following the tumor challenge, siGFP- or siLc3b #1-loaded CNPs (7 μg/mouse) were administered via intravenous route. The day after siRNA treatment, the mice were administered 200 μg of anti-PDCD1/PD-1 (BioXcell, RMP1-14) or an isotype antibody control, which was administrated three times intraperitoneally every 2 d. This treatment regimen was repeated for three cycles. The mice were monitored for tumor burden and survival 20 and 40 d after the challenge, respectively.
Immune cell tumor infiltration
The treated C57BL/6 mice were sacrificed on day 20 following tumor inoculation, and the tumors were harvested. The tumors were dissected into fragments by cutting and dissociating using by a cell strainer. The cell suspensions were stained for intracellular and extracellular protein markers of interest. The stained samples were assessed on a flow cytometer (BD Bioscience, BD FACSVerse™) along with BD FACSuite software. The staining antibodies were as follows: anti-CD3 (Biolegend, 100236), anti-CD8A (BD Biosciences, 553031), anti-GZMB (Biolegend, 372208).
Analysis of generation of antigen-specific T- cells
To investigate the generation of tumor antigen-specific CD8A+ T cells, treated C57BL/6 mice were sacrificed on day 20 following tumor inoculation and the tumors, draining lymph nodes, and spleens were harvested and incubated with either DMSO (Daejung, 67–68-5) or PMEL/gp100 peptide (KVPRNQDWL, Fisher scientific, NC0888171) at 1 μg/ml for 24 h and stained with anti-CD8A (BD Biosciences, 553031). Cell fixation and permeabilization were conducted thereafter with the CytoFix/CytopermTM kit (BD biosciences, 554714), followed by washing with cold PBS and labeling with anti-IFNG (BD Biosciences, 554412). Flow cytometer cytometry, along with BD FACSuite software, was used to quantify the frequency of antigen-specific IFNG+, CD8A+ T cells.
Statistical analysis
All data are representative of at least three separate experiments. Statistical differences were calculated by either Student’s t-test (two-tailed, unpaired), one-way ANOVA, or two-way ANOVA using GraphPad Prism 7 (GraphPad Software, Inc). For tissue samples and immunohistochemistry, statistical tests were performed using IBM SPSS statistics version 21.0 (IBM Corporation). The Kruskal–Wallis or Mann–Whitney U test and x2-test were used to compare the protein expressions between each group. Survival curves were estimated using the Kaplan-Meier method, and statistical significance was calculated by the log-rank test. The Cox proportional hazards model was used for univariate and multivariate analyzes to determine the independent significance of each prognostic covariate. For all tests, a p-value < 0.05 was considered statistically significant.
Supplemental Material
Download MS Word (2.1 MB)Disclosure statement
No potential conflict of interest was reported by the authors.
Supplementary material
Supplemental data for this article can be accessed here.
Correction Statement
This article has been republished with minor changes. These changes do not impact the academic content of the article.
Additional information
Funding
Related Research Data
References
- Sharma P, Hu-Lieskovan S, Wargo JA, et al. Primary, adaptive, and acquired resistance to cancer immunotherapy. Cell. 2017;168:707–723.
- Schreiber RD, Old LJ, Smyth MJ. Cancer immunoediting: integrating immunity’s roles in cancer suppression and promotion. Science. 2011;331:1565–1570.
- Noh KH, Lee YH, Jeon JH, et al. Cancer vaccination drives Nanog-dependent evolution of tumor cells toward an immune-resistant and stem-like phenotype. Cancer Res. 2012;72:1717–1727.
- Mao CP, Wu T, Song KH, et al. Immune-mediated tumor evolution: nanog links the emergence of a stem like cancer cell state and immune evasion. Oncoimmunology. 2014;3:e947871.
- Noh KH, Kim BW, Song KH, et al. Nanog signaling in cancer promotes stem-like phenotype and immune evasion. J Clin Invest. 2012;122:4077–4093.
- Oh SJ, Lee J, Kim Y, et al. Far beyond cancer immunotherapy: reversion of multi-malignant phenotypes of immunotherapeutic-resistant cancer by targeting the NANOG signaling axis. Immune Netw. 2020;20. DOI:10.4110/in.2020.20.e7
- Song K-H, Oh SJ, Kim S, et al. HSP90A inhibition promotes anti-tumor immunity by reversing multi-modal resistance and stem-like property of immune-refractory tumors. Nat Commun. 2020;11:1–16.
- Mizushima N, Komatsu M. Autophagy: renovation of cells and tissues. Cell. 2011;147:728–741.
- Lee J, Kim HS. The role of autophagy in eosinophilic airway inflammation. Immune Netw. 2019;19:e5.
- Noh SH, Gee HY, Kim Y, et al. Specific autophagy and ESCRT components participate in the unconventional secretion of CFTR. Autophagy. 2018;14:1761–1778.
- White E, Mehnert JM, Chan CS. Autophagy, Metabolism, and Cancer. Clin Cancer Res. 2015;21:5037–5046.
- Galluzzi L, Pietrocola F, Bravo-San Pedro JM, et al. Autophagy in malignant transformation and cancer progression. Embo J. 2015;34:856–880.
- Lock R, Kenific CM, Leidal AM, et al. Autophagy-dependent production of secreted factors facilitates oncogenic RAS-driven invasion. Cancer Discov. 2014;4:466–479.
- Amaravadi R, Kimmelman AC, White E. Recent insights into the function of autophagy in cancer. Genes Dev. 2016;30:1913–1930.
- Gupta PB, Chaffer CL, Weinberg RA. Cancer stem cells: mirage or reality? Nat Med. 2009;15:1010–1012.
- Suresh R, Ali S, Ahmad A, et al. The role of cancer stem cells in recurrent and drug-resistant lung cancer. Adv Exp Med Biol. 2016;890:57–74.
- Jin F, Wang Y, Li M, et al. MiR-26 enhances chemosensitivity and promotes apoptosis of hepatocellular carcinoma cells through inhibiting autophagy. Cell Death Dis. 2017;8:e2540.
- Liu G, Fan X, Tang M, et al. Osteopontin induces autophagy to promote chemo-resistance in human hepatocellular carcinoma cells. Cancer Lett. 2016;383:171–182.
- Hasmim M, Janji B, Khaled M, et al. Cutting edge: NANOG activates autophagy under hypoxic stress by binding to BNIP3L promoter. J Immunol. 2017;198:1423–1428.
- Lee YH, Bae HC, Noh KH, et al. Gain of HIF-1alpha under normoxia in cancer mediates immune adaptation through the AKT/ERK and VEGFA axes. Clin Cancer Res. 2015;21:1438–1446.
- Song KH, Choi CH, Lee HJ, et al. HDAC1 upregulation by NANOG promotes multidrug resistance and a stem-like phenotype in immune edited tumor cells. Cancer Res. 2017;77:5039–5053.
- Song KH, Kim JH, Lee YH, et al. Mitochondrial reprogramming via ATP5H loss promotes multimodal cancer therapy resistance. J Clin Invest. 2018;128:4098–4114.
- Li B, Lei Z, Lichty BD, et al. Autophagy facilitates major histocompatibility complex class I expression induced by IFN-gamma in B16 melanoma cells. Cancer Immunol Immunother. 2010;59:313–321.
- Ben-Porath I, Thomson MW, Carey VJ, et al. An embryonic stem cell-like gene expression signature in poorly differentiated aggressive human tumors. Nat Genet. 2008;40:499–507.
- Schneider MR, Wolf E. The epidermal growth factor receptor ligands at a glance. J Cell Physiol. 2009;218:460–466.
- Dupont N, Jiang S, Pilli M, et al. Autophagy-based unconventional secretory pathway for extracellular delivery of IL-1beta. Embo J. 2011;30:4701–4711.
- Rouschop KM, van den Beucken T, Dubois L, et al. The unfolded protein response protects human tumor cells during hypoxia through regulation of the autophagy genes MAP1LC3B and ATG5. J Clin Invest. 2010;120:127–141.
- Klionsky DJ, Elazar Z, Seglen PO, et al. Does bafilomycin A1 block the fusion of autophagosomes with lysosomes? Autophagy. 2008;4:849–850.
- Oh SJ, Cho H, Kim S, et al. Targeting cyclin D-CDK4/6 sensitizes immune-refractory cancer by blocking the SCP3-NANOG axis. Cancer Res. 2018;78:2638–2653.
- Tanida I, Yamaji T, Ueno T, et al. Consideration about negative controls for LC3 and expression vectors for four colored fluorescent protein-LC3 negative controls. Autophagy. 2008;4:131–134.
- Kleffel S, Posch C, Barthel SR, et al. Melanoma cell-intrinsic PD-1 receptor functions promote tumor growth. Cell. 2015;162:1242–1256.
- Chen DS, Mellman I. Oncology meets immunology: the cancer-immunity cycle. Immunity. 2013;39:1–10.
- Ribas A, Dummer R, Puzanov I, et al. Oncolytic virotherapy promotes intratumoral T cell infiltration and improves Anti-PD-1 immunotherapy. Cell. 2018;174:1031–1032.
- Liu Z, Ravindranathan R, Kalinski P, et al. Rational combination of oncolytic vaccinia virus and PD-L1 blockade works synergistically to enhance therapeutic efficacy. Nat Commun. 2017;8:14754.
- Vesely MD, Kershaw MH, Schreiber RD, et al. Natural innate and adaptive immunity to cancer. Annu Rev Immunol. 2011;29:235–271.
- O’Donnell JS, Teng MWL, Smyth MJ. Cancer immunoediting and resistance to T cell-based immunotherapy. Nat Rev Clin Oncol. 2019;16:151–167.
- Igney FH, Krammer PH. Immune escape of tumors: apoptosis resistance and tumor counterattack. J Leukoc Biol. 2002;71:907–920.
- DuPage M, Mazumdar C, Schmidt LM, et al. Expression of tumour-specific antigens underlies cancer immunoediting. Nature. 2012;482:405–409.
- Gajewski TF, Meng Y, Blank C, et al. Immune resistance orchestrated by the tumor microenvironment. Immunol Rev. 2006;213:131–145.
- Siddle HV, Kreiss A, Tovar C, et al. Reversible epigenetic down-regulation of MHC molecules by devil facial tumour disease illustrates immune escape by a contagious cancer. Proc Natl Acad Sci U S A. 2013;110:5103–5108.
- Ting JP, Baldwin AS. Regulation of MHC gene expression. Curr Opin Immunol. 1993;5:8–16.
- van den Elsen PJ, Holling TM, Kuipers HF, et al. Transcriptional regulation of antigen presentation. Curr Opin Immunol. 2004;16:67–75.
- Lefort S, Joffre C, Kieffer Y, et al. Inhibition of autophagy as a new means of improving chemotherapy efficiency in high-LC3B triple-negative breast cancers. Autophagy. 2014;10:2122–2142.
- Lai K, Matthews S, Wilmott JS, et al. Differences in LC3B expression and prognostic implications in oropharyngeal and oral cavity squamous cell carcinoma patients. BMC Cancer. 2018;18:624.
- Wu DH, Wang TT, Ruan DY, et al. Combination of ULK1 and LC3B improve prognosis assessment of hepatocellular carcinoma. Biomed Pharmacother. 2018;97:195–202.
- Kim JM, Chen DS. Immune escape to PD-L1/PD-1 blockade: seven steps to success (or failure). Ann Oncol. 2016;27:1492–1504.
- Peng W, Chen JQ, Liu C, et al. Loss of PTEN promotes resistance to T cell-mediated immunotherapy. Cancer Discov. 2016;6:202–216.
- Garris CS, Arlauckas SP, Kohler RH, et al. Successful Anti-PD-1 cancer immunotherapy requires T cell-dendritic cell crosstalk involving the cytokines IFN-gamma and IL-12. Immunity. 2018;49(1148–61.e7). DOI:10.1016/j.immuni.2018.09.024
- Wang JY, Wu T, Ma W, et al. Expression and clinical significance of autophagic protein LC3B and EMT markers in gastric cancer. Cancer Manag Res. 2018;10:1479–1486.
- Manjithaya R, Subramani S. Autophagy: a broad role in unconventional protein secretion? Trends Cell Biol. 2002;71(2):67–73.
- Folkerts H, Hilgendorf S, Vellenga E, et al. The multifaceted role of autophagy in cancer and the microenvironment. Med Res Rev. 2019;39:517–560.
- Fu J, Liu ZG, Liu XM, et al. Glioblastoma stem cells resistant to temozolomide-induced autophagy. Chin Med J (Engl). 2009;122:1255–1259.
- Lei Y, Zhang D, Yu J, et al. Targeting autophagy in cancer stem cells as an anticancer therapy. Cancer Lett. 2017;393:33–39.
- Song KH, Woo SR, Chung JY, et al. REP1 inhibits FOXO3-mediated apoptosis to promote cancer cell survival. Cell Death Dis. 2017;8:e2536.
- Noh KH, Kang TH, Kim JH, et al. Activation of Akt as a mechanism for tumor immune evasion. Mol Ther. 2009;17:439–447.
- Song KH, Cho H, Kim S, et al. API5 confers cancer stem cell-like properties through the FGF2-NANOG axis. Oncogenesis. 2017;6:e285.
- Noh KH, Kim SH, Kim JH, et al. API5 confers tumoral immune escape through FGF2-dependent cell survival pathway. Cancer Res. 2014;74:3556–3566.
- Pinheiro J, Bates D, DebRoy S, et al. The R Development Core team. 2012. Nlme: linear and nonlinear mixed effects models. R Package Version. 2011;3:1–103.