
ABSTRACT
Macroautophagy/autophagy is a cellular catabolic process that is implicated in several physiological and pathological processes. However, the role of epidermal autophagy in wound healing remains unknown. Here, using mice with genetic ablation of the essential Atg5 (autophagy related 5) or Atg7 (autophagy related 7) in their epidermis to inhibit autophagy, we show that keratinocyte autophagy regulates wound healing in mice. Wounding induces the expression of autophagy genes in mouse skin. Epidermis-specific autophagy deficiency inhibits wound closure, re-epithelialization, keratinocyte proliferation and differentiation, dermal granulation tissue formation, and infiltration of immune cells including macrophages, neutrophils, and mast cells, while it does not affect angiogenesis. Using cytokine array screening, we found that autophagy deficiency inhibits the transcription and production of the cytokine CCL2/MCP-1 by TNF. At the molecular level, TNF induces autophagic flux and the expression of autophagy genes through NFKB in epidermal keratinocytes. TNF promotes CCL2 transcription through the autophagy-AMPK-BRAF-MAPK1/3/ERK-activator protein 1 (AP1) pathway. Indeed, treating mice with recombinant CCL2 can reverse the effect of autophagy deficiency in keratinocytes. At the cellular level, we found that CCL2 induction via autophagy in keratinocytes is required not only for keratinocyte migration and proliferation but also for dermal fibroblast activation. Our findings demonstrate a critical role of epidermal autophagy in wound healing in vivo and elucidate a critical molecular machinery coordinating keratinocyte-fibroblast interaction in skin repair.
Abbreviations: ACTA2/α-SMA: actin alpha 2, smooth muscle; ACTB: β-actin; ADGRE1: adhesion G protein-coupled receptor E1; AMPK: AMP-activated protein kinase; AP1: activator protein 1; AP1-RE: AP1 response element; ATG: autophagy-related; ATG16L1: autophagy related 16 like 1; BECN1: beclin 1; BRAF: B-Raf proto-oncogene, serine/threonine kinase; C5: complement C5; CCL2/MCP-1: C-C motif chemokine ligand 2; CCL3: C-C motif chemokine ligand 3; CK: cytokeratin; cKO: conditional knockout; CRTC1: CREB-regulated transcription coactivator 1; CXCL1: C-X-C motif chemokine ligand 1; CXCL2: C-X-C motif chemokine ligand 2; ECM: extracellular matrix; EGF: epidermal growth factor; FGF7: fibroblast growth factor 7; GABARAPL2: GABA type A receptor associated protein like 2; GAPDH: glyceraldehyde-3-phosphate dehydrogenase; HBEGF: heparin binding EGF like growth factor; HPRT1: hypoxanthine phosphoribosyltransferase 1; IHC: immunohistochemical; IL1B: interleukin 1 beta; KRT10: keratin 10; KRT14: keratin 14; MAP1LC3B/LC3B-I/II: microtubule-associated protein 1 light chain 3 beta; MAPK1/3/ERK: mitogen-activated protein kinase 1/3; MKI67/Ki-67: marker of proliferation; MPO: myeloperoxidase; NFKB: NF-kappa B, nuclear factor kappa-light-chain-enhancer of activated B cells; NFKB-RE: NFKB response element; PDGF: platelet-derived growth factor; PECAM1: platelet and endothelial cell adhesion molecule 1; PRKAA1: protein kinase AMP-activated catalytic subunit alpha 1; RELA/p65: RELA proto-oncogene, NFKB subunit; shCON: small hairpin negative control; siNC: negative control; siRNA: small interfering RNA; SP1: sp1 transcription factor; SQSTM1/p62: sequestosome 1; TGFA: transforming growth factor alpha; TGFB1: transforming growth factor beta 1; TIMP1: TIMP metallopeptidase inhibitor 1; TNF/TNF-alpha: tumor necrosis factor; TREM1: triggering receptor expressed on myeloid cells 1; WT: wild-type
Introduction
Autophagy is a highly conserved cellular catabolic self-eating process [Citation1,Citation2]. During autophagy, organelles or proteins are engulfed by double-membrane structures called autophagosomes and then delivered to lysosomes for degradation [Citation1,Citation2]. Nearly 40 ATG genes have been identified in yeast, and the majority of these ATG genes are highly conserved in mammals [Citation3]. In physiological and pathobiological responses, autophagy regulates a number of cellular processes, including stem cell metabolism and function [Citation4], stress response, cell survival [Citation5], migration [Citation6], and inflammation [Citation7,Citation8]. Autophagy dysfunction is associated with aging and multiple diseases, including neurodegeneration, obesity, diabetes, and cancer [Citation2,Citation9–12].
Mammalian cutaneous wound healing is an evolutionarily conserved process that reestablishes the barrier function and homeostasis of the skin. The molecular and cellular pathways in skin repair are tightly regulated and coordinated to restore the function of the damaged skin [Citation13]. Dysfunctions in wound repair represent a severe health burden in many individuals including the elderly, patients with diabetes or immunosuppression, and patients receiving chemotherapy or radiotherapy [Citation14–16]. These individuals are more susceptible to developing painful, non-healing ulcers than the general population. Chronic non-healing ulcers can lead to infection, amputation, and cancer development.
At the cellular level, wound healing of the skin is a well-coordinated multistep process that involves inflammation, re-epithelialization, and maturation. The initial inflammatory phase stimulates the release of growth factors and chemokines that fight invading microbes and then initiates the re-epithelialization phase of wound repair [Citation17,Citation18]. The phase of wound re-epithelialization requires coordination of multiple consecutive but overlapping events, including the activation and migration of fibroblasts into the provisional matrix to form granulation tissue (wound bed matrix), the proliferation and migration of keratinocytes into the wound, and the differentiation of new epithelium into stratified epidermis. However, it remains poorly understood how these processes are coordinated and regulated at the molecular and cellular levels for different cell types.
Here, using mice with genetic autophagy inhibition in the epidermis, we showed that an epidermis-specific autophagy deficiency inhibited wound healing, re-epithelialization, dermal granulation tissue formation, and infiltration of immune cells, through regulating CCL2 expression via the AMPK-BRAF-MAPK1/3-activator protein 1 (AP1) pathway in keratinocytes. Our findings demonstrate a critical role of autophagy in keratinocytes in wound healing and elucidate a crucial molecular machinery coordinating keratinocyte and fibroblast interaction in skin repair.
Results
Epidermal autophagy deficiency inhibits wound healing
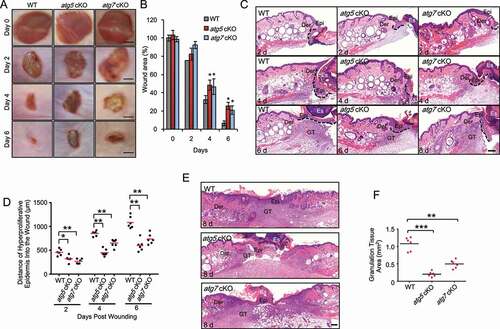
To determine the role of autophagy in wound healing, we used full-thickness excisional wounds introduced to the dorsal skin of mice with or without keratinocyte-specific deletion of the autophagy-essential genes Atg5 (atg5 cKO [conditional knockout]) or Atg7 (atg7 cKO). Without wounding, previous studies have shown that atg7 cKO mice can form functional skin barrier [Citation19]. We did not observe skin abnormalities in atg7 cKO [Citation8] or atg5 cKO without wounding. However, upon wounding, as compared with wild-type (WT) mice, mice with autophagy deficiency in keratinocytes delayed wound closure (). Histological analysis demonstrated delayed re-epithelialization and granulation tissue formation (). These data demonstrated that autophagy deficiency in keratinocytes impairs wound healing.
Figure 1. Epidermal autophagy deficiency inhibits wound healing. (A) Macroscopy view of wound healing on days 0, 2, 4 and 6 in WT, atg5 cKO, and atg7 cKO mice. Scale bar: 1 mm. (B) Quantification of A. (C and E) Wound healing as monitored by histological staining of skin sections at the wound edges at 2, 4, 6 and 8 d after injury in WT, atg5 cKO and atg7 cKO mice. Epi: Epidermis; Der: Dermis; Es: Eschar. GT: Granulation Tissue. Black dotted lines denote dermal-epidermal boundaries (C). Scale bar: 200 μm. (D) Quantification of the length of hyper-proliferative epidermis. (F) Quantification of the granulation tissue areas. All bars represent mean ± SD (n = 6). *, P < 0.05; *, P < 0.01; ***, P < 0.001; compared with WT mice (B) or between comparison groups (D, F); Student’s t-test
Epidermal autophagy deficiency inhibits keratinocyte proliferation and differentiation in mice
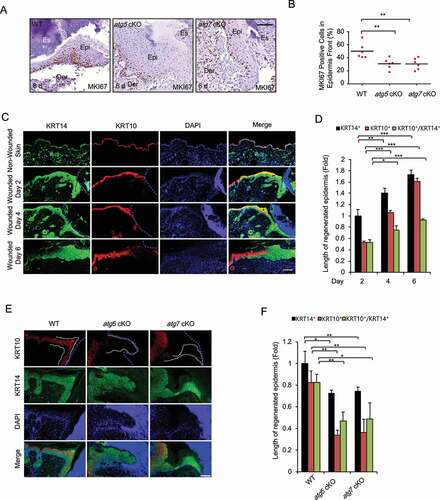
To determine the mechanism by which epidermal autophagy regulates wound healing, we assessed the role of epidermal autophagy in keratinocyte proliferation in vivo. As compared with WT mice, mice with epidermal deletion of Atg5 or Atg7 showed a decreased number of MKI67/Ki-67 (marker of proliferation)-positive cells in the newly regenerated epidermis in the wound area (). To investigate the role of keratinocyte differentiation during wound healing, wound tissue sections on day 2, 4 and 6 were stained with KRT14 (keratin 14) as a marker for basal keratinocytes and KRT10 (keratin 10) as a marker for suprabasal keratinocytes at the exit of proliferation and onset of differentiation. Without wounding, in SKH1 mice, autophagy deficiency slightly increased the thickness of KRT10-positive suprabasal layer, while it had little effect on the thickness of KRT14-positive basal layer (Figure S1), consistent with previous findings [Citation19]. However, at day 2 post-wounding, KRT14-positive basal keratinocytes were increased along the wound edge (eschar) and migrated into the wound, whereas the KRT10-positive suprabasal keratinocytes were observed further away from the wound edge (). In contrast with non-wounded skin, where KRT14 and KRT10 were expressed exclusively in the basal and suprabasal layers (Figure S1), the expression of KRT14 and KRT10 showed both exclusive expression and overlapping expression in wounded skin (), suggesting the presence of intermediate cells during wound healing. In addition, the length of KRT14-positive, KRT10-positive epidermis, and the ratio of KRT10-positive to KRT14-positive epidermis were increased during wound repair (), which were reduced in mice with epidermis-specific autophagy deficiency (). These results clearly demonstrate that epidermal autophagy is critical for keratinocyte proliferation and differentiation onset during wound healing.
Figure 2. Keratinocyte autophagy deficiency inhibits cell proliferation and differentiation in vivo. (A) Immunohistochemical (IHC) staining of MKI67 in wound sections on day 6 in WT and atg5 cKO mice. Scale bar: 50 μm. (B) Quantification of the percentage (%) of MKI67-positive cells in newly regenerated epidermis in A (n = 6). (C and E) Immunofluorescence staining of KRT14 (green), KRT10 (red), and nucleus (blue, DAPI) in non-wounded and wounded skin on day 2, 4, and 6 post-wounding in WT mice (C) or in wounded skin on day 4 in WT, atg5 cKO, and atg7 cKO mice (E). Scale bar: 200 (C) and 100 (E) μm. (D and F) Quantification of C (D) and E (F) (n = 3). All bars represent mean ± SD. *, P < 0.05; *, P < 0.01; ***, P < 0.001; Student’s t-test
Epidermal autophagy deficiency inhibits activation of fibroblasts and recruitment of macrophages, neutrophils and mast cells
To determine whether epidermal autophagy regulates the recruitment and activation of dermal fibroblasts and immune cells, we assessed the effect of epidermal autophagy deficiency on the number and/or activation of these dermal stroma cells. Fibroblasts have been demonstrated to be critical players for skin repair, responsible for regenerating granulation tissue as well as facilitating epidermis regeneration [Citation20,Citation21]. Activated fibroblasts, also known as myofibroblasts that are positive for ACTA2/α-SMA (actin alpha 2, smooth muscle), contribute to wound healing through regulating the secretion of extracellular matrix (ECM), matrix metalloproteinases, tissue inhibitors of metalloproteinases, growth factors, and cytokines important for wound healing [Citation20,Citation21]. As compared with WT mice, mice with epidermal autophagy deficiency showed reduced collagen deposition in the adjacent region of the wound () and a reduced number of ACTA2-positive cells in granulation tissue (), while it did not affect angiogenesis (Figure S2A and S2B).
Figure 3. Keratinocyte autophagy deficiency inhibits the activation of fibroblasts and the recruitment of macrophages and neutrophils. (A) Mallory staining for collagen (blue) of wound sections on day 6 in WT, atg5 cKO, and atg7 cKO mice. Scale bar: 50 μm (B) IHC staining of ACTA2 in wound sections on day 6 in WT, atg5 cKO, and atg7 cKO mice. Scale bar: 20 μm (C) Quantification of B (n = 8). (D) IHC staining of ADGRE1 in wound sections on day 6 in WT, atg5 cKO, and atg7 cKO mice. Scale bar: 20 μm (E) Quantification of D (n = 15). (F) IHC staining of MPO in wound sections on day 2 in WT, atg5 cKO, and atg7 cKO mice. Scale bar: 20 μm (G) Quantification of F (n = 10). *, P < 0.05; **, P < 0.01; ***, P < 0.001; Student’s t-test
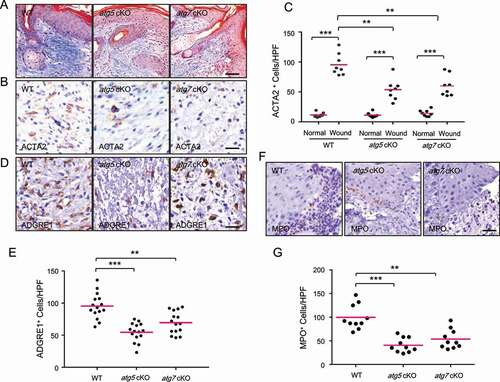
Next, we assessed the effect of epidermal autophagy deficiency on inflammatory cell infiltration, testing whether epidermal autophagy facilitates wound healing by regulating wound-induced inflammation. First, we monitored the macrophages in the wound area by immunohistochemical (IHC) staining of macrophage marker ADGRE1 (adhesion G protein-coupled receptor E1), since macrophages have been described to have many functions in wound healing [Citation22]. We found that, as compared with WT mice, mice with epidermal autophagy deficiency shown a reduced number of ADGRE1-positive macrophages in the granulation tissue at day 6 (). Second, we assessed the number of neutrophils in the wound area by IHC staining of MPO (myeloperoxidase), since neutrophils are the first nucleated immune cells to infiltrate a wound, acting as the first line of defense by decontaminating the wound and generating multiple cytokines and growth factors [Citation23,Citation24]. As compared with WT mice, mice with epidermal autophagy deficiency showed decreased neutrophil recruitment to the wound area at day 2 following wounding (). Third, we analyzed the effect of autophagy deficiency in the epidermis on the number of mast cells, which has also been shown to be important for wound healing [Citation23]. Toluidine blue staining showed that epidermal autophagy deficiency decreased recruitment of mast cells to granulation tissue and the adjacent area (Figure S2C and S2D). Taken together, these data demonstrated that epidermal autophagy facilitates the activation of fibroblasts and the recruitment of macrophages, neutrophils, and mast cells.
Epidermal autophagy facilitates wound healing through regulating CCL2 expression
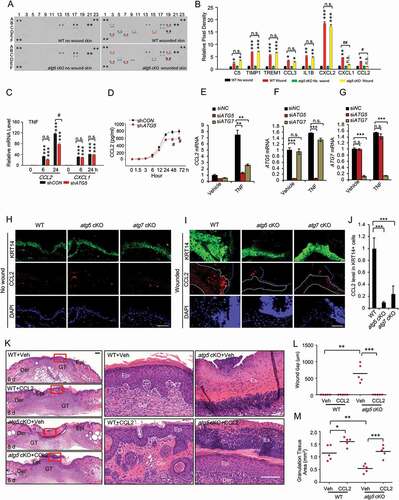
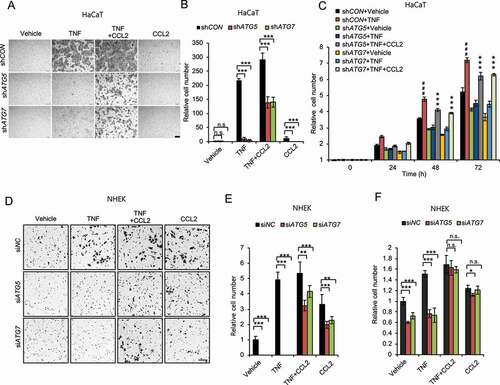
To determine the molecular mechanism by which epidermal autophagy regulates wound healing, we first compared the levels of cytokines in wounds and adjacent skin between WT mice and mice with epidermal autophagy deficiency using a mouse cytokine array kit. In response to wounding, the abundance of C5 (complement C5), TIMP1 (TIMP metallopeptidase inhibitor 1), TREM1 (triggering receptor expressed on myeloid cells 1), CCL3 (C-C motif chemokine ligand 3), IL1B (interleukin 1 beta), CXCL2 (C-X-C motif chemokine ligand 2), CXCL1 (C-X-C motif chemokine ligand 1) and CCL2 was increased in the wound and adjacent area, while only the increases in CXCL1 and CCL2 were blocked by epidermis-specific Atg5 deletion (). To determine the mechanism by which autophagy regulates the abundance of CXCL1 and CCL2, we investigated the effect of autophagy inhibition in HaCaT cells in response to growth factors and cytokines that are important for and induced at the early stage of wound healing, such as EGF (epidermal growth factor), HBEGF (heparin binding EGF like growth factor), FGF7 (fibroblast growth factor 7), TGFA (transforming growth factor alpha), TGFB1 (transforming growth factor beta 1), PDGF (platelet-derived growth factor) and TNF [Citation17]. We found that PDGF did not induce CXCL1 and CCL2 in HaCaT cells (data not shown). All other growth factors and cytokines induced the expression of CXCL1; however, their induction was not affected by autophagy inhibition (Figure S3A–S3E). Only TNF induced CCL2 expression, and CCL2 induction was reduced by autophagy inhibition (). In addition, CCL2 secretion was also induced by TNF, while autophagy inhibition reduced TNF-induced CCL2 secretion (). In addition, we showed that knockdown of ATG5 or ATG7 markedly inhibits TNF-induced CCL2 expression in normal human epidermal keratinocytes (NHEK) (). However, TNF at 100 ng/ml had little effect on cell death in NHEK cells (Figure S3F). Furthermore, we also assessed CCL2 expression in non-wounded and wound skin tissue in WT, atg5 cKO, and atg7 cKO. CCL2 expression was low in epidermis in non-wounded skin (). However, CCL2 expression was induced by wounding, which was reduced by autophagy deficiency in the epidermis (). CCL2 is one of the key chemokines that regulates migration and infiltration of monocytes/macrophages [Citation25]. It has been demonstrated that CCL2 is important for recruitment of macrophages, neutrophils, and mast cells, and ccl2 knockout mice showed significantly delayed wound healing [Citation26]. To determine the role of CCL2 in the function of epidermal autophagy in wound healing, we topically treated the wound area with or without recombinant CCL2 in mice with epidermis-specific Atg5 deletion. Topical treatment with CCL2 reversed the wound healing defect in mice with epidermal autophagy deficiency (). These results demonstrate that epidermal autophagy facilitates wound repair through regulating CCL2 expression.
Figure 4. Epidermal autophagy deficiency inhibits wound healing through inhibiting CCL2. (A) Mouse cytokine array of normal and wounded skin (wound and adjacent area) sections on day 3 in WT and atg5 cKO mice. Dots with alterations were indicated by blue and red line. (B) The relative mean pixel density (fold of WT Non-Wound) of cytokines was listed with a mouse cytokine array assay (n = 6). (C) Real-time PCR for CCL2 and CXCL1 mRNA level in HaCaT cells stably transfected with shCON or shATG5 at 0, 6 and 24 h following TNF treatment. (D) CCL2 production in conditioned medium from HaCaT cells infected with shCON and shATG5 over a time course following TNF treatment. (E, F, and G) Real-time PCR analysis for CCL2 in NHEK cells transfected with siNC, siATG5, and siATG7, treated with or without TNF (100 ng/ml) for 8 h. Data are shown as mean ± S.E. (n ≥ 3). (H and I) Immunofluorescence staining of KRT14 and CCL2 in intact (H) and wound skin (I) on day 2 in WT, atg5 cKO, and atg7 cKO mice. Scale bar: 50 μm. (J) Quantification of the levels of CCL2 in wound healing on day 2 (I) was analyzed by ImageJ (N = 15). The right side of blue dot line is the wound area, and the inside of white dot indicates the area of keratinocyte expressing KRT14. (K) Wound healing as monitored by histological staining at day 8 after injury in WT, atg5 cKO mice with or without CCL2 topical treatment. Epi: epidermis; Der: dermis; Es: eschar. Scale bars: 200 (left panel) and 100 (right penal) µm. (L and M) Quantification of wound gap (L) granulation tissue (M) in K (n = 6). *, P < 0.05; **, P < 0.01; ***, P < 0.001; between comparison groups. #, P < 0.05; ##, P < 0.01 for B and C; compared with their corresponding non-wounded control groups. n.s., not statistically significant. Student’s t-test. Results were obtained from at least three independent experiments (C-G)
Keratinocyte autophagy facilitates the activation of keratinocytes through CCL2
To determine the cellular mechanism by which the autophagy-CCL2 axis regulates wound healing, we first assessed its role in the activation of keratinocytes and fibroblasts, two cell types in which the role of CCL2, as well as autophagy, remains poorly understood. We found that TNF induced cell migration and proliferation in HaCaT cells, and knockdown of either ATG5 or ATG7 inhibited cell migration and proliferation, and treatment with CCL2 reversed the effect of knockdown of ATG5 or ATG7 in HaCaT () and NHEK cells (). These findings demonstrate that autophagy enables keratinocyte proliferation and migration through CCL2.
Figure 5. Autophagy promotes keratinocyte migration and proliferation through CCL2. (A) Representative images of cell migration assay with HaCaT cells with or without knockdown of either ATG5 or ATG7 treated with or without TNF (100 ng/ml) and/or CCL2 (100 ng/ml) for 24 h. Scale bars: 200 µm. (B) Quantification of A (n = 8). (C) Cell proliferation assay in cells as in A (n = 3). ***, P < 0.001; compared with its corresponding group without CCL2 treatment. ###, P < 0.001; compared with the shCON+Vehicle group. (D) Representative images of cell migration assay with NHEK cells, transfected with siNC, siATG5 and siATG7, treated with or without TNF (100 ng/ml) and/or CCL2 (100 ng/ml) for 1 d. Scale bars: 100 µm. (E) Quantification of D (n = 8). (F) Cell proliferation assay in NHEK cells transfected with siNC, siATG5 and siATG7, then treated with or without TNF (100 ng/ml) and/or CCL2 (100 ng/ml) for 2 d (n = 3). All bars represent mean ± SD; *, P < 0.05; **, P < 0.01; ***, P < 0.001; Student’s t-test. Results were obtained from at least three independent experiments (A-F)
Keratinocyte autophagy facilitates the activation of fibroblasts through CCL2
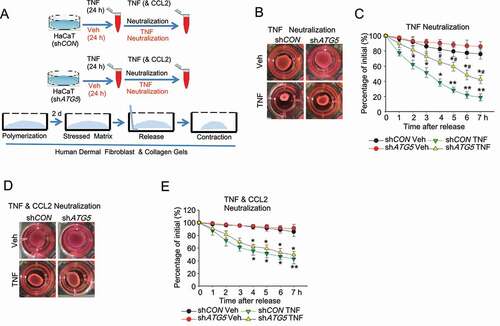
Next, we investigated the role of the keratinocyte autophagy-CCL2 axis in fibroblast activation by monitoring collagen contractility, a characteristic of activated fibroblasts [Citation27]. We found that when HaCaT cells were treated with TNF and then TNF in the medium was neutralized, the conditioned medium from these cells increased cell contractility of primary human dermal fibroblasts. This increase was inhibited by knockdown of ATG5 in the HaCaT cells (). When both CCL2 and TNF were neutralized in the conditioned medium, the effect in the fibroblasts of HaCaT cell autophagy inhibition was abolished (). These data demonstrate that autophagy in keratinocytes enhances fibroblast activation through CCL2.
Figure 6. Autophagy in keratinocytes regulates fibroblast activation. (A) Schematic summary of experimental procedure. (B) Representative phase-contrast image and (C) quantification of collagen-based cell contraction in human dermal fibroblast cells with or without conditioned medium from HaCaT cells infected with shCON or shATG5 and treated with TNF for 48 h. TNF in medium was neutralized before being added to human dermal fibroblast cells. (D and E) Representative phase-contrast image (D) and quantification (E) of collagen-based cell contraction in human dermal fibroblast cells with or without conditioned medium from HaCaT cells stably transfected with shCON or shATG5 treated with TNF for 48 h. TNF and CCL2 in medium were neutralized before being added to human dermal fibroblast cells. *P < 0.05, **P < 0.01, compared with the corresponding vehicle (Veh) group. #, P < 0.05, compared with the shCON TNF group. Student’s t-test. Results were obtained from at least three independent experiments
Autophagy promotes CCL2 transcription through the MAPK1/3-AP1 axis
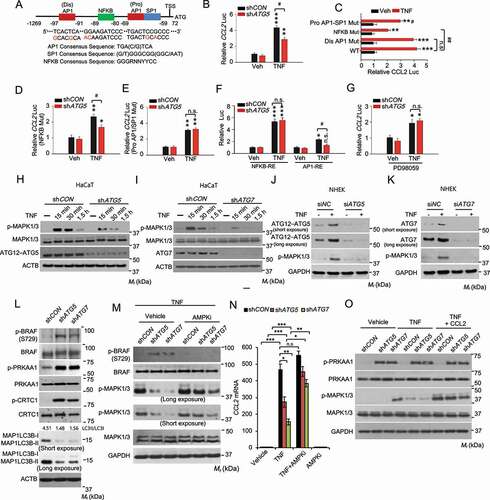
To determine the underlying molecular mechanism by which autophagy regulates CCL2 expression, we first assessed the importance of transcription factor-binding sites in the human CCL2 promoter, from 1269 bp upstream of transcription start site (TSS) to 72 bp downstream of TSS (). We found that TNF induced CCL2 transcription in HaCaT cells, which was inhibited by knockdown of ATG5 (). In the human CCL2 promoter, three elements, i.e., (dis) AP1, NFKB and (pro) AP1-SP1 (sp1 transcription factor) sites, have been demonstrated to play important roles in CCL2 transcription [Citation25]. We mutated each of these elements and then investigated whether removal of these elements affects CCL2 transcription regulated by autophagy. Both NFKB and (pro) AP1-SP1 sites were required for TNF-induced CCL2 transcription (), while only the (pro) AP1-SP1 site was required in the autophagy regulation of CCL2 transcription (). Using promoter constructs containing NFKB response element repeats or the AP1 response element, we found that knockdown of ATG5 inhibited TNF-induced AP1 activity, while it had no effect on TNF-induced NFKB activity (). One of the upstream signaling pathways regulating both AP1 activation and CCL2 expression is MAPK1/3/ERK [Citation28,Citation29]. It is possible that MAPK1/3 signaling mediates the regulation of CCL2 transcription by autophagy. Indeed, the MAPK1/3 inhibitor PD98059 diminished the effect of ATG5 knockdown, indicating that MAPK1/3 is a downstream signal mediating the function of autophagy in CCL2 transcription (). Furthermore, knockdown of either ATG5 or ATG7 inhibited TNF-induced MAPK1/3 activation in HaCaT and NHEK cells (). These data demonstrate that autophagy promotes TNF-mediated CCL2 transcription through the MAPK1/3-AP1 axis.
Figure 7. Autophagy is required for TNF mediated CCL2 transcription through MAPK1/3-AP1 signaling, and the MAPK1/3 activity is controlled by the AMPK-BRAF axis. (A) Schematic representation of the (dis)AP1, NFKB, and (pro)AP1/SP1 sites of the human CCL2 promoter. Red nucleotides indicate mutations made in the human CCL2 promoter. (B) Reporter assay for the Human CCL2 promoter with wild-type sequence transfected into HaCaT cells with shCON or shATG5, following treatment with or without TNF for 24 h. (C) Same as B except that HaCaT cells were transfected with the human CCL2 promoter with wild-type sequence or mutation of the (dis)AP1 site, NFKB site, or (pro)AP1/SP1 site. (D) Same as B except that HaCaT cells were transfected with the human CCL2 promoter with mutation of NFKB site, following treatment with or without TNF for 24 h. (E) Same as D except that HaCaT cells were transfected with the human CCL2 promoter with mutation of (pro)AP1/SP1 site. (F) Same as B except that HaCaT cells were transfected with promoters with a repeated sequence of the NFKB-RE (NFKB response element) or AP1-RE (AP1 response element). (G) Same as B except that the cells were treated with PD98059 (20 µM) 2 h prior to and during TNF treatment. *, P < 0.05; **, P < 0.01; ***, P < 0.001; compared with its corresponding Veh group. #, P < 0.05; ##, P < 0.01; compared with shCON group (B, D-G), or with WT/TNF group (C); Student’s t-test. (H and I) Immunoblot analysis of p-MAPK1/3, MAPK1/3, ATG12–ATG5, and ATG7 in HaCaT cells infected with shCON, shATG5 (H), or shATG7 (I), starved overnight, followed by treatment with or without TNF (100 ng/ml) over a time course. (J and K) Immunoblot analysis of p-MAPK1/3, ATG12–ATG5, and ATG7 in NHEK cells transfected with siNC, siATG5 (J), or siATG7(K), starved with 5 fold-diluted the complete medium for NHEK for 24 h, treated with or without TNF (100 ng/ml) for 30 min. (L) Immunoblot analysis of p-BRAF (S729), BRAF, p-PRKAA1, PRKAA1, p-CRTC1, CRTC1, and MAP1LC3B/LC3B-I/II (microtubule-associated protein 1 light chain 3 beta) in HaCaT cells infected with shCON, shATG5, or shATG7. (M) Immunoblot analysis for p-BRAF, BRAF, p-MAPK1/3, and MAPK1/3 in HaCaT cells infected with shCON, shATG5, or shATG7, starved overnight, and treated with the AMPK inhibitor compound C (AMPKi 1 μM) for 2 h, followed by treatment with TNF (100 ng/ml) for 15 min. (N) Real-time PCR analysis for CCL2 mRNA level in HaCaT cells treated with or without Compound C (1 μM) for 5 h and then treated with TNF (100 ng/ml) for 24 h. Data are shown as mean ± S.E. (n ≥ 3). *P < 0.05; **P < 0.01; compared with the corresponding group without compound C treatment; Student’s t-test (C). (O) Immunoblot analysis of p-PRKAA1, PRKAA1, p-MAPK1/3, MAPK1/3, and GAPDH in HaCaT cells treated with or without TNF (100 ng/ml) or CCL2 (100 ng/ml) for 15 min. Results were obtained from at least three independent experiments
Autophagy regulates MAPK1/3-CCL2 signaling through the AMPK/BRAF pathway
To determine the mechanism by which autophagy regulates the MAPK1/3-CCL2 pathway, we assessed the role of AMP-activated protein kinase (AMPK) [Citation30,Citation31]. Recently, we have shown that autophagy deficiency activates AMPK in keratinocytes [Citation8], likely through metabolic stress caused by loss of autophagy-mediated nutrient recycling. In addition, AMPK has recently been shown to phosphorylate the oncogenic protein kinase BRAF to inhibit MAPK1/3 activation and cell proliferation [Citation32]. Indeed, we found that autophagy inhibition enhanced the phosphorylation of PRKAA1 (protein kinase AMP-activated catalytic subunit alpha 1), the catalytic subunit of AMPK, as well as CRTC1 (CREB-regulated transcription coactivator 1) [Citation33] and BRAF at serine 729, substrates for AMPK (). However, the AMPK inhibitor compound C prevented the effect of autophagy deficiency on phosphorylation of BRAF and MAPK1/3 and the expression of CCL2 in response to TNF (). Treatment with CCL2 reversed the effect of autophagy deficiency on MAPK1/3 phosphorylation, while it did not affect AMPK activation (). These findings demonstrate that autophagy regulates MAPK1/3 activation and CCL2 expression through the AMPK-BRAF axis and that autophagy-MAPK1/3-CCL2 forms a positive feedback loop in keratinocyte response to TNF.
TNF induces NFKB-mediated expression of autophagy genes through and autophagic flux in keratinocytes
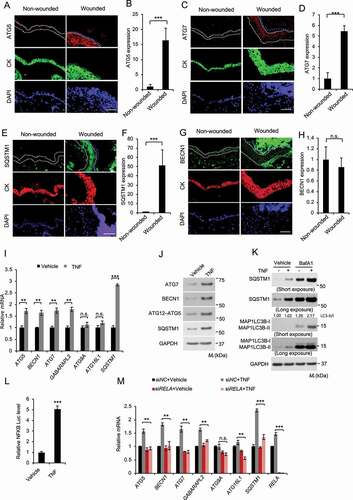
Next, we tested the hypothesis that wounding and TNF induce autophagy. To do so, we first analyzed the expression of autophagy-associated genes. Indeed, wounding induced the expression of ATG5, ATG7, and the autophagy receptor SQSTM1/p62 (sequestosome 1) (), while it did not affect the expression of BECN1/Beclin1 (). Interestingly BECN1 was detected in the keratin-negative eschar area, likely from early responding immune cells recruited to the wound (). Next, we assessed the effect of TNF on expression of autophagy-associated genes in NHEK cells. Indeed, TNF increased the mRNA levels of several autophagy genes, including ATG5, BECN1, ATG7, GABARAPL2 (GABA type A receptor associated protein like 2), and SQSTM1, while it did not affect the expression of ATG9 and ATG16L1 (autophagy related 16 like 1) (). Similarly, TNF increased the protein levels of ATG7, BECN1, ATG5, and SQSTM1 (). Furthermore, we found that TNF induced autophagy in both NHEK and HaCaT cells ( and S4). As predicted, we found that TNF increases the transcriptional activity of NFKB in NHEK cells (). Inhibition of NFKB pathway by knockdown of its subunit RELA/p65 (RELA proto-oncogene, NFKB subunit) completely abolished the effect of TNF (). These findings demonstrate that wounding induces the expression of autophagy genes in the regenerated epidermis and TNF induces NFKB-mediated expression of autophagy genes and autophagic flux in keratinocytes.
Figure 8. TNF induces keratinocyte autophagy through NFKB activation. (A-H) Immunofluorescence analysis of, ATG5 (A-B), ATG7 (C-D), SQSTM1 (E-F), and BECN1 (G-H) in keratinocytes in non-wounded and wounded skin on day 2 post-wounding. Cytokeratin (CK) was used as a keratinocyte marker. The dotted line indicates CK-positive keratinocytes. Scale bar: 50 μm. All bars represent mean ± SD (n = 10). (I) Real-time PCR analysis for ATG5, BECN1, ATG7, GABARAPL2, ATG9, ATG16L1, and SQSTM1 mRNA level in NHEK cells, starved with 5 fold-diluted the defined medium for NHEK for 24 h, then treated with or without TNF (100 ng/ml) for 18 h. Data are shown as mean ± S.E. (n ≥ 3). (J) Immunoblot assay for ATG5, ATG7, BECN1, and SQSTM1 protein level in NHEK cells, starved with 5 fold-diluted the complete medium for NHEK for 24 h, treated with or without TNF (100 ng/ml) for 18 h. (K) Immunoblot assay for MAP1LC3B-I/II, SQSTM1, and GAPDH (glyceraldehyde-3-phosphate dehydrogenase) in NHEK cells, starved with 5 fold-diluted the complete medium for NHEK, then treated with or without the lysosome inhibitor bafilomycin A1 (BafA1, 25 nM), and treatment of TNF (100 ng/ml) for 18 h. (L) Luciferase reporter analysis of NFKB response element in NHEK cells treated with or without TNF (100 ng/ml) for 18 h. (M) Real-time PCR analysis for ATG5, BECN1, ATG7, GABARAPL2, ATG9, ATG16L1, and SQSTM1 mRNA level in NHEK cells transfected with siNC or siRELA, starved with 5 fold-diluted the defined medium for NHEK for 24 h, then treated with or without TNF (100 ng/ml) for 18 h. Data are shown as mean ± S.E. (n ≥ 3). *, P < 0.05; **, P < 0.01; ***, P < 0.001; Results were obtained from at least three independent experiments
Discussion
In this study, we show that autophagy inhibition in keratinocytes in mice impairs skin repair. Autophagy deficiency in keratinocytes not only compromised keratinocyte function including proliferation and migration, but also suppressed fibroblast activation. The effect of autophagy deficiency in keratinocytes in wound healing is mediated via regulating CCL2 expression. Autophagy regulates CCL2 expression through the AMPK-BRAF-MAPK1/3 signaling axis. Wound and TNF induces expression of autophagy genes, and TNF induces autophagic flux. Our findings demonstrate a critical role for epidermal autophagy in wound healing and suggest new opportunities to promote wound healing by targeting autophagy.
Autophagy is a critical catabolic process that removes unwanted or damaged organelles and proteins through the lysosomal degradation pathway. Autophagy dysfunction has been shown to regulate the risk of numerous pathologies and diseases including cancer, neurodegeneration, diabetes, and infectious diseases [Citation1,Citation4,Citation9]. We have recently demonstrated that the autophagy pathway in keratinocytes is critical for regulating DNA damage repair and tumorigenesis [Citation8,Citation34]. Using mice with autophagy inhibition in the epidermis, we have found here that autophagy in keratinocytes facilitates wound repair in mice through promoting CCL2 expression and is induced by TNF. Inhibition of epidermal autophagy decreased the presence of activated fibroblasts, macrophages, neutrophils, and mast cells in the dermis, while it did not affect angiogenesis. It inhibited both re-epithelialization and granulation tissue regeneration during wound healing, which was reversed by treatment with CCL2. At the cellular level, although previous work from our group [Citation35] and others [Citation6] has identified a few cell-autonomous mechanisms by which autophagy regulated cell migration in cancer cells and metastasis such as the turnover of focal adhesion factors or epithelial-mesenchymal transition factors in different cell lines, we found that autophagy in non-tumorigenic keratinocytes facilitates their proliferation and migration, along with fibroblast activation in response to TNF, through regulating CCL2 expression and production. Our findings demonstrate an active role of keratinocytes in regulating fibroblast activation and dermal regeneration during skin repair, and the previously unknown role of autophagy in keratinocytes’ function in wound healing.
Initially identified as a major macrophage chemoattractant regulating migration and infiltration of monocytes/macrophages [Citation25], CCL2 plays important roles in wound healing by regulating the activity of several cell types. Global ccl2 deficiency resulted in delayed re-epithelialization, angiogenesis, and collagen synthesis in mice [Citation26]. However, it did not affect the total number of macrophages at the wound site [Citation26]. The importance of CCL2 in wound healing was also demonstrated in promoting healing of diabetic wounds by treating the wounds with CCL2 [Citation36]. However, CCL2 treatment restored the macrophage response of diabetic wounds [Citation36]. These findings suggest that the biological functions of CCL2 in macrophages and other cell types in wound repair are context-dependent. Indeed, previous reports have shown that CCL2 derived from keratinocytes recruits dendritic and Langerhans cells to the skin [Citation37]. CCL2 derived from pulmonary fibroblasts increases cell activation and migration [Citation38]. In addition, CCL2 also enhances pulmonary fibroblast survival, which may contribute to lung fibrosis [Citation39]. Here, we found that CCL2 is a critical factor in facilitating wound healing as a downstream of autophagy in keratinocytes. In response to TNF, CCL2 expression in keratinocytes is inhibited by autophagy deficiency, and CCL2 abundance is required for the function of TNF and autophagy for keratinocyte proliferation and migration. In addition, CCL2 produced in keratinocytes also enabled fibroblast activation, suggesting autophagy-CCL2 as a critical signaling mediating keratinocyte-fibroblast interaction. Future investigations are needed to determine whether CCL2 derived from keratinocytes also regulates the recruitment and activity of other cell types in the dermis and keratinocyte differentiation in wound repair.
In keratinocytes, we found that autophagy is required for CCL2 induction in response to wounding in mouse skin and to TNF in vitro. First, we found that autophagy gene expression in mouse skin is induced by wounding, consistent with previous studies [Citation40]. In addition, autophagy gene expression is induced by TNF in keratinocytes. It seems that BECN1 is induced by TNF in keratinocytes, but not in mouse epidermis following wounding. This could be due to the following reasons: (1) difference in human and mouse BECN1 gene regulation, (2) additional regulators that counteract the effect of TNF, or (3) different temporal response of BECN1 expression to TNF in vitro and wounding in vivo. Second, TNF induces autophagy and autophagic flux in keratinocytes. Third, we found that autophagy deficiency inhibits CCL2 transcription through the AMPK-BRAF-MAPK1/3-AP1 axis. It is possible that autophagy inhibition led to insufficient nutrient supply and thus metabolic stress in response to wounding, and thereby resulted in the activation of the energy-sensing kinase AMPK. Previous studies have demonstrated that AMPK phosphorylates the BRAF kinase at serine 729 to inhibit MAPK1/3 activation and cell proliferation [Citation32], linking energy-sensing mechanisms to cell proliferation. In keratinocytes, we found that inhibition of autophagy led to increased AMPK activation and BRAF phosphorylation at serine 729; it also decreased MAPK1/3 activation as well as CCL2 transcription. AMPK inhibition reversed the effect of autophagy deficiency on BRAF phosphorylation and MAPK1/3 activation, indicating that AMPK acts as a critical downstream factor responsible for autophagy’s function in wound response. However, other mechanisms may also play important roles. For example, previous studies have shown that autophagosomes and autophagy proteins serve as scaffolds in MAPK1/3 activation in response to growth factors [Citation41]. Future studies are needed to determine whether similar mechanisms also play a role in autophagy’s role in MAPK1/3 activation and CCL2 induction in response to cytokines and growth factors.
The role of autophagy in tissue regeneration is intriguing. Previous work has shown that autophagy maintains the function and metabolism of both young and old hematopoietic stem cells [Citation4]. Autophagy deficiency causes accumulation of mitochondria and an activated metabolic state and reduces stem-cell self-renewal activity and regenerative potential [Citation4]. In addition to regulating keratinocyte proliferation, migration, and differentiation, it is possible that autophagy also maintains the self-renewal capability of epidermal stem cells and progenitor cells. Furthermore, the role of autophagy in other cell types has been explored in wound healing. For example, the pharmacological autophagy inhibitor 3-methyladenine (3-MA) slightly accelerated wound healing in normal mice or diabetic wounds, and macrophages may be a major cell type with autophagy induction [Citation42]. Future investigations are warranted to elucidate the role of autophagy in macrophages and other cell types in wound healing using mouse models with genetic autophagy deficiency in specific cell types and keratinocyte differentiation during wound healing.
Our findings suggest that wounding induces the expression of autophagy genes and CCL2 in the newly generated undifferentiated epidermis. Our findings show that the levels of CCL2 and autophagy genes are low in the epidermis without wounding, while they are upregulated in the undifferentiated KRT14-positive keratinocytes in the wound edge, suggesting that wounding induces CCL2 expression in undifferentiated keratinocytes that migrate into the wound, consistent with previous work showing that CCL2 is induced and upregulated in basal undifferentiated keratinocytes by inflammatory conditions, such as psoriasis [Citation43]. Recent studies suggest that autophagy functions in terminally differentiated cells under homeostatic conditions or in vitro, respectively [Citation44,Citation45]. Although under homeostatic condition, mice with epidermis-specific Atg7 ablation can form a functional skin barrier [Citation19], skin from mice with global Atg7 deletion showed altered differentiation gene expression among other histological changes after grafting into immunocompromised mice, as compared with those from wild-type mice [Citation46]. It is possible that the specific cell types that respond to autophagy induction are context-dependent. In this study in mice with wounding, which elicits inflammation in order to initiate the repair, we found that keratinocytes at the wound edge are undifferentiated (KRT14-positive while KRT10-negative) (). At a later stage of wound closure, KRT10-positive suprabasal keratinocytes were detected next to the non-wounded skin, away from the wound edge (). Interestingly the protein levels of autophagy genes including ATG5, ATG7, and SQTM1 were low in non-wounded skin while wounding induced the expression of these autophagy genes in the regenerated epidermis at the wound edge (). Future investigations are warranted to elucidate the role of autophagy in keratinocyte differentiation as well as in differentiated and undifferentiated keratinocytes in response to stress conditions such as wounding and other injuries.
In summary, our findings demonstrated a critical role for keratinocyte autophagy in facilitating both epidermal regeneration and dermal regeneration in wound healing via regulating CCL2 expression. Autophagy regulates CCL2 expression through the AMPK-BRAF-MAPK1/3-AP1 axis. Given the strong association of the decline of autophagy function with aging [Citation4,Citation12], our finding may not only elucidate a previously unknown molecular and cellular mechanism regulating skin repair but may also provide new opportunities for developing new strategies to restore wound healing in individuals with autophagy dysfunction, including in the elderly, by targeting autophagy.
Materials and methods
Cell culture
Primary Normal Human Epidermal Keratinocytes (NHEK) were purchased from Invitrogen (Invitrogen, C-001-5 C). NHEK cells were maintained in NHEK complete medium (Invitrogen, S-001-5) according to manufacturer’s instructions. HaCaT (human keratinocytes, kindly provided by Dr. Norbert E Fusenig, German Cancer Research Center, Heidelberg, Germany) and HEK-293 T (human embryonic kidney cells, ATCC, CRL-3216) were maintained in monolayer culture in 95% air/5% CO2 (vol/vol) at 37°C in Dulbecco’s modified Eagle’s medium (DMEM; Gibco, 11965–092) supplemented with 10% fetal bovine serum (FBS; Gibco,10437–028), 100 units per mL penicillin and 100 μg/mL streptomycin (Invitrogen, Gibco™, 15140). For the TNF, TGFA, TGFB, EGF, HBEGF, and FGF7 treatments, HaCaT cells were washed with PBS (Gibco, 20012–027) twice, incubated with serum-free DMEM medium overnight, and then the medium replaced with serum-free DMEM supplemented with human TNF (100 ng/ml; R&D Systems Inc., 210-TA, for HaCaT and NHEK cells), TGFA (100 ng/ml; R&D Systems Inc., 293-A), TGFB (50 ng/ml; R&D Systems Inc., 240-B), EGF (50 ng/ml; R&D Systems Inc., 236-EG), HBEGF (50 ng/ml; R&D Systems Inc., 259-HE), FGF7 (100 ng/ml; R&D Systems Inc., 251-KG), or compound C (Sigma-Aldrich, P5499) for the indicated time. The anti-TNF (2 µg/ml, MAB-610) and anti-CCL2 neutralization antibodies (2 µg/ml, MAB-279) were obtained from R&D Systems Inc., and an isotype-matched IgG1 monoclonal control antibody was obtained from Santa Cruz Biotechnology (SC-3882). The specific MEK inhibitor PD98059 was obtained from BioMol (M2865-17A.5).
Wound healing in mice
Atg7flox/flox mice and Atg5flox/flox mice, in which Atg7 and Atg5 exons are flanked by loxP sites, were described previously [Citation47,Citation48]. Krt14-Cre (Tg[Krt14-Cre]1Amc) mice were from Jackson Laboratory (004782); SKH1-HR (Hairless mice) from Charles River Labs (686). Atg7flox/+; Krt14-Cre and Atg5flox/+; Krt14-Cre mice were backcrossed onto SKH-1 mice for at least five generations. The resulting SKH-1 Atg7flox/flox; Krt14-Cre (atg7 cKO) mice, SKH-1 Atg5flox/lox; Krt14-Cre (atg5 cKO) mice and their littermate SKH-1 Atg7flox/flox (WT) or SKH-1 Atg5flox/lox (WT) mice were used for wound healing experiments. Animal experiments were performed following approval by the Animal Care and Use Committee at the University of Chicago.
For skin wound healing assays, same-sex littermates of ~10-week-old mice were anesthetized, and full-thickness excisional wounds (4 mm) were made one on each side of the dorsal midline [Citation49]. Mice were housed separately, and no self-induced trauma was observed. Tissue was collected at day 2–8 after wounding, and wound re-epithelialization was evaluated by histological analyses. Hyperproliferative epidermis (HE) was identified by hematoxylin and eosin staining, and the length of HE that extended into the wounds was measured and quantified. CCL2 topical treatment was performed as described previously [Citation36]. Briefly, CCL2 dissolved in PBS (1 µg/mice) or PBS alone was added to the wounds after wounding. Then, the wounds were covered with a very thin layer of petrolatum gel to prevent desiccation and to facilitate absorption.
Lentiviral generation and infection
pLKO.1 plasmids of shCON (small hairpin RNA targeting negative control) and shATG5 were obtained from Sigma (Sigma-Aldrich, SHC001 and TRCN0000151963, respectively), and pLKO.1 plasmids of ATG7 was kindly provided by Dr. Alec C. Kimmelman (Harvard Medical School, Boston, MA). Lentivirus was produced by co-transfection into HEK-293 T cells with lentiviral vectors in combination with the pCMV delta 8.2 packaging vector (Addgene, 12263; deposited by Dr. Didier Trono) and pCMV-VSV-G envelope vector (Addgene, 8454; deposited by Dr. Bob Weinberg) using GenJet Plus DNA In Vitro Transfection Reagent (Signagen, SL100500). Virus containing supernatants were collected 24–48 h after transfection and used to infect recipients. Target cells were infected in the presence of polybrene (8 μg/ml) (Sigma-Aldrich, H9268) and selected with puromycin (Santa Cruz Biotechnology, sc-108071, 2 μg/ml) for over 1 week.
Immunofluorescence
Formalin-fixed, paraffin-embedded skin tissue sections were incubated with blocking solution (3% albumin from chicken egg white [Sigma-Aldrich, A5503] in PBS) after antigen retrieval. The tissue slides were incubated at 4°C with primary anti-KRT14 (Abcam, ab7800), anti-KRT10 (Abcam, ab76318), pan KRT/cytokeratin (ORIGENE_BP5069), anti-wide spectrum KRT/cytokeratin (Abcam, ab9377), anti-ATG5 (Abcam, ab108327), anti-ATG7 (Abcam, ab133528), anti-SQSTM1 (Abcam, ab56416), anti-BECN1 (Proteintech, 66665-1-Ig), anti-CCL2 (Invitrogen, PA5-34505) for 18 h. After removing the primary antibodies, the slides were washed with PBS solution with 0.05% Triton X-100 (Sigma-Aldrich, T8787). The slides were then incubated at room temperature with Alexa Fluor 594-conjugated secondary rabbit IgG (Jackson ImmunoResearch, 711–585-152), Alexa Fluor 488-conjugated secondary mouse IgG (Jackson ImmunoResearch, 715–545-150), Alexa Fluor 488-conjugated secondary Guinea Pig IgG (Jackson ImmunoResearch, 706–545-148) for 1 h, then washed with PBS solution with 0.05% TritonX-100 for 3 times, in the second time for washing, DAPI (Sigma-Aldrich, D9542) was added. The slides were mounted with Fluoromount Mounting Medium (Sigma-Aldrich, F4680) for cell nucleus counterstaining. Stained slide samples were analyzed using a fluorescence microscope (Olympus IX71, Olympus Life Science, Japan). The length of KRT14-positive or KRT10-positive epidermis or the intensity of immunostaining was quantified in newly generated epidermis as well as non-wounded skin by ImageJ (NIH).
Western blotting
Western blotting was performed as described previously [Citation50,Citation51]. Briefly, cell lysates were prepared using RIPA buffer (Pierce, 89900) containing inhibitors for proteases and phosphatases. Protein abundance was analyzed by SDS-PAGE and transferred onto nitrocellulose membranes, followed by immunoblotting. Antibodies used are as follows. p-MAPK1/3 (SC-7383), MAPK1/3 (SC-514302), ACTB (SC-47778), and GAPDH (SC-47724) were obtained from Santa Cruz Biotechnology. ATG5 (2994), ATG7 (8558), BECN1 (3495), PRKAA1 (2603), p-PRKAA1 (2535), MAP1LC3B (3868 & 83506), and BRAF (14814) were obtained from Cell Signaling Technology. CRTC1 (27647-I-AP) was obtained from Proteintech. p-CRTC1 (ABE-560) was obtained from Millipore Co. p-BRAF (ab124794) was obtained from Abcam. All targeted proteins and loading controls were detected within the linear range.
siRNA (small interfering RNA) transfection
Using PepMute™ siRNA Transfection Reagen (SignaGen Laboratories_SL100566), NHEK cells were transfected with siRNA (Dharmacon), targeting negative control (NC) (Dharmacon, D-001810-01-05), ATG5 (Dharmacon, L-004374-00-0005), ATG7 (Dharmacon, L-020112-00-0005), or RELA (Dharmacon, L-003533-00-0005) according to the manufacturer’s instructions.
Luciferase reporter assays
Human pEZX-PG02.1 CCL2-Luc promoter (Genecopoeia, HPRM44640-PG02), PGL3 pEZX-PG02.1 CCL2 (dis-AP1 mutation)-Luc, pEZX-PG02.1 CCL2 (NFKB mutation)-Luc and pEZX-PG02.1 CCL2 (pro-AP1/sp1 mutation)-Luc were used. Two μg Luc plasmids and 0.5 μg of pEZX-SEAP (Genecopoeia, HPRM44640-PG02; used as a transfection efficiency control) were transfected with X-tremeGENE HP (Roche, 06366236001) following the manufacturer’s instructions. For NFKB luciferase assay, Using GenJet Plus DNA In Vitro Transfection Reagent (Signagen, SL100499), cells were transfected with pGL3 NFKB-Luc (1 μg), and pRLTK (0.025 μg) as a control for transfection efficiency (Promega, E1910), according to the manufacturer’s instructions. The luciferase activity was measured as described previously [Citation52].
Quantitative real-time PCR (qPCR)
Total RNA was isolated using RNeasy Plus Mini Kit (QIAGEN, 74136), following the manufacturer’s protocol, and then cDNA was synthesized using iScript™ Reverse Transcription Supermix for RT-qPCR (Bio-Rad, 1708841), following the manufacturer’s protocol. qPCR assays were carried out using a CFX Connect real-time system (Bio-Rad, Hercules, CA) with Bio-Rad iQ SYBR Green Supermix (Bio-Rad, 1708884). The threshold cycle number (CQ) was analyzed in triplicate for each sample. The CQ values for ATG5, ATG7, BECN1, GABARAPL2, ATG9A, ATG16L1, RELA, and CCL2 were normalized against HPRT1, ACTB, or GAPDH. The primer sequences used for qRT-PCR are shown in Table S1.
Site directed mutagenesis
Mutations of human pEZX-PG02.1 CCL2-Luc promoter plasmids were carried out using the QuikChange XL site-directed mutagenesis kit following the manufacturer’s instructions (Agilent Technologies, 200516). The primers used for introducing the nucleotide changes were listed in Table S2. All mutants were confirmed by sequencing.
Toluidine blue staining for mast cells
Toluidine blue staining for mast cells was performed according to the manufacturer’s protocol (NovaUltra, IW-3013). Briefly, the sections were deparaffinized and hydrated and then stained in toluidine blue working solution. After washing, the sections were dehydrated and then placed under coverslips with resinous mounting medium. The numbers of mast cells were calculated as the average from 22 or 35 different fields of each sample (HPF; ×400 magnification).
Cell contraction assay
Fibroblast activation was assessed using a cell contraction kit (Cell Biolabs, CBA201). Primary human dermal fibroblasts were re-suspended in DMEM, and two parts of cells were mixed with eight parts of collagen gel lattice mixture and plated for 1 h at 37°C. After the gel was polymerized, 1 ml of medium was added and incubated for 2 d. Next, the gels were released from the sides of the wells, and 24 h later the images were taken. The changes in collagen gel size were analyzed using ImageJ software and normalized to areas of the well.
Cell proliferation assay
Cell proliferation was assessed using the Cell Counting Kit-8 (CCK-8; Sigma-Aldrich, 96992) following the manufacturer’s protocol [Citation50].
Determination of CCL2 level
CCL2 levels in cultured medium were measured using a solid-phase sandwich enzyme-linked immunosorbent assay (ELISA; CCL2 Quantikine ELISA kit, R&D systems, Inc., DCP00) according to the manufacturer’s instructions. The concentration of CCL2 was calculated using the reference calibrated standard curve obtained by plotting the optical density values of the standards against their concentrations.
Masson trichrome staining
Masson trichrome staining for collagen fibers of the connective tissues was performed according to the manufacturer’s protocol (Sigma-Aldrich, HT15) as described previously [Citation49].
Cytokine array
A mouse cytokine array was performed using the mouse Cytokine Array Panel A (R&D Systems, ARY006) following the manufacturer’s instructions. 300 µg tissue lysates were incubated with a separate array precoated with 40 cytokine/chemokine duplicate antibodies and labeled with streptavidin-HRP-conjugated secondary antibody and developed using chemiluminescence. The intensity of the selected dots was analyzed using ImageJ (NIH) software. Duplicates were averaged and the background-subtracted to calculate the mean pixel density for each protein. Names of cytokines are listed in Table S3.
Histological and immunohistochemical analysis
Hematoxylin and eosin (H&E) staining and immunohistochemical analysis of ADGRE1, PECAM1 (platelet and endothelial cell adhesion molecule 1), MKI67, ACTA2 and MPO were performed by the Immunohistochemistry core facility at the University of Chicago as described previously [Citation49]. Antibodies used were mouse anti-ADGRE1 antibody (1:200, AbD Serotec, MCA497 GA), Rabbit anti-MPO antibody (1:100; Thermo Fisher Scientific, B-373-A0), Rabbit anti-ACTA2 antibody (1:200; Abcam, ab5694), and Rabbit anti-PECAM1 antibody (1:200; Santa Cruz Biotechnology, sc376764).
Cell migration assay
Cell migration was assessed as described previously [Citation50]. Cell suspension (150 μl of serum-free medium for HaCaT or basal NHEK medium for NHEK) were seeded onto 8-mm Pore Transwell Inserts (Corning, 353097) for migration assay. Lower chambers were filled with 10% FBS DMEM medium (900 μl) for HaCaT or complete NHEK medium (900 μl) for NHEK. The Transwell Inserts were then fixed with paraformaldehyde in PBS (4%) for 30 min. Next, fixed cells were stained with hematoxylin solution (Sigma-Aldrich, HHS32) for 2 h. Then, microphotograms of the cells migrated onto the lower side of the filter were imaged using a microscope. From the microphotograms, cells that migrated onto the lower side of the filter were manually counted. Cell numbers were quantified from randomly selected fields with the same area (500 μm×500 μm) per Transwell insert.
Statistical analyses
Statistical analyses were carried out using Prism 6 (GraphPad software, San Diego, CA, USA) as described previously [Citation35]. Data are reported as mean ± S.D. unless otherwise indicated. Results between two independent groups were determined by the unpaired Student’s t-test. P values less than 0.05 were considered significant.
Supplemental Material
Download Zip (14.2 MB)Acknowledgments
We thank Dr. M. Komatsu for providing the Atg7flox/flox mice, Dr. Noboru Mizushima for providing the Atg5flox/flox mice, Dr. Norbert Fusenig for providing the HaCaT cells, Terri Li for immunohistochemistry, Dr. Ann Motten for a critical reading of the manuscript, Dr. Sasha Shafikhani (Rush University Medical Center) for technical assistance, Dr. Didier Trono for providing the pCMV delta 8.2 packaging vector (Addgene, 12263), and Dr. Bob Weinberg for providing the pCMV-VSV-G envelope vector (Addgene, 8454).
Disclosure statement
The authors declare no competing interests.
Supplementary material
Supplemental data for this article can be accessed here.
Additional information
Funding
Related Research Data
References
- Klionsky DJ. Autophagy: from phenomenology to molecular understanding in less than a decade. Nat Rev Mol Cell Biol. 2007;8:931–937.
- Mizushima N, Levine B, Cuervo AM, et al. Autophagy fights disease through cellular self-digestion. Nature. 2008;451:1069–1075.
- Mizushima N, Yoshimori T, Ohsumi Y. The role of Atg proteins in autophagosome formation. Annu Rev Cell Dev Biol. 2011;27:107–132.
- Ho TT, Warr MR, Adelman ER, et al. Autophagy maintains the metabolism and function of young and old stem cells. Nature. 2017;543:205–210.
- Kroemer G, Marino G, Levine B. Autophagy and the integrated stress response. Mol Cell. 2010;40:280–293.
- Mowers EE, Sharifi MN, Macleod KF. Autophagy in cancer metastasis. Oncogene. 2017;36:1619–1630.
- Deretic V, Saitoh T, Akira S. Autophagy in infection, inflammation and immunity. Nat Rev Immunol. 2013;13:722–737.
- Qiang L, Sample A, Shea CR, et al. Autophagy gene Atg7 regulates ultraviolet radiation-induced inflammation and skin tumorigenesis. Autophagy. 2017;13:2086–2103.
- Choi AM, Ryter SW, Levine B. Autophagy in human health and disease. N Engl J Med. 2013;368:1845–1846.
- White E. Deconvoluting the context-dependent role for autophagy in cancer. Nat Rev Cancer. 2012;12:401–410.
- Galluzzi L, Pietrocola F, Bravo-San Pedro JM, et al. Autophagy in malignant transformation and cancer progression. Embo J. 2015;34:856–880.
- Leidal AM, Levine B, Debnath J. Autophagy and the cell biology of age-related disease. Nat Cell Biol. 2018;20:1338–1348.
- Eming SA, Martin P, Tomic-Canic M. Wound repair and regeneration: mechanisms, signaling, and translation. Sci Transl Med. 2014;6:265sr266.
- Reed BR, Clark RA. Cutaneous tissue repair: practical implications of current knowledge. II. J Am Acad Dermatol. 1985;13:919–941.
- Brem H, Tomic-Canic M. Cellular and molecular basis of wound healing in diabetes. J Clin Invest. 2007;117:1219–1222.
- Gould L, Abadir P, Brem H, et al. Chronic wound repair and healing in older adults: current status and future research. Wound Repair Regen. 2015;23:1–13.
- Werner S, Grose R. Regulation of wound healing by growth factors and cytokines. Physiol Rev. 2003;83:835–870.
- Barrientos S, Stojadinovic O, Golinko MS, et al. Growth factors and cytokines in wound healing. Wound Repair Regen. 2008;16:585–601.
- Rossiter H, Konig U, Barresi C, et al. Epidermal keratinocytes form a functional skin barrier in the absence of Atg7 dependent autophagy. J Dermatol Sci. 2013;71:67–75.
- Werner S, Krieg T, Smola H. Keratinocyte-fibroblast interactions in wound healing. J Invest Dermatol. 2007;127:998–1008.
- Darby IA, Laverdet B, Bonte F, et al. Fibroblasts and myofibroblasts in wound healing. Clin Cosmet Investig Dermatol. 2014;7:301–311.
- Koh TJ, DiPietro LA. Inflammation and wound healing: the role of the macrophage. Expert Rev Mol Med. 2011;13:e23.
- Eming SA, Krieg T, Davidson JM. Inflammation in wound repair: molecular and cellular mechanisms. J Invest Dermatol. 2007;127:514–525.
- Wilgus TA, Roy S, McDaniel JC. Neutrophils and wound repair: positive actions and negative reactions. Adv Wound Care (New Rochelle). 2013;2:379–388.
- Deshmane SL, Kremlev S, Amini S, et al. Monocyte chemoattractant protein-1 (MCP-1): an overview. J Interferon Cytokine Res. 2009;29:313–326.
- Low QE, Drugea IA, Duffner LA, et al. Wound healing in MIP-1alpha(-/-) and MCP-1(-/-) mice. Am J Pathol. 2001;159:457–463.
- Darby IA, Hewitson TD. Fibroblast differentiation in wound healing and fibrosis. Int Rev Cytol. 2007;257:143–179.
- Takaya K, Koya D, Isono M, et al. Involvement of ERK pathway in albumin-induced MCP-1 expression in mouse proximal tubular cells. Am J Physiol Renal Physiol. 2003;284:F1037–1045.
- Pastore S, Mascia F, Mariotti F, et al. ERK1/2 regulates epidermal chemokine expression and skin inflammation. J Immunol. 2005;174:5047–5056.
- Mihaylova MM, Shaw RJ. The AMPK signalling pathway coordinates cell growth, autophagy and metabolism. Nat Cell Biol. 2011;13:1016–1023.
- Herzig S, Shaw RJ. AMPK: guardian of metabolism and mitochondrial homeostasis. Nat Rev Mol Cell Biol. 2018;19:121–135.
- Shen CH, Yuan P, Perez-Lorenzo R, et al. Phosphorylation of BRAF by AMPK impairs BRAF-KSR1 association and cell proliferation. Mol Cell. 2013;52:161–172.
- Mair W, Morantte I, Rodrigues AP, et al. Lifespan extension induced by AMPK and calcineurin is mediated by CRTC-1 and CREB. Nature. 2011;470:404–408.
- Qiang L, Zhao B, Shah P, et al. Autophagy positively regulates DNA damage recognition by nucleotide excision repair. Autophagy. 2016;12:357–368.
- Qiang L, Zhao BZ, Ming M, et al. Regulation of cell proliferation and migration by p62 through stabilization of Twist1. Proc Natl Acad Sci U S A. 2014;111:9241–9246.
- Wood S, Jayaraman V, Huelsmann EJ, et al. Pro-inflammatory chemokine CCL2 (MCP-1) promotes healing in diabetic wounds by restoring the macrophage response. PLoS One. 2014;9:e91574.
- Nakamura K, Williams IR, Kupper TS. Keratinocyte-derived monocyte chemoattractant protein 1 (MCP-1): analysis in a transgenic model demonstrates MCP-1 can recruit dendritic and Langerhans cells to skin. J Invest Dermatol. 1995;105:635–643.
- Liu X, Fang S, Liu H, et al. Role of human pulmonary fibroblast-derived MCP-1 in cell activation and migration in experimental silicosis. Toxicol Appl Pharmacol. 2015;288:152–160.
- Liu X, Das AM, Seideman J, et al. The CC chemokine ligand 2 (CCL2) mediates fibroblast survival through IL-6. Am J Respir Cell Mol Biol. 2007;37:121–128.
- Zhang J, Zhang C, Jiang X, et al. Involvement of autophagy in hypoxia-BNIP3 signaling to promote epidermal keratinocyte migration. Cell Death Dis. 2019;10:234.
- Martinez-Lopez N, Athonvarangkul D, Mishall P, et al. Autophagy proteins regulate ERK phosphorylation. Nat Commun. 2013;4:2799.
- Guo Y, Lin C, Xu P, et al. AGEs induced autophagy impairs cutaneous wound healing via stimulating macrophage polarization to M1 in diabetes. Sci Rep. 2016;6:36416.
- Gillitzer R, Wolff K, Tong D, et al. MCP-1 mRNA expression in basal keratinocytes of psoriatic lesions. J Invest Dermatol. 1993;101:127–131.
- Koenig U, Robenek H, Barresi C, et al. Cell death induced autophagy contributes to terminal differentiation of skin and skin appendages. Autophagy. 2020;16:932–945.
- Akinduro O, Sully K, Patel A, et al. Constitutive autophagy and nucleophagy during epidermal differentiation. J Invest Dermatol. 2016;136:1460–1470.
- Yoshihara N, Ueno T, Takagi A, et al. The significant role of autophagy in the granular layer in normal skin differentiation and hair growth. Arch Dermatol Res. 2015;307:159–169.
- Komatsu M, Waguri S, Ueno T, et al. Impairment of starvation-induced and constitutive autophagy in Atg7-deficient mice. J Cell Biol. 2005;169:425–434.
- Hara T, Nakamura K, Matsui M, et al. Suppression of basal autophagy in neural cells causes neurodegenerative disease in mice. Nature. 2006;441:885–889.
- Qiang L, Sample A, Liu H, et al. Epidermal SIRT1 regulates inflammation, cell migration, and wound healing. Sci Rep. 2017;7:14110.
- Yang S, Wei J, Cui YH, et al. m6A mRNA demethylase FTO regulates melanoma tumorigenicity and response to anti-PD-1 blockade. Nat Commun. 2019;10:2782.
- Yang S, Qiang L, Sample A, et al. NF-kappaB signaling activation induced by chloroquine requires autophagosome, p62 protein, and c-Jun N-terminal kinase (JNK) signaling and promotes tumor cell resistance. J Biol Chem. 2017;292:3379–3388.
- Ming M, Shea CR, Guo X, et al. Regulation of global genome nucleotide excision repair by SIRT1 through xeroderma pigmentosum C. Proc Natl Acad Sci U S A. 2010;107:22623–22628.