
ABSTRACT
Accumulation of toxic protein assemblies and damaged mitochondria are key features of neurodegenerative diseases, which arise in large part from clearance defects in the Macroautophagy/autophagy-lysosome system. The autophagy cargo receptor SQSTM1/p62 plays a major role in the clearance of ubiquitinated cargo through Ser403 phosphorylation by multiple kinases. However, no phosphatase is known to physiologically dephosphorylate SQSTM1 on this activating residue. RNAi-mediated knockdown and overexpression experiments using genetically encoded fluorescent reporters and defined mutant constructs in cell lines, primary neurons, and brains show that SSH1, the canonical CFL (cofilin) phosphatase, mediates the dephosphorylation of phospho-Ser403-SQSTM1, thereby impairing SQSTM1 flux and phospho-MAPT/tau clearance. The inhibitory action of SSH1 on SQSTM1 is fully dependent on SQSTM1 Ser403 phosphorylation status and is separable from SSH1-mediated CFL activation. These findings reveal a unique action of SSH1 on SQSTM1 independent of CFL and implicate an inhibitory role of SSH1 in SQSTM1-mediated clearance of autophagic cargo, including phospho-MAPT/tau.
Abbreviations: AAV: adeno-associated virus; Aβ42O: amyloid β1-42 oligomers; AD: Alzheimer disease; CA3: cornu Ammonis 3; CSNK2/CK2: casein kinase 2; FCCP: 2-[2-[4-(trifluoromethoxy)phenyl]hydrazinylidene]-propanedinitrile; FTLD: frontotemporal lobar degeneration; GFP: green fluorescent protein; MAP1LC3/LC3: microtubule associated protein 1 light chain 3; SQSTM1/p62: sequestosome-1; PLA: proximity ligation assay; RFP: red fluorescent protein; RIPA: radioimmunoprecipitation assay; shRNA: short hairpin RNA; siRNA: small interfering RNA; Ser403: Serine403; SSH1: slingshot protein phosphatase 1; TBK1: TANK-binding kinase 1; ULK: unc-51 like kinase 1
GRAPHICAL ABSTRACT
Introduction
Accumulation of toxic protein assemblies and dysfunctional mitochondria are associated with synaptic and neuronal loss in multiple neurodegenerative disorders. Such accumulations are thought to arise in large part from clearance deficits in the autophagy-lysosome system [Citation1–7]. Selective autophagy is a major type of autophagy characterized by the recognition and degradation of specific cargo, such as damaged organelles, misfolded proteins, or invading pathogens [Citation8–14]. Mitophagy is a form of selective autophagy that specifically removes damaged mitochondria from cells, which is vital to mitochondrial quality control and cellular health [Citation15–17].
SQSTM1/p62, hereafter referred to as SQSTM1, is a major selective autophagy cargo receptor that recognizes polyubiquitin conjugates on cellular organelles (i.e. mitochondria) and misfolded proteins to target them for autophagic clearance through its interaction with MAP1LC3/LC3, hereafter referred to as LC3 [Citation18]. The activity of SQSTM1 is positively regulated by phosphorylation on Ser403 within the UBA domain, which serves to activate SQSTM1 and increase its affinity for polyubiquitin chains, thereby enhancing its ability to recognize misfolded proteins and dysfunctional mitochondria ubiquitin-tagged for clearance [Citation18–20]. While kinases TBK1 (TANK-binding kinase 1), ULK (unc-51 like kinase 1), and CSNK2/CK2 (casein kinase 2) are known to phosphorylate SQSTM1 on Ser403 [Citation18,Citation19,Citation21–23], no phosphatase is known to physiologically dephosphorylate SQSTM1 on this activating residue. It has been reported that Ser403 phosphorylated SQSTM1 is significantly reduced in brains of Alzheimer disease (AD) patients [Citation2], suggesting a failure of SQSTM1 to clear substrates as part of the disease mechanism. Moreover, ARRB2/β-arrestin2 oligomers were reported to suppress SQSTM1-mediated autophagy and promote tauopathy in frontotemporal lobar degeneration (FTLD-MAPT/tau) [Citation24], and multiple ALS-FTLD-linked mutations in TBK1 or SQSTM1 were also shown to reduce SQSTM1 phosphorylation on Ser403 and nearby Ser407 [Citation25], implicating reduced SQSTM1 activity in the pathogenesis of AD, FTLD, and ALS.
Multiple studies have implicated the involvement of the F-actin-severing protein CFL (cofilin) in amyloid β (Aβ)-induced dendritic spine shrinkage [Citation26,Citation27], accumulation of CFL-actin aggregates/rods in AD brains [Citation28,Citation29], and increased CFL activity in brains of AD patients [Citation27,Citation30] and AD mouse models [Citation31]. Specifically, Aβ42 oligomers (Aβ42O) rapidly induce the activation/dephosphorylation of CFL [Citation30–33], resulting in depletion of F-actin-associated synaptic proteins and translocation of CFL to mitochondria [Citation31]. Interestingly, experimental reduction of SSH1 (slingshot protein phosphatase 1), a major CFL phosphatase [Citation34], mitigates CFL activation and prevents Aβ42O-induced mitochondrial CFL translocation and toxicity [Citation31]. In this study, we report the identification of SSH1 as the first phosphatase that dephosphorylates SQSTM1 on p-Ser403, resulting in significant physiological and pathological consequences. This function of SSH1 on SQSTM1, which is modular and separable from its activity on CFL, impairs SQSTM1-mediated selective autophagy, thereby impeding the clearance of damaged mitochondria and phospho-MAPT/tau.
Results
SSH1 impairs LC3 recruitment to mitochondria and impedes mitophagy
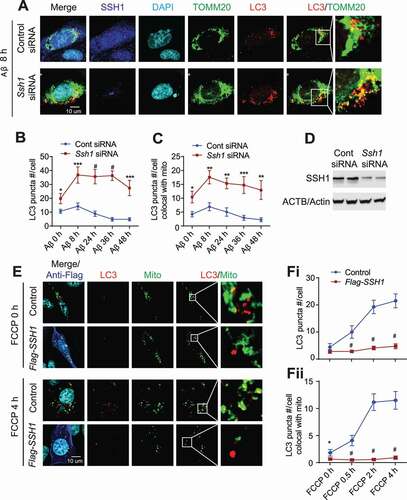
We previously showed that SSH1 reduction prevents Aβ42 oligomer (Aβ42O)-induced translocation of CFL to mitochondria, mitochondrial dysfunction, and toxicity [Citation31,Citation35,Citation36]. As damaged mitochondria are targeted for clearance by mitophagy, we looked for evidence of mitophagy in hippocampus derived HT22 neuroblastoma cells treated with Aβ42O. LC3 is a central protein in autophagy where it functions in autophagosome biogenesis and hence is used as an autophagosome marker [Citation37]. Aβ42O was prepared as previously reported [Citation31,Citation38]. Aβ42O treatment (1 μM) weakly increased the number of endogenous LC3 puncta and their association with mitochondria (TOMM20) at 8 h (), indicative of mild mitophagy induction. However, both LC3 puncta and their association with mitochondria gradually subsided below control levels after 24–48 h (). In contrast, RNAi-mediated knockdown of SSH1 increased the number of endogenous LC3 puncta and their association with mitochondria at steady state, both of which were further increased at 8 h and remained highly elevated for up to 48 h post Aβ42O treatment (). Knockdown of SSH1 by siRNA was confirmed by immunocytochemical staining for SSH1 () and western blotting (). To confirm this finding in a different way, we transfected HT22 cells with vector control or SSH1-Flag and depolarized mitochondria with the mitochondrial uncoupler FCCP for up to 4 h. As expected, FCCP treatment increased the number of endogenous LC3 puncta (,Fi), indicative of autophagosome formation. This was proportionately reflected in increased LC3 puncta colocalized with mitochondria (,Fii). SSH1 overexpression reduced the number of endogenous LC3 puncta at steady state and dramatically suppressed FCCP-induced increase in LC3 puncta (,Fi), which was also reflected in proportionately decreased endogenous LC3 puncta associated with mitochondria (,Fii). Similar results were obtained when co-transfected with RFP-LC3 to directly visualize RFP-LC3 puncta (Fig. S1A,B). As the reduction of LC3 recuitment to mitochondria is expected to impair mitochondrial clearance, we assessed mitophagy using the mito-QC mitophagy flux reporter, in which the pH-sensitive mCherry-GFP protein is fused to FIS1 mito-targeting sequence [Citation39]. Under steady-state conditions, the mitochondrial network fluoresces both red and green; however, upon mitophagy, mitochondria are delivered to lysosomes where mCherry fluorescence remains stable, but GFP fluorescence is quenched by the acidic environment. Hence acidified mCherry-only puncta represent mitochondria that are associated with lysosomes. Indeed, we confirmed that SSH1 overexpression significantly reduces mCherry-only mitochondria (Fig. S1C,D), whereas Ssh1 siRNA significantly increases mCherry-only mitochondria (Fig. S1E,F).
Figure 1. SSH1 impairs LC3 recruitment to mitochondria and impedes mitophagy flux. (A) Representative images from the 8 h Aβ42 oligomer treatment condition with white insets magnified. HT22 cells transfected with control siRNA or Ssh1 siRNA, treated with Aβ42 oligomers (1 μM) for 48 h, 36 h, 24 h, 8 h, or 0 h (DMSO), and subjected to staining for SSH1 (dark blue), LC3 (red), TOMM20 (green), and DAPI (light blue). (B and C) Quantitative graphs of figure A expressed as means ± SEM, 2-way ANOVA: (B) group F(1, 109) = 96.65, df = 1, P < 0.0001; (C) group F(1, 109) = 59.54, df = 1, P < 0.0001, followed by Sidak’s posthoc test, n ≥ 10/condition from 3 different experiments, *p < 0.05, **p < 0.005, ***p < 0.0005, #p < 0.0001. (D) Representative blots showing knockdown of SSH1 by siRNA. (E) Representative images from the 4 h FCCP treatment condition with white insets magnified. HT22 cells transfected with vector control (p3xFlag) or Flag-SSH1, treated with 5 μM FCCP for 4 h, 2 h, 0.5 h, or 0 h (DMSO). Cells were incubated with MitoTracker FarRed (pseudo-colored to green) before fixation and stained for Flag (green, pseudo-colored to blue) and LC3 (red). (F) Quantitative graph of figure E expressed as means ± SEM, 2-way ANOVA: (Fi) group F(1, 118) = 75.73, df = 1, P < 0.0001; (Fii) group F(1, 118) = 101.8, df = 1, P < 0.0001, followed by Sidak’s posthoc test, n ≥ 10/condition from 3 different experiments, *p < 0.05, #p < 0.0001
SSH1 suppresses LC3-II biogenesis but does not alter LC3 flux
LC3-II is the active lipid modified form of LC3 involved in autophagosome membrane expansion and fusion [Citation40,Citation41]. As SSH1 overexpression significantly reduced the number of LC3 puncta, we tested if SSH1 alters LC3-II levels. SSH1 overexpression significantly reduced LC3-II at steady state (Fig. S2A,B). FCCP treatment for 4 h increased LC3-II levels as expected, and SSH1 overexpression also significantly suppressed FCCP-induced LC3-II generation (Fig. S2A,C). Conversely, SSH1 knockdown by siRNA increased LC3-II both at steady state and after FCCP treatment (Fig. S2D-F). The changes in LC3-II by SSH1 may be due to altered biogenesis or clearance by the lysosome. To determine if the reduction in LC3-II by SSH1 is due to accelerated lysosomal clearance, we treated HT22 cells with FCCP (4 h) or rapamycin (16 h) with or without the lysosome inhibitor bafilomycin A1 (final 4 h). FCCP markedly increased LC3-II after 4 h but did not further increase with bafilomycin co-treatment, suggesting that FCCP-induced LC3-II generation is far greater than its turnover during this time period (). SSH1 transfection significantly reduced FCCP-induced LC3-II both in the presence and absence of bafilomycin A1 (). Rapamycin treatment over 16 h did not show a substantial increase in LC3-II; however, co-treatment of rapamycin with bafilomycin during the final 4 h treatment dramatically increased LC3-II in control transfected cells (), indicating rapamycin-induced LC3-II flux and clearance by the lysosome. This bafilomycin-induced accumulation of LC3-II was significantly blunted in SSH1 transfected cells (). SSH1 overexpression also significantly reduced LC3-II levels upon bafilomycin treatment alone (Fig. S2G,J). Hence, these results suggest that SSH1 suppresses LC3-II biogenesis at a step prior to fusion of LC3+ autophagosomes with lysosomes.
Figure 2. SSH1 suppresses LC3-II biogenesis but does not alter LC3 flux. (A) Representative blots from HT22 cells transfected with vector control or Flag-SSH1, treated ± 5 μM FCCP ± 200 nM bafilomycin A1 for 4 h, and subjected to western blotting for LC3, SSH1, and ACTB/actin. (B) Quantitative graph of figure A expressed as means ± SEM, 2-way ANOVA, group F(1, 24) = 68.35, df = 1, P < 0.0001, followed by Sidak’s posthoc test, n = 4/condition, *p < 0.05, #p < 0.0001. (C) Representative blots from HT22 cells transfected with vector control or Flag-SSH1, treated ± 200 nM rapamycin for 16 h ± 200 nM bafilomycin A1 for 4 h, and subjected to western blotting for LC3, SSH1, and ACTB/actin. (D) Quantitative graph of figure C expressed as mean ± SEM, two-way ANOVA, group F(1, 24) = 48.13, df = 1, P < 0.0001, followed by Sidak’s posthoc test, n = 4/condition, *p < 0.05, #p < 0.0001. (E) Representative images at 4 h FCCP condition with white insets magnified. HT22 cells co-transfected with mCherry-GFP-LC3 and vector control (p3xFlag) or Flag-SSH1, treated with 5 μM FCCP for 4 h, 2 h, 0.5 h, or 0 h (DMSO), and subjected to staining for Flag-M2 (light blue) and direct fluorescence imaging (mCherry: red, GFP: green). (F–H) Quantitative graphs of figure E expressed as means ± SEM, 2-way ANOVA: (F) group F(1, 91) = 51.64, df = 1, P < 0.0001; (G) group F(1, 91) = 44.65, df = 1, P < 0.0001; (H) group F(1, 91) = 2.190, df = 1, P = 0.1424, followed by Sidak’s posthoc test, n ≥ 10/condition from 3 different experiments, *p < 0.05, **p < 0.005, #p < 0.0001. (I) Representative images at 4 h FCCP condition with white insets magnified. HT22 cells co-transfected with mCherry-GFP-LC3 and control shRNA or Ssh1-shRNA, treated with 5 μM FCCP for 4 h, 2 h, 0.5 h, or 0 h (DMSO), and subjected to staining for SSH1 (blue), DAPI (light blue) and direct fluorescence imaging (mCherry: red, GFP: green). (J–L) Quantitative graphs of figure I expressed as means ± SEM, 2-way ANOVA: (J) group F(1, 88) = 35.09, df = 1, P < 0.0001; (K) group F(1, 88) = 35.12, df = 1, P < 0.0001; (L) group F(1, 88) = 2.464, df = 1, P = 0.1201, followed by Sidak’s posthoc test, n ≥ 10/condition from 3 different experiments, *p < 0.05, **p < 0.005
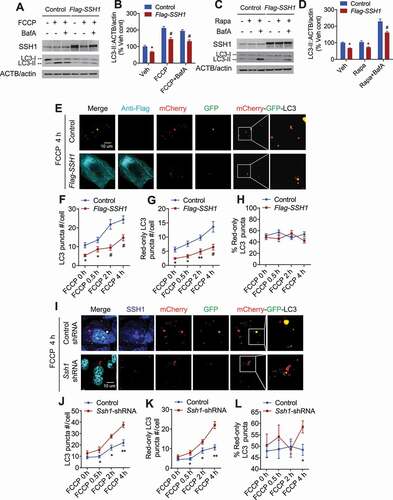
To assess the effects of SSH1 on LC3 in a dynamic way, we used the mCherry-GFP-LC3 flux reporter construct, which measures both total LC3 puncta and the rate of conversion of total LC3+ puncta (autophagasomes) to mCherry-only LC3+ puncta (autolysosomes & lysosomes). This reporter takes advantage of GFP’s sensitivity to low pH (quenching), mCherry’s insensitivity to low pH, and LC3, which allows for the tracking of LC3 to lysosomes [Citation42–44]. Therefore, perfectly colocalized red and green puncta (yellow) are indicative of non-lysosomal LC3. However, upon fusion with lysosomes (autolysosomes), red puncta persist while green puncta disappear (red-only). HT22 cells were co-transfected with mCherry-GFP-LC3 with vector control or SSH1-Flag and treated with or without FCCP for up to 4 h. As expected, FCCP increased the total number of LC3 puncta () and red-only puncta () in a time-dependent manner in control vector transfected cells. SSH1 overexpression significantly reduced the total number of LC3 puncta () and red-only LC3 puncta (). However, the percentage of red-only puncta was not significantly altered by SSH1 overexpression (), indicating that SSH1 overexpression does not directly inhibit the rate of LC3+ autophagosome conversion to LC3+ autolysosomes (i.e. LC3 flux). Bafilomycin A1 treatment similarly increased the total number of LC3 puncta in control and SSH1 transfected cells (Fig. S2K,L), confirming that SSH1 overexpression does not alter lysosomal LC3 clearance. Converse experiments with Ssh1 siRNA showed that the loss of SSH1 similarly increases both total LC3 puncta and red-only LC3 puncta from 0 to 2 h of FCCP treatment (), thereby enhancing LC3 biogenesis but not significantly altering lysosomal LC3 flux during this period. After 4 h FCCP, however, we observed a significant increase in the percentage of red-only LC3 puncta (), indicating that the loss of SSH1 can promote LC3 flux after prolonged FCCP exposure. Transfection of mCherry-GFP displayed diffuse nuclear and cytoplasmic fluorescence without observable puncta (Fig. S2M), unlike those seen with mCherry-GFP-LC3.
SSH1-mediated inhibition of SQSTM1 flux underlies LC3 suppression
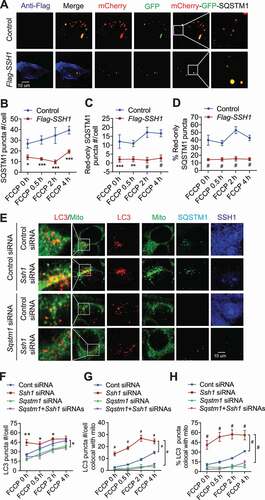
The observation that SSH1 significantly inhibits LC3-II generation and LC3 puncta formation while having little to no effects on LC3 flux led us to hypothesize that such SSH1-mediated effects originate upstream of LC3. The autophagosome protein LC3 binds to autophagy cargo receptors, such as SQSTM1 and OPTN (optineurin). These cargo receptors recognize polyubiquitinated cargo via the ubiquitin-binding domain and recruit LC3 through the LIR domain [Citation18]. Interestingly, a recent study showed that the cargo-bound SQSTM1 also acts as an autophagy inducer, enhancing the synthesis of LC3 and its conversion to LC3-II to promote autophagosome formation [Citation45]. Hence, we initially co-transfected HT22 cells with GFP-Sqstm1 or GFP-OPTN with vector control or SSH1-Flag. Neither total GFP-OPTN puncta number nor its recruitment to TOMM20+ mitochondria was altered by SSH1 transfection at steady state or after FCCP treatment (Fig. S3A-C). However, SSH1 overexpression significantly reduced the total number of GFP-SQSTM1 puncta and decreased GFP-SQSTM1 recruited to TOMM20+ mitochondria at steady state and after FCCP (Fig. S3D-F). To investigate SSH1-induced changes in SQSTM1 further, we assessed SQSTM1 flux using the mCherry-GFP-SQSTM1 reporter [Citation44,Citation46,Citation47], which allows tracking of SQSTM1 puncta flux according to the same principle as mCherry-GFP-LC3. In vector control transfected HT22 cells, FCCP treatment generally increased total SQSTM1 puncta and red-only acidified SQSTM1 puncta (). However, SSH1 significantly reduced total SQSTM1 puncta and even more robustly reduced red-only SQSTM1 puncta even with FCCP treatment (). Hence, SSH1 significantly reduced the percentage of red-only SQSTM1 puncta compared to vector control (), indicating that SSH1 impedes SQSTM1 flux. Ssh1 siRNA transfection, in contrast, significantly increased the number of SQSTM1 puncta and those that were recruited to TOMM20+ mitochondria in the absence and presence of FCCP (Fig. S3G-I), indicating that endogenous SSH1 normally inhibits SQSTM1 function. To determine if SQSTM1 is required for the effects of SSH1 on LC3, we co-transfected control or Sqstm1 siRNA together with control or Ssh1 siRNA (Fig. S3J). As expected, Sqstm1 siRNA greatly reduced the number of endogenous LC3 puncta () and their recruitment to mitochondria (), while Ssh1 siRNA dramatically increased total LC3 puncta () and their recruitment to mitochondria (). However, Ssh1 siRNA failed to increase LC3 puncta or recruitment to mitochondria when SQSTM1 was knocked down (), indicating that the inhibitory effects of SSH1 on LC3 require endogenous SQSTM1.
Figure 3. SSH1-mediated inhibition of SQSTM1 underlies LC3 suppression. (A) Representative images at 4 h FCCP condition with white insets magnified. HT22 cells co-transfected with mCherry-GFP-Sqstm1 and control (p3xFlag) or Flag-SSH1, treated with 5 μM FCCP for 4 h, 2 h, 0.5 h, or 0 h (DMSO), and subjected to staining for Flag-M2 (dark blue) or direct imaging (mCherry: red, GFP: green). (B-D) Quantitative graphs of figure A expressed as means ± SEM, 2-way ANOVA: (B) group F(1, 86) = 61.16, df = 1, P < 0.0001; (C) group F(1, 86) = 71.52, df = 1, P < 0.0001; (D) group F(1, 86) = 104.6, df = 1, P < 0.0001, followed by Sidak’s posthoc test, n ≥ 10/condition from 3 different experiments, *p < 0.05, **p < 0.005, ***p < 0.0005, #p < 0.0001. (E) Representative images at 4 h FCCP condition with white insets magnified. HT22 cells transfected with control siRNA, Ssh1 siRNA, Sqstm1 siRNA or both Ssh1 and Sqstm1 siRNA, treated with 5 μM FCCP for 4 h, 2 h, 0.5 h, or 1 h (DMSO), incubated with MitoTracker-Green for 45 min before fixation, and subjected to staining for LC3 (red), SQSTM1 (light blue), and SSH1 (dark blue) or direct imaging (LC3: red). (F-H) Quantitative graphs of figure E expressed as means ± SEM, 2-way ANOVA: (F) group F(3, 251) = 23.63, df = 3, P < 0.0001; (G) group F(3, 251) = 207.8, df = 3, P < 0.0001; (H) group F(3, 251) = 115.6, df = 3, P < 0.0001, followed by Sidak’s posthoc test, n ≥ 15/condition from 3 different experiments, *p < 0.05, **p < 0.005, #p < 0.0001
SSH1 decreases SQSTM1 Ser403 phosphorylation and inhibits SQSTM1-ubiquitin binding
The activity of SQSTM1 is positively regulated by its phosphorylation on Ser403 within the C-terminal ubiquitin-associated (UBA) domain by TBK1, ULK, or CSNK2/CK2 [Citation18,Citation19,Citation21–23]. This phosphorylation is known to activate SQSTM1 and increase SQSTM1 affinity for polyubiquitin chains, thereby enhancing its ability to recognize misfolded proteins or dysfunctional mitochondria tagged for clearance [Citation20]. Importantly, the ratio of soluble Ser403-phosphorylated SQSTM1 (p-S403-SQSTM1) to total SQSTM1 is significantly reduced in brains of AD patients [Citation2]. As SSH1 is a phosphatase, we hypothesized that the inhibitory action of SSH1 on SQSTM1 might be associated with SQSTM1 dephosphorylation on Ser403. Overexpression of SSH1-Flag in HT22 cells resulted in significantly reduced endogenous p-S403-SQSTM1 without altering total SQSTM1 (). Conversely, Ssh1 siRNA significantly increased endogenous p-S403-SQSTM1 without altering total SQSTM1 ().
Figure 4. SSH1 decreases SQSTM1 Ser403 phosphorylation and inhibits SQSTM1-ubiquitin binding. (A) Representative blots of p-S403-SQSTM1 from HT22 cells transfected with vector control (p3xFlag) or Flag-SSH1. (B) Quantitative graph of figure A expressed as means ± SEM, 2-tailed t-test, P = 0.0421, n = 4/condition, *p < 0.05. (C) Representative blots of p-S403-SQSTM1 from HT22 cells transfected with control siRNA or Ssh1-siRNA. (D) Quantitative graph of figure C expressed as means ± SEM, 2-tailed t-test, P = 0.0115, n = 4/condition *p < 0.05. (E) Representative blots showing co-immunoprecipitation of HA-ubiquitin and GFP-SQSTM1 in HT22 cells co-transfected with HA-ubiquitin, GFP-Sqsrm1 and control (p3xFlag) or Flag-SSH1. Figure Eiii shows quantitative graph of figure Ei (SQSTM1-ubiqutin co-IP) expressed as means ± SEM, 2-tailed t-test, *P = 0.0144, n = 4/condition. (F) Representative images at 4 h FCCP condition with white insets magnified. HT22 cells co-transfected with GFP-Sqstm1 and vector control (p3xFlag) or Flag-SSH1, treated with 5 μM FCCP for 4 h, 0.5 h, or 0 h (DMSO), and subjected to staining for Flag-M2 (light blue), and ubiquitin (red) and direct fluorescence imaging (green: GFP). (G-I) Quantitative graphs of figure F expressed as means ± SEM, 2-way ANOVA: (G) group F(1, 124) = 116.2, df = 1, P < 0.0001; (H) group F(1, 124) = 741.3, df = 1, P < 0.0001; (I) group F(1, 124) = 484.6, df = 1, P < 0.0001, followed by Sidak’s posthoc test, n ≥ 20/condition from 3 different experiments, *p < 0.05, #p < 0.0001. (J) Representative images at 4 h FCCP condition with white insets magnified. HT22 cells co-transfected with GFP-Sqstm1 and Ssh1-shRNA, treated with 5 μM FCCP for 4 h, 0.5 h, or 0 h (DMSO), and subjected to staining for SSH1 (light blue), and ubiquitin (red) and direct fluorescence imaging (green: GFP). (K–M) Quantitative graphs of figure J expressed as means ± SEM, 2-way ANOVA: (K) group F(1, 84) = 53.79, df = 1, P < 0.0001; (L) group F(1, 84) = 65.44, df = 1, P < 0.0001; (M) group F(1, 84) = 3.878, df = 1, P = 0.0502, followed by Sidak’s posthoc test, n ≥ 14/condition from 3 different experiments, *p < 0.05, **p < 0.005, #p < 0.0001. (N) Representative images with white insets magnified. HT22 cells transfected with control (GFP) or GFP-SSH1 and subjected to in situ PLA for SQSTM1-ubiqutin complexes (red) or direct imaging (GFP: green). (O) Representative images with white insets magnified. HT22 cells transfected with control (GFP) or GFP-Ssh1-shRNA and subjected to in situ PLA for SQSTM1-ubiqutin complexes (red) or direct imaging (GFP: green). (P and Q) Quantitative graphs of figure N expressed as means ± SEM, 2-tailed t-tests (P) P < 0.0001; (Q) P < 0.0001, n ≥ 18/condition from 3 different experiments, #p < 0.0001
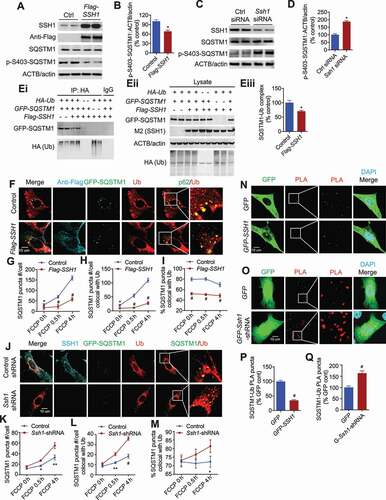
To determine if SSH1-mediated reduction in p-S403-SQSTM1 alters SQSTM1 binding to ubiquitin, we assessed SQSTM1-ubiquitin complexes in 3 ways. First, we co-transfected HT22 cells with HA-ubiquitin, GFP-Sqstm1, and/or SSH1-Flag, and performed co-immunoprecipitation (co-IP) experiments to assess SQSTM1-ubiquitin complexes. Co-IP studies confirmed that SSH1 transfected cells contain significantly reduced GFP-SQSTM1 in HA-ubiquitin immune complexes (,Eiii), despite equivalent levels of HA-ubiquitin, GFP-SQSTM1, and SSH1-Flag expression (,Eii). Second, we detected the colocalization of ubiquitin with SQSTM1 puncta by immunocytochemistry (ICC) from HT22 cells co-transfected with GFP-Sqstm1 with/without SSH1-Flag. We found significantly reduced numbers of GFP-SQSTM1 puncta (), number of GFP-SQSTM1 puncta colocalized with ubiquitin (), and percentage of GFP-SQSTM1 puncta colocalized with ubiquitin () in SSH1-Flag transfected cells in the presence or absence of FCCP treatment. In contrast, Ssh1 shRNA transfection increased GFP-SQSTM1 puncta per cell (), GFP-SQSTM1 puncta colocalized with ubiquitin (), and percentage of GFP-SQSTM1 puncta colocalized with ubiquitin () in FCCP treated cells. Third, we detected SQSTM1-ubiqutin complexes by DuoLink in situ proximity ligation assays (PLA) (Millipore Sigma), a powerful tool that allows in situ detection of protein-protein interactions with high specificity and sensitivity. In PLA, two antibodies (raised against different species) for corresponding proteins are applied, after which a pair of oligonucleotide-labeled secondary antibodies bind to primary antibodies. If in close proximity to each other (~40 angstroms) [Citation48], connector oligos join the PLA probes and are ligated to form circular DNA that are amplified by DNA polymerase. This allows up to 1000-fold amplification, and complementary detection oligos coupled to a fluorochrome are hybridized to detect the PLA signal. Using PLA and two antibodies directed against SQSTM1 and ubiquitin, we detected endogenous SQSTM1-ubiqutin complexes, which were significantly reduced by ~70% in SSH1 transfected cells (; red PLA puncta) and increased by ~65% in Ssh1 shRNA transfected cells (). Exclusion of 1 primary or 1 secondary antibody yielded no detectable PLA signal, indicating specificity of the assay (Fig. S4). Therefore, these data collectively show that SSH1 reduces SQSTM1 phosphorylation on Ser403, which inhibits SQSTM1 binding to ubiquitinated substrates and downstream LC3 activation.
SSH1-mediated SQSTM1 inhibition requires p-Ser403 modification of SQSTM1
The C-terminal region of SQSTM1 contains the LC3-interacting LIR domain and the ubiquitin-interacting UBA domain (Fig. S5A). To determine if these regions of SQSTM1 are required for the inhibitory effects of SSH1, we co-transfected the GFP-Sqstm1ΔC (lacking both LIR and UBA domains) with vector control or SSH1-Flag. SSH1 had no significant inhibitory effect on the number of GFP-SQSTM1ΔC puncta with or without FCCP treatment (Fig. S5B,C), indicating that the C-terminal region is required for the SSH1-induced inhibition of SQSTM1. Next, we used the GFP-SQSTM1-LIR mutant, in which the LC3-binding site in the LIR domain of SQSTM1 has been mutated to prevent LC3 binding [Citation49] (Fig. S5A). In contrast to the GFP-SQSTM1ΔC mutant, SSH1 overexpression significantly reduced the number of GFP-SQSTM1-LIR puncta and number of GFP-SQSTM1-LIR puncta colocalized with TOMM20+ mitochondria (Fig. S5D-F), indicating that SQSTM1-LC3 binding per se is not required for the inhibitory effect of SSH1 on SQSTM1. The N-terminal PB1 domain is required for initial SQSTM1 self-interaction to allow the formation of SQSTM1 helical filaments arranged in a head to tail configuration [Citation50]. Because SSH1 reduced the number of SQSTM1 puncta, we assessed whether SSH1 inhibits SQSTM1 self-interaction at the molecular level. However, we found no evidence that SSH1 affects SQSTM1 self-interaction by co-IP (Fig. S5G) or PLA (Fig. S5H,I) experiments, suggesting that SSH1 does not directly alter the PB1 self-interaction domain.
To determine if the inhibitory actions of SSH1 on SQSTM1 depend on the UBA domain Ser403 phosphorylation status, we generated 2 artificial Sqstm1 constructs: GFP-Sqstm1S403A and GFP-Sqstm1S403E, the former that cannot be phosphorylated and the latter that mimics phosphorylation on Ser403 (Fig. S5A). The SQSTM1S403E mutant has been shown to increase SQSTM1 binding affinity for ubiquitin, resulting in efficient targeting of polyubiquitinated substrates in sequestosomes for autophagosome entry [Citation20]. Upon expression of these constructs in HT22 cells, we observed a significant ~65% increase in the number of GFP-SQSTM1S403E puncta compared to equivalent transfection of GFP-Sqstm1S403A at steady state (). Manders split colocalization with TOMM20+ mitochondria demonstrated an even more significant ~3-fold increase in GFP-SQSTM1S403E recruitment to mitochondria compared to GFP-SQSTM1S403A (), indicating that Ser403 “phosphorylated” SQSTM1 is indeed more active in enhancing puncta number and recruitment to mitochondria. FCCP treatment (4 h) further significantly increased the number of total GFP-SQSTM1S403E puncta and association with mitochondria compared to GFP-SQSTM1S403A (). GFP-SQSTM1S403A was completely unresponsive to FCCP in both measures (), indicating that mitochondrial depolarization recruits only Ser403-phosphorylated SQSTM1. Overexpression of SSH1-Flag had no effect on either GFP-SQSTM1S403E or GFP-SQSTM1S403A on the number of SQSTM1 puncta or their recruitment to mitochondria in the absence or presence of FCCP (). Likewise, shRNA-mediated knockdown of SSH1 had no significant effect on either GFP-SQSTM1S403E or GFP-SQSTM1S403A on the number of puncta or recruitment to mitochondria in the absence or presence of FCCP (Fig. S5J-O), collectively demonstrating that the inhibitory action of SSH1 on SQSTM1 requires SQSTM1 modification on Ser403.
Figure 5. SSH1-mediated SQSTM1 inhibition requires p-Ser403 modification of SQSTM1. (A) Representative images at 4 h FCCP condition with white insets magnified. HT22 cells co-transfected with GFP-Sqstm1S403E or GFP-Sqstm1S403A and mito-dsRed ± vector control or Flag-SSH1, treated with 5 μM FCCP for 4 h or 0 h (DMSO), and subjected to staining for Flag-M2 (dark blue) and DAPI (light blue) or direct imaging (mito-dsRed; red, GFP-SQSTM1: green). (B-D) Quantitative graphs of figure A expressed as means ± SEM, 2-way ANOVA: (B) upper graph, group F(1, 62) = 70.97, df = 1, P < 0.0001; lower graph, group F(1, 62) = 63.82, df = 1, P < 0.0001; (C) upper graph, group F(1, 60) = 0.002671, df = 1, P = 0.9590; lower graph F(1, 60) = 1.19, df = 1, P = 0.1715; (D) upper graph F(1,60) = 0.5830, df = 1, P = 0.4489; lower graph, group F(1, 60) = 0.3904, df = 1, P = 0.5350, followed by Sidak’s posthoc test, n ≥ 15/condition from 3 different experiments, **p < 0.005, ***p < 0.0005, #p < 0.0001. (E) Quantitative graphs of figure A showing the distribution of SQSTM1 puncta number across size categories, χ2 test for trend, n ≥ 15/condition from 3 different experiments, χ2 = 9.670, df = 1, P = 0.0019 (FCCP 0 h), χ2 = 10.13, df = 1, P = 0.0015 (FCCP 4 h). (F) Quantitative graphs of figure A expressed as means ± SEM in different size categories, 2-way ANOVA, group F(1, 53) = 24.82, df = 1, P < 0.0001 (>1um2), group F(1, 53) = 4.206, df = 1, P = 0.0452 (<1um2) followed by Sidak’s posthoc test, n ≥ 12/condition from 3 different experiments, *p < 0.05, **p < 0.005. (G) Representative images at 4 h FCCP condition with white insets magnified. HT22 cells co-transfected with GFP-Sqstm1-WT, mito-dsRed, and vector control (p3xFlag) or Flag-SSH1, treated with 5 μM FCCP for 4 h or 0 h (DMSO), and subjected to staining for Flag-M2 (dark blue) and DAPI (light blue) or direct imaging (GFP-SQSTM1: green, mito-dsRed: red). (H) Quantitative graphs of figure G showing the distribution of SQSTM1 puncta number across size categories, χ2 test for trend, χ2 =, n ≥ 15/condition from 3 different experiments, χ2 = 33.43, df = 1, P < 0.0001 (FCCP 0 h), χ2 = 9.467, df = 1, P = 0.0021 (FCCP 4 h). (I) Quantitative graphs of figure G expressed as mean ± SEM in different size categories, 2-way ANOVA, group F(1, 66) = 19.89, df = 1, P < 0.0001 (>1um2); group F(1, 66) = 0.7743, df = 1, P = 0.3821 (<1um2), followed by Sidak’s posthoc test, n ≥ 15/condition from 3 different experiments, *p < 0.05, ***p < 0.0005
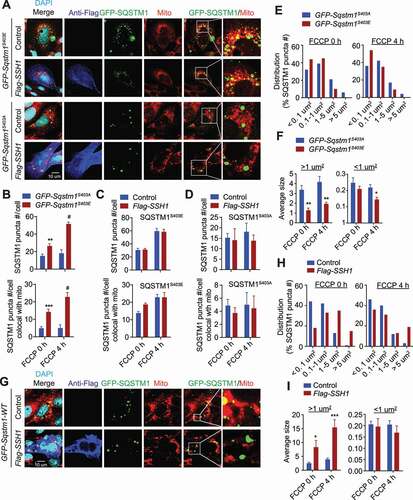
Ser403 phosphorylation of SQSTM1 has been shown to inhibit the dimerization of the UBA domain independent of the PB1 domain [Citation50]. Hence, we set out to measure the sizes of mutant GFP- SQSTM1S403A/E puncta. Due to the wide range of puncta sizes, we first assessed puncta size by 4 increasing size categories. The SQSTM1S403A mutant significantly increased the distribution of puncta to the 2 largest size categories (>5 μm2 & 1–5 μm2) compared to the SQSTM1S403E mutant (), and the average size of SQSTM1S403A puncta in these categories were significantly larger than SQSTM1S403E puncta (). We also assessed wild type GFP-SQSTM1 puncta sizes with or without SSH1-Flag transfection. Like the SQSTM1S403A mutation, SSH1 significantly increased the distribution of GFP-SQSTM1 puncta to the 2 largest size categories compared to vector control (), and SSH1 transfected cells contained significantly larger GFP-SQSTM1 puncta compared to vector control in these size categories (). As expected, SSH1 also significantly reduced the total number of GFP-SQSTM1 puncta and those colocalized with TOMM20+ mitochondria (Fig. S5P,Q). These data therefore demonstrate that SSH1-mediated reduction in p-Ser403 phosphorylation recapitulates the SQSTM1S403A mutation in all measures and suggest that loss of p-Ser403 phosphorylation decreases SQSTM1 puncta number by coalescing smaller puncta into larger puncta.
SSH1ΔN dephosphorylates p-Ser403-SQSTM1 but not p-Ser3-CFL and inhibits SQSTM1 activity
SSH1 contains an N-terminal phospho-CFL binding site (p-CFL) within the N-terminal region, followed by the catalytic domain (CAT) and a sizable C-terminal region of unknown function () [Citation51]. It has been shown that SSH1ΔC (or N461), containing the N-terminal 461 residues but lacking C-terminal residues 462–1049, is sufficient to dephosphorylate CFL on Ser3 (p-S3-CFL), whereas the C393S mutation in the catalytic site destroys SSH1 phosphatase activity [Citation51]. To determine which domains of SSH1 are required for pSer403 SQSTM1 dephosphorylation, we obtained the SSH1ΔC construct [Citation51] and generated the SSH1ΔN and SSH1ΔNC393S constructs lacking the N-terminal 307 amino acids (p-CFL binding region) but containing the catalytic domain and the C-terminal region (). As expected, overexpression of SSH1ΔC robustly reduced p-Ser3-CFL (); however, SSH1ΔC failed to alter pS403-SQSTM1 (). In contrast, neither SSH1ΔN nor SSH1ΔNC393S altered p-Ser3-CFL (), and SSH1ΔN but not SSH1ΔNC393S strongly reduced p-Ser403-SQSTM1 (). To determine if SSH1 can directly dephosphorylate p-Ser403-SQSTM1, we expressed and purified SSH1ΔC-His, SSH1ΔN-His, and SQSTM1-His produced in Sf9 insect cells. In Sf9 cells, purified recombinant SQSTM1-His contained Ser403 phosphorylation (). Co-incubation of recombinant SQSTM1-His with SSH1 variants for 0.5 h and 2 h conclusively showed that SSH1ΔN but not SSH1ΔC directly dephosphorylates p-Ser403-SQSTM1 (; Fig. S6Ai,Aii). In HEK293T cells co-transfected with GFP-Sqstm1 with/without SSH1-Flag or SSH1ΔN-Flag, both SSH1 variants similarly co-immunoprecipitated with GFP-SQSTM1, whereas little to no SSH1ΔN-Flag was present when no GFP-Sqstm1 was transfected or pulled down with IgG beads alone (Fig. S6Bi,Bii,C).
Figure 6. Direct dephosphorylation of p-Ser403-SQSTM1 by SSH1 is separable from CFL dephosphorylation. (A) Schematic of full length SSH1 and SSH1 mutants. (B) Representative blots of total SQSTM1, p-Ser403-SQSTM1 and p-Ser3-CFL from HT22 cells transfected with vector control (p3xFlag), Flag-SSH1ΔN, Flag-SSH1ΔNC393S, or CFP-SSH1ΔC. (C) Quantitative graph of figure B expressed as means ± SEM, 1-way ANOVA, F(3, 12) = 54.20, df = 3, P < 0.0001, followed by Tukey’s posthoc test, n = 4/condition, #p < 0.0001 (control vs. SSH1ΔN). (D) Representative blots from recombinant SQSTM1 purified from Sf9 inset cells incubated with recombinant SSH1 variants for the indicated times and immunoblotted for p-S403-SQSTM1, showing dephosphorylation of SQSTM1 by SSH1ΔN but not SSH1ΔC. (E) Representative images at 4 h FCCP condition with white insets magnified. HT22 cells co-transfected with GFP-Sqstm1 and vector control (p3xFlag) or Flag-SSH1ΔN, treated with 5 μM FCCP for 4 h, 2 h, 0.5 h, or 0 h (DMSO), and subjected to staining for Flag-M2 (dark blue) and TOMM20 (red) or direct imaging for GFP-SQSTM1 (green). (F and G) Quantitative graphs of figure E expressed as means ± SEM, 2-way ANOVA: (F) group F(1, 95) = 24.58, df = 1, P < 0.0001; (G) group F(1, 95) = 39.51, df = 1, P < 0.0001, followed by Sidak’s posthoc test, n ≥ 15/condition from 3 different experiments, *p < 0.05***p < 0.0005. (H) Representative images at 4 h FCCP condition with white insets magnified. HT22 cells co-transfected with GFP-Sqstm1 and vector control (p3xFlag), Flag-SSH1, or Flag-SSH1ΔC, treated with 5 μM FCCP for 4 h, 2 h, 0.5 h, or 0 h (DMSO), and subjected to staining for Flag-M2 (light blue) and TOMM20 (red) or direct imaging for GFP-SQSTM1 (green). (I and J) Quantitative graph of figure H expressed as means ± SEM, 2-way ANOVA: (I) group F(2, 187) = 30.81, df = 2, P < 0.0001; (J) group F(2, 187) = 49.31, df = 2, P < 0.0001, followed with Sidak’s posthoc test, n ≥ 20/condition from 3 different experiments, *p < 0.05, **p < 0.005, #p < 0.0001. (K) Representative images from HT22 cells transfected with vector control (p3xFlag) or Flag-SSH1ΔN, subjected to in situ PLA for SQSTM1-ubiquitin complexes (red), and staining for Flag-M2 (green) and DAPI (light blue). (L) Quantitative graph of figure K expressed as means ± SEM, 2-tailed t-test, P < 0.0001, n ≥ 20/condition from 3 different experiments, #p < 0.0001
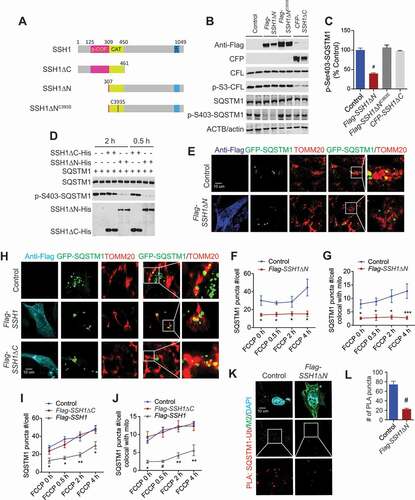
To test whether SSH1ΔN and SSH1ΔC differentially alters SQSTM1 activity, we co-transfected SSH1ΔC-Flag or SSH1ΔN-Flag with GFP-Sqstm1 in HT22 cells. SSH1ΔN significantly reduced both the number of GFP-SQSTM1 puncta and GFP-SQSTM1 puncta recruited to TOMM20+ mitochondria at steady state and after treatment with FCCP (), essentially identical to that seen with full-length SSH1. In contrast, the catalytically dead SSH1ΔNC393S mutant failed to alter GFP-SQSTM1 puncta or their association with mitochondria (Fig. S6D-F), indicating that the catalytic phosphatase activity is required for these effects. Moreover, SSH1ΔC had no significant effect on either GFP-SQSTM1 puncta number or its recruitment to mitochondria (), indicating that the sole ability of SSH1 to dephosphorylate CFL is insufficient for inhibition of SQSTM1. As expected, SSH1ΔN significantly reduced endogenous SQSTM1-ubiquitin complexes in PLA experiments (). Hence, these data collectively demonstrate the modular activity of SSH1 on SQSTM1 via dephosphorylation, which requires catalytic activity on SQSTM1 and is separable from that on CFL.
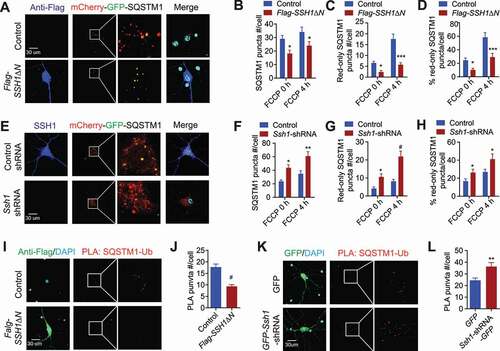
Endogenous SSH1 and SSH1ΔN impair SQSTM1 flux and ubiquitin binding in primary neurons
To confirm the effects of SSH1 on SQSTM1 in primary neurons, we generated and purified high titer (>1012 vg/mL) control and SSH1ΔN rAAV9, control and Ssh1-shRNA rAAV9, as well as mCherry-GFP-Sqstm1 rAAV9. On DIV4, we transduced wild type neurons with mCherry-GFP-Sqstm1 rAAV9 and control or SSH1ΔN rAAV9. In a different set of experiments, we also transduced neurons with mCherry-GFP-Sqstm1 rAAV9 with control or Ssh1-shRNA rAAV9. On DIV20, we quantified SQSTM1 puncta, acidified red-only SQSTM1 puncta, and percentage of acidified red-only SQSTM1 puncta with or without FCCP treatment for 4 h. Expression of SSH1ΔN significantly decreased total SQSTM1 puncta (), red-only puncta (), and percentage of red-only puncta () in both the absence and presence of FCCP. Conversely, Ssh1 shRNA significantly increased total SQSTM1 puncta (), acidified red-only SQSTM1 puncta (), and percentage of red-only SQSTM1 puncta () together with loss of SSH1 expression () in both the absence and presence of FCCP, indicating that SSH1 reduction promotes SQSTM1 flux to lysosomes in neurons. Assessment of endogenous SQSTM1-ubiquitin complexes by in situ PLA confirmed that SSH1ΔN significantly reduces the SQSTM1-ubiquitin complex (), whereas Ssh1-shRNA significantly enhances the SQSTM1-ubiquitin complex (). Western blotting from primary neuronal lysates confirmed the expression of SSH1ΔN with the expected reduction in p-Ser403-SQSTM1 (Fig. S7A), as well as efficient knockdown of endogenous SSH1 by Ssh1-shRNA with the expected increase in p-Ser403-SQSTM1 (Fig. S7B). An example of high titer rAAV9 transduction efficiency with SSH1ΔN is shown in primary neurons (Fig. S7C).
Figure 7. Endogenous SSH1 and SSH1ΔN impair SQSTM1 flux and SQSTM1-ubiquitin binding in primary neurons. (A) Representative images at 4 h FCCP condition with white insets magnified. WT primary hippocampal neurons co-transduced with rAAV9-mCherry-GFP-Sqstm1 and rAAV9-Control or Flag-SSH1ΔN, treated with 2 μM FCCP for 4 h or 0 h (DMSO) and subjected to staining for Flag-M2 (dark blue) and DAPI (light blue) or direct imaging (mCherry: red, GFP: green). (B-D) Quantitative graph of figure A expressed as means ± SEM, 2-way ANOVA: (B) group F(1, 56) = 12.71, df = 1, P = 0,0008; (C) group F(1, 56) = 35.44, df = 1, P < 0.0001; (D) group F(1, 56) = 19.58, df = 1, P < 0.0001, followed by Sidak’s posthoc test, n ≥ 15/condition from 3 different experiments, *p < 0.05, ***p < 0.0005 (control vs. SSH1ΔN). (E) Representative images at 4 h FCCP condition with white insets magnified. WT primary hippocampal neurons co-transduced with rAAV9-mCherry-GFP-Sqstm1 and rAAV9-control shRNA or Ssh1-shRNA, treated with 2 μM FCCP for 4 h or 0 h (DMSO) and subjected to staining for SSH1 (dark blue) and DAPI (light blue) or direct imaging (mCherry: red, GFP: green). (F–H) Quantitative graphs of figure E expressed as means ± SEM, 2-way ANOVA: (F) group F(1, 44) = 26.20, df = 1, P < 0.0001; (G) group F(1, 44) = 32.77, df = 1, P < 0.0001; (H) group F(1, 44) = 5.638, df = 1, P = 0.0220, followed by Sidak’s posthoc test, n ≥ 15/condition from 3 different experiments, *p < 0.05, **p < 0.005, #p < 0.0001 (control-shRNA vs. SSH1-shRNA). (I) Representative images with white insets magnified. WT primary hippocampal neurons transduced with rAAV9-Flag-control or Flag-SSH1ΔN and subjected to in situ PLA for SQSTM1-ubiqutin complexes (red) and staining for M2-Flag (green) and DAPI (light blue). (J) Quantitative graph of figure I expressed as means ± SEM, 2-tailed t-test, #P < 0.0001, n ≥ 15/condition from 3 different experiments. (K) Representative images from WT primary hippocampal neurons transduced with rAAV9-GFP or Ssh1-shRNA-GFP and subjected to in situ PLA for SQSTM1-ubiqutin complexes (red) and staining for DAPI (light blue) or direct imaging for GFP (green). (L) Quantitative graph of figure K expressed as means ± SEM, 2-tailed t-test, **P = 0.0007, n = 10/condition from 3 different experiments
SSH1ΔN exacerbates and SSH1 reduction partially rescues SQSTM1 flux in MAPT/tauP301S brains
Previous studies have shown that SQSTM1 targets misfolded MAPT/tau for autophagic clearance. Specifically, Sqstm1-/- mice display severe neurodegeneration as well as hyperphosphorylated tau and neurofibrillary tangles [Citation52], and SQSTM1 overexpression strongly reduces pathogenic MAPT/tau in transfected cells and in vivo [Citation53]. Conversely, accumulation of pathogenic MAPT/tau adversely deregulates autophagy, as evidenced by abnormal accumulation of autophagosomes and LC3 [Citation7,Citation54–56], suggestive of a maladaptive feed-forward cycle of tauopathy and autophagy deregulation. However, SQSTM1 flux in the setting of tauopathy in vivo has not been investigated. Thus, we used the MAPT/tauP301S mice (PS19), in which tauopathy starts at 3 months and progressively becomes more filamentous at 6 months of age [Citation57]. To assess whether SQSTM1 flux is altered in MAPT/tauP301S brains and whether the non-CFL component of SSH1 (SSH1ΔN) alters SQSTM1 flux in vivo, we injected high titer (>1012 vg/mL) mCherry-GFP-Sqstm1 rAAV9 with control or SSH1ΔN-Flag rAAV9 into the hippocampus of 3-month old MAPT/tauP301S mice. We also injected control wild type littermate hippocampus with mCherry-GFP-Sqstm1 rAAV9 and vector control rAAV9. Two months post-injection, we processed brains for histological detection and quantification of mCherry, GFP, SSH1, and phospho-MAPT/tau (p-S199/p-S202) in the CA3 region of the hippocampus where mCherry-GFP-SQSTM1 was homogenously expressed. Total SQSTM1 puncta number per cell was significantly higher in MAPT/tauP301S CA3 compared to wild type CA3 by ~40% (,Bi). The percentage of acidified red-only SQSTM1 puncta was close to 80% in wild type CA3 (,Bii), indicating healthy SQSTM1 flux; however, the percentage of acidified red-only SQSTM1 puncta was significantly reduced to ~50% in CA3 of MAPT/tauP301S brains (,Bii), indicative of SQSTM1 flux impairment in MAPT/tauP301S brains. Similar SQSTM1 flux impediment was observed in DIV20 MAPT/tauP301S primary neurons compared to littermate WT neurons (Fig. S8A,B), indicating an early phenotype intrinsic to MAPT/tauP301S expression. Expression of SSH1ΔN in MAPT/tauP301S brains significantly reduced total SQSTM1 puncta number per cell (,Bi) as well as percentage of acidified red-only SQSTM1 puncta such that less than 30% of SQSTM1 puncta were red-only (,Bii), indicating that SSH1ΔN worsens SQSTM1 flux in MAPT/tauP301S brains. This exacerbated impediment of SQSTM1 flux by SSH1ΔN was accompanied by a significant 30% increase in p-S199/p-S202-MAPT/tau immunoreactivity in CA3 (), indicating that SSH1ΔN impairs SQSTM1-mediated phospho-MAPT/tau clearance. Indeed, western blotting from dissected hippocampus confirmed the expression of SSH1ΔN-Flag together with markedly increased total MAPT/tau and phospho-MAPT/tau but equivalent levels of mCherry-GFP-SQSTM1 (GFP antibody) and ACTB/actin (). As seen in MAPT/tauP301S brains, overexpression of full-length SSH1 or SSH1ΔN but not SSH1ΔC significantly increased MAPT/tau levels in Hela-V5-MAPT/tau cells [Citation58] stably expressing human wild type MAPT/tau (4R0N) (Fig. S8E-H), confirming that the SQSTM1 but not CFL component of SSH1 increases MAPT/tau levels.
Figure 8. SSH1ΔN exacerbates and SSH1 reduction partially rescues SQSTM1 flux in MAPT/tauP301S brains. (A–D) 3-month old WT and MAPT/tauP301S mice co-injected with rAAV9-mCherry-GFP-Sqstm1 and rAAV9-Flag-control or Flag-SSH1ΔN and sacrificed 2 months post-injection at 5 months of age. (A) Representative images showing staining for Flag-M2 (dark blue) and DAPI (light blue) or direct fluorescence for mCherry-GFP-SQSTM1 (mCherry: red, GFP: green) in the hippocampus CA3 region. (B). Quantitative graphs of figure A expressed as means ± SEM, 1-way ANOVA: (Bi) F(2, 15) = 4.956, df = 2, P = 0.0223; (Bii) F(2, 15) = 24.86, df = 2, P < 0.0001, followed by Tukey’s posthoc test, n = 6 mice/condition *p < 0.05, **p < 0.005. (C) Representative images showing staining for p-S199/p-S202-MAPT/tau (dark blue) and DAPI (light blue) and direct imaging for mCherry-GFP-SQSTM1 (mCherry: red, GFP: green) in the hippocampus CA3 region of MAPT/tauP301S mice. (D) Quantitative graph of figure C (pS199/pS202-MAPT/tau) expressed as means ± SEM, 2-tailed t-test, P = 0.0117, n = 6 mice/condition *p < 0.05. (E) Representative blots of total MAPT/tau, p-S199/p-S202-MAPT/tau, Flag and GFP from dissected hippocampus of injected MAPT/tauP301S mice. (F-J) 3-month old MAPT/tauP301S mice co-injected with rAAV9-mCherry-GFP-Sqstm1 and rAAV9-control-shRNA or rAAV9-Ssh1-shRNA and sacrificed 2 months post-injection at 5 months of age. (F) Representative images showing staining for SSH1 (dark blue) and DAPI (light blue) or direct fluorescence for mCherry-GFP-SQSTM1 (mCherry: red, GFP: green) in the hippocampus CA3 region. (G) Quantitative graphs of figure F expressed as means ± SEM, 2-tailed t-tests: *P = 0.0224; (Gii), **P = 0.0044 (Gii), n = 6 mice/condition. (H) Representative images showing staining for p-S199/p-S202-MAPT/tau (dark blue) and DAPI (light blue) and direct imaging for mCherry-GFP-SQSTM1 (mCherry: red, GFP: green) in the hippocampus CA3 region of MAPT/tauP301S mice. (I) Quantitative graph of figure H (p-S199/p-S202-MAPT/tau) expressed as means ± SEM, 2-tailed t-test, *P = 0.0138, n = 6 mice/condition. (J) Representative blots of total MAPT/tau, p-S199/p-S202-MAPT/tau, SSH1 and GFP from dissected hippocampus of injected MAPT/tauP301S mice
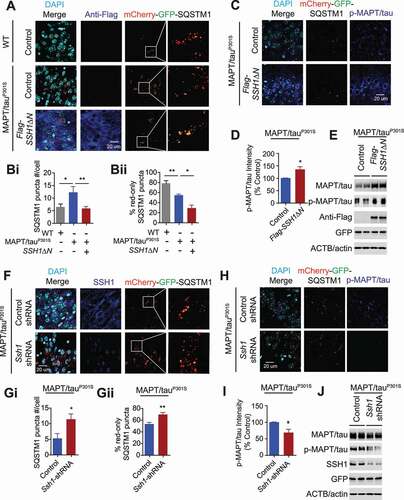
We next assessed whether knockdown of endogenous SSH1 can rescue the SQSTM1 flux impediment in MAPT/tauP301S brains. We produced a new batch of high titer (>1012 GC/mL) mCherry-GFP-Sqstm1 rAAV9 and injected mCherry-GFP-Sqstm1 rAAV9 together with control or Ssh1-shRNA rAAV9 into the hippocampus of MAPT/tauP301S mice at 3 months of age and processed brains for assessment at 5 months of age. The percentage of red-only SQSTM1 puncta were again close to 50% in control rAAV9 injected MAPT/tauP301S hippocampal CA3 (,Gii). However, Ssh1-shRNA rAAV9 significantly increased the percentage of red-only puncta to ~70% and markedly reduced endogenous SSH1 staining in CA3 (,Gi,Gii), indicating that SSH1 reduction partially rescues the SQSTM1 flux impairment in MAPT/tauP301S brains. This enhancement of SQSTM1 flux by Ssh1 shRNA was accompanied by a significant 30% decrease in p-S199/p-S202-MAPT/tau immunoreactivity in CA3 (), indicating that SSH1 reduction enhances SQSTM1-mediated phospho-MAPT/tau clearance. Western blotting from dissected hippocampus confirmed that Ssh1-shRNA lowers endogenous SSH1 by ~70% together with marked reduction in total MAPT/tau and phospho-MAPT/tau but equivalent levels of mCherry-GFP-SQSTM1 (GFP antibody) and ACTB/actin (). Therefore, these results taken together demonstrate that while MAPT/tauP301S expression impedes SQSTM1 flux in vivo, SSH1ΔN expression significantly exacerbates SQSTM1 flux and increases phospho-MAPT/tau levels, whereas knockdown of endogenous SSH1 reduction partially rescues SQSTM1 flux and significantly lowers phospho-MAPT/tau levels in MAPT/tauP301S brains.
Discussion
Accumulation of misfolded proteins and damaged mitochondria constitute pathological signatures of neurodegenerative diseases. These features, in large part, are attributed to impairments in selective autophagy and mitophagy, vital cellular processes that remove polyubiquitinated substrates tagged for clearance [Citation59–61]. SQSTM1 is a major selective autophagy cargo receptor that plays a key role in targeting misfolded MAPT/tau and damaged mitochondria for degradation. This is achieved by the activating phosphorylation of SQSTM1 on Ser403 by ULK, TBK1, or CSNK2/CK2, which increases SQSTM1 affinity for polyubiquitinated substrates [Citation18,Citation19,Citation21] and activates the recruitment of LC3 [Citation18,Citation37]. This phosphorylation is transient and subject to rapid dephosphorylation [Citation19]. However, to date, the identity of phosphatases that physiologically mediate SQSTM1 dephosphorylation on p-Ser403 has remained mysterious. In this study, we identified SSH1 as the first phosphatase that deactivates SQSTM1 by dephosphorylation of p-Ser403 (, schematic model). This event resulted in fewer but larger SQSTM1 puncta and reduced binding to ubiquitinated substrates, thereby significantly slowing SQSTM1 flux. As cargo-bound SQSTM1 acts as an autophagy inducer by enhancing the synthesis of LC3 and its conversion to LC3-II [Citation45], SSH1-mediated dephosphorylation of SQSTM1 also resulted in impaired downstream LC3 puncta formation, reduced LC3-II generation, and slowed mitophagy without directly altering lysosomal LC3 flux. The inhibitory actions of SSH1 on SQSTM1 were dependent on the UBA domain Ser403 SQSTM1 phosphorylation site, and SSH1ΔN but not SSH1ΔC was sufficient to directly dephosphorylate p-Ser403-SQSTM1 and inhibit SQSTM1 activity, thereby separating the canonical function of SSH1 on CFL from SQSTM1. This inhibitory action of SSH1 on SQSTM1 was validated in primary neurons and in vivo. Specifically, SQSTM1 flux was impaired in MAPT/tauP301S primary neurons and brains, which was exacerbated by expression of SSH1ΔN in brain resulting in increased phospho-MAPT/tau accumulation. Conversely, shRNA-mediated knockdown of endogenous SSH1 partially rescued SQSTM1 flux in MAPT/tauP301S brains resulting in reduced phospho-MAPT/tau levels. These results taken together identify a novel function of SSH1 as an upstream inhibitor of SQSTM1, separate from its action on CFL, and implicate the SSH1-SQSTM1 pathway in impaired clearance of misfolded MAPT/tau.
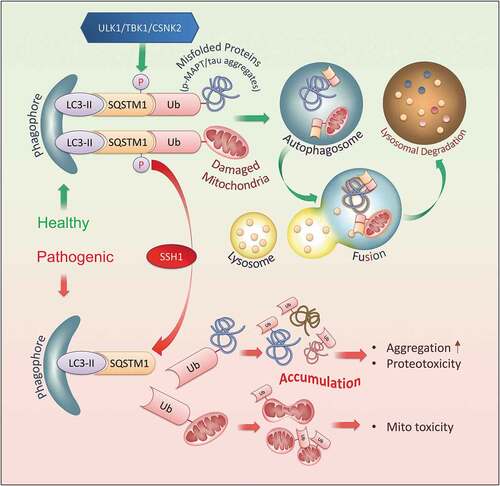
Figure 9. Schematic model of SSH1 in SQSTM1-mediated selective autophagy In healthy neurons, regulated activation of SQSTM1 by phosphorylation on Ser403 by ULK1, TBK1, or CSNK2/CK2 promotes LC3 activation and SQSTM1 binding to ubiquitinated misfolded proteins (i.e. phospho-MAPT/tau) and damaged organelles (i.e. mitochondria), leading to normal clearance through the autophagy-lysosome system. Deactivation of SQSTM1 by SSH1-mediated dephosphorylation of Ser403 renders SQSTM1 unable to activate LC3 and bind to ubiquitinated cargo, leading to their accumulation and toxicity

Inhibition of SQSTM1 by SSH1-mediated dephosphorylation of p-Ser403
The ability of SQSTM1 to function as a selective autophagy cargo receptor depends on three essential domains. N-terminal PB1 domain mediates the self-interaction of SQSTM1 allowing the formation of SQSTM1 helical filaments arranged in a head to tail configuration [Citation50]. These filaments function as scaffolds for the binding to multiple LC3 through the LIR domain, thereby allowing the nucleation of the autophagosome membrane together with SQSTM1 [Citation18]. The UBA domain of SQSTM1 mediates the binding to ubiquitinated cargo [Citation20], and such binding is regulated by several processes. First, homodimerization of the UBA domain precludes polyubiquitin binding and contributes to SQSTM1 puncta abundance [Citation62,Citation63], as deletion of the UBA domain impairs both ubiquitin binding and formation of SQSTM1 bodies even in the presence of the PB1 domain [Citation20,Citation50]. Second, Ser403 phosphorylation within the UBA domain destabilizes UBA homodimerization and liberates the UBA domain from dimeric repression [Citation18], thereby facilitating the binding to polyubiquitinated cargo. A third regulatory process via direct ubiquitination of the UBA domain on K420 has also recently been shown to modulate binding to ubiquitinated cargo [Citation64,Citation65]. Our observation that SSH1 dephosphorylates p-Ser403 of SQSTM1, reduces SQSTM1 puncta number while increasing puncta size, and decreases ubiquitin binding is consistent with the expected increase in UBA domain homodimerization by p-Ser403 dephosphorylation. Our co-IP and PLA experiments to detect SQSTM1 self-interaction at the molecular level, however, did not find a measurable change in overall SQSTM1 self-interaction, which is mechanistically distinct to the recently reported role of ARRB2/β-arrestin2 oligomers in inhibiting SQSTM1 self-interaction [Citation24]. This is likely due to the sufficiency of the PB1 domain to maintain SQSTM1 self-interaction at the molecular level, whereas puncta size is governed by PB1 oligomerization and UBA dimerization, the latter which inhibited by Ser403 phosphorylation [Citation18]. In addition, a recent study showed that polyubiquitin binding to the UBA domain promotes fragmentation of SQSTM1 filaments [Citation50]. Hence, SSH1-induced inhibition of SQSTM1-ubiqutin binding may also account for the observed reduction in SQSTM1 puncta number but increased puncta size. Consistent with either or both scenarios, we validated our findings using the SQSTM1S403E phosphomimetic mutant, which produced an identical phenotype to that seen with SSH1 knockdown resulting in increased SQSTM1 puncta number and reduced the puncta size. Conversely, SQSTM1S403A “inactive” mutant produced an identical phenotype to that seen with SSH1 overexpression, resulting in reduced SQSTM1 puncta number and increased puncta size. Neither SSH1 knockdown nor overexpression could alter these molecular signatures of SQSTM1S403E or SQSTM1S403A mutants, demonstrating the requirement of Ser403 modification in SSH1-induced inhibition of SQSTM1. These results therefore indicate that SSH1-mediated dephosphorylation of p-Ser403-SQSTM1, like the SQSTM1S403A mutant, decreases the number of active SQSTM1 puncta by coalescing smaller puncta into larger particles containing dimerized UBA domain. We found no evidence that SSH1 alters the activating phosphorylation (p-Ser317) of ULK (not shown), a key upstream kinase that phosphorylates Ser403-SQSTM1 and a kinase shown to be essential for LC3 lipidation [Citation66]. Moreover, our observation that SSH1ΔN, but not SSH1ΔC, dephosphorylates p-Ser403-SQSTM1 using purified recombinant proteins provides cogent evidence for a direct effect of SSH1 in SQSTM1 inhibition.
Regulation of LC3 biogenesis and recruitment by SSH1
The interaction of SQSTM1 with LC3 is essential for SQSTM1-mediated selective autophagy. Under conditions of proteotoxic stress or mitochondrial damage, autophagy or mitophagy is initiated and regulated by the cargo. Recent studies indicate that cargo-bound SQSTM1 stimulates LC3-positive puncta formation colocalized with SQSTM1, increases the synthesis of LC3 and its conversion to a lipidated form, LC3-II [Citation44,Citation45]. Our observation that SSH1-mediated SQSTM1 dephosphorylation reduces LC3-II generation, LC3 puncta, and LC3 recruitment to mitochondria upon depolarization is consistent with this notion. Indeed, we validated that these effects on LC3 are completely dependent on the presence of SQSTM1, as SQSTM1 knockdown abrogated the effects of SSH1 on LC3 puncta and recruitment. The reduction in LC3-II level by SSH1 was not due to faster removal by the lysosome, as SSH1 suppressed LC3-II level both the in presence or absence of rapamycin, FCCP, and/or bafilomycin. Hence, despite the changes in LC3 puncta formation, SSH1 did not alter its flux as seen by the mCherry-GFP-LC3 flux reporter. In contrast, SSH1 significantly slowed FCCP-induced mitophagy flux as seen by the mito-QC flux reporter, which is reflected in reduced LC3 puncta formation and its overall recruitment to mitochondria. As SSH1 did not alter LC3 flux per se, we looked for upstream effectors that may account for changes in LC3. It is notable that OPTN, a SQSTM1-related autophagy cargo receptor of similar function, was not affected by SSH1. This confirms the specificity of SSH1 on SQSTM1, which was validated by SQSTM1 deletion and phosphorylation mutants.
Divergent activities of SSH1 on SQSTM1 and CFL: Implications for tauopathy
SSH1 is a phosphatase classically known for its ability to dephosphorylate and activate CFL [Citation34], a major F-actin severing protein implicated in a wide array of biological processes [Citation67]. We found that SSH1 dephosphorylates p-Ser403 of SQSTM1, which was modular and separable from that on p-Ser3 of CFL. This discovery not only identified SSH1 as the first phosphatase with this activity, but also indicated that 2 major and apparently unrelated pathways (CFL & SQSTM1) are regulated by a single phosphatase. The CFL binding site is located within the N-terminal region [Citation51], while the SQSTM1 binding site is in the C-terminal region, with the shared catalytic domain located in between. At present, it is unknown whether both activities of SSH1 are regulated simultaneously or separately. However, previous studies have shown that SSH1 is activated by oxidative stress. Specifically, the binding and sequestration of SSH1 by YWHAZ/14-3-3 ζ and YWHAQ/14-3-3 τ heterodimers inhibits SSH1 activity; however, upon oxidation of YWHA/14-3-3, SSH1 is released from YWHA/14-3-3 inhibitory control, thereby allowing SSH1 to dephosphorylate and activate CFL [Citation68,Citation69]. We and others have previously shown that Aβ42 oligomers activate CFL [Citation31,Citation35,Citation70], a process that requires reactive oxygen species (ROS) generation by NOX [Citation32] and dephosphorylation of CFL by SSH1 [Citation31]. Aβ42 oligomer-induced activation of CFL has been shown to destabilize F-actin at the synapse and translocate to mitochondria to promote mitochondrial dysfunction [Citation31]. As SSH1 reduction mitigates Aβ42 oligomer-induced mitochondrial translocations of CFL, our observation that SSH1 knockdown robustly promotes an early step in mitophagy, LC3 recruitment to mitochondria, is rather surprising and suggests that oxidative stress may simultaneously induce mitochondrial damage and impair mitochondrial clearance through SSH1 activation, a hypothesis that requires validation.
The implications of the dual and divergent functions of SSH1 in MAPT/tau biology and tauopathy are multi-fold. We recently reported that CFL reduction mitigates tauopathy through reduced displacement of MAPT/tau from microtubules, as activated/dephosphorylated CFL promotes MAPT/tau displacement from microtubules; however, activated CFL does not directly regulate MAPT/tau levels [Citation71]. This was also evidenced in this study, in which SSH1ΔC, which selectively dephosphorylates CFL, failed to increase MAPT/tau, whereas SSH1ΔN, which selectively dephosphorylates SQSTM1, significantly increased MAPT/tau as effectively as full-length SSH1. Indeed, we confirmed that SSH1ΔN enhances MAPT/tau and phospho-MAPT/tau levels in brain. By using the mCherry-GFP-SQSTM1 flux reporter, we found that MAPT/tauP301S brains and primary neurons exhibit significantly impaired SQSTM1 flux, in line with observations that p-Ser403-SQSTM1 per total SQSTM1 is dramatically reduced in brains of AD patients [Citation2]. This impairment was exacerbated by SSH1ΔN, resulting in a corresponding increase in phospho- MAPT/tau, while MAPT/tauP301S-induced impairment in SQSTM1 flux was partially rescued by SSH1-shRNA, resulting in a corresponding decrease in phospho-MAPT/tau. Hence, in addition to the SSH1-CFL activation pathway in promoting MAPT/tau displacement from microtubules [Citation71], this study highlights the divergent SSH1-SQSTM1 inhibitory pathway in impairing autophagic clearance of misfolded MAPT/tau. The SQSTM1 pathway was also recently shown to be suppressed by the accumulation of ARRB2/β-arrestin2 oligomers in FTLD-MAPT/tau, resulting in promotion of tauopathy [Citation24]. Interestingly, a recent study by Deng and colleagues showed that multiple ALS/FTLD-linked mutations in TBK1 or SQSTM1 result in deficient phosphorylation of SQSTM1 on Ser403 and a nearby site on Ser407 [Citation25]. Therefore, partially inhibiting SSH1 activity may be an effective mitigating strategy to reduce tauopathy and related neurodegenerative conditions associated with reduced SQSTM1 activity.
Materials and methods
Cell lines
Mouse hippocampus-derived HT22 neuroblastoma cells (Professor David Schubert; Salk Institute, La Jolla, CA [Citation72]), human embryonic kidney cell line HEK293 cells (ATCC, CRL-1573), human embryonic kidney cell line HEK293T cells (ATCC, CRL-3216) and stably transfected Hela-V5-MAPT/tau cells (Dr. Chad Dickey, USF Health, Tampa, FL, USA [Citation58]) overexpressing wild-type 4R0N human MAPT/tau were cultured in Dulbecco’s modified Eagle’s medium (DMEM,) supplemented with 10% fetal bovine serum (FBS) and 1% penicillin-streptomycin (P/S).
Mice
WT and MAPT/tauP301S [Citation57] mice were obtained from the Jackson Laboratory and bred in the C57BL/6 background. Mice were housed together until the time they were introduced with rAAV9 at 3 months of age. Water and food were supplied ad libitum with 12 h light/dark cycle under standard vivarium conditions. All mice were sacrificed at 5 months of age.
Primary neurons
Hippocampal and cortical primary neuron from WT and MAPT/tauP301S mice were prepared from P0 pups as previously described [Citation73,Citation74]. In brief, both hippocampus and cortex were dissected separately in ice-cold HBSS and digested with trypsin (Gibco, 25,200,056). Mouse neurons were plated on glass coverslips or plates coated with poly-d-lysine (Sigma-Aldrich, 27,964–99-4) in neurobasal medium (Invitrogen, 21,103,049), 2% GlutaMAX (Invitrogen, 35,050,061), and 2% B27 supplement (Invitrogen, 17,504,044). All the cells were cultured in a humidified atmosphere (5% CO2) at 37°C.
Antibodies
Rabbit polyclonal Anti-LC3A/B (Cell Signaling Technology, 4108); rabbit polyclonal anti-SSH1/Slingshot-1 L (C-terminal region) (ECM Biosciences, SP1711); rabbit monoclonal anti-SSH1 (E1K3W) (Cell Signaling Technology, 13,578); rabbit monoclonal anti-TOMM20/Tom20 (D8T4N) (Cell Signaling Technology, 42,406); mouse monoclonal anti-FLAG® M2 (Sigma-Aldrich, F3165); mouse monoclonal anti-ACTB/β-Actin (Sigma-Aldrich, A5316); rabbit polyclonal anti-SQSTM1/p62 (Cell Signaling Technology, 5114); rabbit polyclonal anti-phospho-SQSTM1/p62 (Ser403) (Cell Signaling Technology, 14,354); rabbit monoclonal anti-phospho-SQSTM1/p62 (Ser403) (D8D6T) (Cell Signaling Technology, 39,786); mouse monoclonal anti-HA-Tag (6E2) (Cell Signaling Technology, 2367); rabbit monoclonal anti-GFP (D.5.1) XP® (Cell Signaling Technology, 2956); mouse monoclonal anti-ubiquitin (P4D1) (Santa Cruz Biotechnology, sc-8017); rabbit monoclonal anti-CFL/Cofilin (D3F9) XP® (Cell Signaling Technology, 5175); rabbit monoclonal anti-phospho-CFL/Cofilin (Ser3) (77G2) (Cell Signaling Technology, 3313); rabbit monoclonal anti-His-Tag (D3I1O) XP® (Cell Signaling Technology, 12,698); mouse monoclonal anti-MAPT/tau (A10) (Santa Cruz Biotechnology, sc-390,476); rabbit polyclonal anti-phospho-MAPT/tau (pSer199/202) (Sigma-Aldrich, T6819); mouse polyclonal anti-Horseradish Peroxidase (Jackson ImmunoResearch Inc., Code: 223–005-024, RRID: AB_2339261); rabbit polyclonal anti-horseradish peroxidase (Jackson ImmunoResearch Inc., Code: 323–005-024, RRID: AB_2315781); goat polyclonal anti-horseradish peroxidase (Jackson ImmunoResearch Inc., Code: 123–005-021, RRID: AB_2338952); donkey anti-rabbit IgG (H + L) highly cross-adsorbed secondary antibody, Alexa Fluor Plus 594 (Invitrogen, A32754); donkey anti-mouse IgG (H + L) highly cross-adsorbed secondary antibody, Alexa Fluor Plus 594 (Invitrogen, A32744); goat anti-rabbit IgG (H + L) cross-adsorbed secondary antibody, Alexa Fluor 405 (Invitrogen, A-31,556); goat anti-mouse IgG (H + L) cross-adsorbed secondary antibody, Alexa Fluor 405 (Invitrogen, A-31,553); donkey anti-rabbit IgG (H + L) highly cross-adsorbed secondary antibody, Alexa Fluor Plus 647 (Invitrogen, A32795); donkey anti-mouse IgG (H + L) highly cross-adsorbed secondary antibody, Alexa Fluor Plus 647 (Invitrogen, A32787); donkey anti-rabbit IgG (H + L) highly cross-adsorbed secondary antibody, Alexa Fluor Plus 488 (Invitrogen, A32790); donkey anti-mouse IgG (H + L) highly cross-adsorbed secondary antibody, Alexa Fluor Plus 488 (Invitrogen, A32766).
Reagents, Chemicals, Peptides, Recombinant Proteins and Oligonucleotides
Agarose linked antisera anti-mouse IgG kit (American Qualex, G1060); agarose linked antisera anti-rabbit IgG kit (American Qualex, G1360B); MitoTracker® red CMXRos (Cell Signaling Technology, 9082); DAPI (Sigma-Aldrich, D9542); Duolink® In Situ PLA® probe anti-mouse PLUS (Sigma-Aldrich, DUO92001); Duolink® In Situ PLA® probe anti-rabbit MINUS (Sigma-Aldrich, DUO92005); Duolink® In Situ detection reagents red (Sigma-Aldrich, DUO92008); Duolink® In Situ wash buffers, fluorescence (Sigma-Aldrich, DUO82049); Duolink® In Situ mounting medium with DAPI (Sigma-Aldrich, DUO82040); Pierce BCA protein assay kit (Thermo Scientific, 23225); Aligent QuikChange II site-directed mutagenesis kit (Agilent, 200521); FCCP (Sigma-Aldrich, C2920); rapamycin (Sigma-Aldrich, R8781); bafilomycin A1 (Santa Cruz Biotechnology, sc-201550); Benzonase® nuclease (Sigma-Aldrich, E1014); OptiPrep™ density gradient medium (Sigma-Aldrich, D1556); lipofectamine 2000 (Invitrogen, 11668019); fluorochrome mounting solution (Thermo scientific, TA-030-FM); Opti-MEM I (1x) (Gibco, 31985–070); paraformaldehyde, 96% extra pure. (PFA) (Acros Organics, 416780030); PBS (Gibco, 10010049) DMEM (Dulbecco’s modified eagle medium) (Corning, 10–013-CV); fetal bovine serum (FBS) (Sigma-Aldrich, 12306 C); pen strep (P/S) (Gibco, 15140–122); BM-cyclin (Roche, 10799050001); Sf-900™ II SFM (Gibco, 10902096); GE Healthcare Ni sepharose (GE Healthcare, 17526801); XhoI restriction enzyme (NEW ENGLAND Biolabs, R0146S); AgeI restriction enzyme (NEW ENGLAND Biolabs, R0552S); AscI restriction enzyme (NEW ENGLAND Biolabs, R0558S); NheI restriction enzyme (NEW ENGLAND Biolabs, R0131S); NotI restriction enzyme (NEW ENGLAND Biolabs, R0189S); SalI restriction enzyme (NEW ENGLAND Biolabs, R0138S); SpeI restriction enzyme (NEW ENGLAND Biolabs, R0133S); Beta-Amyloid 1–42, TFA (GenicBio Limited, A-42-T-1); SSH1 siRNA: GAG GAG CUG UCC CGA UGA C (Dharmacon GE Healthcare, CTM-395590); SignalSilence® SQSTM1/p62 siRNA II (Cell Signaling Technology, 6399); SSH1ΔC-his, SSH1ΔN-his, SQSTM1/p62-his were generated by this paper (see method details).
Recombinant DNA
pN3-3xFlag-Control (Addgene, 107717, Guntram Suske Lab [Citation75]); pmRFP-LC3 (Addgene, 21075, Tamotsu Yoshimori Lab [Citation43]); pMXs-puro GFP-Sqstm1/p62 (Addgene, 38277, Noboru Mizushima Lab [Citation49]); pBABE-puro mCherry-EGFP-LC3B (Addgene, 22418, Jayanta Debnath Lab [Citation76]); pBABE-EGFP (Addgene, 36999, Debu Chakravarti Lab [Citation77]); ECFP-SSH1ΔC (N461) (Dr. Mizuno lab [Citation51]); EGFP-SSH1 (Dr. Storz lab [Citation69]); mKeima-Red-Mito-7 (Addgene, 56018); pOPTN-EGFP (Addgene, 27052Beatrice Yue Lab [Citation78]); pMXs-puro GFP-Sqstm1/p62ΔC (Addgene, 38282, Noboru Mizushima Lab [Citation49]); pMXs-puro GFP-Sqstm1/p62 D337, 338, 339A (GFP-SQSTM1-LIR) (Addgene, 38280, Noboru Mizushima Lab [Citation49]); HA-Ubiquitin (Addgene, 18712, Edward Yeh Lab [Citation79]); pDR125 (Addgene, 37150, Dale Ramsden Lab); pN3-3xFlag-SSH1, mCherry-EGFP-Sqstm1/p62, mCherry-EGFP-Sqstm1S403A, mCherry-EGFP-Sqstm1S403E, pN3-Flag-SSH1ΔC, pN3-Flag-SSH1ΔN and pN3-Flag-SSH1ΔNC393S were generated in this work (see methods below).
DNA transfections and adenoviral transductions
DNA plasmids were transiently transfected in HT22 cells or HEK293T cells using Lipofectamine 2000 and Opti-MEM I. SiRNA was transfected twice every 24 h. After four to six hours post transfection, the medium was replaced with new complete medium. Generally, cells were grown for 48 h after transfection prior to experimental assays. rAAV9 variants were transduced to primary neurons on DIV4 and were assayed for experiments on DIV18.
Cell/tissue lysis and immunoblotting
Cultured cells were lysed with RIPA lysis buffer (50 mM Tris-Cl, pH 7.4, 150 mM NaCl, 2 mM EDTA, and 1% Triton X-100[Amresco, 0694–1 L], 0.1% SDS) plus protease inhibitor (GeneDEPOT, P3100-010) and phosphatase inhibitors (GeneDEPOT, P3200-005). Brain homogenates were lysed with RIPA buffer plus protease and phosphatase inhibitors with sonication. Proteins were extracted and centrifuged at 17,000 g for 15 min at 4°C, and supernatants were used for western blotting. Protein quantification was performed with a colorimetric detection reagent (BCA protein assay, Pierce, 23225). Equal amounts of total protein were subjected to SDS-PAGE and transferred to nitrocellulose membranes (GE Healthcare, 10600002) for immunoblotting. After probing with the primary antibody overnight at 4°C, the corresponding peroxidase-conjugated secondary antibody was detected by ECL western blot reagents (Pierce, 34578). ECL images were captured with the Fuji LAS-4000 imager (LAS-4000, Pittsburgh, PA, USA) and quantified using the ImageJ software. All protein amounts were normalized to actin prior to comparison between experimental conditions.
Immunofluorescence
For immunocytochemistry (ICC), cells were washed with PBS and fixed at room temperature for 15 min with 4% paraformaldehyde (PFA). After washing with PBS, fixed cells were incubated with blocking solution containing 0.2% Triton X-100, 3% normal goat serum (Vector Laboratories Inc., S-1000) for 1 h, followed by overnight incubation at 4°C with related primary antibodies. After three washes with PBS, cells were incubated for 1 h with Alexa Fluor 488-, Alexa Fluor 594- or Alexa Fluor 647-conjugated secondary IgG antibodies. Slides were then washed three times with PBS and mounted with fluorochrome mounting solution. For immunohistochemistry (IHC), mice were perfused with PBS, and half brains were immediately stored at −80°C for biochemical analyses, and the other half was fixed with 4% paraformaldehyde at 4°C for 24 h followed by cryoprotection in 30% sucrose. Thirty-micron sections were blocked using normal goat serum for 1 h and subjected to primary antibodies at 4°C overnight, followed by secondary antibody (Alexa Fluor 488, Alexa Fluor 594 or Alexa Fluor 647) incubation for 1 h at room temperature prior to mounting. For PLA assays, Duolink® In Situ PLA® reagents were purchased from Sigma-Aldrich. PLA assay was performed following the manufacturer’s instructions. All images from ICC, IHC, and PLA experiments were captured with the Olympus FV10i confocal microscope (Tokyo, Japan).
Plasmids and constructs
The mCherry-EGFP-Sqstm1 construct was generated by replacing the LC3B sequence with the Sqstm1 sequence (pMXs-puro GFP-SQSTM1) from the pBABE-puro mCherry-EGFP-LC3B construct using EcoRI and SalI restriction sites. The mCherry-EGFP-Sqstm1S403A, mCherry-EGFP-Sqstm1S403E constructs were generated using the Agilent QuikChange II Site-Directed Mutagenesis Kit from mCherry-EGFP-Sqstm1. SSH1, SSH1ΔC, SSH1ΔN were subcloned into pN3-3XFlag vector using HindIII and SalI sites by PFU-based PCR amplification of SSH1 from EGFP-SSH1 as a template. Flag-SSH1ΔNC393S was generated using the Agilent QuikChange II Site-Directed Mutagenesis Kit from Flag-SSH1ΔN. Constructs used for recombinant proteins SSH1ΔC-his, SSH1ΔN-his, Sqstm1-his were inserted into the backbone of pFastbac1 with XbaI and XhoI sites (addgene pDR125 removed LIG4 with XbaI and XhoI). All primers were custom designed as following and ordered from IDT:
mCherry-EGFP-Sqstm1-FP: 5ʹ-TTTTTGAATTCATGGCGTCGTTCACGGTGAAG-3ʹ
mCherry-EGFP-Sqstm1-RP: 5ʹ-TTTTTGTCGACTCACAATGGTGGAGGGTGCTT-3ʹ
Sqstm1S403A-FP: 5ʹ-CTCTCCCAGATGCTGGCCATGGGTTTCTCGGAT-3ʹ
Sqstm1S403A-RP: 5ʹ-ATCCGAGAAACCCATGGCCAGCATCTGGGAGAG-3ʹ
Sqstm1S403E-FP: 5ʹ- CTCTCCCAGATGCTGGAGATGGGTTTCTCGGAT-3ʹ
Sqstm1S403E-RP: 5ʹ-ATCCGAGAAACCCATCTCCAGCATCTGGGAGAG-3ʹ
Sqstm1-his-FP: 5ʹ-TTTTTGAATTCATGGCGTCGTTCACGGTGAAG–3ʹ,
Sqstm1-his-RP:5ʹ-TTTTTCTCGAGCAATGGTGGAGGGTGCTTCGA-3ʹ
SSH1ΔC-his-FP: 5ʹ-TTTTTTCTAGAATGGCCCTGGTGACCCTGCAG-3ʹ
SSH1ΔC-his-RP: 5ʹ-TTTTTCTCGAGCTGCTGACGCCACAGCTT-3ʹ
SSH1ΔN-his-FP: 5ʹ-TTTTTTCTAGAATGAAGCCCTCCCTTATCTTCGAT- 3ʹ
SSH1ΔN-his-RP: 5ʹ-TTTTTCTCGAGGCTTTTGCTCATCCACGAAGG-3ʹ
Flag-SSH1-FP: 5ʹ-TTTTTAAGCTTATGGCCCTGGTGACCTGCAG-3ʹ
Flag-SSH1-RP: 5ʹ-TTTTTGTCGACTCAGCTTTTGCTCATCCACGA-3ʹ
Flag-SSH1ΔN-FP: 5ʹ-TTTTTAAGCTTAAGCCCTCCCTTATCTTCGAT-3ʹ
Flag-SSH1ΔN-RP: 5ʹ-TTTTTGTCGACTCAGCTTTTGCTCATCCACGA-3ʹ
Flag-SSH1ΔC-FP: 5ʹ- TTTTTAAGCTTATGGCCCTGGTGACCTGCAG-3ʹ
Flag-SSH1ΔC-RP: 5ʹ-TTTTTGTCGACTCACTGCTGACGCCACAGCTT-3ʹ
Flag-SSH1ΔNC393S-FP: 5ʹ-AAGTGCCTGGTGCATAGCAAAATGGGCGTGAGT-3ʹ
Flag-SSH1ΔNC393S-RP: 5ʹ-ACTCACGCCCATTTTGCTATGCACCAGGCACTT-3ʹ
Generation of rAAV9 and stereotaxic injections in mice
To generate the pTR12.1-MCSW-Flag-SSH1ΔN construct, Flag-SSH1ΔN was digested by AgeI and SalI restriction enzymes and subcloned into the pTR12.1-MCSW vector using AgeI and XhoI (destroyed after ligation) cloning sites. To generate the pTR12.1-MCSW-ECFP-SSH1ΔC construct, the ECFP-SSH1ΔC was cloned into pTR12.1-MCSW vector at AgeI and NotI cloning sites. To generate the pTR12.1-MCSW-mCherry-EGFP-Sqstm1 construct, the mCherry-EGFP-Sqstm1 digested by SpeI and SalI restriction enzymes was cloned into the pTR12.1-MCSW vector using SpeI and XhoI (destroyed after ligation) cloning sites. To generate H1rSC-Ssh1-shRNA and H1rSC-Ssh1-shRNA-hrGFP constructs, the duplex of mouse SSH1 short hairpin RNA with the target sequence 5ʹ-CCCGTTTAGATCACACCAGTA-3ʹ was cloned into H1rSC and H1rSC-hrGFP vectors at ASCI and NheI cloning sites. Recombinant AAV9 viruses were generated by co-transfection of serotype vector expressing the gene of interest with pAAV9 and pXX6 in HEK293 cells. Cells were lysed in the presence of 0.5% sodium deoxycholate, 1 mM MgCl2 and 50 U/ml Benzonase by freeze thawing after 48 h incubation with transfected vectors, and the virus was isolated using a discontinuous iodixanol (OptiPrepTM Density Gradient Medium) gradient and purified with ApolloTM 20 mL High-Performance Centrifugal quantitative concentrators (Orbital Biosciences, 2,015,010) [Citation74,Citation80]. For brain injections, isoflurane anesthetized mice (3-month old, equally balanced for gender per condition) were bilaterally injected with a 26-gauge needle attached to a 10-μl syringe (Hamilton, 80,330) at the following coordinates: anteroposterior 2.7 mm, lateral 2.7 mm, and vertical 3.0 mm. A total volume of 2 μl purified rAAV9 (1.3 × 10¹² vg/ml) was injected over a 2-min period using the convection enhanced delivery method [Citation74,Citation80]. Mice were sacrificed 8 weeks post injection.
Recombinant proteins
pFast-SSH1ΔC-his, pFast-SSH1ΔN-his, pFast-Sqstm1-his constructs were transformed into DH10Bac competent cells. After blue-white screening, DH10Bac strains were chosen to express and amplify recombinant Bacmids. Sf9 insect cells transfected with Bacmid (midiprep from DH10Bac competent cells) were cultured for 3 days with Sf900 II SFM medium, then P1 generation virus in medium was collected and added to new Sf9 cells. After 2 days culture, Sf9 cells were harvested and lysed with lysis buffer (Tris 20 mM, pH7.4, NaCl 150 mM, Triton X-100 1%, 10 mM imidazole, with protease inhibitors). After centrifugation at 12,000 g for 15 minutes, supernatant was collected and shaken for 1 h at 4°C with Ni Sepharose (GE Healthcare, 17–5268-01). Bound proteins on sepharose were washed 3 times with ice-cold lysis buffer, and recombinant proteins were eluted with ice-cold elution buffer (Tris 20 mM, pH 8.5, NaCl 150 mM, 200 mM imidazole), after which proteins were dialyzed in dialysis buffer (Tris 20 mM, pH 8.0, NaCl 150 mM, DTT 1 mM) at 4°C overnight.
Quantification and statistical analysis
Immunofluorescence images were quantified by using the Image J software (National Institutes of Health, Bethesda, MD). All comparison images were acquired with identical laser intensity, exposure time, and filter. Adjustments to the brightness/contrast and threshold were applied equally to all comparison images. Regions of interest (ROI) for cell lines and primary neurons were cell body (excluded cell nuclei). ROI for brain tissue were chosen randomly throughout the CA3 region of the hippocampus. All puncta numbers were quantified manually with the Image J cell counter plugin. All percentages of co-localization were measured with Image J COLOC Threshold Manders’ Correlation with in-program threshold. Then number of puncta that colocalized with mitochondria were quantified manually using the Colocalized Pixel Map Image (generated by Image J COLOC Threshold) with the Image J cell counter plug-in. Puncta sizes were measured as particle area with Image J Analyze Particles. Investigators were blinded to genotypes of mice and experimental conditions during image acquisition and quantification. Statistical data were analyzed by the GraphPad Prism 6.0 software using Student’s 2-tailed t-test, χ2 test for trend, 1-way ANOVA, or 2-way ANOVA. One-way ANOVA was followed by Tukey’s posthoc test, and 2-way ANOVA was followed by Sidak’s posthoc test. ANOVA posthoc tests were performed when initial ANOVA tests showed significance at p < 0.05. All quantitative graphs were expressed as means ± S.E.M. Differences were deemed significant when P < 0.05.
Ethics approval
All experimental methods and protocols involving mice were approved by Institutional Animal Care and Use Committee (IACUC) at the University of South Florida (USF). IACUC and Institutional Biosafety Committees (IBC) at the USF have also approved that all the methods used in this study were performed in accordance with the relevant guidelines and regulations.
Supplemental Material
Download PDF (4.1 MB)Supplemental Material
Download MS Word (25.5 KB)Acknowledgments
We thank Dr. Mizuno (Tohoku University, Japan) for providing the ECFP-SSH1 construct, Dr. Storz (Mayo Clinic, Jacksonville, FL) for providing the EGFP-SSH1 construct, and Dr. Schubert (Salk Institute, La Jolla, CA) for providing the HT22 cell line. Constructs obtained from other labs through Addgene are acknowledged in the Methods section.
Data availability
The data that support the findings of this study are available from the corresponding authors on reasonable request.
Disclosure statement
No potential conflict of interest was reported by the authors.
Supplementary material
Supplemental data for this article can be accessed here.
Additional information
Funding
Related Research Data
References
- Zare-Shahabadi A, Masliah E, Johnson GV, et al. Autophagy in Alzheimer’s disease. Rev Neurosci. 2015;26(4):385–395.
- Tanji K, Miki Y, Ozaki T, et al. Phosphorylation of serine 349 of p62 in Alzheimer’s disease brain. Acta Neuropathol Commun. 2014 May 3;2:50.
- Boland B, Kumar A, Lee S, et al. Autophagy induction and autophagosome clearance in neurons: relationship to autophagic pathology in Alzheimer’s disease. J Neurosci. 2008 Jul 2;28(27):6926–6937.
- Bordi M, Berg MJ, Mohan PS, et al. Autophagy flux in CA1 neurons of Alzheimer hippocampus: increased induction overburdens failing lysosomes to propel neuritic dystrophy. Autophagy. 2016 Dec;12(12):2467–2483.
- Zhang YD, Zhao JJ. TFEB participates in the abeta-induced pathogenesis of Alzheimer’s Disease by regulating the autophagy-lysosome pathway. DNA Cell Biol. 2015 Nov;34(11):661–668.
- Alvarez-Arellano L, Pedraza-Escalona M, Blanco-Ayala T, et al. Autophagy impairment by caspase-1-dependent inflammation mediates memory loss in response to beta-Amyloid peptide accumulation. J Neurosci Res. 2018 Feb;96(2):234–246.
- Feng Q, Luo Y, Zhang XN, et al. MAPT/Tau accumulation represses autophagy flux by disrupting IST1-regulated ESCRT-III complex formation: a vicious cycle in Alzheimer neurodegeneration. Autophagy. 2019;28:1–18.
- Mizushima N. A brief history of autophagy from cell biology to physiology and disease. Nat Cell Biol. 2018 May;20(5):521–527.
- Menzies FM, Fleming A, Caricasole A, et al. Autophagy and neurodegeneration: pathogenic mechanisms and therapeutic opportunities. Neuron. 2017 Mar 8;93(5):1015–1034.
- Kimmelman AC, White E. Autophagy and tumor metabolism. Cell Metab. 2017 May 2;25(5):1037–1043.
- Levine B, Mizushima N, Virgin HW. Autophagy in immunity and inflammation. Nature. 2011 Jan 20;469(7330):323–335.
- Zaffagnini G, Martens S. Mechanisms of selective autophagy. J Mol Biol. 2016 May 8;428(9Pt A):1714–1724.
- Chu CT. Mechanisms of selective autophagy and mitophagy: implications for neurodegenerative diseases. Neurobiol Dis. 2019 Feb;122:23–34.
- Martens S, Behrends C. Molecular mechanisms of selective autophagy. J Mol Biol. 2020 Jan 3;432(1):1–2.
- Lemasters JJ. Variants of mitochondrial autophagy: types 1 and 2 mitophagy and micromitophagy (Type 3). Redox Biol. 2014;2:749–754.
- Lemasters JJ. Selective mitochondrial autophagy, or mitophagy, as a targeted defense against oxidative stress, mitochondrial dysfunction, and aging. Rejuvenation Res. 2005 Spring;8(1):3–5.
- Montava-Garriga L, Ganley IG. Outstanding Questions in Mitophagy: what We Do and Do Not Know. J Mol Biol. 2020 Jan 3;432(1):206–230.
- Katsuragi Y, Ichimura Y, Komatsu M. p62/SQSTM1 functions as a signaling hub and an autophagy adaptor. Febs J. 2015 Oct 2;282(24):4672–4678.
- Matsumoto G, Shimogori T, Hattori N, et al. TBK1 controls autophagosomal engulfment of polyubiquitinated mitochondria through p62/SQSTM1 phosphorylation. Hum Mol Genet. 2015 Aug 1;24(15):4429–4442.
- Matsumoto G, Wada K, Okuno M, et al. Serine 403 phosphorylation of p62/SQSTM1 regulates selective autophagic clearance of ubiquitinated proteins. Mol Cell. 2011 Oct 21;44(2):279–289.
- Sanchez-Martin P, Komatsu M. p62/SQSTM1 - steering the cell through health and disease. J Cell Sci. 2018 Nov 5;131(21). DOI:https://doi.org/10.1242/jcs.222836
- Pilli M, Arko-Mensah J, Ponpuak M, et al. TBK-1 promotes autophagy-mediated antimicrobial defense by controlling autophagosome maturation. Immunity. 2012 Aug 24;37(2):223–234.
- Lim J, Lachenmayer ML, Wu S, et al. Proteotoxic stress induces phosphorylation of p62/SQSTM1 by ULK1 to regulate selective autophagic clearance of protein aggregates. PLoS Genet. 2015;11(2):e1004987.
- Woo JA, Liu T, Fang CC, et al. beta-Arrestin2 oligomers impair the clearance of pathological tau and increase tau aggregates. Proc Natl Acad Sci U S A. 2020 Feb 18;117:5006–5015.
- Deng Z, Lim J, Wang Q, et al. ALS-FTLD-linked mutations of SQSTM1/p62 disrupt selective autophagy and NFE2L2/NRF2 anti-oxidative stress pathway. Autophagy. 2019 Jul 30;16(5):917–931. DOI:https://doi.org/10.1080/15548627.2019.1644076.
- Shankar GM, Bloodgood BL, Townsend M, et al. Natural oligomers of the Alzheimer amyloid-beta protein induce reversible synapse loss by modulating an NMDA-type glutamate receptor-dependent signaling pathway. J Neurosci. 2007 Mar 14;27(11):2866–2875.
- Zhao L, Ma QL, Calon F, et al. Role of p21-activated kinase pathway defects in the cognitive deficits of Alzheimer disease. Nat Neurosci. 2006 2; 9(2):234–242.
- Minamide LS, Striegl AM, Boyle JA, et al. Neurodegenerative stimuli induce persistent ADF/cofilin-actin rods that disrupt distal neurite function. Nat Cell Biol. 2000 Sep;2(9):628–636.
- Rahman T, Davies DS, Tannenberg RK, et al. Cofilin rods and aggregates concur with tau pathology and the development of Alzheimer’s disease. J Alzheimers Dis. 2014;42(4):1443–1460.
- Kim T, Vidal GS, Djurisic M, et al. Human LilrB2 is a beta-amyloid receptor and its murine homolog PirB regulates synaptic plasticity in an Alzheimer’s model. Science. 2013 Sep 20;341(6152):1399–1404.
- Woo JA, Zhao X, Khan H, et al. Slingshot-cofilin activation mediates mitochondrial and synaptic dysfunction via Abeta ligation to beta1-integrin conformers. Cell Death Differ. 2015 Feb 20. [Epub ahead of print] PMID: 25698445. DOI:https://doi.org/10.1038/cdd.2015.5
- Walsh KP, Kuhn TB, Bamburg JR. Cellular prion protein: A co-receptor mediating neuronal cofilin-actin rod formation induced by beta-amyloid and proinflammatory cytokines. Prion. 2014;8(6):375–380.
- Davis RC, Marsden IT, Maloney MT, et al. Amyloid beta dimers/trimers potently induce cofilin-actin rods that are inhibited by maintaining cofilin-phosphorylation. Mol Neurodegener. 2011 Jan 24;6:10.
- Niwa R, Nagata-Ohashi K, Takeichi M, et al. Control of actin reorganization by Slingshot, a family of phosphatases that dephosphorylate ADF/cofilin. Cell. 2002 Jan 25;108(2):233–246.
- Woo JA, Jung AR, Lakshmana MK, et al. Pivotal role of the RanBP9-cofilin pathway in Abeta-induced apoptosis and neurodegeneration. Cell Death Differ. 2012 Sep;19(9):1413–1423.
- Roh SE, Woo JA, Lakshmana MK, et al. Mitochondrial dysfunction and calcium deregulation by the RanBP9-cofilin pathway. Faseb J. 2013 Aug 27. DOI:https://doi.org/10.1096/fj.13-234765
- Jiang P, Mizushima N. LC3- and p62-based biochemical methods for the analysis of autophagy progression in mammalian cells. Methods. 2015 Mar;75:13–18.
- Dahlgren KN, Manelli AM, Stine WB Jr., et al. Oligomeric and fibrillar species of amyloid-beta peptides differentially affect neuronal viability. J Biol Chem. 2002 Aug 30;277(35):32046–32053.
- McWilliams TG, Prescott AR, Allen GF, et al. mito-QC illuminates mitophagy and mitochondrial architecture in vivo. J Cell Biol. 2016 Aug 1;214(3):333–345.
- Weidberg H, Shpilka T, Shvets E, et al. LC3 and GATE-16 N termini mediate membrane fusion processes required for autophagosome biogenesis. Dev Cell. 2011 Apr 19;20(4):444–454.
- Khaminets A, Behl C, Dikic I. Ubiquitin-Dependent And Independent Signals In Selective Autophagy. Trends Cell Biol. 2016 Jan;26(1):6–16.
- Nyfeler B, Bergman P, Wilson CJ, et al. Quantitative visualization of autophagy induction by mTOR inhibitors. Methods Mol Biol. 2012;821:239–250.
- Kimura S, Noda T, Yoshimori T. Dissection of the autophagosome maturation process by a novel reporter protein, tandem fluorescent-tagged LC3. Autophagy. 2007 Sep-Oct;3(5):452–460.
- Pankiv S, Clausen TH, Lamark T, et al. p62/SQSTM1 binds directly to Atg8/LC3 to facilitate degradation of ubiquitinated protein aggregates by autophagy. J Biol Chem. 2007 Aug 17;282(33):24131–24145.
- Cha-Molstad H, Yu JE, Feng Z, et al. p62/SQSTM1/Sequestosome-1 is an N-recognin of the N-end rule pathway which modulates autophagosome biogenesis. Nat Commun. 2017 Jul 24;8(1):102.
- Larsen KB, Lamark T, Overvatn A, et al. A reporter cell system to monitor autophagy based on p62/SQSTM1. Autophagy. 2010 Aug;6(6):784–793.
- Li L, Wang ZV, Hill JA, et al. New autophagy reporter mice reveal dynamics of proximal tubular autophagy. J Am Soc Nephrol. 2014 Feb;25(2):305–315.
- Fredriksson S, Gullberg M, Jarvius J, et al. Protein detection using proximity-dependent DNA ligation assays. Nat Biotechnol. 2002 May;20(5):473–477.
- Itakura E, Mizushima N. p62 Targeting to the autophagosome formation site requires self-oligomerization but not LC3 binding. J Cell Biol. 2011 Jan 10;192(1):17–27.
- Ciuffa R, Lamark T, Tarafder AK, et al. The selective autophagy receptor p62 forms a flexible filamentous helical scaffold. Cell Rep. 2015 May 5;11(5):748–758.
- Kurita S, Watanabe Y, Gunji E, et al. Molecular dissection of the mechanisms of substrate recognition and F-actin-mediated activation of cofilin-phosphatase Slingshot-1. J Biol Chem. 2008 Nov 21;283(47):32542–32552.
- Ramesh Babu J, Lamar Seibenhener M, Peng J, et al. Genetic inactivation of p62 leads to accumulation of hyperphosphorylated tau and neurodegeneration. J Neurochem. 2008 Jul;106(1):107–120.
- Xu Y, Zhang S, Zheng H. The cargo receptor SQSTM1 ameliorates neurofibrillary tangle pathology and spreading through selective targeting of pathological MAPT (microtubule associated protein tau). Autophagy. 2019 Apr;15(4):583–598.
- Nixon RA, Wegiel J, Kumar A, et al. Extensive involvement of autophagy in Alzheimer disease: an immuno-electron microscopy study. J Neuropathol Exp Neurol. 2005 Feb;64(2):113–122.
- Hebron ML, Algarzae NK, Lonskaya I, et al. Fractalkine signaling and Tau hyper-phosphorylation are associated with autophagic alterations in lentiviral Tau and Abeta1-42 gene transfer models. Exp Neurol. 2014 Jan;251:127–138.
- Lin WL, Lewis J, Yen SH, et al. Ultrastructural neuronal pathology in transgenic mice expressing mutant (P301L) human tau. J Neurocytol. 2003 Nov;32(9):1091–1105.
- Yoshiyama Y, Higuchi M, Zhang B, et al. Synapse loss and microglial activation precede tangles in a P301S tauopathy mouse model. Neuron. 2007 Feb 1;53(3):337–351.
- Woo JA, Liu T, Zhao X, et al. Enhanced tau pathology via RanBP9 and Hsp90/Hsc70 chaperone complexes. Hum Mol Genet. 2017 Oct 15;26(20):3973–3988.
- Levine B, Kroemer G. Autophagy in aging, disease and death: the true identity of a cell death impostor. Cell Death Differ. 2009 Jan;16(1):1–2.
- Chen H, Chan DC. Mitochondrial dynamics--fusion, fission, movement, and mitophagy--in neurodegenerative diseases. Hum Mol Genet. 2009 Oct 15;18(R2):R169–76.
- Kerr JS, Adriaanse BA, Greig NH, et al. Mitophagy and Alzheimer’s Disease: cellular and molecular mechanisms. Trends Neurosci. 2017 Mar;40(3):151–166.
- Isogai S, Morimoto D, Arita K, et al. Crystal structure of the ubiquitin-associated (UBA) domain of p62 and its interaction with ubiquitin. J Biol Chem. 2011 Sep 9;286(36):31864–31874.
- Long J, Garner TP, Pandya MJ, et al. Dimerisation of the UBA domain of p62 inhibits ubiquitin binding and regulates NF-kappaB signalling. J Mol Biol. 2010 Feb 12;396(1):178–194.
- Peng H, Yang J, Li G, et al. Ubiquitylation of p62/sequestosome1 activates its autophagy receptor function and controls selective autophagy upon ubiquitin stress. Cell Res. 2017 May;27(5):657–674.
- Lee Y, Chou TF, Pittman SK, et al. Keap1/Cullin3 Modulates p62/SQSTM1 Activity via UBA Domain Ubiquitination. Cell Rep. 2017 Apr 4;19(1):188–202.
- Pengo N, Agrotis A, Prak K, et al. A reversible phospho-switch mediated by ULK1 regulates the activity of autophagy protease ATG4B. Nat Commun. 2017 Aug 18;8(1):294.
- Bernstein BW, Bamburg JR. ADF/cofilin: a functional node in cell biology. Trends Cell Biol. 2010 Apr;20(4):187–195.
- Kim JS, Huang TY, Bokoch GM. Reactive oxygen species regulate a slingshot-cofilin activation pathway. Mol Biol Cell. 2009 Jun;20(11):2650–2660.
- Eiseler T, Doppler H, Yan IK, et al. Protein kinase D1 regulates cofilin-mediated F-actin reorganization and cell motility through slingshot. Nat Cell Biol. 2009 May;11(5):545–556.
- Maloney MT, Bamburg JR. Cofilin-mediated neurodegeneration in Alzheimer’s disease and other amyloidopathies. Mol Neurobiol. 2007 Feb;35(1):21–44.
- Woo JA, Liu T, Fang CC, et al. Activated cofilin exacerbates tau pathology by impairing tau-mediated microtubule dynamics. Commun Biol. 2019;2:112.
- Li Y, Maher P, Schubert D. A role for 12-lipoxygenase in nerve cell death caused by glutathione depletion. Neuron. 1997 Aug;19(2):453–463.
- Woo JA, Zhao X, Khan H, et al. Slingshot-Cofilin activation mediates mitochondrial and synaptic dysfunction via Abeta ligation to beta1-integrin conformers. Cell Death Differ. 2015 Jun;22(6):921–934.
- Woo JA, Liu T, Trotter C, et al. Loss of function CHCHD10 mutations in cytoplasmic TDP-43 accumulation and synaptic integrity. Nat Commun. 2017 Jun 6;8:15558.
- Stielow B, Finkernagel F, Stiewe T, et al. MGA, L3MBTL2 and E2F6 determine genomic binding of the non-canonical Polycomb repressive complex PRC1.6. PLoS Genet. 2018 Jan;14(1):e1007193.
- N’Diaye EN, Kajihara KK, Hsieh I, et al. PLIC proteins or ubiquilins regulate autophagy-dependent cell survival during nutrient starvation. EMBO Rep. 2009 Feb;10(2):173–179.
- Parker JB, Palchaudhuri S, Yin H, et al. A transcriptional regulatory role of the THAP11-HCF-1 complex in colon cancer cell function. Mol Cell Biol. 2012 May;32(9):1654–1670.
- Park BC, Shen X, Samaraweera M, et al. Studies of optineurin, a glaucoma gene: golgi fragmentation and cell death from overexpression of wild-type and mutant optineurin in two ocular cell types. Am J Pathol. 2006 Dec;169(6):1976–1989.
- Kamitani T, Kito K, Nguyen HP, et al. Characterization of NEDD8, a developmentally down-regulated ubiquitin-like protein. J Biol Chem. 1997 Nov 7;272(45):28557–28562.
- Carty N, Lee D, Dickey C, et al. Convection-enhanced delivery and systemic mannitol increase gene product distribution of AAV vectors 5, 8, and 9 and increase gene product in the adult mouse brain. J Neurosci Methods. 2010 Dec 15;194(1):144–153.