
ABSTRACT
CAV1 (caveolin 1) expression and secretion is associated with prostate cancer (PCa) disease progression, but the mechanisms underpinning CAV1 release remain poorly understood. Numerous studies have shown CAV1 can be secreted within exosome-like vesicles, but antibody-mediated neutralization can mitigate PCa progression; this is suggestive of an inverted (non-exosomal) CAV1 topology. Here we show that CAV1 can be secreted from specific PCa types in an inverted vesicle-associated form consistent with the features of bioactive CAV1 secretion. Characterization of the isolated vesicles by electron microscopy, single-molecule fluorescence microscopy and proteomics reveals they represent a novel class of exosomes ~40 nm in diameter containing ~50-60 copies of CAV1 and, strikingly, are released via a non-canonical secretory macroautophagy/autophagy pathway. This study provides novel insights into a mechanism whereby CAV1 translocates from a normal plasma membrane distribution to an inverted secreted form implicated in PCa disease progression.
Abbreviations: 3-MA: 3-methyladenine; APEX: a modified soybean ascorbate peroxidase; ATG5: autophagy related 5; ATG9A: autophagy related 9A; ATG12: autophagy related 12; BHK: baby hamster kidney; C-exosomes: caveolin-exosomes; CAMKK2/CAMKKβ: calckum/calmodulin dependent protein kinase kinase 2; CAV1: caveolin 1; DAB: 3,3′-diaminobenzidine; DAPK: death associated protein kinase; EEA1: early endosome antigen 1; EM: electron microscopy; FCS: fluorescence correlation spectroscopy; GBP: GFP/YFP-binding peptide; GFP: green fluorescent protein; GOLGA2: golgin A2; ILVs: intralumenal vesicles; LC3: microtubule-associated protein 1 light chain 3; MBP: maltose binding protein; MTORC1: mechanistic target of rapamycin kinase complex 1; MVBs: multivesicular bodies; PBS: phosphate-buffered saline; PCa: prostate cancer; PI3K: phosphoinositide 3-kinase; PM: plasma membrane; SFM: serum-free medium; TSG101: tumor susceptibility 101; WCL: whole cell lysates; WT: wild type; YFP: yellow fluorescent protein; βoG: β-octylglucoside
Introduction
Caveolae are a characteristic feature of the plasma membrane (PM) of many mammalian cell types [Citation1]. CAV1 (caveolin 1) is the major non-muscle isoform of the CAV family and is essential for caveola formation [Citation2]. CAV1 is synthesized at the endoplasmic reticulum and exported through the Golgi complex to form caveolae at the cell surface [Citation3]. PM-associated caveolae can be internalized and fuse with early endosomes before recycling back to the surface without disassembly [Citation4,Citation5]. A peripheral membrane protein, termed CAVIN1/polymerase I and transcript release factor (caveolae associated protein 1) is also required to stabilize caveolae on the PM [Citation6,Citation7]. The loss of CAVIN1 results in a switch from a largely stable pool of CAV1 at the PM to a rapidly internalized pool with increased endocytic recycling [Citation6,Citation8,Citation9]. It has been postulated that the ratio of CAV1 expression to CAVIN1 expression is a key regulator of CAV1 dynamics as this ratio is tightly regulated in different cell types and tissues [Citation8].
CAV1 overexpression correlates with advanced and metastatic prostate cancer (PCa) [Citation10–14]. A loss of CAV1 expression in the TRAMP transgenic mouse PCa model resulted in a dramatic reduction in PCa growth and metastasis [Citation15]. Moreover, PCa-associated CAV1 exists in dynamic non-caveolar membrane domains as observed in the aggressive PC3 cell line, which expresses CAV1 but not CAVIN1 [Citation6]. Heterologous expression of CAVIN1 in PC3 cells is sufficient to attenuate PCa disease progression in an orthotopic xenograft mouse model [Citation11]. In addition to reducing anchorage-independent growth and migration, CAVIN1 expression in PC3 cells altered the secretion of CAV1 [Citation16,Citation17] as well as the tumor microenvironment [Citation18]. On the other hand, heterologous expression of CAVIN1 in the less aggressive, CAV1-negative LNCaP cell line did not alter cell proliferation and migration [Citation11], indicating that CAVIN1 attenuates non-caveolar CAV1-driven PCa.
The tumor-promoting effect of CAV1 in PCa is clearly mediated by secreted CAV1 as it can be recapitulated with medium from LNCaP cells heterologously expressing CAV1 [Citation19], and can be inhibited by antibodies to CAV1 in cultured cell systems and mouse models [Citation12,Citation20]. PCa cell-secreted CAV1 has been shown to enhance cancer cell survival, to stimulate PCa cell proliferation [Citation20], and to have pro-angiogenic effects [Citation21]. Moreover, serum CAV1 is elevated in PCa patients compared with control men or men with benign prostatic hyperplasia [Citation22], and is a potential prognostic marker for PCa recurrence after prostatectomy [Citation23]. However, the mechanism(s) of altered CAV1 secretion in PCa regulated by non-caveolar CAV1 or CAVIN1 remain to be elucidated.
Considerable evidence from the literature shows that CAV1 can associate with exosomes [Citation14,Citation16,Citation19,Citation24–26] and is highly secreted within exosomes derived from PC3 cells [Citation16,Citation27,Citation28]. Exosomes are formed in the endocytic pathway and comprise a subset of intralumenal vesicles (ILVs) within the multivesicular bodies (MVBs) [Citation29]. The ~100-200 nm vesicles are released from the cell when MVBs fuse with the cell surface [Citation30]. As the exosome is a membrane-bound vesicle, integral membrane proteins are released from the cell within a membrane bilayer in an energetically favorable lipid environment [Citation31]. However, an exosome release model for secretion of bioactive CAV1 is consistent with some, but not all, published data. First, exosomes are typically sedimented from the medium at 100,000 x g, however several studies have reported that secreted CAV1 is not pelleted under these conditions [Citation12,Citation19]. Second, antibodies against CAV1 have been shown to inhibit the effect of secreted CAV1 [Citation12,Citation19,Citation20]: a released exosome would contain all exposed CAV1 epitopes masked within the lumen of the vesicle, which is topologically equivalent to the cytoplasm. Third, CAV1 has been demonstrated to be secreted through other non-classical means in numerous studies via an undefined mechanism [Citation32,Citation33].
To dissect the molecular mechanisms of CAV1 release, we used a variety of biochemical assays and microscopy-based imaging techniques to interrogate two well-characterized PCa cell lines: LNCaP cells express neither CAV1 nor CAVIN1, which correlates with early PCa, and PC3 cells, which express non-caveolar CAV1 and correlates with advanced PCa. Strikingly, while CAV1 is released within conventional exosomes from PC3 cells, it is secreted from LNCaP cells with an inverted topology. We demonstrate that intracellular Ca2+ levels affect secretion, and isolate and characterize the novel secreted vesicles from LNCaP cells; here termed C-exosomes (CAV/caveolin-exosomes). We show by electron microscopy (EM) that C-exosomes are regular spherical structures of ~40 nm in diameter that are highly enriched in CAV1 as demonstrated by tandem mass spectrometry proteomics analysis. Using single molecule fluorescence spectroscopy, we reveal that each C-exosome released from LNCaP cells consists of 50–60 CAV1 molecules. Finally, we provide direct evidence that the release of C-exosomes from LNCaP cells stems from a non-classical autophagy-based mechanism. These observations identify a non-conventional pathway for the release of a novel antibody-accessible CAV1 vesicle which have important implications for prostate cancer.
Results
CAV1 is secreted in an antibody-accessible form from LNCaP cells
Antibody-mediated neutralization of CAV1 has been demonstrated to inhibit PCa disease progression [Citation12,Citation20]. This is inconsistent with a conventional exosomal release as CAV1 epitopes secreted within exosomes should be concealed within the lumen of the vesicle and inaccessible for antibody neutralization. To date CAV1 secretion has been most extensively studied in PC3 cells where CAV1 is known to co-fractionate with protein markers of conventional exosomes [Citation16,Citation28]. Intriguingly, LNCaP cells expressing CAV1 have been shown to recapitulate the action of a bioactive form of CAV1 implicated in prostate cancer progression [Citation19] but it is currently unknown how CAV1 secretion occurs and what topology CAV1 adopts when released from these cells. To interrogate the pathway of release we first analyzed the secretion of CAV1 from both PCa cell lines.
LNCaPs have variable levels of endogenous CAV1 expression; high passage LNCaP cells have been shown to have elevated expression and secretion of CAV1, yet low passage LNCaPs in the same study were shown to have no endogenous CAV1 expression [Citation12]. Therefore, to evaluate the pathway of CAV1 secretion from LNCaP cells we have made use of a transient overexpression system to reliably study CAV1 secretion as has been used in other studies in vitro and in vivo [Citation11,Citation19]. As PC3 cells express and secrete endogenous CAV1 at reliably high levels we have performed the subsequent comparisons between untransfected PC3s and LNCaP cells transiently expressing CAV1. The expression levels of endogenous CAV1 in PC3 cells and YFP-CAV1 in LNCaP cells are comparable (Fig. S1A).
Secreted vesicles were isolated from conditioned media by sequential centrifugations at 180 x g for 5 min, 1,900 x g for 20 min, and 14,000 x g for 35 min to remove cellular debris, and then ultracentrifugation at 100,000 x g for 60 min. To confirm that this purification method resulted in a sufficiently clean preparation of exosomes, we first analyzed secreted vesicles from PC3 cell conditioned media by western blot analysis. The pelleted fraction (P100) from PC3 cells demonstrated abundant CAV1 protein () without contamination from other cellular compartments. Western blotting confirmed that protein markers of the Golgi complex, the nucleus, the cytoplasm and endosomes were absent (), however, ACTB/β-actin, TUBA/α-tubulin, FLOT1 (flotillin 1) and CAV1 () were all present as previously described for PC3 cell exosome preparations [Citation16,Citation28,Citation34–36]. In addition, NUP62 (nucleoporin 62) was absent in LNCaP P100 and supernatant (S100) fractions (Fig. S1B). These data demonstrate this method is sufficient for generating a pure preparation of PCa cell exosomes.
Figure 1. CAV1 is released in a novel form from LNCaP cells. (A) Western blots of PC3 cells P100 fractions demonstrating the ultracentrigation purification method used in this study is not contaminated with subcellular protein markers. Cells were incubated in serum free medium (SFM) for 16 h prior to the ultracentrigation. EEA1 (early endosome antigen 1), STX6 (syntaxin 6), GOLGA2, NUP62 and phosphoinositide 3-kinase (PI3K) were absent from the P100 fraction in PC3 cells. Protein markers of exosomes including FLOT1, ACTB/β-actin and TUBA/α-tubulin were detected by western blot. (B) Western blot analysis and quantification of released CAV1 in P100 and S100 fractions were performed after PC3 cells were serum starved for 16 h. CD63 and CAV1 were enriched in the P100 fraction whereas CAV1 was absent from the S100 fraction. (C) Western blot and quantification of the release of CAV1 from LNCaP cells transiently expressing CAV1 after 16-h serum starvation. A proportion of CAV1 is observed in both the P100 and S100 fractions after ultracentifugation. (D) Western blot of sucrose gradients from 0 M to 2 M of P100 fractions from PC3 cells serum-starved for 16 h showing CAV1 fractionates at higher densities and co-fractionates with exosomal protein markers. (E) EM of sucrose gradient fractions stained with 0.4% uranyl acetate mounted in 2% methyl cellulose. Peak exosomal morphology correlated with peak CAV1 protein levels. Left panel: fraction 7, right panel: fraction 8. Scale bars: 200 nm. (F) Sucrose gradients of P100 and S100 fractions isolated from LNCaP cells starved for 48 h demonstrating CAV1 is highly abundant in the S100 fraction consistently and fractionates at lower densities compared to CAV1 present in the P100 fraction and CAV1 secreted from PC3 cells. All western blots are representative blots chosen from three independent replicates
As previous studies have demonstrated differences between the biophysical properties of exosomes isolated from PC3 cells compared to LNCaP cells we next assayed the relative abundance of CAV1 secreted into the P100 and S100 fractions between these two cell lines. CAV1 and CD63 (a protein marker of multivesicular bodies and exosomes) levels were analyzed by western blot. In PC3 cells the amount of CAV1 released was proportionally small in the P100 fraction compared to the total cellular level of expressed protein only representing 0.03% of total cellular levels; no CAV1 protein was detected in the S100 fraction (). In contrast, LNCaP cells demonstrated a different profile for CAV1 secretion with a larger proportion of total CAV1 protein present in the released fractions; 1.55% of total cellular CAV1 was in the P100 fraction and 1.13% released into the S100 fraction (). Given the difference in secretion profiles between released CAV1 from PC3 cells and LNCaP cells, we next dissected the biochemical properties of secreted CAV1 from each cell line in greater detail using sucrose gradient fractionation. CAV1 in the P100 fraction derived from PC3 cells demonstrated an abundance of CAV1 protein in higher density fractions with peak protein concentration (between steps 7 to 11). Moreover, CAV1 secreted from PC3 cells co-fractionated with protein markers of exosomes and peak CAV1 levels closely correlated with peak exosomal morphology by EM (). In contrast, sucrose gradient centrifugation demonstrated a significantly different fractionation profile for CAV1 isolated from LNCaP cells. CAV1 demonstrated wide-ranging densities from (steps 4 to 11) in the P100 fraction with a constrained low-density peak observed between steps 4 to 7 in the S100 fraction (). A time course of CAV1 release from PC3 cells demonstrated the presence of serum did not impact upon the dynamics of CAV1 secretion into the media (Fig. S1C) which indicates that PC3 cell secretion of CAV1 does not originate from CAV1-positive exosomes present in the serum. These data confirm that CAV1 present in the S100 fraction from conditioned media isolated from LNCaP cells is biochemically distinct from the exosomal form isolated from PC3 cells.
To determine if the CAV1 particle secreted from LNCaP cells resembles the bioactive form of CAV1 in prostate cancer, we analyzed the topology of the protein using immunoprecipitation. CAV1 was successfully immunoisolated from the S100 fraction from LNCaP cells using a polyclonal antibody against the CAV1 N terminus (). The pulldown of CAV1 from the S100 fraction was not dependent on pre-treatment with Triton X-100 (TX100), indicating that CAV1 is present in the S100 fraction in an exposed form (). To determine the topographic organization of CAV1 released from these cells, we performed pulldown analyses with GFP-trap using an N-terminal YFP-CAV1 construct and a C-terminal CAV1-GFP construct. Both the N- () and C-termini () were available for pulldown by anti-CAV1 antibodies and GFP-trap. To validate the orientation of CAV1 isolated from PC3 cells we immunoisolated exosomes from the media (after the 14,000 x g centrifugation step) using anti-CD63 and polyclonal anti-CAV1 antibodies. CAV1 was detected in immunoprecipitated CD63-positive exosomes (). Strikingly, the co-immunoprecipitation of CAV1 with CD63 was dependent on an intact membrane, as detergent treatment resulted in the loss of CAV1 affinity isolation by the anti-CD63 antibody (). We next performed immunoprecipitation of the P100 fraction using an antibody against the N terminus of CAV1. We could not pull-down CAV1 from the P100 fraction in the absence of detergent treatment but, in the presence of βoG (β-octylglucoside) and TX100, CAV1 was successfully immunoisolated (). This strongly argues CAV1 is not available on the external leaflet of the exosome for antibody binding when secreted from PC3 cells but is secreted in an antibody-accessible form in the S100 fraction from LNCaP cells.
Figure 2. LNCaP cells release CAV1 in an antibody-accessible form. (A) Western blot of an immunoprecipitation of CAV1 from the S100 fraction of LNCaP cells with 48-h serum starvation with an α-CAV1 antibody demonstrating CAV1 can be immunoisolated in the absence of detergent. (B-D) CAV1 in the S100 fraction from LNCaP cells with 24-h serum starvation can be pulled down by anti-CAV1 antibodies and GFP-trap binding to fusion tags at both the N- and C-termini of CAV1 without detergent treatment. No tagged CAV1 was used as a negative control for GFP-trap in Figure 2D. (E) Immunoprecipitation of culture medium from 16-h serum-starved PC3 cells with an α-CD63 antibody results in the pulldown of CAV1 in the absence of detergent whereas immunoprecipitation with an anti-CAV1 antibody does not result in the isolation of CAV1 unless pre-treated with a detergent. (F) Western blot demonstrating pulldown of CAV1 from the P100 fraction of PC3 cells with 16-h serum starvation is dependent on detergent treatment. All western blots are representative blots chosen from three independent replicates
To further confirm these results, we performed protease-protection assays against the S100 fraction from LNCaP cells and the P100 fraction from PC3 cells. In PC3 cells, CAV1 was partially digested only when detergent treated, (Fig. S2A) consistent with previous observations [Citation37]. In contrast, the recognition epitope of CAV1 was completely absent after incubation with proteinase K (ProK) in the absence of detergent treatment in LNCaP S100 preparations (Fig. S2B). The complete loss of the recognition epitope after ProK treatment suggests the N terminus of CAV1 may adopt an as yet undescribed topology in the membrane.
Taken together these data suggest that CAV1 is released from LNCaP cells in an atypical form, which we now term C-exosomes (CAV/caveolin-exosomes), that biophysically and topologically resemble the pro-angiogenic particles proposed to have autocrine and paracrine functions in prostate cancer models [Citation12,Citation19,Citation22,Citation23,Citation38].
CAVIN1 expression and caveolae formation inhibit the secretion of CAV1 from PCa cells
The conventional release of exosomes from the cell involves the sorting of proteins from the endosome into ILVs, the formation, fission and accumulation of ILVs within MVBs, and the subsequent fusion of MVBs with the PM. Calcium signaling has been shown to be important for the release of proteins through conventional exosomal pathways [Citation39]. To gain a more detailed understanding of the pathway underpinning CAV1 release in LNCaP cells, we assessed the role of Ca2+-mediated membrane fusion. To determine the calcium-dependence of CAV1 secretion from LNCaP cells we analyzed the dependence of CAV1 secretion in both the S100 and P100 fractions with treatment by the calcium ionophore, ionomycin. show a rapid and preferential release of CAV1 in the S100 fraction compared to the P100 fraction in response to ionomycin treatment. A slower but similar release was observed from the P100 fraction observed in PC3 cells (Fig. S3A-B). This data suggests that calcium is important for the release of CAV1 from prostate cancer cells.
Figure 3. Regulated release of CAV1 from LNCaP cells. (A) Western blot of CAV1 release from LNCaP cells stimulated with ionomycin. Cells were treated with 500 nM ionomycin in serum free media for various times (0 to 4 h). (B) Peak release of CAV1 was observed after 1 h of treatment. Preferential release of CAV1 in the S100 fraction (compared to the P100 fraction) was observed and did not correlate with the release of LDH. A similar stimulation was observed for PC3 cells (see Fig. S5 A and B). (C) LNCaP cells expressing GFP-RAB5Q79L; CAV1 is sorted into RAB5-positive endosomes in the absence of CAVIN1 expression, scale bar: 10 μm. (D) CAVIN1 expression sequesters and stabilizes CAV1 at the PM within caveolae, scale bar: 10 τm. (E) Western blots of CAV1 levels in the P100 and S100 fractions with or without CAVIN1-GFP expression in LNCaP cells following 16-h serum starvation. (F) Quantification of western blots of the P100 and S100 fractions of CAVIN1 expressing LNCaP cells compared to GFP expression alone. CAVIN1 resulted in a reduction in CAV1 release in both fractions without altering LDH levels. n = 4; error bars represent SEM. We also confirmed that CAVIN1 expression in PC3 cells (also devoid of CAVIN1 expression [Citation6]) reduced internalization and secretion of CAV1 (see Fig. S3). (G) Quantification of CAV1-positive GFP-RAB5Q79L endosomes demonstrates the expression of CAVIN1 significantly reduced the internal pool of CAV1. Statistical significance was determined by two-tailed t tests; p = 0.0011, n = 3, error bars represent SEM
![Figure 3. Regulated release of CAV1 from LNCaP cells. (A) Western blot of CAV1 release from LNCaP cells stimulated with ionomycin. Cells were treated with 500 nM ionomycin in serum free media for various times (0 to 4 h). (B) Peak release of CAV1 was observed after 1 h of treatment. Preferential release of CAV1 in the S100 fraction (compared to the P100 fraction) was observed and did not correlate with the release of LDH. A similar stimulation was observed for PC3 cells (see Fig. S5 A and B). (C) LNCaP cells expressing GFP-RAB5Q79L; CAV1 is sorted into RAB5-positive endosomes in the absence of CAVIN1 expression, scale bar: 10 μm. (D) CAVIN1 expression sequesters and stabilizes CAV1 at the PM within caveolae, scale bar: 10 τm. (E) Western blots of CAV1 levels in the P100 and S100 fractions with or without CAVIN1-GFP expression in LNCaP cells following 16-h serum starvation. (F) Quantification of western blots of the P100 and S100 fractions of CAVIN1 expressing LNCaP cells compared to GFP expression alone. CAVIN1 resulted in a reduction in CAV1 release in both fractions without altering LDH levels. n = 4; error bars represent SEM. We also confirmed that CAVIN1 expression in PC3 cells (also devoid of CAVIN1 expression [Citation6]) reduced internalization and secretion of CAV1 (see Fig. S3). (G) Quantification of CAV1-positive GFP-RAB5Q79L endosomes demonstrates the expression of CAVIN1 significantly reduced the internal pool of CAV1. Statistical significance was determined by two-tailed t tests; p = 0.0011, n = 3, error bars represent SEM](/cms/asset/c1fbc2bc-9d1f-4404-abf9-6cef7a76960a/kaup_a_1820787_f0003_oc.jpg)
In view of the antibody-accessible topology of CAV1 released from LNCaP cells, we next interrogated the mechanistic requirements underlying the release of this novel form. To dissect the requirements for the release of CAV1 we analyzed the importance of CAVIN1 expression as CAVIN1 is structurally required for caveolar biogenesis/stability [Citation6], regulates CAV1 internalization [Citation9] and is not expressed in LNCaP or PC3 cells [Citation11,Citation18]. LNCaP cells were transiently transfected with the GFP-RAB5Q79L point mutant, which is a GTPase-deficient RAB5 that stimulates early endosome fusion [Citation40]. This point mutant results in the formation of larger endosomes that are readily resolvable by confocal fluorescence microscopy. Using this assay, we performed a quantitative assessment of the relative internalized pool of CAV1 with and without CAVIN1-Flag co-expression. The expression of CAVIN1 significantly inhibited the internalization of CAV1 in LNCaP cells (; quantification of the ratio of PM CAV1 v.s. cytoplasmic CAV1 in Fig. S3H) and PC3 cells (Fig. S3C-E). These data suggest that expression of CAVIN1-mediated sequestration of CAV1 at the PM inhibits intracellular accumulation.
We further tested if CAVIN1 expression was sufficient to reduce the release of CAV1. We generated stable LNCaP cell lines expressing CAVIN1-GFP or GFP alone with transient expression of CAV1-Cherry. CAVIN1-GFP expression (compared to GFP alone) resulted in a dramatic reduction in the release of CAV1-Cherry in both the S100 (73% ± 9) and P100 (47% ± 15) fractions (n = 4; representative blots in ; quantified in ) suggesting that CAVIN1 expression sequesters CAV1 within caveolae at the PM resulting in reduced secretion into the extracellular space. A similar reduction in CAV1 secretion was observed upon CAVIN1 expression in PC3 cells by western blot analysis (Fig. S3F-G). Taken together these data indicate that intracellular Ca2+ levels affect CAV1 release, and that CAV1 secretion is negatively regulated by CAVIN1 expression.
Molecular and ultrastructural analysis of CAV1 released from LNCaP cells
Our results have demonstrated an N-terminal YFP-tag is sufficient to immunoisolate CAV1 from the S100 fraction of LNCaP cells. We used this observation to gain insights into the molecular composition and structure of C-exosomes to determine the origin of their release. Initial experiments successfully used GFP-trap beads to isolate YFP-CAV1 from S100 fraction of LNCaP cells, however, the yields were low. We went on to optimize purification with MBP-tagged GFP-trap, purified on amylose resin column, eluted with maltose buffer, and then concentrated in 100-kD cutoff centricon filters. Proteomic analysis was performed on three biological replicates of YFP-CAV1 particles purified from LNCaP conditioned media, compared to YFP expression alone. A total of 453 proteins were identified across the 6 samples (Table S1), most not consistently detected across replicates, indicative of nonspecific interactions. Strikingly, only 2 proteins were significantly different (p < 0.05) between YFP-CAV1 and YFP groups across the 3 replicates: CAV1, as expected, and SYNGR2 (synaptogyrin 2). This protein has previously been implicated in endocytic and synaptic vesicle formation [Citation41,Citation42]. Importantly, the lack of commonly observed exosomal proteins such as FLOT1, FLOT2 (flotillin 2), or TSG101 (tumor susceptibility 101) further confirms that YFP-CAV1 particles are not released as conventional exosomes.
We further characterized the released particles by EM. The particles (still with MBP tagged GFP-trap attached) were spherical in structure, uniform in diameter and morphology () measuring ~36 nm from inner membrane to inner membrane (the outer diameter was not measured because it includes the MBP-GFP-trap bound to YFP-CAV1); smaller than conventional exosomes (~100-200 nm) and plasma membrane caveolae (50 to 80 nm). To obtain a quantitative understanding of the number of CAV1 proteins per C-exosome we used fluorescence correlation spectroscopy (FCS) [Citation43]. YFP-CAV1 positive particles were isolated and analyzed under the same conditions as YFP alone (as a calibration factor). One hundred curves of 10s were acquired for YFP and the diffusion time was plotted (); the data show a narrow distribution of residence times centered at 95 μsec. YFP-CAV1 however demonstrated a broader distribution of residence times ~800 μsec () approximately 7.5 times the size of the YFP monomer. Using these values, an approximation of particle size can be gained by comparison with the size of YFP (~5.5 nm) at ~40-45 nm, close to the measured diameter from negative staining EM.
Figure 4. High-resolution analyses of C-exosomes and YFP-CAV1 in LNCaP cells. (A) EM of YFP-CAV1 isolated from LNCaP media demonstrates particles are regularly shaped vesicles. Inset shows high-magnification image of stained LNCaP particles with a prominent coat on the external leaflet, which includes the YFP fusion and GFP-trap with a maltose binding protein tag. Scale bar: 500 nm. (B-D) Single molecule analysis of YFP-CAV1 released from LNCaP cells. (B) Control analysis of YFP alone demonstrates a residence time of approximately 95 μsec. (C) Analysis of the residence time of YFP-CAV1 demonstrates a 7.5-fold increase in the residence time compared to YFP alone. (D) Plot of burst brightness against the number of bursts of that brightness demonstrates the maximum number of YFP-CAV1 molecules per vesicle to range between 50–60 proteins. (E-I) EM analyses of YFP distribution in cells using APEX-GBP expressing YFP-tagged constructs. (E) Co-expression of YFP-CAV1 and APEX-GBP demonstrates morphologically typical localization of CAV1 in BHK cells at caveolae on the PM of expressing cells. Arrows denote the caveolae with enriched electron density by the association of APEX-GBP. Cav: caveolae, scale bar: 500 nm. F) The co-expression of YFP and APEX-GBP demonstrates a cytoplasmic distribution for YFP alone. Scale bar: 500 nm. G) Lower magnification image of an LNCaP cell transfected with APEX-GBP and YFP-CAV1. Arrowheads highlight small vesicles with very strong reaction products that were absent from BHK cells. PM: plasma membrane, M: mitochondria, En: endosome. H) Small YFP-CAV1 enriched vesicle surrounded by ER. Scale bar: 100 nm. I) High-magnification image of an YFP-CAV1 shows vesicles are membrane bound. Scale bar: 100 nm. J) LNCaP cell expressing YFP-CAV1 and APEX-GBP serum starved to increase basal autophagy prior to fixation. High magnification image showing an autophagosome (AP) completely engulfing a YFP-CAV1 positive vesicle (arrow). Scale bar: 200 nm Electron micrographs are representative images; each LNCaP experiment was independently replicated three times

Analysis of the predicted size distribution demonstrates the YFP-CAV1 particles released by LNCaP cells are highly defined in size and number when compared to random aggregation, which possesses broader distribution and diffusion values (> 10,000 μsec) [Citation43]. We then used single molecule counting to estimate the number of proteins contained in the YFP-CAV1 particles [Citation44]. Plotting the brightness of bursts against the number of bursts of that brightness, released YFP-CAV1 showed a large maximal amplitude of about 4,500 photons (). As a single YFP protein can generate a maximum of 90 photons under the same conditions, this yields a relative value of approximately 50 to 60 units YFP-CAV1 proteins per C-exosome. These data demonstrate YFP-CAV1 is released from LNCaP cells as a regular, spherical vesicle comprising 50–60 proteins per particle in a form that is different from conventional exosomes and caveolae.
To further characterize CAV1 secreted from LNCaP cells, we performed EM with APEX-GBP; a modular method for the high-resolution detection of subcellular protein distributions [Citation45]. APEX-GBP is an expression vector with a modified soybean ascorbate peroxidase tag [Citation46] linked to a high affinity GFP/YFP-binding peptide [Citation47]. The APEX-tag generates an osmiophillic polymer when the diaminobenzoic acid (DAB) reaction is performed in the presence of H2O2; this insoluble polymer is contrasted by osmium tetroxide post-fixation which allows for the detection of any GFP- or YFP-tagged protein to an approximate 10 nm resolution [Citation45]. To confirm the expression of YFP-CAV1 and APEX-GBP is non-disrupting, we first expressed these constructs in the non-PCa line, baby hamster kidney (BHK) cells, which endogenously express CAVIN1. The co-transfection of YFP-CAV1 with APEX-GBP resulted in a normal CAV1 distribution with enriched electron density at the PM, specifically at caveolae with minimal electron density at intracellular structures (). We next examined the expression of YFP alone or YFP-CAV1 with APEX-GBP in LNCaP cells. YFP co-transfection with APEX-GBP resulted in soluble/cytoplasmic electron density with no enrichment at membrane compartments (). YFP-CAV1 co-expression with APEX-GBP in LNCaP cells resulted a broad distribution of subcellular localizations with CAV1 occasionally detected at flat PM and at endosomes (black arrowheads). Intriguingly, YFP-CAV1 was highly abundant at small (~31 ± 8 nm internal diameter) intracellular vesicular structures of regular size and shape that were completely disconnected from the PM and other membrane-bound cellular compartments. The electron density generated by the APEX-tag and the DAB reaction demonstrated that the topology of YFP-CAV1 in these small particles was consistent with exposure on the cytoplasmic face of these vesicles () and were morphologically similar in size and shape to those imaged by negative staining.
The distribution of YFP-CAV1 was markedly different in PC3 cells. CAV1 was abundant on flat PM but predominantly decorated the cytoplasmic face of endosomal compartments () and with striking density inside intraluminal vesicles accumulating within endosomes (). Furthermore, profiles consistent with endosomes fusing with the PM to release YFP-CAV1:APEX-GBP-rich vesicles were regularly observed () as well as exosomes positive for YFP-CAV1 on the external surface of PC3 cells ().
Figure 5. CAV1 expression in PC3 results in predominantly endosomal localization by APEX-GBP and EM. EM analysis of YFP distribution in cells using APEX-GBP expressing YFP-tagged constructs. (A) The co-expression of YFP and APEX-GBP results in soluble reaction product localized to the cytoplasm of transfected cells. Asterisk denotes the electron density of an untransfected adjacent cell, PM = plasma membrane, M = mitochondria, scale bar: 500 nm. (B) Electron micrograph of a PC3 cell co-transfected with YFP-CAV1 and APEX-GBP. Electron density shows significant enrichment of CAV1 at endosomes (white arrows), the plasma membrane (black arrow) and less frequently small vesicular structures in the cytoplasm (black arrowhead). En: endosome, PM: plasma membrane, scale bar: 500 nm. (C-E) ILVs (white arrowheads) and secreted ILVs/exosomes (red arrowheads) highly enriched with YFP-CAV1 and APEX-GBP inside endosomes and outside the cell. Scale bars: 500 nm. Electron micrographs are representative images; each PC3 experiment was independently replicated two times
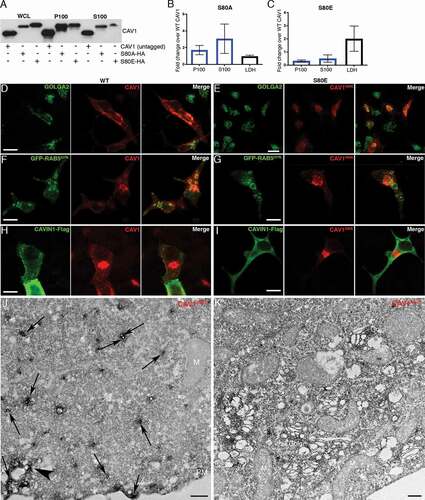
In view of these observations we speculated that CAV1 may drive the formation of 30–40 nm C-exosomes in the LNCaP cytoplasm through the protein’s ability to sculpt membranes [Citation48]. We interrogated this model by comparing secretion of wild-type (WT) CAV1 with secretion of the CAV1S80E point mutant, which inhibits CAV1 membrane sculpting by reducing membrane affinity in a bacterial system [Citation37,Citation48] and cholesterol binding in a mammalian system [Citation49]. The expression of the S80A point mutant, which increases cholesterol affinity [Citation49] and is non-disrupting in the bacterial system [Citation48], resulted in a modest increase in the release of CAV1S80A compared to the release of WT CAV1 (). However, the expression of the CAV1S80E point mutant resulted in a two-fold reduction in released CAV1 (). Confocal microscopy demonstrated that the S80E mutant was exclusively localized to the Golgi complex [as determined by co-localization with GOLGA2 (golgin A2)], whereas the WT construct was only partially colocalized with this organelle marker ( and E; n = 3, quantification of colocalization in Fig. S4). WT CAV1 was efficiently sorted into endosomes, as determined by co-transfection with GFP-RAB5Q79L, but CAV1S80E was unable to accumulate within RAB5Q79L-positive compartments. Additionally, the expression of CAVIN1 did not result in the redistribution of CAV1S80E to the cell surface unlike the WT CAV1 (). These data suggest that cholesterol binding is essential for the trafficking of CAV1 out of the Golgi complex for secretion into the extracellular space. To confirm this, we utilized APEX-GBP to examine the distribution of CAV1S80E at the EM level. The S80A mutant efficiently generated the cytoplasmically-localized ~35-nm vesicles (), was lowly abundant at cell surface and on endosomes similar to the WT CAV1 (). CAV1S80E however, was unable to efficiently generate these vesicles and remained almost completely associated with the Golgi complex ().
Figure 6. CAV1 mutants are differentially released from LNCaP cells. (A) Western blot of the S100 and P100 fractions of CAV1 released from S80A and S80E expressing LNCaP cells with 16-h serum starvation. (B) A relative increase in the release of the S80A in both the P100 and S100 fractions was observed compared to WT (n = 3). (C) A relative reduction in the release of the S80E mutant was observed compared to WT. While LDH levels were increased with the expression of the CAV1S80E mutant, this would likely result in a corresponding increase in the nonspecific release of. Despite this, a two-fold reduction in secreted CAV1 levels were observed. (D) WT CAV1 partially co-localizes with GOLGA2 at the Golgi complex, scale bar: 10 τm. (E) The S80E mutant is almost exclusively localized to the Golgi complex, scale bar: 20 τm. (F) WT CAV1 is sorted into GFP-RAB5Q79L positive compartments, scale bar: 10 τm. (G) S80E mutant is not efficiently sorted into GFP-RAB5Q79L-positive endosomes, scale bar: 10 τm. (H) CAVIN1-Flag expression stabilizes CAV1 in punctate structures at the PM of LNCaP cells, scale bar: 10 τm. (I) CAVIN1-Flag expression does not stabilize CAV1 at the surface of LNCaP cells and CAVIN1 remains cytoplasmic/soluble when co-transfected with the S80E mutant, scale bar: 10 τm. (J) LNCaP cells demonstrating the S80A point mutant efficiently generated C-exosome precursors in the cytoplasm. C-exosomes = black arrows. Scale bar: 500 nm. (K) LNCaP cells expressing YFP-CAV1S80E mutant construct. The point mutation predominantly is localized to the Golgi complex and is inefficient in generating small CAV1-rich vesicles. Scale bar: 500 nm. Fluorescent images are representative images from three independent replicates. Electron micrographs are representative images; each LNCaP experiment was independently replicated three times
Taken together, the characterization of C-exosomes released by LNCaP cells indicate the particles isolated from the S100 fraction (i) are not caveolae released from lysed cells, (ii) are not conventional exosomes equivalent to CAV1 released by PC3 cells, (iii) have an inverted topology consistent with the bioactive form of CAV1 involved in prostate cancer, and (iv) mutations in CAV1 that decrease membrane sculpting cause retention in the Golgi complex and inhibit CAV1 secretion.
Autophagy is critical for the release of CAV1 from LNCaP cells
Autophagy has been previously implicated in the release of proteins through atypical pathways [Citation50–54] and several studies have linked degradation of CAV1 to autophagy [Citation55–59]. Our EM studies demonstrated abundant small vesicles positive for CAV1 in the cytoplasm of expressing cells. We hypothesized these vesicles may be secreted after engulfment by the maturing autophagosome and then released from the cell [Citation50–54]. Therefore, we first performed immunofluorescence and labeled endogenous LC3B, a marker of autophagosomes [Citation60], in YFP-CAV1 expressing LNCaP cells. YFP-CAV1 showed colocalization with LC3B-positive puncta () that were not overlapping with early (EEA1) and late (RAB7) endosome makers (Fig. S5A-B), indicating the specificity of LC3B as an autophagosome marker and the sorting of CAV1 into the autophagosomes in LNCaP cells. In addition, the colocalization between stably expressed CAV1-GFP and LC3B vesicles in LNCaP cells was observed (Fig. S5C), which excludes the possibility of the shift of CAV1 distribution into the autophagosomes caused by over-expression. In contrast, little YFP-CAV1 was distributed in LC3B-positive vesicles in PC3 cells (Fig. S5D).
Figure 7. CAV1 secretion from LNCaP cells is mediated by an autophagy-dependent pathway. (A) Representative confocal microscopy images from three independent experiments showing co-localization between YFP-CAV1 and LC3B in LNCaP cells with or without 6-h serum starvation. Endogenous LC3B was immuno-stained with rabbit anti-LC3B primary antibodies followed by a secondary Alexa555 fluorescent labeling. Knockdown of ATG5, ATG9A or ATG12 and 3-MA (5 mM, 6 h) treatment rescued YFP-CAV1 expression and inhibited autophagosome formation. Single channel images were converted to black and white and the contrast was inverted. The enlarged region demonstrates the overlapping distribution between YFP-CAV1 and LC3B. Scale bar: 10 τm. (B) Quantification of the number of LC3B vesicles in the confocal images. One-way ANOVA was performed for statistical analysis from three experiments, n ≥ 50 cells for each experiment. (siScrambled fed vs. siScrambled starved: p = 0.0003; siATG5 starved vs. siScrambled starved: p = 0.0013; siATG9A starved vs. siScrambled starved: p = 0.0022; siATG12 starved vs. siScrambled starved: p = 0.0005; 3-MA starved vs. siScrambled starved: p = 0.0014). (C) Representative western blots showing YFP-CAV1 protein levels in WCL and S100 fractions of LNCaP cells equivalently transfected with YFP-CAV1 (10 τg DNA per 150 × 25 mm dish). The knockdown efficiency was assessed by the detection of ATG5, ATG9A and ATG12 protein levels. (D) The ratio of LC3B-II:LC3B-I (LC3B-II:I) was calculated as an indicator of autophagic levels in each group. A significant increase in the LC3B-II:I ratio of the serum-starved siScrambled cells (2.8) compared to the fed siScrambled cells (1.3) indicates the induction of autophagy. One-way ANOVA was performed for statistical analysis from three experiments. (siScrambled fed vs. siScrambled starved: p = 0.0262; siATG5 starved vs. siScrambled starved: p = 0.0307; siATG9A starved vs. siScrambled starved: p = 0.0497; siATG12 starved vs. siScrambled starved: p = 0.0223; 3-MA starved vs. siScrambled starved: p = 0.0137). (E) Densitometry analysis of western blots shown in (D) demonstrate that the co-transfection with ATG5, ATG9A or ATG12 siRNAs and 3-MA treatment significantly (siATG5 starved vs. siScrambled starved: p = 0.0047; siATG9A starved vs. siScrambled starved: p < 0.0001; siATG12 starved vs. siScrambled starved: p = 0.0031; 3-MA starved vs. siScrambled starved: p < 0.0001) rescued the downregulation of YFP-CAV1 (siScrambled fed vs. siScrambled starved: p = 0.0246) in the WCL of serum-starved cells compared to the fed cells. One-way ANOVA was performed for statistical analysis. (F) The secretion (%) of YFP-CAV1 into the S100 fraction from LNCaP cells was significantly upregulated (siScrambled fed vs. siScrambled starved: p = 0.0011) upon serum starvation. The blockage of serum starvation-induced autophagy via ATG5, ATG9A, ATG12 knockdowns or 3-MA treatment downregulated the secretion levels of YFP-CAV1. Statistically-significant effects (one-way ANOVA) were observed in ATG9A siRNA (siATG9A starved vs. siScrambled starved: p = 0.0152), ATG12 siRNA (siATG12 starved vs. siScrambled starved: p = 0.0056) and 3-MA (3-MA starved vs. siScrambled starved: p = 0.0007) treated groups
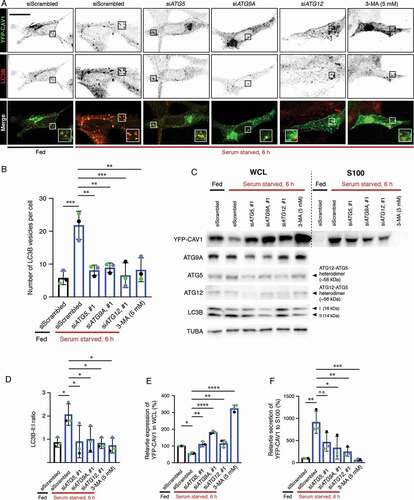
Next, we utilized small interfering RNA directed against the genes encoding ATG (autophagy related) proteins ATG5, ATG9A and ATG12 that function at different stages of autophagy to investigate a potential role in CAV1 clearance. ATG9A is an upstream autophagic factor that is responsible for the delivery of the lipids and proteins required for autophagosome formation [Citation61,Citation62], while ATG5 and ATG12 play critical roles in a later stage of autophagy through forming a heterodimer that promotes LC3 lipidation [Citation63] and binds directly to CAV1 [Citation56]. As indicated by LC3B puncta (), serum starvation for 6 h effectively induced autophagosome accumulation (quantification of LC3B vesicles in ). In addition, the colocalization between YFP-CAV1 and LC3B-positive vesicles was increased in serum-starved cells (). The expression of mCherry-CAVIN1 stabilized YFP-CAV1 at the PM and inhibited the redistribution of YFP-CAV1 into the autophagosomes upon starvation (Fig. S5E). Little colocalization was detected between YFP-CAV1 and CAV1-GFP and lysosomes (Fig. S5F-G), suggesting a minor effect of lysosomal degradation on CAV1 clearance upon serum starvation in LNCaP cells. Knockdown of ATG5, ATG9A or ATG12 significantly inhibited autophagosome formation (middle panel, ; quantification of LC3B vesicles in ) and resulted in a dramatic increase in cellular YFP fluorescence (upper panel, ) under serum starved condition.
The modification of the LC3B cytoplasmic form (LC3B-I) to its membrane-bound form (LC3B-II) is essential for autophagosome maturation [Citation60]. Therefore, LC3B lipidation was further detected to assess the autophagic levels. A two-fold increase in LC3B-II:I ratio was observed in controls after a 6-h serum starvation (; quantification of LC3-II:I in , n = 3). Cells transfected with siRNAs against selected ATG proteins exhibited significantly decreased LC3B-II:I ratios (), suggesting reduced autophagic levels upon serum starvation in those cells. The interruption of autophagy in ATG knockdown cells led to a significant upregulation of YFP-CAV1 protein levels in the whole cell lysates (WCL) from serum starved LNCaP cells (). In addition, the treatment of an autophagy inhibitor, 3-methyladenine (3-MA), was included as a positive control and exhibited the most significant effect on rescuing cellular YFP-CAV1 expression levels (3.21 fold) following serum starvation (). These data demonstrate that autophagy is essential for the clearance CAV1 from LNCaP cells.
Next, we investigated the effect of autophagy on the release of CAV1 into the extracellular space. Western blot assays together with densitometry analysis revealed a significant upregulation (9.12 fold) of YFP-CAV1 secretion into the S100 fraction from control cells cultured in serum-free medium for 6 h (; quantification in , n = 3). Same effect was observed in stable LNCaP cells expressing CAV1-GFP (Fig. S5H). Autophagy inhibition by knockdowns of selected ATG proteins or 3-MA treatment caused marked reduction in YFP-CAV1 secretion from starved LNCaP cells (). Quantification showed significant downregulation in YFP-CAV1 levels in the S100 fractions of media isolated from ATG9A (−0.64 fold)- or ATG12 (−0.73 fold)-depleted cells, as well as 3-MA-treated cells (−0.93 fold), compared to controls (). Despite no significance, knockdown of ATG5 led to a decrease of 49% of YFP-CAV1 secretion into the S100 fraction compared to controls (). Consistently, another set of siRNA-mediated knockdowns of ATG proteins also showed the inhibitory effect on YFP-CAV1 secretion into S100 fraction (Fig. S5I).
Given the importance of intracellular Ca2+ in CAV1 release (), we finally assessed the effect of the calcium chelator BAPTA-AM on CAV1 S100 secretion. Confocal microscopy images revealed that pre-treatment with BAPTA-AM (10 τM) caused CAV1 accumulation close to the PM compared to untreated LNCaP cells upon serum starvation (Fig. S5J). In addition, a reduction of YFP-CAV1 in the S100 fraction was observed in the presence of BAPTA-AM in starved cells (Fig. S5K). These data suggest that intracellular Ca2+ is important for the autophagic secretion of CAV1.
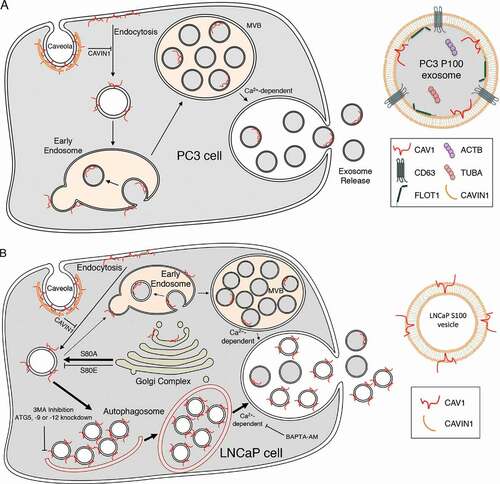
Taken together, the results argue that autophagic machinery is essential for CAV1 secretion in LNCaP cells. We propose that CAV1-induced vesicles are engulfed by autophagosomes and some of this content is released into the extracellular space as C-exosomes in a calcium- and CAVIN1 dependent manner (schematically depicted in ).
Figure 8. CAV1 secretion from PCa cells. (A) Schematic summary of the exosomal release of CAV1 from PC3 cells. (B) Schematic summary of the autophagy-based secretion of CAV1 from LNCaP cells
Discussion
Serum CAV1 detection in PCa correlates with cancer stage [Citation64], cancer grade [Citation65], angiogenesis [Citation21], and poor patient outcomes [Citation23,Citation66]. However, the mechanism that underlies this secretion has, to date, been poorly understood. Utilizing a variety of biochemical, EM and fluorescence microscopy-based techniques we have characterized the release of CAV1 from PC3 and LNCaP cells, and determined a novel autophagy-based secretion of CAV1 in LNCaP cells, in addition to conventional exosome-based release.
Advanced PCa possess an unconventional expression profile with high levels of CAV1 in the absence of CAVIN1 expression [Citation6,Citation11]. This is particularly interesting as loss of CAVIN1 protein in cells and animals, and loss of function mutations in CAVIN1 in human patients, consistently results in a significant reduction in CAV1 protein levels [Citation6,Citation7,Citation67,Citation68]. These observations suggest that understanding how PCa cells retain CAV1 expression for secretion into the extracellular space is critical for understanding the role of CAV1 in PCa. Clearly, CAV1 can be released within exosomes through a conventional pathway; this is the predominant pathway for CAV1 release from PC3 cells. However, we now show that CAV1 is released from LNCaP cells with the opposite topology (summarized in ). This is backed up by numerous observations from the literature that show bioactive CAV1-positive vesicles are released in an LNCaP-like topology with a biochemical profile that is distinct from conventional exosomes; CAV1 particles can be neutralized by anti-CAV1 antibodies which in turn can inhibit disease progression in models of PCa [Citation12,Citation20]. These observations closely align with our characterization of the topology CAV1 released by LNCaP cells and suggest the orientation of CAV1 in the membrane may be a critical factor in disease progression and bioactivity.
CAV1 is oriented in the cell such that the N- and C-termini face the cytoplasm with no portion of the protein exposed to the extracellular milieu [Citation69]. Our studies have confirmed that despite opposing secreted topologies, both PC3 cells and LNCaP cells possess CAV1 that exclusively faces the cytoplasm. How then can CAV1 be released from LNCaP cells with both cytoplasmic termini exposed? One possibility is that LNCaP particles are a consequence of lysed cells releasing caveolae into the media; our observations however argue against this possibility. First, LNCaP cells possess little to no caveolae in the absence of CAVIN1 expression (see reference [Citation11] and ). Second, the release of CAV1 appears to be a regulated pathway as ionomycin treatment stimulated secretion, BAPTA-AM treatment inhibited secretion, and knockdowns of ATG-family proteins similarly reduced C-exosome release. Critically these treatments did not correlate with large changes to LDH levels in the media. Third, the biophysical density of CAV1 secreted from LNCaP cells is dissimilar to the density of caveolae but does closely correlate with CAV1 released in other non-caveola forms [Citation19,Citation70]. Fourth, the number of CAV1 proteins per C-exosome does not align with the number of CAV1 proteins per caveolae [Citation5]. Finally, the vesicles released from LNCaP cells in the S100 fraction are approximately half the diameter of caveolae isolated from the PM [Citation71]. Our data argue that precursor C-exosomes are engulfed () and released into the extracellular space in a calcium, autophagy- and CAVIN1-dependent process. Loss of CAVIN1 expression could further exacerbate this process as by increasing cellular autophagy [Citation68]. Autophagy-mediated secretion of CAV1 was specifically observed in LNCaP cells and could be a result of their stronger autophagic responses compared to other PCa cells including DU145 and PC3 cells [Citation72].
Autophagosomes form in the cytoplasm of cells and function primarily in the degradation of cellular proteins and organelles by the engulfment of unwanted cellular machinery within the maturing phagophore. Several autophagy-based pathways have been characterized to function in the non-canonical regulated release of proteins, which demonstrate a subversion of protein degradation for secretion into the extracellular space [Citation50–54]. CAV1 degradation has been linked with autophagy [Citation55] as several studies have characterized specific interactions between CAV1 and known ATG family regulators [Citation56,Citation57]. In agreement with these observations we demonstrated that inhibition of autophagy by two sets of siRNA-mediated knockdown of selected ATG proteins significantly increased cellular CAV1 levels following serum starvation for 6 h (; Fig. S5I). Additionally, treatment of cells with 3-MA, a specific inhibitor of autophagosome maturation, resulted in a 3.2-fold increase in cellular CAV1 protein within treated cells following a 6-h serum starvation (). This was concurrent with a reduction in the release of CAV1 into the extracellular space (; Fig. S5I). Despite the potential effect of 3-MA on endosomal-based PIK3C3/VPS34 (phosphatidylinositol 3-kinase catalytic subunit type 3) activity [Citation73], our immunofluorescence assays revealed little colocalization between LC3B- and YFP-CAV1-positive vesicles with both early and late endosomes (Fig. S5A-B), suggesting the minor effect of impacted endosomal function by 3-MA on autophagic machinery-dependent CAV1 secretion. This model is entirely consistent with our observations and with the finding that even CAV1 tagged with a large GFP/YFP moiety is still efficiently released from cells.
Cellular calcium levels have been proposed to regulate of release of exosomes through conventional means [Citation36]. Intriguingly, many studies have also shown an important role for Ca2+-dependent activation of cellular autophagy though this remains controversial (reviewed by Bootman et al. [Citation74]). Here we have demonstrated that the release of C-exosomes is dependent on Ca2+ in PC3 cells (Fig. S3) where CAV1 is secreted through a conventional exocytic pathway, but also as a critical factor for the secretion of C-exosomes from the non-conventional autophagic secretion pathway in LNCaP cells ( and Fig. S5J-K). The treatment of cells expressing CAV1 with ionomycin stimulated a significant increase in CAV1 released from LNCaP cells preferentially within the S100 fraction. Similarly, we also observed a reduction in cellular calcium levels using the Ca2+-chelator BAPTA-AM which corresponded with retention of CAV1 within the cell by both confocal microscopy and biochemical assays. While the dependence on calcium for autophagic secretion is clear, it is unclear at what point in the secretion pathway ionomycin treatment and Ca2+ chelation are exerting their effects. Ca2+-dependence has been observed in the activation of CAMKK2/CAMKKβ (calcium/calmodulin dependent protein kinase kinase 2) [Citation75], MTORC1 (mechanistic target of rapamycin kinase complex 1) and DAPK (death associated protein kinase) through BECN1 (beclin 1) phosphorylation [Citation76], and through inhibition of the maturation of the phagophore [Citation77].
The origin of the curvature of the particles released from LNCaP cells remains unknown. It is likely that the expression of CAV1 itself is involved in sculpting the membrane to generate the released C-exosomes as has been observed in model caveolar systems [Citation78]. We observed that CAV1 was the most abundant protein in C-exosomes based on our mass spectrometry analyses. In addition, we demonstrated that the S80E point mutant of CAV1, which disrupts caveola formation in mammalian cells and in a model prokaryotic system [Citation37,Citation79] potently inhibited secretion (). Moreover, this mutant was unable to efficiently form C-exosome precursors in the cytoplasm as judged by EM. The lipidic environment may also be a critical determinant for the formation of these vesicles in LNCaP cells. The S80A point mutant, which is known to increase cholesterol association [Citation49], resulted in increased CAV1 secretion compared to WT levels. Similarly, the S80E mutant which reduces cholesterol association [Citation49] inhibited the release of CAV1. Previous studies have shown that alterations to cellular cholesterol levels perturb the secretion of CAV1 from prostate cancer cells [Citation27] and overexpression of APOA1/apolipoprotein A-I preferentially induced the translocation of CAV1 and cholesterol onto small particles in the cytoplasm of rat astrocytes [Citation70]. Other studies have suggested similarities between the properties of CAV1 particles released from LNCaP cells and high-density lipoprotein particles [Citation19]. This suggests that cholesterol trafficking and CAV1 expression are tightly linked and cellular perturbation of cholesterol distribution may impact upon CAV1 secretion. In agreement with this, other studies have shown that the induction of CAVIN1 expression in PCa cells resulted in widespread changes in the cellular distribution of cholesterol and correlated with reduced CAV1 secretion [Citation17]. As putative precursor C-exosomes were observed in the cytoplasm of LNCaP cells but not PC3 cells, and this correlated with secretion of CAV1 in an inverted topology from LNCaP cells, this suggests differences in the way that these cells respond to CAV1. In view of the correlation between secreted lipids, particularly those characteristic of exosomes, and poor prognosis in prostate cancer [Citation80], the role of the lipid environment in CAV1 release warrants further investigation.
In conclusion, we have demonstrated two distinct trafficking itinerary and topology for CAV1 secretion in two different PCa cell lines, both of which are Ca2+ dependent and attenuated by CAVIN1 expression. In addition to conventional exosome-based release, we characterize a novel secretory autophagy pathway which leads to an inverted CAV1 topology, which are likely the target of CAV1-neutralizing antibodies. Based on the existing clinical, in vitro and animal model data using LNCaP and PC3 models, it is likely that both conventional exosome and C-exosome CAV1 promote PCa progression, but each type of exosome may target different cells and have different modes of action. The relative contribution of the CAV1 secretion pathways in each PCa patient may depend on overall PCa lipid metabolism and autophagy pathway activity. Future studies should use prostate cancer patient-derived cells to evaluate the relationship between membrane lipid environment, autophagy pathways and CAV1 secretion CAV1 secretion routes.
Materials and methods
Tissue culture
Cells were grown in RPMI medium (Gibco, 21870092) supplemented with 10% fetal bovine serum and 2 mM L-glutamine. Cells were transfected using Lipofectamine 3000 (Invitrogen, L3000015) as per the manufacturer’s instruction. siRNA knockdowns were performed as follows. LNCaP cells (ATCC, CRL-1740) were seeded onto 35-mm dishes and left for 48 h. siRNA oligos (Ambion, Life Technologies, siATG5: s18158 and s18160; siATG9A: s35505 and 125423; siATG12: s17465 and 137606) were transfected with Lipofectamine 3000 twice; 2nd and 3rd days after seeding. Cells were then transfected with YFP-CAV1, left for an additional 24 h, and serum-starved overnight.
Antibodies and reagents
Protease Inhibitor Cocktail Set III was purchased from Roche (11836145001). Ionomycin was purchased from MP Biomedicals Australasia (0215507001) and 3-MA were purchased from Sigma-Aldrich (M9281). Proteinase K from Roche (03115844001). Protein A-Sepharose (P3391-1.5 G) and protein G-Sepharose (P3296-1 ML) were purchased from Sigma-Aldrich. LDH release analysis was performed using CytoTox96 Non-radioactive Cytotoxicity Assay (Promega, G1780). Protein concentrations were assayed using BCA Protein Assay Kit (Life Technologies, 23225). Western blots were developed using Supersignal West Dura Extended Duration (Thermo Fisher Scientific, PIE34075). Released CAV1 was concentrated using Amicon Ultra-15 or 4, PLHK Ultracel-PL Membrane, 100 kDa (Merck, UFC903024). The following antibodies used in this study were raised in mouse unless otherwise stated; anti-CAV1 rabbit polyclonal antibody (BD Biosciences, 610060), rabbit anti-ATG5 (Sigma-Aldrich, A0856), rabbit anti-ATG9A (Abcam, 487040), rabbit anti-ATG12 (Abcam, AB109491-100UL), rabbit anti-LC3B (Cell Signaling Technology, 2775S), anti-CD63 monoclonal antibody (Developmental Studies Hybridoma Bank, H5C6), anti-MYC-tag (Genesearch, 2276), anti-GFP/YFP (Roche Diagnostics Australia, 11814460001), anti-ACTB/actin (Merck, MAB1501), anti-EEA1 (Becton Dickinson, 610457), anti-TUBA/α-tubulin (Sigma-Aldrich, T9026) and anti-NUP62/nucleoporin 62 (Merck, MABE1043) raised in rabbit. Rabbit IgG was purchased from Sigma-Aldrich (I8140-10 MG). Alexa Fluor 555 secondary antibodies were purchased from Molecular Probes (donkey anti-rabbit: A-31572; donkey anti-mouse: A-31570).
CAV1 isolation from conditioned media
Cells were grown until they reached 80% confluency then washed with phosphate-buffered saline (PBS; 137 mM NaCl, 2.7 mM KCl, 10 mM Na2HPO4, 1.8 mM KH2PO4 in distilled water, pH 7.4). Cells were then incubated for 16 to 48 h in phenol-free RPMI before harvesting. Exosome purification was performed by successive centrifugation of conditioned media. Media was centrifuged at 180 x g for 5 min then 1,900 x g for 20 min. LDH assays were performed on the media at this stage of centrifugation. Media was subsequently spun again 14,000 x g for 35 min to ensure all cells and cellular debris were removed. High-speed ultracentrifugation was then performed for P100/S100 fractionation. Media was spun at 100,000 x g for 70 min using an Optima L-100XP floor standing ultracentrifuge (rotor SW40Ti). The supernatant was collected (S100 fraction) and concentrated using Amicon Ultra 100-kDa cut off concentrators. The pellet (P100 fraction) was resuspended in cold PBS, spun again at 100,000 x g for 70 min using an Optima MAX-XP bench-top ultracentrifuge (rotor TLS-55) and the pellet was collected. Whole cell lysates were analyzed as follows: After conditioned media was removed, cells were washed in cold TNE buffer (100 mM NaCl, 0.1 mM EDTA, 50 mM Tris-HCl, pH 7.4) and scraped in the presence of 1% Triton X-100 (Sigma Aldrich, X100-500 ML) and protease inhibitors. BCA assays were performed to determine protein concentration and LDH assay to determine percentage of cell death.
Western blots, immunoprecipitation and sucrose gradients
Protein samples were boiled in sample buffer, separated using sodium dodecyl sulfate-polyacrylamide gel electrophoresis (SDS-PAGE; 10–15% acrylamide) and transferred onto PVDF membrane (Millipore, IPVH00010). For CD63 western blots, protein samples were heated to 60°C for 10 min in a non-reducing buffer. Western blots were blocked in 3% bovine serum albumin (Sigma Aldrich, 10735094001) in Tris-buffered saline with Tween (TBST; pH 7.4, 10 mM Tris-HCl, 140 mM NaCl, 0.1% v:v Tween 20 [Sigma Aldrich, P1379-500 ML]), incubated with primary antibodies and HRP-conjugated secondary antibodies (Life Technologies; goat anti-rabbit IgG: G-21234, goat anti-mouse IgG: G-21040) and developed using chemiluminescence. Immunoprecipitation was performed as follows: Supernatant was collected after the 14,000 x g spin and incubated with an anti-CAV1 antibody, anti-CD63 antibody or rabbit IgG (as a negative control) for 1 h at 4°C in the presence or absence of 1% Triton X-100. Thirty μL of protein A-Sepharose beads were then added and incubated for 30 min. Beads were then centrifuged at 5000 x g for 2 min, and washed repeatedly in cold TNE buffer then processed as described above. Immunoprecipitation experiments using the P100 and S100 fraction were performed similarly but antibody incubation was performed after the second 100,000 x g spin. For sucrose gradients; samples were spun for 16 h at 200,000 x g using Optima MAX-XP bench-top ultracentrifuge (rotor TLS-55).
Proteinase K digestion
Purified P100 and S100 fractions were incubated with or without detergent at 4°C for 30 min on a shaker prior to ProK digestion. Proteins were then incubated with 250 ng/mL of ProK at 37°C for 30 min. Protease inhibitors were added after 30 min to stop the digestion.
Fluorescence imaging
Coverslips were fixed in 4% paraformaldehyde in PBS at room temperature (RT) for 30 min, permeabilised with 0.1% saponin (Sigma Aldrich, S7900) in PBS and quenched with 50 mM NH4Cl in PBS for 10 min. Coverslips were blocked in 0.2% bovine serum albumin and 0.2% fish skin gelatin (Sigma Aldrich, G-7765) in PBS for 10 min. Primary antibodies were incubated with coverslips for 1 h at RT, washed in PBS, and incubated with secondary fluorophores (Alexa Fluor 555 anti-rabbit and Alexa Fluor 660 anti-mouse) for 30 min. Coverslips were washed in PBS then water before mounting with Mowiol (Merck, 475904). Coverslips were imaged on a Zeiss LSM510 Confocal Microscope at 60X objective. Images for quantification were processed as follows: Individual GFP-RAB5Q79sL endosomes were selected and the Red intensity was measured per endosome for multiple endosomes per cell for 30 to 50 cells per condition – repeated at least 3 times – such that an average red value can be compared between ± CAVIN1. The area of GFP-RAB5Q79L endosomes was also compared to ensure no differences between the measured areas that existed between conditions.
Proteomics
Isolated YFP-CAV1 particles and control particles were separated by SDS-PAGE to 8 mm. Staining, in-gel trypsin digest and LC-MS/MS were performed as previously described [Citation81]. Spectrum Mill and Scaffold software were used for database searching and statistical analysis using normalized total precursor intensity. Report from Scaffold analysis is available as Table S1.
Single molecule fluorescence spectroscopy
Single molecule counting
The experiments were performed as described previously [Citation43] using a commercial Zeiss 710 confocal microscope equipped with the ConfoCor module. Briefly, the 488 nm excitation laser is focussed in the solution using a 40x water-immersion objective, creating a very small observation volume (~1 fL). The fluorescence is collected, filtered using a 35-nm pinhole and recorded using single molecule counting detectors. The fluorescent CAV1 particles were diluted to picomolar concentrations to enable single particle detection. As described previously [Citation43,Citation44], the diffusion of the CAV1 particles into the focal volume is recorded as a bright burst of fluorescence. The amplitude of the burst can be used to quantify the maximal number of proteins in the particles, after calibration of the brightness of YFP monomers.
Fluorescence Correlation Spectroscopy
FCS studies were performed exactly as described previously [Citation43]. For these experiments, fluorescent proteins are diluted to 10–100 nanomolar concentration, so that a constant fluorescence intensity is detected. As fluorescent proteins enter or leave the detection volume constantly, the fluorescent intensity increases or decreases. The fluctuations of intensity around the average value are computed, and the auto-correlation of the intensity over time leads to a calculation of the diffusion time, the typical time it takes for a protein to diffuse through the focal volume. Binding between proteins or the formation of aggregates can be detected as the physical size, and consequently, the diffusion time, will increase upon complex formation.
Negative staining electron microscopy
Purified YFP-CAV1 particles were incubated for 10 min on glow-discharged carbon coated 1% formvar grids. Grids were washed 5 times in PBS, then 5 times in water and stained using 1% aqueous uranyl acetate. Purified exosomes from PC3 cells (ATCC, CRL-1435) were adhered to formvar (ProSciTech, C064)-coated grids, washed repeatedly in PBS and water, then stained with 0.4% uranyl acetate in 2% methyl cellulose on ice for 10 min. Grids were imaged at 80 kV on a JEOL 1011 transmission electron microscope fitted with a Morada 4 K X 4 K Soft Imaging Camera at two-fold binning (Olympus).
APEX-GBP electron microscopy
PC3, LNCaP and BHK (ATCC, CCL-10) cells were co-transfected with YFP or YFP-CAV1 and the APEX-GBP construct [Citation45]. Cells were processed as described previously [Citation45]. Briefly, cells were fixed in 2.5% glutaraldehyde, washed in 0.1 M cacodylate buffer, and incubated with 3,3-diaminobenzoic acid (DAB; Sigma-Aldrich, D5905) in the presence of hydrogen peroxide for 30 min at room temperature. Cells were washed in cacodylate buffer, post-fixed in 1% osmium tetroxide for 2 min, serially dehydrated in ethanol and serially infiltrated with LX112 resin (Ladd Research, 21310). Resin was polymerized at 60°C overnight and 60-nm ultrathin sections were cut on an Ultracut 6 (Leica) ultramicrotome and imaged as described above.
Supplemental Material
Download MS Word (18.2 MB)Acknowledgments
The authors would like to thank Prof. T Thompson for sharing reagents, Dr. Vikas Tillu and Ms Dorothy Loo for their technical assistance on this project, and Ye-Wheen Lim, Harriet Lo, Sachini Fonseka and Natasha Kaushik for proofreading the manuscript. The authors acknowledge the use of the Microscopy Australia Facilities at the Center for Microscopy and Microanalysis at The University of Queensland and The Electron Microscopy Unit at the University of New South Wales. Fluorescence Microscopy was performed at the Australian Cancer Research Foundation (ACRF)/Institute for Molecular Bioscience (IMB) Dynamic Imaging Facility for Cancer Biology. Mass Spectrometry was performed at The University of Queensland Diamantina Institute Mass Spectrometry Facility. This work was supported by grants and a fellowship from the National Health and Medical Research Council of Australia (grant numbers APP1058565 and APP569542 to RGP; APP1045092 to RGP and NA; APP1102730 to NA; APP1037320 to RGP and KA; APP1108859 to YG and NA). YG and MMH were supported by separate ARC Future Fellowships (FT110100478 and FT120100251) and FAM with an ARC Discovery Project (DP170100125). RDT and FAM are supported by separate NHMRC Research Fellowships (APP1041929 and APP1060075).
Disclosure statement
The authors declare that they have no conflict of interest with the contents of this article.
Supplementary material
Supplemental data for this article can be accessed here.
Additional information
Funding
References
- Parton RG, McMahon K-A, Wu Y. Caveolae: formation, dynamics, and function. Curr Opin Cell Biol. 2020 Aug 01;65:8–16. .
- Park DS, Woodman SE, Schubert W, et al. Caveolin-1/3 double-knockout mice are viable, but lack both muscle and non-muscle caveolae, and develop a severe cardiomyopathic phenotype. Am J Pathol. 2002 Jun;160(6):2207–2217. .
- Hayer A, Stoeber M, Bissig C, et al. Biogenesis of caveolae: stepwise assembly of large caveolin and cavin complexes. Traffic. 2010 Mar;11(3):361–382. .
- Boucrot E, Howes MT, Kirchhausen T, et al. Redistribution of caveolae during mitosis. J Cell Sci. 2011 Jun 15;124(Pt 12):1965–1972.
- Pelkmans L, Zerial M. Kinase-regulated quantal assemblies and kiss-and-run recycling of caveolae. Nature. 2005 Jul 7;436(7047):128–133.
- Hill MM, Bastiani M, Luetterforst R, et al. PTRF-Cavin, a conserved cytoplasmic protein required for caveola formation and function. Cell. 2008 Jan 11;132(1):113–124.
- Liu L, Brown D, McKee M, et al. Deletion of Cavin/PTRF causes global loss of caveolae, dyslipidemia, and glucose intolerance. Cell Metab. 2008 Oct;8(4):310–317. .
- Bastiani M, Liu L, Hill MM, et al. MURC/Cavin-4 and cavin family members form tissue-specific caveolar complexes. J Cell Biol. 2009 Jun 29;185(7):1259–1273.
- Hayer A, Stoeber M, Ritz D, et al. Caveolin-1 is ubiquitinated and targeted to intralumenal vesicles in endolysosomes for degradation. J Cell Biol. 2010 Nov 1;191(3):615–629.
- Gumulec J, Sochor J, Hlavna M, et al. Caveolin-1 as a potential high-risk prostate cancer biomarker. Oncol Rep. 2012 Mar;27(3):831–841.
- Moon H, Lee CS, Inder KL, et al. PTRF/cavin-1 neutralizes non-caveolar caveolin-1 microdomains in prostate cancer. Oncogene. 2014 Jul 3;33(27):3561–3570.
- Tahir SA, Yang G, Ebara S, et al. Secreted caveolin-1 stimulates cell survival/clonal growth and contributes to metastasis in androgen-insensitive prostate cancer. Cancer Res. 2001 May 15;61(10):3882–3885.
- Lin C-J, Yun E-J, Lo UG, et al. The paracrine induction of prostate cancer progression by caveolin-1. Cell Death Dis. 2019 Nov 04;10(11):834.
- Campos A, Burgos-Ravanal R, González MF, et al. Cell intrinsic and extrinsic mechanisms of Caveolin-1-enhanced metastasis. Biomolecules. 2019;9(8):314. .
- Williams TM, Hassan GS, Li J, et al. Caveolin-1 promotes tumor progression in an autochthonous mouse model of prostate cancer: genetic ablation of Cav-1 delays advanced prostate tumor development in tramp mice. J Biol Chem. 2005 Jul 1;280(26):25134–25145.
- Inder KL, Ruelcke JE, Petelin L, et al. Cavin-1/PTRF alters prostate cancer cell-derived extracellular vesicle content and internalization to attenuate extracellular vesicle-mediated osteoclastogenesis and osteoblast proliferation. J Extracell Vesicles. 2014;3. DOI:https://doi.org/10.3402/jev.v3.23784.
- Inder KL, Zheng YZ, Davis MJ, et al. Expression of PTRF in PC-3 Cells modulates cholesterol dynamics and the actin cytoskeleton impacting secretion pathways. Mol Cell Proteomics. 2012 Feb;11(2):M111 012245. .
- Nassar ZD, Moon H, Duong T, et al. PTRF/Cavin-1 decreases prostate cancer angiogenesis and lymphangiogenesis. Oncotarget. 2013 Oct;4(10):1844–1855. .
- Bartz R, Zhou J, Hsieh JT, et al. Caveolin-1 secreting LNCaP cells induce tumor growth of caveolin-1 negative LNCaP cells in vivo. Int J Cancer. 2008 Feb 1;122(3):520–525.
- Watanabe M, Yang G, Cao G, et al. Functional analysis of secreted caveolin-1 in mouse models of prostate cancer progression. Mol Cancer Res. 2009 Sep;7(9):1446–1455. .
- Yang G, Addai J, Wheeler TM, et al. Correlative evidence that prostate cancer cell-derived caveolin-1 mediates angiogenesis. Hum Pathol. 2007 Nov;38(11):1688–1695. .
- Tahir SA, Ren C, Timme TL, et al. Development of an immunoassay for serum caveolin-1: a novel biomarker for prostate cancer. Clin Cancer Res. 2003 Sep 1;9(10 Pt 1):3653–3659.
- Tahir SA, Frolov A, Hayes TG, et al. Preoperative serum caveolin-1 as a prognostic marker for recurrence in a radical prostatectomy cohort. Clin Cancer Res. 2006 Aug 15;12(16):4872–4875.
- Logozzi M, De Milito A, Lugini L, et al. High levels of exosomes expressing CD63 and caveolin-1 in plasma of melanoma patients. PLoS One. 2009;4(4):e5219. .
- Crewe C, Joffin N, Rutkowski JM, et al. An endothelial-to-adipocyte extracellular vesicle axis governed by metabolic state. Cell. 2018 Oct 18;175(3):695–708.e13.
- Simón L, Campos A, Leyton L, et al. Caveolin-1 function at the plasma membrane and in intracellular compartments in cancer. Cancer Metast Rev. 2020 Jun 01;39(2):435–453.
- Llorente A, de Marco MC, Alonso MA. Caveolin-1 and MAL are located on prostasomes secreted by the prostate cancer PC-3 cell line. J Cell Sci. 2004 Oct 15;117(Pt 22):5343–5351.
- Phuyal S, Skotland T, Hessvik NP, et al. The ether lipid precursor hexadecylglycerol stimulates the release and changes the composition of exosomes derived from PC-3 cells. J Biol Chem. 2015 Feb 13;290(7):4225–4237.
- Thery C, Boussac M, Veron P, et al. Proteomic analysis of dendritic cell-derived exosomes: a secreted subcellular compartment distinct from apoptotic vesicles. J Immunol. 2001 Jun 15;166(12):7309–7318.
- Denzer K, Kleijmeer MJ, Heijnen HF, et al. Exosome: from internal vesicle of the multivesicular body to intercellular signaling device. J Cell Sci. 2000 Oct;113(Pt 19):3365–3374.
- Yanez-Mo M, Siljander PR, Andreu Z, et al. Biological properties of extracellular vesicles and their physiological functions. J Extracell Vesicles. 2015;4:27066.
- Li WP, Liu P, Pilcher BK, et al. Cell-specific targeting of caveolin-1 to caveolae, secretory vesicles, cytoplasm or mitochondria. J Cell Sci. 2001 Apr;114(Pt 7):1397–1408.
- Liu P, Li WP, Machleidt T, et al. Identification of caveolin-1 in lipoprotein particles secreted by exocrine cells. Nat Cell Biol. 1999 Oct;1(6):369–375. .
- Hosseini-Beheshti E, Pham S, Adomat H, et al. Exosomes as biomarker enriched microvesicles: characterization of exosomal proteins derived from a panel of prostate cell lines with distinct AR phenotypes. Mol Cell Proteomics. 2012 Oct;11(10):863–885. .
- Kharaziha P, Chioureas D, Rutishauser D, et al. Molecular profiling of prostate cancer derived exosomes may reveal a predictive signature for response to docetaxel. Oncotarget. 2015 Aug 28;6(25):21740–21754.
- Phuyal S, Hessvik NP, Skotland T, et al. Regulation of exosome release by glycosphingolipids and flotillins. Febs J. 2014 May;281(9):2214–2227. .
- Ariotti N, Rae J, Leneva N, et al. Molecular characterization of Caveolin-induced membrane curvature. J Biol Chem. 290(41): 24875–24890. 2015 Aug 24.
- Tahir SA, Yang G, Goltsov AA, et al. Tumor cell-secreted caveolin-1 has proangiogenic activities in prostate cancer. Cancer Res. 2008 Feb 1;68(3):731–739.
- Høyer-Hansen M, Bastholm L, Szyniarowski P, et al. Control of macroautophagy by calcium, calmodulin-dependent kinase Kinase-β, and Bcl-2. Mol Cell. 2007;25(2):193–205. .
- Stenmark H, Parton RG, Steele-Mortimer O, et al. Inhibition of rab5 GTPase activity stimulates membrane fusion in endocytosis. Embo J. 1994 Mar 15;13(6):1287–1296.
- Kioumourtzoglou D, Pryor PR, Gould GW, et al. Alternative routes to the cell surface underpin insulin-regulated membrane trafficking of GLUT4. J Cell Sci. 2015 Jul 15;128(14):2423–2429.
- Stevens RJ, Akbergenova Y, Jorquera RA, et al. Abnormal synaptic vesicle biogenesis in Drosophila synaptogyrin mutants. J Neurosci. 2012 Dec 12;32(50):18054–67, 18067a.
- Gambin Y, Ariotti N, McMahon KA, et al. Single-molecule analysis reveals self assembly and nanoscale segregation of two distinct cavin subcomplexes on caveolae. Elife. 2014;3:e01434.
- Gambin Y, Polinkovsky M, Francois B, et al. Confocal spectroscopy to study dimerization, oligomerization and aggregation of proteins: a practical guide. Int J Mol Sci. 2016;17(5):655. .
- Ariotti N, Hall TE, Rae J, et al. Modular detection of GFP-labeled proteins for rapid screening by electron microscopy in cells and organisms. Dev Cell. 2015 Nov 23;35(4):513–525.
- Martell JD, Deerinck TJ, Sancak Y, et al. Engineered ascorbate peroxidase as a genetically encoded reporter for electron microscopy. Nat Biotechnol. 2012 Nov;30(11):1143–1148. .
- Rothbauer U, Zolghadr K, Muyldermans S, et al. A versatile nanotrap for biochemical and functional studies with fluorescent fusion proteins. Mol Cell Proteomics. 2008 Feb;7(2):282–289. .
- Walser PJ, Ariotti N, Howes M, et al. Constitutive formation of caveolae in a bacterium. Cell. 2012 Aug 17;150(4):752–763.
- Fielding PE, Chau P, Liu D, et al. Mechanism of platelet-derived growth factor-dependent caveolin-1 phosphorylation: relationship to sterol binding and the role of serine-80. Biochemistry. 2004 Mar 9;43(9):2578–2586.
- Bruns C, McCaffery JM, Curwin AJ, et al. Biogenesis of a novel compartment for autophagosome-mediated unconventional protein secretion. J Cell Biol. 2011 Dec 12;195(6):979–992.
- Dupont N, Jiang S, Pilli M, et al. Autophagy-based unconventional secretory pathway for extracellular delivery of IL-1beta. Embo J. 2011 Nov 30;30(23):4701–4711.
- Duran JM, Anjard C, Stefan C, et al. Unconventional secretion of Acb1 is mediated by autophagosomes. J Cell Biol. 2010 Feb 22;188(4):527–536.
- Manjithaya R, Anjard C, Loomis WF, et al. Unconventional secretion of Pichia pastoris Acb1 is dependent on GRASP protein, peroxisomal functions, and autophagosome formation. J Cell Biol. 2010 Feb 22;188(4):537–546.
- Zhang M, Kenny SJ, Ge L, et al. Translocation of interleukin-1beta into a vesicle intermediate in autophagy-mediated secretion. Elife. 2015;4. DOI:https://doi.org/10.7554/eLife.11205.
- Chen Y, Henson ES, Xiao W, et al. Tyrosine kinase receptor EGFR regulates the switch in cancer cells between cell survival and cell death induced by autophagy in hypoxia. Autophagy. 2016 Jun 2;12(6):1029–1046.
- Chen ZH, Cao JF, Zhou JS, et al. Interaction of caveolin-1 with ATG12-ATG5 system suppresses autophagy in lung epithelial cells. Am J Physiol Lung Cell Mol Physiol. 2014 Jun 1;306(11):L1016–25.
- Chen ZH, Lam HC, Jin Y, et al. Autophagy protein microtubule-associated protein 1 light chain-3B (LC3B) activates extrinsic apoptosis during cigarette smoke-induced emphysema. Proc Natl Acad Sci U S A. 2010 Nov 2;107(44):18880–18885.
- Bai X, Yang X, Jia X, et al. CAV1-CAVIN1-LC3B-mediated autophagy regulates high glucose-stimulated LDL transcytosis. Autophagy. 2019. DOI:https://doi.org/10.1080/15548627.2019.1659613.
- Shi Y, Tan S-H, Ng S, et al. Critical role of CAV1/caveolin-1 in cell stress responses in human breast cancer cells via modulation of lysosomal function and autophagy. Autophagy. 2015 May 04;11(5):769–784.
- Carlsson SR, Simonsen A. Membrane dynamics in autophagosome biogenesis. J Cell Sci. 2015;128(2):193.
- Karanasios E, Walker SA, Okkenhaug H, et al. Autophagy initiation by ULK complex assembly on ER tubulovesicular regions marked by ATG9 vesicles. Nat Commun. 2016 Aug 11;7(1):12420.
- Judith D, Jefferies HBJ, Boeing S, et al. ATG9A shapes the forming autophagosome through Arfaptin 2 and phosphatidylinositol 4-kinase IIIβ. J Cell Biol. 2019;218(5):1634–1652. .
- Hanada T, Noda NN, Satomi Y, et al. The Atg12-Atg5 conjugate has a novel E3-like activity for protein lipidation in autophagy. J Biol Chem. 2007;282(52):37298–37302. .
- Satoh T, Yang G, Egawa S, et al. Caveolin-1 expression is a predictor of recurrence-free survival in pT2N0 prostate carcinoma diagnosed in Japanese patients. Cancer. 2003 Mar 1;97(5):1225–1233.
- Yang G, Truong LD, Wheeler TM, et al. Caveolin-1 expression in clinically confined human prostate cancer: a novel prognostic marker. Cancer Res. 1999 Nov 15;59(22):5719–5723.
- Karam JA, Lotan Y, Roehrborn CG, et al. Caveolin-1 overexpression is associated with aggressive prostate cancer recurrence. Prostate. 2007 May 1;67(6):614–622.
- Hayashi YK, Matsuda C, Ogawa M, et al. Human PTRF mutations cause secondary deficiency of caveolins resulting in muscular dystrophy with generalized lipodystrophy. J Clin Invest. 2009 Sep;119(9):2623–2633. .
- Salle-Teyssieres L, Auclair M, Terro F, et al. Maladaptative autophagy impairs adipose function in congenital generalized lipodystrophy due to Cavin-1 deficiency. J Clin Endocrinol Metab. 2016 Jul;101(7):2892–2904. .
- Murata M, Peranen J, Schreiner R, et al. VIP21/caveolin is a cholesterol-binding protein. Proc Natl Acad Sci U S A. 1995 Oct 24;92(22):10339–10343.
- Ito J, Nagayasu Y, Kato K, et al. Apolipoprotein A-I induces translocation of cholesterol, phospholipid, and caveolin-1 to cytosol in rat astrocytes. J Biol Chem. 2002 Mar 8;277(10):7929–7935.
- Chang WJ, Ying YS, Rothberg KG, et al. Purification and characterization of smooth muscle cell caveolae. J Cell Biol. 1994 Jul;126(1):127–138. .
- Ouyang D-Y, Xu L-H, He X-H, et al. Autophagy is differentially induced in prostate cancer LNCaP, DU145 and PC-3 cells via distinct splicing profiles of ATG5. Autophagy. 2013 Jan 09;9(1):20–32.
- Jaber N, Mohd-Naim N, Wang Z, et al. Vps34 regulates Rab7 and late endocytic trafficking through recruitment of the GTPase-activating protein Armus. J Cell Sci. 2016;129(23):4424. .
- Bootman MD, Chehab T, Bultynck G, et al. The regulation of autophagy by calcium signals: do we have a consensus? Cell Calcium. 2018 Mar 01;70:32–46. .
- Gómez-Suaga P, Luzón-Toro B, Churamani D, et al. Leucine-rich repeat kinase 2 regulates autophagy through a calcium-dependent pathway involving NAADP. Hum Mol Genet. 2012;21(3):511–525. .
- Bialik S, Kimchi A. Lethal weapons: DAP-kinase, autophagy and cell death: DAP-kinase regulates autophagy. Curr Opin Cell Biol. 2010 Apr 01;22(2):199–205.
- Engedal N, Torgersen ML, Guldvik IJ, et al. Modulation of intracellular calcium homeostasis blocks autophagosome formation. Autophagy. 2013 Oct 25;9(10):1475–1490.
- Jung W, Sierecki E, Bastiani M, et al. Cell-free formation and interactome analysis of caveolae. J Cell Biol. 2018;217(6):2141–2165. .
- Kirkham M, Nixon SJ, Howes MT, et al. Evolutionary analysis and molecular dissection of caveola biogenesis. J Cell Sci. 2008 Jun 15;121(Pt 12):2075–2086.
- Lin HM, Mahon KL, Weir JM, et al. A distinct plasma lipid signature associated with poor prognosis in castration-resistant prostate cancer. Int J Cancer. 2017 Nov 15;141(10):2112–2120.
- Ruelcke JE, Loo D, Hill MM. Reducing the cost of semi-automated in-gel tryptic digestion and GeLC sample preparation for high-throughput proteomics. J Proteomics. 2016 Apr 13;149:3–6.