
ABSTRACT
Plasma cells depend on quality control of newly synthesized antibodies in the endoplasmic reticulum (ER) via macroautophagy/autophagy and proteasomal degradation. The cytosolic adaptor protein TFG (Trk-fused gene) regulates ER-Golgi transport, the secretory pathway and proteasome activity in non-immune cells. We show here that TFG is upregulated during lipopolysaccharide- and CpG-induced differentiation of B1 and B2 B cells into plasmablasts, with the highest expression of TFG in mature plasma cells. CRISPR-CAS9-mediated gene disruption of tfg in the B lymphoma cell line CH12 revealed increased apoptosis, which was reverted by BCL2 but even more by ectopic TFG expression. Loss of TFG disrupted ER structure, leading to an expanded ER and increased expression of ER stress genes. When compared to wild-type CH12 cells, tfg KO CH12 cells were more sensitive toward ER stress induced by tunicamycin, monensin and proteasome inhibition or by expression of an ER-bound immunoglobulin (Ig) μ heavy (µH) chain. CH12 tfg KO B cells displayed more total LC3, lower LC3-II turnover and increased numbers and size of autophagosomes. Tandem-fluorescent-LC3 revealed less accumulation of GFP-LC3 in starved and chloroquine-treated CH12 tfg KO B cells. The GFP:RFP ratio of tandem-fluorescent-LC3 was higher in tunicamycin-treated CH12 tfg KO B cells, suggesting less autophagy flux during induced ER stress. Based on these data, we suggest that TFG controls autophagy flux in CH12 B cells and propose that TFG is a survival factor that alleviates ER stress through the support of autophagy flux in activated B cells and mature plasma cells.Abbreviations: Ab, antibody; Ag, antigen; ASC, antibody-secreting cells; ATG, autophagy-related; BCR, B cell receptor; COPII, coat protein complex II; CpG, non-methylated CpG oligonucleotide; ER, endoplasmic reticulum; ERAD, ER-associated degradation; FO, follicular; GFP, green fluorescent protein; HC, heavy chain; Ig, immunoglobulin; IRES, internal ribosomal entry site; LC, light chain; MZ, marginal zone; NFKB, nuclear factor of kappa light polypeptide gene enhancer in B cells; TLR, toll-like receptor; UPR, unfolded protein response.
Introduction
Clonal expansion of B cells and their terminal differentiation into antibody (Ab)-secreting plasma cells are the pillars of humoral immunity. The hallmark of naïve B cells is the assembly of the B cell receptor (BCR), a membrane-bound immunoglobulin (Ig) molecule consisting of two heavy (H) chains of the μ type (μHC) and two light (L) chains, each containing variable and constant regions. The BCR is associated with the Igα/β signaling unit coupling the BCR to tyrosine kinases, Ca2+ signaling and downstream transcription factors, such as NFKB (nuclear factor of kappa light chain enhancer in B cells) [Citation1–5]. BCR signaling is restricted by negative transmembrane signaling proteins, for instance, CD72 [Citation6] or CD5 [Citation7] and enhanced by others, such as CD19 or CR2 (complement receptor 2) [Citation8]. If a μHC is unable to heterodimerize with a light chain (dysfunctional μHC) due to certain variable regions, it cannot leave the endoplasmic reticulum (ER), fails to form a (pre) BCR and to signal via Igα [Citation9]. B cell activation in the presence of cognate T cell help enables the generation of long-lived plasma cells via the germinal center reaction, which is required for antibody class switching and affinity maturation [Citation10]. Another potent innate stimulator of murine plasma cell generation is lipopolysaccharide (LPS) that induces a polyclonal IgM response [Citation11,Citation12]. In particular, B1 B cells and marginal zone (MZ) B cells respond rapidly to LPS and also to non-methylated CpG oligonucleotides (CpG) by differentiating into short-lived antibody (Ab)-secreting cells [Citation13,Citation14], thereby, maintaining natural serum IgM [Citation15,Citation16]. Follicular (FO) B cells respond to LPS as well, but with delayed kinetics [Citation13]. The peritoneal B1 B cells are a self-renewing population originating from various sources during murine ontogenesis. Their biology is not yet completely understood (reviewed in [Citation16]). B1 B cells are refractory to BCR induced proliferation owing to high CD5 expression and secrete low affine self-reactive IgM without antigenic stimulation (reviewed in [Citation17]). B1 B cells do not expand clonally in response to BCR stimulation and the BCR is uncoupled from NFKB activation [Citation18].
Mature plasma cells are terminally differentiated B cells with characteristic features: They have distinct metabolic properties [Citation19,Citation20], exhibit a largely ER [Citation21,Citation22], and have upregulated genes and pathways that control antibody secretion and redox balance [Citation23,Citation24]. Ab synthesized in the ER are transported to distinct structures of the smooth ER, called ER exit sites (ERES) [Citation25]. The ER export factor, SEC16, is found in ERES and appears to provide a scaffold for the COPII (coat protein complex II) assembly machinery [Citation26,Citation27]. COPII vesicles fuse with the ER-Golgi intermediate compartment (ERGIC), a sorting compartment marking proteins for transport to the Golgi apparatus, or retrograde transport back to the ER [Citation25,Citation28,Citation29].
Accumulation of Ig HC in the ER can be a consequence of its massive upregulation during B cell activation, transport problems, suboptimal idiotypes [Citation9], inhibition of glycosylation, or impaired disulfide formation. This imposes stress on plasma cells and triggers the unfolded protein response (UPR) (reviewed in [Citation30]). A specific UPR pathway is ER-associated protein degradation (ERAD) [Citation31]. Proteins marked for ERAD are retro-translocated into the cytosol and degraded by the ubiquitin-proteasome-system (UPS). Consequently, plasma cells are susceptible to inhibition of the UPS [Citation32]. Although ERAD is considered to be the primary mechanism relieving cells from ER stress, the UPR can also induce autophagy as the cell’s backup garbage removal system [Citation33,Citation34], or cell death [Citation35]. Mutual or synergistic interplays between ER stress and autophagy have also been described [Citation36–38].
Macroautophagy/autophagy is the process during which ubiquitinated proteins or damaged organelles are trapped by autophagy receptors, engulfed by a double membrane originating from the ER membrane or other sources, establishing an autophagosome, which then fuses with lysosomes to establish an autolysosome (reviewed in [Citation39,Citation40]). Thus, ubiquitinated proteins, organelles and receptors become degraded during this process, which involves a dynamic series of vesicular events managed by ATG (autophagy-related) genes [Citation41]. The autophagy vesicle matures by lipidation of an ATG protein (Atg8 in yeast, LC3 and GABARAP subfamilies in mammals), which is required for autophagy vesicle expansion. The survival of long-lived plasma cells and B1 B cells and the memory response depend on autophagy [Citation42–44]. One report suggests that loss of autophagy increases Ab production and ER volume, creating paradoxically too much ER stress, eliciting a plasma cell decline in vivo over time [Citation44]. However, there are conflicting results for the role of autophagy in plasma cells concerning Ab production [Citation42–44].
In a proteomic screen for interaction partners of CARD11, an adaptor protein linking the BCR to NFKB and the MTOR (mechanistic target of rapamycin kinase) complex, both of which are involved in plasma cell physiology [Citation20], we identified a 50-kDa protein named TFG (Trk-fused gene) in lysates from the mouse B lymphoma line CH27 [Citation45]. TFG has been shown to support NFKB activation [Citation46], to antagonize apoptosis, to promote cell size [Citation47] and to control ER homeostasis [Citation48], all of which accompany plasma cell differentiation. TFG consists of an N-terminal PB1 (Phox and Bem1p homology) domain, followed by a coiled-coil domain and a proline- and glutamine-rich region [Citation49,Citation50]. RNA silencing of Tfg disrupts secretion of huge cargo, such as collagen, causing ER stress and finally apoptosis in non-immune cells [Citation51]. This likely occurs because TFG interacts directly with SEC16 and controls the abundance of SEC16 at ERES [Citation52]. Intriguingly, TFG forms a meshwork-like matrix between ER and ERGIC; hence, depletion of TFG leads to a reduction of ERGIC and Golgi membranes, fragmentation of the ER and fewer stacks within the Golgi network [Citation51]. In other cell systems, TFG has been described as a negative regulator of the UPS, and its overexpression can lead to increased ER stress by interfering with ERAD [Citation53]. Additionally, some non-immune secretory cells like insulin-producing β-cells [Citation54] or sebocytes [Citation55] also depend on TFG. While the functions of TFG may vary in different cell types and may depend on its abundance, all published data point to a function of TFG in homeostasis of the ER and the secretory pathway. Based on these findings we hypothesized that the function of TFG is essential in activated B cells that upregulate the production of membrane-bound and secreted IgM. Here, we assessed this idea in a B cell line by CRISPR-CAS9-mediated gene disruption of TFG.
Results
Abundant expression of TFG in plasmablasts and plasma cells
To determine the expression of Tfg during B cell development, we analyzed public RNA-Seq datasets [Citation24,Citation56,Citation57] ()). According to these data, Tfg transcripts are present in pro- and pre-B cells, become downregulated during central maturation into splenic B cells, are expressed slightly higher in germinal center B cells and are strongly upregulated in splenic and bone marrow plasmablasts and plasma cells. To confirm these findings, we sorted naïve FO and MZ B cell populations, surface IgA- and IgM-positive as well as IgA/IgM double negative (DN) plasmablast/plasma cells (representing mostly IgG-positive cells) [Citation58] from the spleen and bone marrow of wild-type C57Bl/6 mice ()). The abundance of Tfg transcripts in the sorted plasmablast/plasma cell, FO and MZ B cell populations (Figure S1) as well as in LPS-activated splenic B cells was determined by TaqMan qPCR ()). This analysis clearly confirmed an increased abundance of Tfg transcripts in activated B cells and plasmablasts/plasma cells regardless of their Ig isotype when compared to naïve FO and MZ B cell populations.
Figure 1. Upregulation of Tfg during plasma cell differentiation. (a)-(c) Published, freely available datasets from RNA-Seq data from WT mice or irf4 KO mice [Citation24,Citation56,Citation57] were assessed for abundance of Tfg mRNA in B cells subsets: pro- (proB), pre- (preB), immature (Im) and mature (Ma), B1a, FO (follicular), MZ (marginal zone), GC (germinal center) B cells, PB (plasmablasts), PC (plasma cells) and in MPC11 plasmocytoma cells where irf4 can be conditionally deleted [Citation56]. Spl, spleen; BM, bone marrow. (d) Follicular (FO), marginal zone (MZ), surface IgA- (IgA), IgM- (IgM) and double Ig-negative (DN) plasmablast/plasma cells were sorted from spleen and bone marrow of four C57/Bl6 mice. Tfg mRNA abundance relative to Actb was determined by TaqMan quantitative real-time PCR of RNA prepared from sorted cells as well as from 72 h LPS-activated splenic b cells (LPS). Means -/+ SD of three technical replicates and two biological replicates are shown
![Figure 1. Upregulation of Tfg during plasma cell differentiation. (a)-(c) Published, freely available datasets from RNA-Seq data from WT mice or irf4 KO mice [Citation24,Citation56,Citation57] were assessed for abundance of Tfg mRNA in B cells subsets: pro- (proB), pre- (preB), immature (Im) and mature (Ma), B1a, FO (follicular), MZ (marginal zone), GC (germinal center) B cells, PB (plasmablasts), PC (plasma cells) and in MPC11 plasmocytoma cells where irf4 can be conditionally deleted [Citation56]. Spl, spleen; BM, bone marrow. (d) Follicular (FO), marginal zone (MZ), surface IgA- (IgA), IgM- (IgM) and double Ig-negative (DN) plasmablast/plasma cells were sorted from spleen and bone marrow of four C57/Bl6 mice. Tfg mRNA abundance relative to Actb was determined by TaqMan quantitative real-time PCR of RNA prepared from sorted cells as well as from 72 h LPS-activated splenic b cells (LPS). Means -/+ SD of three technical replicates and two biological replicates are shown](/cms/asset/4c75ee94-1f15-497b-9a1d-b78a3eb95459/kaup_a_1821546_f0001_oc.jpg)
To address whether TFG becomes upregulated during differentiation of B cells into Ab-secreting cells at the protein level, purified splenic B cells were activated with LPS, the most efficient inducer of murine plasma cells, and with non-methylated CpG oligonucleotide ()). CpG is a potent activator of FO B cells which does not support their plasma cell differentiation to a significant extent but still enables IgM secretion [Citation13,Citation14]. In contrast, CpG drives the rapid development of IgM-secreting plasmablasts from murine CD5-positive B1 B cells [Citation13,Citation17]. Both LPS and CpG led to an upregulation of TFG protein in splenic B cells ()). TFG was already expressed and became only slightly upregulated in the pre-activated, already Ab-secreting B1 B cells [Citation17] by LPS and CpG ()). Together, these data suggest that TFG could have a function in activated B cells and Ab-secreting plasma cells.
Figure 2. Upregulation of TFG during plasmablast differentiation. (a) Murine splenic B cells were purified and activated over the indicated time course with LPS or CpG. Protein lysates were tested for TFG, ACTB/ACTIN and Ig μ heavy chain abundance by western blotting. A representative of three independent experiments is shown, positions of molecular mass standards are indicated on the left. (b) Peritoneal B1 B cells were sorted and activated over the indicated time course with LPS or CpG. Protein lysates were tested for TFG, ACTB/ACTIN and Ig μ heavy chain abundance by western blotting. Representative of two experiments, positions of molecular mass standards are indicated on the left. (c) Quantification (mean + SD) of the experiments shown in A and B
TFG contributes to the survival of CH12 B cells
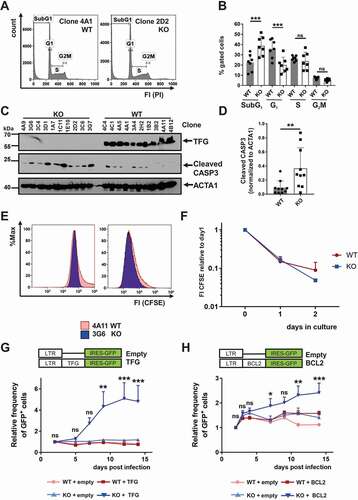
To assess the function of TFG in B cells, we deleted the tfg gene in the CH12 B lymphoma cell line that can be driven toward a secretory phenotype with LPS [Citation59], because several attempts to delete tfg in two plasmacytoma lines (Mork and MOPC104E [Citation60,Citation61]) failed. CH12 cells are a surrogate model for B1 B cells based on the expression of surface markers, such as CD5, and B cell receptor specificity [Citation62,Citation63]. As expected for a B1 B cell, the BCR in CH12 cells is uncoupled from NFKB activation (Figure S2A, B), because there was no BCR-induced degradation of NFKBIA protein or upregulation of Nfkbia message, in contrast to CD40 activation. Multiple clones from cultures subjected to CRISPR-CAS9-mediated tfg gene targeting lost TFG protein signals on western blot, while other transfected clones displaying regular TFG expression served as controls (Figure S2C). Sequencing confirmed identical genetic deletions of tfg on both alleles in some clones while different deletions occurred on the two alleles in the other clones (Figure S2D and data not shown). All variant sub-lines used in this study had different tfg mutations. CH12 cells lacking TFG expression (tfg knockout [KO] CH12 cell) displayed a markedly reduced cell growth in culture, prompting us to assess the cell cycle status [Citation64] ()). tfg KO CH12 cells were enriched roughly 2-fold in SubG1 (apoptotic) and 1.5-fold less in G1, but there were no differences in S and G2/M-phases of the cell cycle ()), suggesting increased apoptosis. To obtain evidence for regulation of apoptosis through TFG we determined abundance of cleaved CASP3 by western blotting ()). Cleaved CASP3 was more abundant in tfg KO CH12 cells, suggesting that TFG prevents in fact apoptosis in CH12 cells ()). In support, proliferation, as detected by carboxyfluorescein succinimidyl ester (CFSE) labeling and dye dilution assays, was equal in tfg WT and KO B cells ()). To exclude off-target effects, we restored TFG expression in tfg WT and KO B cells with retroviruses encoding TFG in combination with an internal ribosomal entry site (IRES)-driven green fluorescent protein (GFP) expression (TFG-IRES-GFP or IRES-GFP) (Figure S3A, B). Infected cultures were tracked for the frequency of GFP+ cells over 14 days after infection ()), showing a 5-fold increase in the frequency of TFG-IRES-GFP+ KO CH12 cells, whereas the frequency of GFP+ cells in tfg KO cultures infected with the control virus (no TFG) did not. There was also no increase in GFP+ cells in WT CH12 cultures infected with both the TFG-expressing and the GFP control virus, suggesting that TFG overexpression is only beneficial in tfg KO but not in WT CH12 cells ()). To test whether the beneficial effect of TFG re-expression is due to an anti-apoptotic effect, we performed the same experiment with a BCL2-IRES-GFP encoding retrovirus (), Figure S3C, D). BCL2 stabilizes mitochondria and blocks the intrinsic apoptosis pathway [Citation65]. Here we found that CH12 tfg KO B cells profited most from the anti-apoptotic function of BCL2, but the enrichment of GFP+ cells was only 3-fold and thereby less pronounced than for TFG expression. We conclude that TFG has a specific pro-survival function in CH12 B cells that is not only due to the stabilization of mitochondrial integrity.
Figure 3. TFG exerts anti-apoptotic functions in CH12 B cells. (a) Flow cytometric analysis of the DNA content of CH12 tfg WT and tfg KO B cells using propidium iodide staining (PI). Representative histogram overlay, FI: fluorescence intensity. (b) Statistical analysis of cell cycle and apoptosis of tfg WT and tfg KO CH12 B cells (7 independent clones each, two-way ANOVA with Sidak’s multiple comparisons test, *** p < 0.001, according to the gating in A. (c) Lysates of tfg WT and tfg KO CH12 B cells (clones as illustrated on the top) were analyzed for the expression of ACTA1/ACTIN, TFG and cleaved CASP3 by western blotting as indicated. Molecular mass standards (kDa) are shown on the left, (d) Quantification of cleaved CASP3 relative to ACTA1/ACTIN from the western blot shown in C. (e) tfg WT and tfg KO CH12 B cells were labeled with CFSE and analyzed after 2 d by flow cytometry. Shown is a representative histogram overlay. (f) Quantification of CFSE median fluorescence intensity over time. (g) CH12 tfg WT and tfg KO B cells (7 clones each) were infected with retroviruses encoding TFG-IRES-GFP or IRES-GFP (empty) alone. LTR: long terminal repeat. The frequency of GFP+ cells was monitored over 14 d by flow cytometry and is shown relative to day 2. Two-way ANOVA with Tukey´s multiple comparisons test, *** p < 0.001, ** p < 0.01. (h) CH12 tfg WT and tfg KO B cells (7 clones each) were infected with retroviruses encoding BCL2-IRES-GFP or IRES-GFP alone (empty). LTR: long terminal repeat. The frequency of GFP+ cells was monitored over 14 d by flow cytometry and is shown relative to day 2. Two-way ANOVA with Tukey´s multiple comparisons test, * p < 0.05, ** p < 0.01, *** p < 0.001
TFG is involved in ER organization in B cells
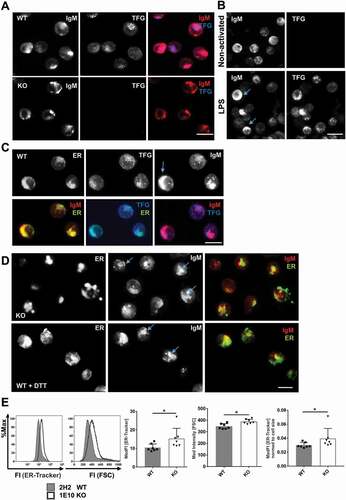
Next, we examined TFG localization by immunofluorescence in CH12 tfg WT and KO B cells ()). We also stained IgM, as the BCR is the hallmark of B cells and exists as a transmembrane and a secreted form, both of which pass the ER and the Golgi. TFG showed a polarized vesicular expression ()). TFG was also readily detectable in discrete puncta in LPS-activated splenic B cells by immunofluorescence, where its expression correlated well with IgMhigh cells (), lower panel), which is in accordance with the western blot data in ). Colocalization analysis of CH12 cells revealed that ~80% of TFG overlapped with IgM but only a very minor part of IgM overlapped with TFG (Figure S4B). In tfg WT CH12 cells as well as in LPS-activated primary B cells IgM coalesced in large polarized caps (); see arrows) that could be ER structures. In line, approximately 70% of IgM-positive pixels overlapped with ER-Tracker but only about 35% of ER-positive pixels overlapped with IgM in both tfg WT and KO B cells (Figure S4D, E).
Figure 4. TFG localizes in vesicular structures and controls endoplasmic reticulum (ER) expansion in CH12 B cells. (a) CH12 tfg WT and KO cells were stained for IgM and TFG by indirect immunofluorescence and analyzed by confocal microscopy (single plane), scale bar, 8 μm, (b) Naïve and LPS-activated splenic B cells (3 d) were stained for intracellular IgM and TFG and analyzed by confocal microscopy (3D projection of 8 confocal planes, 1 μm each). Please note that the exposure time for IgM was much shorter than for non-activated cells due to the robust IgM signal (compare )). Scale bar, 10 μm, (c) CH12 WT cells were stained with ER-Tracker Blue-White and for IgM and TFG by indirect immunofluorescence and analyzed by confocal microscopy (3D projection of 7 single planes, 1 μm each), scale bar, 8 μm, (d) Upper panel: CH12 KO cells were stained with ER-Tracker Blue-White and IgM and analyzed by confocal microscopy (3D projection of 7 single planes, 1 μm each). Lower panel: CH12 WT cells were attached to glass slides in the presence of 1 mM dithiothreitol (DTT) for 3 h, stained for IgM and TFG by indirect immunofluorescence and analyzed by confocal microscopy (3D projection of 7 single planes, 1 μm each), scale bar, 8 μm (e) CH12 tfg WT and KO B cells (7 variant independent clones) were incubated with ER-Tracker Blue-White. Representative histogram overlays for ER-Tracker and forward scatter (FSC) are shown on the left. ER volume was measured by flow cytometry and normalized to cell size. Median fluorescence intensities are depicted, Mann Whitney U-test, * p < 0.05
Regarding TFG and the ER, colocalization analysis in CH12 cells showed that TFG was closely associated with the ER-Tracker (Figure S4C) but TFG covered only parts of the ER staining (); Figure S4C). This fits to its reported colocalization to specialized ER structures [Citation52]. In tfg KO B cells, IgM was not polarized in large coalescent structures but accumulated in vesicles of different sizes, similar to the likewise disintegrated ER structures (), upper panel; Figure S5). The disintegrated ER structures of tfg KO B cells (Figure S5) could potentially indicate ER stress or missing ER turnover. To test this idea, we treated WT B cells with dithiothreitol (DTT; 1 mM) to elicit ER stress [Citation66]. This treatment disrupted the ER in a fashion similar to tfg KO (), lower panel; Figure S5), suggesting that KO B cells experience basal ER stress. We next assessed whether ER stress would change the connections between TFG, IgM and the ER. ER stress induced by DTT or tunicamycin, an N-glycosylation inhibitor [Citation67], reduced the colocalization of TFG with ER-positive pixels (Figure S4C). IgM also colocalized less with the ER under induced ER stress in tfg WT B cells but remained associated with the ER even under forced ER stress in tfg KO B cells (Figure S4E). One might speculate that only tfg WT B cells may be able to translocate IgM molecules to different cell compartments when they experience ER stress, which may be related to the colocalization of TFG with a part of IgM-positive structures (Figure S4C).
To exclude artifacts due to fixation we also performed live cell staining with the ER-Tracker (Movies S1-4). This experiment corroborated that CH12 WT B cells have a fine, connected and dense ER network in both normal culture medium and HBSS, whereas this network is disrupted in CH12 tfg KO B cells (compare also Figure S5). This suggested that CH12 tfg KO B cells may experience ER stress that can lead to an expanded ER [Citation68]. Indeed, flow cytometric analyses revealed an increased ER abundance in tfg KO B cells ()), indicating ER stress or a potentially reduced ER turnover. Cell size was similarly increased, but even after normalization to cell size, ER abundance was still higher in tfg KO B cells ()). Considering this notion and the disrupted organization of IgM vesicles, we assessed the surface expression of specific B cell surface molecules. We found that tfg KO CH12 cells expressed more CD5 on the cell surface at the expense of IgM and IgD abundance. CD19, CD44 or CD72 expression were not altered (Figure S6). In summary, these data suggest that TFG is involved in the surface trafficking of the BCR through the ER.
ER stress markers are upregulated in CH12 tfg KO B cells
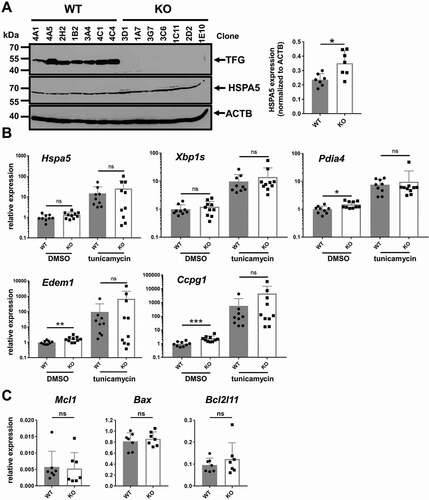
To analyze whether the tfg KO CH12 cells experience ER stress, we quantified HSPA5/BIP [Citation69], a classical marker for ER stress induced by unfolded proteins [Citation70]. HSPA5 was more abundant in tfg KO than in wild-type CH12 cells ()). In addition, ER stress markers were upregulated in tfg KO B cells ()), namely the chaperone Pdia4/Erp72, Ccpg1, a reticulophagy receptor [Citation71], and Edem1, a mannosidase involved in ERAD [Citation72]. Hspa5 was not upregulated at the mRNA level, suggesting a posttranslational process controlling increased protein abundance [Citation73] in CH12 tfg KO B cells, which is consistent with our finding of increased ER mass. To corroborate that the genes we analyzed are targets of ER stress, we treated the cells with tunicamycin. This treatment clearly induced the expression of all the selected genes in both tfg WT and KO B cells except of Edem1 in the KO B cells (); Hspa5 WT: p = 0.0039, Hspa5 KO: p = 0.0371, Edem1 WT: p = 0.0039, Edem1 KO: p = 0.1309, Xbp1s WT: p = 0.0039, Xbp1s KO: p = 0.0020, Ccpg1 WT: p = 0.0039, Ccpg1 KO: p = 0.0020, Pdia4 WT: p = 0.0039, Pdia4 KO: p = 0.0020, Wilcoxon matched-pairs rank test). All of them showed trends of higher expression in tfg KO B cells, albeit not statistically significant, most likely due to the expected massive upregulation also in tfg WT B cells. In contrast, the tfg ablation in CH12 cells did not result in a change in the expression of the pro-/anti-apoptotic genes Mcl1, Bax and Bcl2l11/Bim ()), which is in accordance with the relatively minor effect of BCL2 expression on survival advantages in tfg KO B cells ()).
Figure 5. Elevated ER stress markers in CH12 tfg KO B cells. (a) CH12 tfg WT and KO B cells were lysed and TFG, HSPA5 and ACTB/ACTIN protein amount was assessed by western blotting as indicated. Molecular mass standards (kDa) are shown on the left. Quantification of HSPA5 abundance relative to ACTB is shown on the right. Mann Whitney U-test, * p < 0.05. (b) qPCR analysis of Hspa5, Pdia4, Xbp1s, Ccpg1 and Edem1 transcripts in CH12 tfg WT and KO B cells (7 clones each) kept in medium + solvent (DMSO) or tunicamyin, Mann Whitney U-test, * p < 0.05, ** p < 0.01, ***, p < 0.001 (c) qPCR analysis of Mcl1, Bax and Bcl2l11 expression in CH12 tfg WT and KO B cells (9 WT clones and 10 KO clones), Mann Whitney U-test, n.s
TFG alleviates ER stress in CH12 B cells
To determine whether TFG is required in B cells to cope with increased ER stress, we treated WT and KO CH12 B cells with inducers of ER and Golgi stress: the glycosylation inhibitor tunicamycin, the protein trafficking blockers brefeldin A and monensin, and the proteasome inhibitor MG132. Plasmacytoma cells expressing high amounts of Ig are especially vulnerable to proteasome inhibition very likely by increasing the ER-load of misfolded polypeptides [Citation32]. Brefeldin A prevents budding of COPI coats from Golgi membranes. Brefeldin A also induces fusion of the Golgi with the ER but has little effect on the ERGIC, which keeps its identity, although the ERGIC clusters become more abundant and more uniformly distributed in the cytoplasm of the cells [Citation74]. Monensin prevents protein secretion from medial to trans cisternae of the Golgi and exit from the ERGIC [Citation75], thereby, affecting the ERGIC. Whereas brefeldin A treatment did reduce the viability of CH12 B cells, the loss of TFG did not augment this effect ()). However, less CH12 tfg KO cells were viable after treatment with MG132, monensin and tunicamycin ()), showing that TFG prevents ER and ERGIC-associated stress in B cells.
Figure 6. TFG ameliorates ER stress in CH12 B cells. (a)-(d) CH12 tfg WT and KO cells (7 clones each) were incubated with medium including carrier (DMSO or H2O) or the respective compound as indicated for 24 h. Viability was assessed by ANXA5-PI staining (upper panels). ER abundance was assessed by ER-Tracker Blue-White staining and flow cytometry (lower panels), Mann Whitney U-test, * p < 0.05, ** p < 0.01. (e) CH12 tfg WT and KO cells were infected with retroviruses encoding the functional μ heavy chain (μHC) 17.2.25 with IRES-GFP. LTR: long terminal repeat. The frequency of GFP+ cells was determined over 6 d and is represented relative to the frequency of GFP+ cells 1 d after infection. Intracellular IgM abundance as well as ER volume were determined by flow cytometry on day 7, Statistics: Two-way ANOVA for kinetic, Mann Whitney U-test for IgM and ER-Tracker, (f) CH12 tfg WT and KO cells were infected with retroviruses encoding the dysfunctional μ heavy chain (μHC) VH81.X with IRES-GFP. LTR: long terminal repeat. The frequency of GFP+ cells was determined over 6 d and is represented relative to the frequency of GFP+ cells 1 d after infection (=1). Intracellular IgM abundance as well as ER volume were determined by flow cytometry on day 7, Statistics: Two-way ANOVA for kinetic, Mann Whitney U-test for IgM and ER-Tracker, * p < 0.05, ** p < 0.01, (g) Lysates of 4 different CH12 tfg WT clones treated with DMSO or tunicamycin (see above) were separated by 15% SDS-PAGE, transferred to nitrocellulose and membranes were probed with antibodies as indicated on the right. Molecular mass standards are shown on the left (kDa). Mann-Whitney U-test, ** p < 0.01
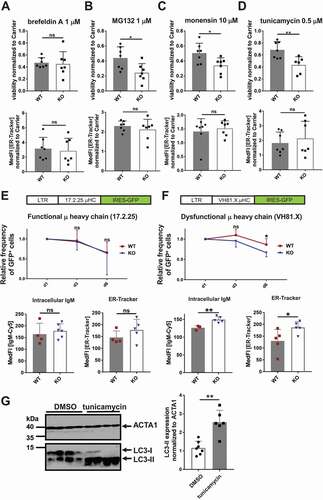
Next, we sought to elicit more physiological ER stress. B cells with increased synthesis of membrane and secreted Ig, such as developing plasma cells or activated B1 B cells need to cope with ER stress [Citation76]. Most notably, IgM becomes upregulated in activated B cells differentiating into plasmablasts and plasma cells (compare ) and (c)), which imposes ER stress and UPR activation [Citation77]. To mimic IgM upregulation and to elicit more physiological ER stress, we infected tfg WT and tfg KO CH12 cells with retroviruses encoding membrane-bound μHC with different V-Regions (idiotypes). One µHC pairs well with LC and is permissive for surface transport (17.2.25 idiotype [Citation78]); another is a so-called dysfunctional μHC idiotype, i.e., it cannot pair with LC and becomes trapped in the ER (VH81.X idiotype) [Citation9]). The retroviral vectors also contained an IRES-GFP cassette following the open reading frame of μHC. Frequencies of infected GFP+ cells were tracked over six days to assess how the transduced B cells maintain µHC expression.
The abundance of intracellular functional µHC was not affected in tfg KO CH12 cells when compared to WT CH12 cells and decreased similarly over time ()). There was no difference in intracellular IgM expression or ER-Tracker staining ()). In contrast, when compared to TFG-positive CH12 subclones, the tfg KO CH12 cells had a higher abundance of the intracellular dysfunctional µHC and ER membranes. Additionally, dysfunctional μHC/GFP-positive cells were outcompeted faster by GFP-negative cells in infected tfg KO CH12 cultures when compared to infected WT CH12 cultures ()). Based on these findings, we conclude that TFG equips CH12 B cells with the capacity to cope with ER stress induced by proteasome inhibition, inhibition of glycosylation, ERGIC remodeling and particularly with IgM-induced ER stress. These findings fit well with the previously described localization and function of TFG in the ERGIC [Citation51]. To our surprise, we did not detect different amounts of IgM in supernatants analyzed from anti-CD40 and LPS stimulated CH12 tfg WT and KO B cells whereas tunicamycin did prevent accumulation of IgM and IgG in supernatants of LPS activated primary B cells (Figure S7). The mechanism by which TFG supports handling of ER stress may involve the turnover of ER-bound IgM (compare Figure S4) along with ER membranes. To test the latter, we treated CH12 tfg WT B cells with tunicamycin and examined LC3 abundance (). Tunicamycin elicited a massive induction of LC3-II, suggesting that induced ER stress in CH12 B cells involves autophagy.
TFG supports autophagy flux in CH12 B cells
The membranes supporting the formation of autophagosomes originate at least partially from the ER, and it has been proposed that specific reticulophagy may be particularly relevant for plasma cell biology [Citation44,Citation79]. The accumulation of LC3 after tunicamycin treatment of tfg WT CH12 cells ()) and of the ER in tfg KO CH12 cells ()) could point to a function of TFG in selective reticulophagy or autophagy, also because we found an upregulation of Ccpg1, a specific reticulophagy receptor, in tfg KO CH12 cells ()). Therefore, we assessed whether TFG contributes to autophagy.
Intriguingly, we observed more LC3 expression in tfg KO B cells, with both LC3-I and LC3-II isoforms being increased ()). Re-introduction of TFG into CH12 tfg KO B cells reverted this effect ()). An increase in the LC3-II isoform could indicate reduced autophagy flux [Citation80]. To examine this in more detail, we treated tfg WT and tfg KO CH12 cells with NH4Cl, thereby preventing the acidification of lysosomes. This treatment will typically lead to an accumulation of LC3-II, but if autophagy flux is hampered, the ratio of LC3-II [treated]:[non-treated] will be reduced [Citation80]. NH4Cl treatment strongly increased LC3-II in tfg WT B cells, but much less in tfg KO CH12 cells ()). These data point to a reduction of autophagy flux in CH12 B cells due to the loss of tfg.
Figure 7. TFG is required for autophagy flux in CH12 B cells. (a) Lysates of CH12 tfg WT and tfg KO B cell clones were separated by 15% SDS-PAGE, transferred to nitrocellulose and membranes were probed with antibodies as indicated on the right. Molecular mass standards are shown on the left (kDa). Three WT and KO clones are shown, representative of 7 clones in total. (b) Quantification of LC3-I and LC3-II expression relative to ACTB/ACTIN. Mann Whitney U-test, * p < 0.05, ** p < 0.01. (c) CH12 tfg KO cells were infected with retroviruses encoding or IRES-GFP (-) or TFG-IRES-GFP (+) and GFP+ cells were sorted. Lysates of those cells were separated by 15% SDS-PAGE, transferred to nitrocellulose and membranes were probed with antibodies as indicated on the right. Molecular mass standards are shown on the left (kDa). All sections are from the same gel and exposure. (d) CH12 tfg WT and tfg KO cells were incubated in the presence or absence of NH4Cl and lysates were resolved by 15% SDS-PAGE (a representative gel is shown). Gels were blotted and blots were probed with antibodies indicated on the right. Molecular mass standards (kDa) are shown on the left. Arrows indicate positions of LC3-I and LC3-II. All sections are from the same gel and exposure. (e) Quantification and statistical analysis of LC3 turnover. One dot represents one clone, Mann Whitney U-test, ** p < 0.01. (f) CH12 tfg WT and KO B cells were fixed, embedded and analyzed by transmission electron microscopy. Representative images are shown on the left (magnification, x35970). Arrows point to autophagosomes. (g) Quantification of the number and size of autophagosomes (summary of two clones with 30–60 cells counted for each clone and condition); non-paired student’s t-test, ****p < 0.0005
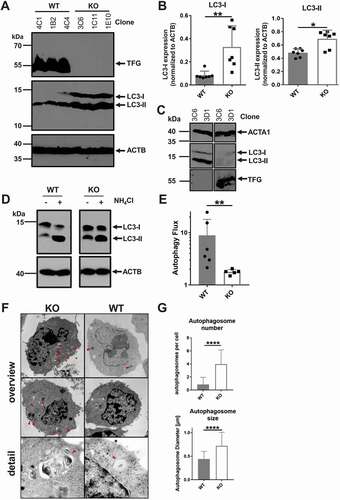
To support this notion, we analyzed tfg WT and tfg KO CH12 cells by electron microscopy. tfg KO B cells showed large autophagosomes that were densely packed with membranous material ()). Quantification unraveled that tfg KO B cells contained on average four autophagosomes per cell, in contrast to one in CH12 tfg WT B cells. Not only were there more autophagosomes due to the loss of TFG, but they were also larger ()).
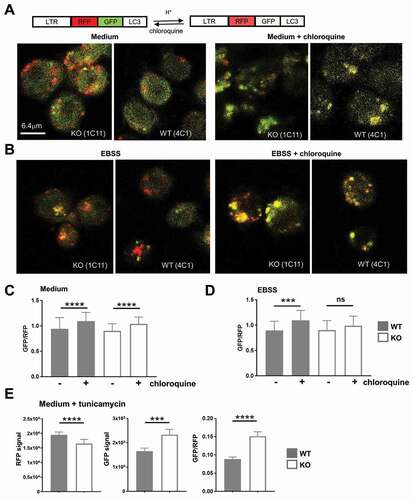
To further investigate autophagy flux, we infected tfg KO and WT cells with retroviral particles encoding tandem fluorescent LC3 (tfLC3) [Citation81], a RFP-GFP-LC3 fusion protein [Citation82] (, Figure S8A). Because RFP is more stable under acidic conditions than GFP, increased autophagy flux leads to a decrease in the GFP:RFP ratio when the autophagosomes have fused with lysosomes [Citation82]. When acidification of autolysosomes is blocked by chloroquine or other inhibitors, GFP-LC3 fluorescence will increase when there is an excessive autophagy flux [Citation80]. Chloroquine elicited an increase in more GFP-positive autolysosomes in normal medium independently of TFG ()). We next incubated the cells in EBSS medium to induce autophagy in the presence or absence of chloroquine. Representative images are shown in ) and the GFP and RFP fluorescence intensities of single autophagosomes were quantified (Figure S8B, C). In contrast to basal conditions, the GFP:RFP ratio of autophagosomes was only increased in tfg WT B cells when autophagy was induced by starvation in EBSS medium ()), strongly suggesting an increased autophagy flux mediated by TFG. Interestingly, GFP fluorescence intensities in transduced tfg WT B cells were lower than in KO B cells in normal medium and RFP intensities were still lower when chloroquine was added (Figure S8B, C), indicating potentially a more efficient delivery of LC3-tagged autophagosomes to acidic compartments [Citation80]. To establish a functional connection of ER stress with autophagy flux mediated by TFG, we treated the cells with tunicamycin (compare ). Tunicamycin induced a stronger autophagy flux in CH12 tfg WT cells than in CH12 tfg KO B cells because we observed a lower GFP:RFP ratio of the tfLC3 construct in autophagosomes ()). Taken together, four lines of evidence argue for an efficient induction of autophagy but a reduced autophagy flux in tfg KO B cells: 1) higher LC3-I and LC3-II content, 2) less LC3-II turnover, 3) increased numbers and larger autophagosomes under basal conditions and 4) decreased GFP:RFP ratios in starved and chloroquine treated KO B cells. In summary, we conclude from the experiments with TFG-deficient CH12 cells that TFG alleviates ER stress and supports autophagy in B cells. Its strong upregulation in plasma cells suggests that these cells use TFG to cope with ER overload in response to increased antibody production.
Figure 8. TFG supports autophagosome turnover in CH12 B cells. (a) CH12 tfg WT (4 C1) and KO B cells (1E10) were infected with a retrovirus encoding the RFP-GFP-LC3-fusion protein. LTR: long terminal repeat; RFP, red fluorescence protein. Cells kept for 2 h in medium with or without 100 µM chloroquine were attached to glass slides, fixed and analyzed by confocal microscopy (single plane). (b) CH12 tfg WT (4 C1) and KO B cells (1E10) were infected with a retrovirus encoding the RFP-GFP-LC3 fusion protein. Cells were attached to glass slides in EBSS for 2 h with or without 100 µM chloroquine, fixed and analyzed by confocal microscopy (single plane). (c), (d) GFP:RFP ratios of single autophagosomes (please see Figure S8) were calculated and are depicted as mean and SD; student’s t-test, *** p < 0.001, **** p < 0.0001, (e) CH12 tfg WT (clones 3A4, 4C1, 4C4) and KO B cells (clones 1C11, 1E10) were infected with a retrovirus encoding the RFP-GFP-LC3 fusion protein. Cells were attached to glass slides in medium for 2 h with or without 5 μM tuncamycin and fixed. GFP and RFP fluorescence intensities of single autophagosomes (392–798 per condition) were determined by confocal microscopy (single plane). Data are not represented by scatter plots due to too many data points and are shown as median +95% CI student’s t-test: *** p < 0.001, **** p < 0.0001
Discussion
The development of antibody-secreting plasma cells is essential for vaccination and humoral immunity, but pathogenic plasma cells can cause autoimmune diseases or malignancies. Finding the Achilles heel of plasma cells can help to improve vaccination strategies against infectious disease or find novel approaches to treat plasma cell diseases like lupus or multiple myeloma. Increasing evidence suggests that metabolic traits rather than specific signaling pathways are relevant for plasma cell survival [Citation19]. A particularly important trait is protein homeostasis that is exquisitely coupled to the high antibody production in plasma cells [Citation32,Citation83]. Here, we identified such a mechanism by showing that the PB1 domain-containing protein TFG is, in contrast to naïve B cells, abundantly expressed in plasma cells. Based on experiments with tfg KO variants of the B1-like B cell line CH12, we propose that TFG equips activated B cells and very likely plasma cells to cope with ER stress via maintaining autophagy flux. We are aware that CH12 cells are not plasmacytoma cells because they secrete comparably low amounts of Ig. Together with the sheep red blood cell specificity of the CH12 BCR, its uncoupling from the NFKB pathway and presence of the B1 marker CD5 [Citation63], CH12 can be classified as a B1 B cell line [Citation17,Citation84]. B1 B cells do depend exquisitely on glycolysis and autophagy [Citation85]. Since TFG is expressed in primary B1 B cells, our data could be relevant for functionality of B1 B cells. In addition to a metabolic role, we propose a signal-modulating function of TFG: Upregulation of TFG by TLR stimulation may facilitate surface expression of IgM along with downregulation of CD5 and would, therefore, support TLR-mediated B1 B cell responses in a positive feedback loop [Citation18]. This issue will be addressed in the future using conditional tfg knockout mice. Knocking out tfg in Ig-secreting plasmacytoma cells would have been the ideal in vitro approach. However, we failed to obtain tfg KO plasmacytomas, likely due to multiploidy or an absolute requirement of TFG function for the in vitro growth of the plasmacytoma cells used in this study. Accordingly, TFG is also crucial in CH12 cells for cell growth. Tonic surface BCR survival signals or constitutive NFKB signals [Citation86,Citation87], strong anti-apoptotic driver mutations or the comparably low Ig secretion rate may allow CH12 cells to tolerate tfg deletion in contrast to the plasmacytomas.
Notwithstanding, when compared to wild-type CH12 cells, tfg KO variant clones grew slower and showed increased apoptosis. In line, expressing BCL2 in tfg KO B cells had an advantage, however, not as much as re-introducing TFG. BCL2 blocks the intrinsic apoptotic pathway based on APAF1-CASP9 [Citation65] but ER stress can induce a parallel pro-apoptotic signaling cascade via CAPN-CASP12 [Citation88]. It is tempting to speculate that TFG prevents apoptosis in CH12 cells via the prevention of ER stress and CASP12 activation. In support, we did not see an altered expression of pro-/anti-apoptotic genes involved in the intrinsic mitochondrial pathway but did observe more cleaved CASP3 in CH12 tfg KO B cells, indicative of apoptosis induction. Additionally, BCL2 may be unable to rescue CH12 tfg KO B cells as efficiently as TFG does itself because BCL2 suppresses autophagy via its interaction with BECN1 [Citation89]. This second function of BCL2 could therefore have paradoxical effects on tfg KO B cells and even increase ER stress.
TFG has been reported to be essential for the secretion of large cargo, such as collagen [Citation51]. Hence, we expected TFG to be essential for secretion of polymeric IgM that has a considerably high molecular mass of ~900 kDa and contains ten LC, ten HC, one J chain and 80 disulfide bonds. Moreover, TFG is even important for the secretion of the rather small insulin molecule from β-cell islets, as well as for the survival of pancreatic β-cells [Citation54]. We were therefore surprised to see equal IgM amounts in supernatants of CH12 tfg WT and KO B cells. This may fit to the observation by another group [Citation44] that B cells devoid of autophagy actually secrete more antibodies than normal B cells. Given that TFG supports autophagy flux, B cells lacking TFG may counterregulate the expected reduced antibody secretion rate, perhaps through missing antibody turnover. One consequence could be secretion of low quality antibodies, a possibility that warrants further investigation. Furthermore, we speculate that the requirement of TFG for surface transport or secretion of proteins may be driven by a balance of quantity, cargo structure and cellular adaption. In line with this suggestion, TFG controls surface expression of IgM and IgD but limits the surface abundance of CD5, while CD44, CD19 and CD72 are not affected. Hence, TFG might only be required for Ig secretion in primary antibody-secreting cells when Ig production exceeds a certain threshold, when membrane Ig becomes upregulated or when μHC idiotypes are expressed that cause ER stress. Evidence for the latter proposal is provided by our transduction experiment using a dysfunctional μHC [Citation9] that was maintained worse in CH12 tfg KO B cells and accumulated in parallel to increased ER volume. The latter corroborated our hypothesis proposing a role for TFG in ER turnover. One explanation could be that TFG is required for the delivery of COPII vesicles originating from the ER to the ERGIC. Lack of TFG would then cause jamming of the ER. Another not mutually exclusive explanation could be that TFG links the ER protein load and autophagy. Indeed, a specific autophagy pathway is reticulophagy [Citation79], involving specific autophagy receptors such as CCPG1 [Citation71]. We observed an upregulation of Ccpg1 in tfg KO B cells. This would argue for an increased propensity of tfg KO B cells to undergo reticulophagy, perhaps due to basal ER stress. Counterintuitively, the ER was expanded quantitatively in tfg KO B cells, albeit with apparently poor quality, which corroborates previous studies in pancreatic β-cells and neurons [Citation48,Citation54]. It is possible that reticulophagy pathways are activated in tfg KO B cells but cannot be executed due to impaired clearance of autophagosomes. Vice versa, we cannot exclude that tfg KO B cells experience ER stress due to impaired clearance of autophagosomes, creating an upstream block of ER membrane turnover. Nevertheless, our data underscore previous findings revealing that B cells devoid of autophagy due to deletion of atg5 have an expanded ER [Citation44]. In contrast to a deletion of atg5, our experiments show that TFG is not required for onset of autophagy, as we observed very efficient lipidation of LC3 and increased abundance and size of autophagosomes in tfg KO B cells. Rather, our data support a function of TFG in promoting autophagy flux. Hence, our findings describe a different mechanism for the function of autophagy in B cells since a deletion of atg5 blocks induction of autophagy at an early stage.
Tfg is expressed in pre-B cells that assemble an Ig HC for the first time during B cell development and that undergo a proliferative burst requiring metabolic reprogramming [Citation90]. At these early steps, autophagy also plays an important role [Citation91]. Autophagy is only a cell’s backup system for garbage removal because the proteasome is very active. Importantly, another function of autophagy is the catabolic recycling of proteins and lipids (for a recent review, see [Citation92]). Indeed, TFG positively regulates lipid synthesis pathways via lipogenic regulators in sebocytes [Citation55]. Therefore, by enabling autophagy flux, TFG may support energy homeostasis at various B cell stages, a possibility that warrants investigation in primary tfg-/- B cells.
Increased metabolism controls plasma cell development via mTOR, an important regulator of cell size [Citation20]. TFG has been described as positive regulator of cell size in C. elegans [Citation47] and we hypothesized that TFG would act similarly in activated B cells. Therefore, the increased cell size due to tfg KO was surprising and we rejected our original hypothesis. The increased cell size of tfg KO B cells may be a consequence of physiological swelling due to osmotic dysbalance as a consequence of ER dysfunction, or due to increased mTOR activity, which is known to inhibit autophagy.
How TFG regulates autophagy flux is not yet clear. The calculation of tfLC3 GFP:RFP ratios suggests that TFG controls acidification of the autophagosome during starvation-induced autophagy. On the other hand, the biochemical LC3 turnover assays suggest that TFG controls autophagy flux also under basal conditions. How can these findings be reconciled? We did observe more and larger autophagosomes under basal conditions by EM and we also observed more tfLC3 puncta under basal conditions in tfg KO cells. The fact that the ratios of GFP:RFP were not affected by tfg KO under basal conditions may be biased through the sheer number of autophagosomes under basal conditions: Those few autophagosomes that are not cleared in tfg WT CH12 cells show logically the same GFP:RFP ratio as in tfg KO B cells where they are not cleared either. Moreover, both GFP and RFP fluorescence intensities of the puncta were lower in tfg WT cells, also arguing for more efficient fusion of autophagosomes with lysosomes under basal conditions. We suggest that TFG controls the maturation of autophagosomes to autolysosomes via guidance clues, similar to EPG5 [Citation93] and to its function in guiding COPII vesicles from the ER to the ERGIC, thereby, forming a dynamic structural hub to support autophagosome-lysosome fusion. The fact that TFG is involved in autophagy flux is relevant for the other cell types such as β-cells [Citation54] and sebocytes [Citation55]. Mutations of human tfg can lead to decreased survival of motor neurons leading to the onset of paraplegia (reviewed in [Citation94]). The support of average autophagy flux through TFG might also be relevant in these types of diseases [Citation95]. In summary, we have shown here that TFG becomes upregulated during B2 B cell activation and differentiation parallel to the upregulation of IgM. We propose that TFG alleviates ER stress in B cells through positive regulation of autophagy flux.
Acknowledgments
This work was funded by the Deutsche Forschungsgemeinschaft (DFG Graduiertenkolleg GRK1660 to DM, HMJ, TW; TRR130, TP03 to DM) and by the RISE program of the German academic exchange service (DAAD) to TS and AH. We thank Uwe Appelt and Markus Mroz for cell sorting and Dr. Björn Stork for the pMSCVpuro-mRFP-EGFP-rLC3 plasmid. We gratefully acknowledge The Optical Imaging Center Erlangen (OICE), especially Dr. Philip Tripal and Dr. Benjamin Schmid.
Materials and Methods
Analysis of gene expression data
Fragments per kilobase million (FPKM) normalized expression values were derived from publicly available gene expression data based on RNA-Seq [Citation24,Citation56,Citation57].
Antibodies
Anti-TFG antibody was described previously [Citation45]. Other antibodies were: mouse anti-ACTB/ACTIN (Sigma Aldrich, A1978), rabbit anti-ACTA1/ACTIN (Sigma Aldrich, A2066), rabbit anti-IRF4 (Cell Signaling Technology, 4964), goat anti-mouse IgM (Southern Biotech, 1021–01), goat anti-mouse IgM-horseradish peroxidase (HRP; Southern Biotech, 1020–05), goat anti-mouse IgG-HRP (Southern Biotech, 1030–05), rat anti-HSPA5/BIP (Santa Cruz Biotechnology, sc-13539), rabbit anti-MAP1LC3B/LC3 (Cell Signaling Technology, 2775S), rabbit anti-cleaved CASP3/CASPASE-3 (Cell Signaling Technology, 9661), goat anti-rabbit IgG-HRP (Jackson Immunoresearch, 111–035-046), goat anti-rat IgG-HRP (Jackson Immunoresearch, 112–035-071).
Assessment of ER structure
CH12 tfg WT and KO B cells were incubated in medium or HBSS (ThermoScientific, 14025–050) for 2 h with or without treatment (1 mM DTT; Sigma Aldrich, D0632) and then with or without ER-Tracker Green (0.5 μM; Invitrogen, E34251) for the remaining 30 min at 37°C, 5% CO2 in an incubator. Cells were then attached to Teflon-coated glass slides (ThermoScientific, ER-208B-CE24) for 15 min in PBS (Gibco Life Technologies, 14190–094) with or without ER-Tracker Green. Cells were washed quickly in PBS and then fixed for 15 min in ice-cold 4% paraformaldehyde (Sigma Aldrich, P6148). Single confocal images (1 μm) were taken at a resolution of 2048 × 2048 pixels with a 63x oil objective (pixel size 50 nm). Profiles of ER structures were created by drawing lines starting from the most prominent ER structure along the complete plasma membrane. Most ER structures of CH12 tfg WT cells were clustered within 45% of the complete profile. Cells harboring an intact ER were classified as having clustered ER structures within 45% of the profile and cells having disrupted ER structures were classified as having additional ER structures with an intensity over 30,000 (a.u.).
Colocalization analysis
CH12 tfg WT and KO B cells were incubated in medium for 2 h with or without treatment (1 mM DTT, 5 µM tunicamycin [Sigma Aldrich, T7765]) and then with or without ER-Tracker Green for the remaining 30 min at 37°C, 5% CO2 in an incubator. Cells were then attached to Teflon-coated glass slides for 15 min in PBS with or without ER-Tracker Green. Cells were washed quickly in PBS and then fixed for 15 min in ice-cold 4% paraformaldehyde. Stainings were performed as described above. Single confocal images containing 8–50 cells (1 μm) were taken at a resolution of 2048 × 2048 pixels with a 63x oil objective (pixel size 50 nm). Weighted colocalization was assessed using ZEN software (Carl Zeiss, Oberkochen, Germany) of several images per clone per condition. Data are presented as mean -/+ SEM of several images (1–5) from each 2 CH12 tfg KO clones (1E10, 1C11) and 3 CH12 tfg WT clones (3C4, 4C1, 4C4). Specifically, colocalization of ER and TFG was done with 9 images per condition, representing 150–200 cells, colocalization of IgM and ER was done with 80–100 cells from 6–9 images per condition and colocalization of IgM and TFG was done with 150 cells from 4–5 images per condition. Data were analyzed with one-way ANOVA and Tukey’s multiple comparisons test.
CRISPR-CAS9 gene targeting
The guide RNAs to target the tfg gene (gRNA_5_fw: 5`CACCGACGGACAGTTGGACCTAAGT3´, gRNA_5_rev: 5`AAACACTTAGGTCCAACTGTCCGTC3´) were selected using an online tool (https://zlab.bio/guide-design-resources) and cloned into pSpCAS9(BB)-2A-GFP (Addgene, pX458; deposited by Feng Zhang [Citation96]). 107 CH12 cells were resuspended in 800 µl OptiMEM (Gibco Life Technologies, 51,985–026) containing 30 µg pX458-Tfg-gRNA5. Cells were electroporated in a 4 mm cuvette with a Bio-Rad GenePulser Xcell (240 V, 475 µF). 24 h after electroporation GFP-positive cells were sorted into 96-well plates with a MoFlo XDP cell sorter (Beckman Coulter, Brea, CA, USA). Single-cell clones were screened by western blot for the presence of TFG protein.
Detection of cell cycle and cell death
Cell cycle analysis was performed according to the method of Nicoletti et al. using 50 µg/ml propidium iodide (Sigma Aldrich, P4864), 1 mg/ml RNAse A (Qiagen, 19101), 0.1% sodium citrate (Sigma Aldrich, 71497), 0.1% Triton X-100 (Merck, 108643) and linear flow cytometry scaling [Citation64,Citation97]. Apoptotic cell death was assessed by ANXA5/ANNEXINV and PI staining (Annexin V Apoptosis Detection Kit APC; eBioscience, 88–8007-72).
Flow cytometry and cell sorting
Cells (2x10⁶-4x10⁶) were pelleted in FACS tubes (Micronic, MP32022) at 300 x g for 5 min at 4°C and resuspended in 50 µl of unlabeled anti-FCGR3/CD16-FCGR2B/CD32 Ab (Invitrogen, 14–0161-86) at 10 μg/ml in FACS-buffer (PBS, 2% fetal calf serum [FCS; Gibco Life Technologies, 10270–106], 0.05% sodium azide [Carl Roth, K305.4]) for 15 min on ice. Cells were washed once with FACS-buffer by centrifugation at 300 x g for 5 min at 4°C, resuspended in 50 µl FACS-buffer containing the respective fluorochrome-coupled Abs and incubated for 20 min on ice in the dark. The following Abs were used: CD5-Fluoresceine isothiocyanate (FITC), 1:800, eBioscience, 11–0051-82; IgM-Cyanin (Cy) 5, 1:1500, Southern Biotech, 1020–15; IgD-Alexa Fluor (AF) 647, 1:1500, Southern Biotech, 1120–31; CD44-Brilliant Violet (BV) 421, 1:800, BD Horizon, 563970; CD19-APCFire750, 1:400, Biolegend, 115558; CD72-Phycoerythrin (PE), 1:200, Invitrogen, MMCD72104; IgM-PE, 1:1000, Southern Biotech, 1021–05; CD19-BV421, 1:100, Biolegend; 115549; ITGAM/CD11B-PE, 1:500, Biolegend, 101207; TNFRSF13B/TACI-BV421, 1:600, BD Pharmingen, 742840; SDC1/CD138-PE.Cy7, 1:1500, Biolegend, 142504; IgA-FITC, 1:400, Southern Biotech, 1040–02.
Cells were washed twice with FACS-buffer by centrifugation at 300 x g for 5 min at 4°C. Data were acquired using a Gallios flow cytometer (Beckman Coulter, Brea, CA, USA). Analyses were performed using Kaluza version 1.3 and 2.1 (Beckman Coulter, Brea, CA, USA). For cell sorting, peritoneal cells were acquired by peritoneal lavage from 6 C57Bl/6 mice and sorted for CD19/ITGAM double-positive cells with a MoFlo Astrios cell sorter (Beckman Coulter, Brea, USA). Splenic follicular B cells (CD19+, FCER2high/CR2low), marginal zone B cells (CD19+, CR2high/FCER2−), and bone marrow plasma cells were sorted from single-cell suspension from spleen and bone marrow from 4 C57Bl/6 mice. Bone marrow plasma cells were identified with SDC1+ TNFRSF13B+ [Citation58,Citation98] in combination with IgA and IgM staining. Sorted cells were directly sorted into Lysis Buffer (Qiazol; Qiagen, 79306).
Dye dilution assay
Cells were adjusted to 2x10⁷/ml in prewarmed PBS. CFSE (5 µM; Sigma Aldrich, 21888) was added, the mix was vortexed and incubated for 15 min at 37°C. The reaction was stopped by adding PBS containing 10% FCS. Cells were washed with PBS three times and analyzed by flow cytometry immediately and after given time points.
Electron microscopy
Viable cells were collected by ficoll (Lymphoflot; Bio-Rad, 824012) density gradient centrifugation and were fixed overnight in 2.5% glutaraldehyde (Carl Roth, 4995.1) in PBS. Cells were further processed and analyzed, as described previously [Citation99].
Enzyme-linked immunosorbent assay (ELISA)
Microtiter plates (Greiner bio-one, 655182) were coated with 1 µg/ml goat anti-IgM in coating buffer (15 mM Na2CO3 [Merck, 106,392], 35 mM NaHCO3 [Merck, 106329], pH 9.6) overnight at 4°C and then blocked for 1 h at room temperature with 275 µl/well of PBS, 2% FCS. Supernatants were analyzed in triplicates diluted serially 2-fold in PBS, 2% FCS for 1 h at room temperature. Plates were washed 3 times with PBS, 0.05% Tween-20 (Carl Roth, 9127.1) and then incubated with goat anti-mouse IgM-HRP in PBS, 2% FCS. After washing, plates were developed using o-phenoldiamindihydrochloride (OPD; Sigma Aldrich, P1526) substrate buffer (20 mM Na2HPO4 [Carl Roth, T877.2], 7 mM citric acid [Sigma Aldrich, 251275], 0.1% OPD, 0.035% H2O2 [AppliChem, 217145], pH 5.5) and acid stop (0.5 M H2SO4 [Sigma Aldrich, 339741]). Optical density (oD) was measured at 450 nm on a SpectraMax 190 Microplate Reader (Molecular Devices, San Jose, USA). Plates were normalized using ELISA IgM standards as an internal reference.
Immunofluorescence and LC3 turnover assays
The retroviral vector encoding RFP-GFP-LC3 [Citation81] was a kind gift of Dr. Björn Stork (University of Düsseldorf, Germany). CH12 cells were infected and bulk cultures were selected with puromycin (0.4 μg/ml; Sigma Aldrich, P7255). Cells were incubated in standard medium or Earle’s balanced salt solution (EBSS; 1.8 mM CaCl2 [Calbiochem, 208291], 5.3 mM KCl [Carl Roth, P017.1], 0.8 mM MgSO4 [Merck, 105886], 117 mM NaCl [Carl Roth, 3957.1], 26 mM NaHCO3, 1 mM NaH2PO4 [Carl Roth, K300.2], pH 7.0). Cells kept in EBSS were attached to Teflon-coated glass slides in EBSS. Cells kept in medium were attached to glass slides for 15 min in medium including all supplements except FCS. Cells were washed in PBS, fixed in fresh 4% paraformaldehyde solution in PBS, pH 7.4, for 15 min, washed once again in PBS and mounted. Images were taken on a Zeiss LSM700 confocal microscope (x63 oil objective, 1048 × 1048 pixel, 16bit, one confocal plane, 1 μm) with non-infected cells as background control. Autophagosomes were analyzed using ZEN software and images were compiled using ImageJ. To visualize the ER, cells were incubated with ER-Tracker Blue-White (Invitrogen, E12353). Fixed cells were permeabilized with 0.1% Triton X-100 in PBS, blocked with 10% FCS in PBS and stained with a rabbit anti-TFG antibody [Citation45], followed by Alexa Fluor 647-coupled goat anti-rabbit antibody (Dianova, 111–605-008). IgM was detected with goat anti-IgM antibody linked to Phycoerythrin (Southern Biotech, 1021–09). Mounted slides were analyzed with a Zeiss LSM700 confocal microscope (x63 oil objective, 1048 × 1048 pixel, 16bit, 4–8 confocal planes of 1 μm each). Staining of the endoplasmic reticulum in live cells was performed by attaching CH12 cells to poly-L-Lysine (20 μg/ml in PBS; Sigma Aldrich, P8920;) coated glass slides (8-well μ-slides; Ibidi, 80826) in the presence of 2 μM ER-Tracker Green or ER-Tracker Blue-White at 37°C and 5% CO2. Images were taken with a Zeiss Spinning Disc Axio Observer Z1, inverted incubation chamber, CO2 and temperature control, fully motorized stage and an EVOLVE 512 EMCCD camera. Z-stacks were imported into ImageJ and assembled and animated using the 3DScript Plugin [Citation100].
Infection of B cells
20 μg of DNA (pBMN-TFG-IRES-GFP [TFG], pBMN-IRES-GFP [empty], pCru5-BCL2-PGK-eGFP-IRES-Puro [BCL2], pCru5-PGK-eGFP-IRES-Puro [empty], pCru5 + 3.2–17.2.25-IRES-eGFP [functional μ heavy chain; VH segment was described previously [Citation78]], pCru5 + 3.2-VH81.X–IRES-eGFP [dysfunctional µ heavy chain [Citation9];] or pCru5-eGFP-IRES-Puro [Citation97]) were mixed with 125 μl 2 M CaCl2 and 50 µl 10 mM chloroquine (Sigma Aldrich, C6628) in a final volume of 1 ml with dH2O and added to 1 ml of 50 mM HEPES (Carl Roth, HN78.2), 10 mM KCl, 12 mM dextrose (Carl Roth, X997.1), 280 mM NaCl, 1.5 mM Na2HPO4, pH 7.04. The mixture was added to 4 × 10⁶ Phoenix-eco cells. The medium was changed after 6–8 h, and viral supernatants were harvested after 24, 48 and 72 h, 0.45 μm filtered and stored at −70°C. 0.5 × 10⁶ B cells were resuspended in 2 ml of retroviral supernatants supplemented with 4 μg/ml polybrene (Sigma Aldrich, 107689) and centrifuged for 3.5 h at 3660 x g at 33°C [Citation97].
Purification and cultivation of primary murine B cells
B cells were purified from splenic cell suspensions using the EasySep Mouse B cell isolation negative selection kit (Stemcell Technologies, 19854) according to the manufacturer’s instructions. The purity of isolated B cells was verified by surface staining of CD19. Typically, a purity of > 95% was achieved. Purified or sorted B cells were cultured with a starting concentration of 0.5 × 10⁶ cells/ml in R10 medium (RPMI1640 [Gibco Life Technologies, 31870–025], 10% FCS, 2 mM glutamate [Gibco Life Technologies, 25030–024], 1 mM sodium pyruvate [Gibco Life Technologies, 11360–039], 50 U/ml penicillin G, 50 μg/ml streptomycin [Gibco Life Technologies, 15140–122], 50 μM β-mercaptoethanol [Gibco Life Technologies, 31350–010]) for 48 h at 37°C and 5% CO2, supplemented with 10 µg/ml LPS (Sigma, L6529) or 1 µM CpG (InvivoGen, tlrl-1826).
RNA extraction and quantitative real-time PCR
Sorted stimulated and unstimulated cells were isolated in 500 µl TRIzol reagent (VWR PeqGOLD, 30–2010). RNA isolation was performed according to the manufacturer’s instructions and reversely transcribed into cDNA using oligo d(T) primers (RevertAid First Strand cDNA Synthesis Kit; ThermoScientific, K1622). qPCRs were performed using SYBR Green PCR Master Mix (Applied Biosystems, 4309155) using the Applied Biosystems 7500 real-time PCR system. Samples were analyzed in duplicate or triplicates and normalized to the level of Acta1 or Hprt mRNA. Forward (fw) and backward (rev) primer sequences were retrieved from the Harvard PrimerBank at http://pga.mgh.harvard.edu/primerbank/): Acta1/β-ACTIN: fw:5´TGTCCACCTTCCAGCAGATGT3´; rev:5´AGTCAGTAACAGTCCGCCTAGA 3´, Prdm1/BLIMP1: fw: 5´ GACAGAGGCCGAGTTTGAAG 3´; rev 5´ GGCATTCTTGGGAACTGTGT 3´, Nfkbia/IKBA fw, 5‘-TGAAGGACGAGGAGTACGAGC-3‘;rev, 5‘-TTCGTGGATGATTGCCAAGTG-3‘ [Citation101];, Xbp1s: fw:5´ TGCTGAGTCCGCAGCAGGTG 3´; rev:5´ GCTGGCAGGCTCTGGGGAAG 3´, Hspa5/BIP: fw:5´ ACTTGGGGACCACCTATTCCT 3´; rev:5´ ATCGCCAATCAGACGCTCC 3´, Pdia4/ERP72: fw:5´ TCCCATTGCTGTAGCGAAGAT 3´; rev:5´ GGGGTAGCCACTCACATCAAAT 3´, Mcl1: fw:5´ AAAGGCGGCTGCATAAGTC 3´; rev:5´ TGGCGGTATAGGTCGTCCTC 3´, Bax: fw:5´ AGACAGGGGCCTTTTTGCTAC 3´; rev:5´ AATTCGCCGGAGACACTCG 3´, Bcl2l11/BIM: fw:5´CGACAGTCTCAGGAGGAACC3´; rev:5´CCTTCTCCATACCAGACGGA3´, Edem1: fw:5´ AGTCAAATGTGGATATGCTACGC 3´; rev: 5´ ACAGATATGATATGGCCCTCAGT 3´, Ccpg1: fw:5´ AGGAATCCAGTAGCGATGACA 3´; rev:5´ CTAAAGTGGCGTTTACTTGGCT 3´, Hprt: fw:5´TCAGTCAACGGGGGACATAAA3´; rev5´GGGGCTGTACTGCTTAACCAG3´
Sequencing of tfg KO clones
Genomic DNA of CH12 clones was prepared according to the manufacturer’s instructions (Blood and Tissue Kit, Qiagen, 69504). The CRISPR-CAS9 target site was enriched by PCR using the following primers: fw 5´ TCTTCCCCAAGTTGAGCTTT 3´; rev 5´ GGCACTATTTTTAAGGGGCA 3´. The PCR product was purified using the PCR Purification Kit (Qiagen, 28194). The sequencing of PCR products was performed using the rev-PCR primer and Sanger sequencing (Macrogen, Seoul, South Korea).
Statistical analysis
Values were assessed for Gaussian distribution using the Shapiro-Wilk normality test. Mann-Whitney U-test was used for non-Gaussian distributed data sets. Data sets revealing Gaussian-like distribution were assessed by Student’s t-test. Differences between the analyzed groups were considered to be statistically significant with p-values <0.05. Data were analyzed using GraphPad Prism 7. Retroviral infection kinetics were analyzed with two-way ANOVA with Tukey’s or Sidak’s multiple comparisons test.
TaqMan PCR
RNA from sorted cells lysed with QIAzol Lysis Buffer was isolated using miRNA micro Kit (Qiagen, 217084) and subsequent cDNA Synthesis was performed with ThermoScientific RevertAid First Stand cDNA Synthesis Kit and 60 ng per sample. 1 µl (2 ng) cDNA was mixed with 10 µl TaqMan PCR-Mix (TaqMan Universal Mastermix II; ThermoScientific, 4440043), 1 µl gene probe (Acta1: Mm02619580_g1; FAM-MGB, Tfg: Mm00498046_m1; FAM-MGB, ThermoScientific) and 8 µl purified water. Samples were tested in triplicates with the Applied Biosystems 7500 real-time PCR system.
Western blot
Proteins were electrophoresed on 10 or 15% SDS polyacrylamide gels and transferred to a nitrocellulose membrane (60 min, 400 mA; Amersham, 15299794). Transfer efficiency was determined by ponceau S (Carl Roth, 5938.1). Membranes were blocked in 5% skim milk powder (Carl Roth, T145.3) in Tris-buffered saline (TBS; 150 mM NaCl, 20 mM Tris/HCl [Carl Roth, 2449.3], pH 7.4) containing 0.1% Tween-20 (TBST) and probed with the respective antibody at 4°C overnight diluted in 3% BSA (Carl Roth, 8076.3) in PBS, containing 0.1% Tween-20 and 0.1% sodium azide. Membranes were washed in TBST and incubated with anti-mouse/rabbit/rat IgG HRP conjugate diluted in 5% skim milk powder in TBST for 1 h at room temperature. After washing, blots were developed by enhanced chemiluminescence.
Supplemental Material
Download MS Word (6.1 MB)Disclosure statement
No potential conflict of interest was reported by the authors.
Supplementary material
Supplemental data for this article can be accessed here.
Additional information
Funding
References
- Thome M, Charton JE, Pelzer C, et al. Antigen receptor signaling to NF-kappaB via CARMA1, BCL10, and MALT1. Cold Spring Harb Perspect Biol. 2010;2(9):a003004.
- Reth M. Signal transduction in B cells. Curr Opin Immunol. 1991;3(3):340–344.
- Hombach J, Tsubata T, Leclercq L, et al. Molecular components of the B-cell antigen receptor complex of the IgM class. Nature. 1990;343(6260):760–762.
- Niiro H, Clark EA. Branches of the B cell antigen receptor pathway are directed by protein conduits Bam32 and Carma1. Immunity. 2003;19(5):637–640.
- DeFranco AL. Tyrosine phosphorylation and the mechanism of signal transduction by the B-lymphocyte antigen receptor. Eur J Biochem. 1992;210(2):381–388.
- Adachi T, Wakabayashi C, Nakayama T, et al. CD72 negatively regulates signaling through the antigen receptor of B cells. J Immunol. 2000;164(3):1223–1229.
- Bikah G, Carey J, Ciallella JR, et al. CD5-mediated negative regulation of antigen receptor-induced growth signals in B-1 B cells. Science. 1996;274(5294):1906–1909.
- Fearon DT. The CD19-CR2-TAPA-1 complex, CD45 and signaling by the antigen receptor of B lymphocytes. Curr Opin Immunol. 1993;5(3):341–348.
- Mielenz D, Ruschel A, Vettermann C, et al. Immunoglobulin μ Heavy Chains Do Not Mediate Tyrosine Phosphorylation of Igα from the ER-cis- Golgi. J Immunol (Baltimore, Md: 1950). 2003;171:3091–3101.
- MacLennan IC. Germinal centers. Annu Rev Immunol. 1994;12:117–139.
- Kearney JF, Lawton AR. B lymphocyte differentiation induced by lipopolysaccharide. I. Generation of cells synthesizing four major immunoglobulin classes. J Immunol. 1975;115(3):671–676.
- Moller G. One non-specific signal triggers b lymphocytes. Transplant Rev. 1975;23:126–137.
- Baptista BJA, Granato A, Canto FB, et al. TLR9 Signaling Suppresses the Canonical Plasma Cell Differentiation Program in Follicular B Cells. Front Immunol. 2018;9:2281.
- Genestier L, Taillardet M, Mondiere P, et al. TLR agonists selectively promote terminal plasma cell differentiation of B cell subsets specialized in thymus-independent responses. J Immunol. 2007;178(12):7779–7786.
- Savage HP, Yenson VM, Sawhney SS, et al. Blimp-1-dependent and -independent natural antibody production by B-1 and B-1-derived plasma cells. J Exp Med. 2017;214(9):2777–2794.
- Baumgarth N. B-1 Cell Heterogeneity and the Regulation of Natural and Antigen-Induced IgM Production. Front Immunol. 2016;7:324.
- Smith FL, Baumgarth N. B-1 cell responses to infections. Curr Opin Immunol. 2019;57:23–31.
- Savage HP, Kläsener K, Smith FL, et al. TLR induces reorganization of the IgM-BCR complex regulating murine B-1 cell responses to infections. Elife. 2019;8. DOI:https://doi.org/10.7554/eLife.46997.
- Lam WY, Jash A, Yao C-H, et al. Metabolic and Transcriptional Modules Independently Diversify Plasma Cell Lifespan and Function. Cell Rep. 2018;24(9):2479–2492. e6.
- Lam WY, Bhattacharya D. Metabolic Links between Plasma Cell Survival, Secretion, and Stress. Trends Immunol. 2018;39(1):19–27.
- Harris TN, Hummeler K, Harris S. Electron microscopic observations on antibody-producing lymph node cells. J Exp Med. 1966;123(1):161–172.
- Rifkind RA, Osserman EF, Hsu KC, et al. The Intracellular Distribution of Gamma Globulin in a Mouse Plasma Cell Tumor (X5563) as Revealed by Fluorescence and Electron Microscopy. J Exp Med. 1962;116(4):423–432. .
- Anelli T, Sannino S, Sitia R. Proteostasis and “redoxtasis” in the secretory pathway: tales of tails from ERp44 and immunoglobulins. Free Radic Biol Med. 2015;83:323–330.
- Shi W, Liao Y, Willis SN, et al. Transcriptional profiling of mouse B cell terminal differentiation defines a signature for antibody-secreting plasma cells. Nat Immunol. 2015;16(6):663–673.
- Budnik A, Stephens DJ. ER exit sites–localization and control of COPII vesicle formation. FEBS Lett. 2009;583(23):3796–3803.
- Sprangers J, Rabouille C. SEC16 in COPII coat dynamics at ER exit sites. Biochem Soc Trans. 2015;43(1):97–103.
- Bharucha N, Liu Y, Papanikou E, et al. SEC16 influences transitional ER sites by regulating rather than organizing COPII. Mol Biol Cell. 2013;24(21):3406–3419. .
- Tang BL, Wang Y, Ong YS, et al. COPII and exit from the endoplasmic reticulum. Biochim Biophys Acta. 2005;1744(3):293–303.
- D’Arcangelo JG, Stahmer KR, Miller EA. Vesicle-mediated export from the ER: COPII coat function and regulation. Biochim Biophys Acta. 2013;1833(11):2464–2472.
- Todd DJ, Lee AH, Glimcher LH. The endoplasmic reticulum stress response in immunity and autoimmunity. Nat Rev Immunol. 2008;8(9):663–674.
- Travers KJ, Patil CK, Wodicka L, et al. Functional and genomic analyses reveal an essential coordination between the unfolded protein response and ER-associated degradation. Cell. 2000;101(3):249–258.
- Meister S, Schubert U, Neubert K, et al. Extensive immunoglobulin production sensitizes myeloma cells for proteasome inhibition. Cancer Res. 2007;67(4):1783–1792.
- Kouroku Y, Fujita E, Tanida I, et al. ER stress (PERK/eIF2alpha phosphorylation) mediates the polyglutamine-induced LC3 conversion, an essential step for autophagy formation. Cell Death Differ. 2007;14(2):230–239.
- Qin L, Wang Z, Tao L, et al. ER stress negatively regulates AKT/TSC/mTOR pathway to enhance autophagy. Autophagy. 2010;6(2):239–247.
- Sano R, Reed JC. ER stress-induced cell death mechanisms. Biochim Biophys Acta. 2013;1833(12):3460–3470.
- Rashid HO, Yadav RK, Kim H-R, et al. ER stress: autophagy induction, inhibition and selection. Autophagy. 2015;11(11):1956–1977.
- Lee WS, Sung M-S, Lee E-G, et al. A pathogenic role for ER stress-induced autophagy and ER chaperone GRP78/BiP in T lymphocyte systemic lupus erythematosus. J Leukoc Biol. 2015;97(2):425–433.
- Ullman E, Fan Y, Stawowczyk M, et al. Autophagy promotes necrosis in apoptosis-deficient cells in response to ER stress. Cell Death Differ. 2008;15(2):422–425.
- Ravikumar B, Futter M, Jahreiss L, et al. Mammalian macroautophagy at a glance. J Cell Sci. 2009;122(Pt(11)):1707–1711.
- Yang Z, Klionsky DJ. Eaten alive: a history of macroautophagy. Nat Cell Biol. 2010;12(9):814–822.
- Tsukada M, Ohsumi Y. Isolation and characterization of autophagy-defective mutants of Saccharomyces cerevisiae. FEBS Lett. 1993;333(1–2):169–174.
- Conway KL, Kuballa P, Khor B, et al. ATG5 regulates plasma cell differentiation. Autophagy. 2013;9(4):528–537.
- Arnold J, Murera D, Arbogast F, et al. Autophagy is dispensable for B-cell development but essential for humoral autoimmune responses. Cell Death Differ. 2016;23(5):853–864. .
- Pengo N, Scolari M, Oliva L, et al. Plasma cells require autophagy for sustainable immunoglobulin production. Nat Immunol. 2013;14(3):298–305.
- Grohmann M, Steinmetz T, Jäck HM, et al. The Trk fused gene-product (Tfg) is part of a 600-700kDa CARMA1 complex. biorxiv. 2019. https://www.biorxiv.org/content/10.1101/857342v1
- Miranda C, Roccato E, Raho G, et al. The TFG protein, involved in oncogenic rearrangements, interacts with TANK and NEMO, two proteins involved in the NF-kappaB pathway. J Cell Physiol. 2006;208(1):154–160.
- Chen L, McCloskey T, Joshi PM, et al. ced-4 and proto-oncogene tfg-1 antagonistically regulate cell size and apoptosis in C. elegans. Curr Biol. 2008;18(14):1025–1033.
- Beetz C, Johnson A, Schuh AL, et al. Inhibition of TFG function causes hereditary axon degeneration by impairing endoplasmic reticulum structure. Proc Natl Acad Sci U S A. 2013;110(13):5091–5096.
- Mencinger M, Aman P. Characterization of TFG in mus musculus and Caenorhabditis elegans. Biochem Biophys Res Commun. 1999;257(1):67–73.
- Greco A, Fusetti L, Miranda C, et al. Role of the TFG N-terminus and coiled-coil domain in the transforming activity of the thyroid TRK-T3 oncogene. Oncogene. 1998;16(6):809–816.
- Johnson A, Bhattacharya N, Hanna M, et al. TFG clusters COPII -coated transport carriers and promotes early secretory pathway organization. Embo J. 2015;34(6):811–827. .
- Witte K, Schuh AL, Hegermann J, et al. TFG-1 function in protein secretion and oncogenesis. Nat Cell Biol. 2011;13(5):550–558.
- Yagi T, Ito D, Suzuki N. Evidence of TRK-Fused Gene (TFG1) function in the ubiquitin-proteasome system. Neurobiol Dis. 2014;66:83–91.
- Yamamotoya T, Nakatsu Y, Kushiyama A, et al. Trk-fused gene (TFG) regulates pancreatic beta cell mass and insulin secretory activity. Sci Rep. 2017;7(1):13026.
- Choi SR, Hwang Y-L, Kim SJ, et al. Tropomyosin-receptor kinase fused gene (TFG) regulates lipid production in human sebocytes. Sci Rep. 2019;9(1):6587.
- Low MSY, Brodie E, Fedele PL, et al. IRF4 Activity Is Required in Established Plasma Cells to Regulate Gene Transcription and Mitochondrial Homeostasis. Cell Rep. 2019;29(9):2634–2645. e5.
- Brazao TF, Johnson JS, Müller J, et al. Long noncoding RNAs in B-cell development and activation. Blood. 2016;128(7):e10–9.
- Pracht K, Meinzinger J, Daum P, et al. A new staining protocol for detection of murine antibody-secreting plasma cell subsets by flow cytometry. Eur J Immunol. 2017;47(8):1389–1392.
- Wiest DL, Burkhardt JK, Hester S, et al. Membrane biogenesis during B cell differentiation: most endoplasmic reticulum proteins are expressed coordinately. J Cell Biol. 1990;110(5):1501–1511.
- Kataoka T, Ono M, Kawakami M, et al. Untranslated immunoglobulin kappa light chain mRNA in a lambda light chain-producing mouse myeloma, MOPC104E. J Biol Chem. 1980;255(11):5291–5295.
- Jack HM, Beck-Engeser G, Sloan B, et al. A different sort of Mott cell. Proc Natl Acad Sci U S A. 1992;89(24):11688–11691.
- Bishop GA, Haughton G. Induced differentiation of a transformed clone of Ly-1+ B cells by clonal T cells and antigen. Proc Natl Acad Sci U S A. 1986;83(19):7410–7414.
- Bishop GA. Signaling to a CD5+ B-cell clone through surface Ig and MHC class II molecules. Ann N Y Acad Sci. 1992;651:228–240.
- Nicoletti I, Migliorati G, Pagliacci MC, et al. A rapid and simple method for measuring thymocyte apoptosis by propidium iodide staining and flow cytometry. J Immunol Methods. 1991;139(2):271–279.
- Youle RJ, Strasser A. The BCL2 protein family: opposing activities that mediate cell death. Nat Rev Mol Cell Biol. 2008;9(1):47–59.
- Xiang XY, YANG X-C, SU J, et al. Inhibition of autophagic flux by ROS promotes apoptosis during DTT-induced ER/oxidative stress in HeLa cells. Oncol Rep. 2016;35(6):3471–3479.
- Leavitt R, Schlesinger S, Kornfeld S. tunicamycin inhibits glycosylation and multiplication of Sindbis and vesicular stomatitis viruses. J Virol. 1977;21(1):375–385.
- Bernales S, McDonald KL, Walter P. Autophagy counterbalances endoplasmic reticulum expansion during the unfolded protein response. PLoS Biol. 2006;4(12):e423.
- Haas IG, Wabl M. Immunoglobulin heavy chain binding protein. Nature. 1983;306(5941):387–389.
- Kozutsumi Y, Segal M, Normington K, et al. The presence of malfolded proteins in the endoplasmic reticulum signals the induction of glucose-regulated proteins. Nature. 1988;332(6163):462–464.
- Smith MD, Harley ME, Kemp AJ, et al. CCPG1 Is a Non-canonical Autophagy Cargo Receptor Essential for ER-Phagy and Pancreatic ER Proteostasis. Dev Cell. 2018;44(2):217–232. e11.
- Shenkman M, Groisman B, Ron E, et al. A shared endoplasmic reticulum-associated degradation pathway involving the EDEM1 protein for glycosylated and nonglycosylated proteins. J Biol Chem. 2013;288(4):2167–2178.
- Freiden PJ, Gaut JR, Hendershot LM. Interconversion of three differentially modified and assembled forms of BiP. Embo J. 1992;11(1):63–70.
- Breuza L, Halbeisen R, Jenö P, et al. Proteomics of endoplasmic reticulum-Golgi intermediate compartment (ERGIC) membranes from brefeldin A-treated HepG2 cells identifies ERGIC-32, a new cycling protein that interacts with human Erv46. J Biol Chem. 2004;279(45):47242–47253.
- Hauri HP, Kappeler F, Andersson H, et al. ERGIC-53 and traffic in the secretory pathway. J Cell Sci. 2000;113((Pt 4)):587–596.
- Goldfinger M, Miri S, Benhamron S, et al. Protein synthesis in plasma cells is regulated by crosstalk between endoplasmic reticulum stress and mTOR signaling. Eur J Immunol. 2011;41(2):491–502.
- Shaffer AL, Shapiro-Shelef M, Iwakoshi NN, et al. XBP1, downstream of Blimp-1, expands the secretory apparatus and other organelles, and increases protein synthesis in plasma cell differentiation. Immunity. 2004;21(1):81–93. .
- Grosschedl R, Weaver D, Baltimore D, et al. Introduction of a mu immunoglobulin gene into the mouse germ line: specific expression in lymphoid cells and synthesis of functional antibody. Cell. 1984;38(3):647–658.
- Smith M, Wilkinson S. ER homeostasis and autophagy. Essays Biochem. 2017;61(6):625–635.
- Klionsky DJ, Abdelmohsen K, Abe A, et al. Guidelines for the use and interpretation of assays for monitoring autophagy (3rd edition). Autophagy. 2016;12(1):1–222.
- Alers S, Löffler AS, Paasch F, et al. Atg13 and FIP200 act independently of Ulk1 and Ulk2 in autophagy induction. Autophagy. 2011;7(12):1423–1433.
- Kimura S, Noda T, Yoshimori T. Dissection of the autophagosome maturation process by a novel reporter protein, tandem fluorescent-tagged LC3. Autophagy. 2007;3(5):452–460.
- Alexander T, Sarfert, R, Klotsche, J, et al. The proteasome inhibitior bortezomib depletes plasma cells and ameliorates clinical manifestations of refractory systemic lupus erythematosus. Ann Rheum Dis. 2015;74(7):1474–1478.
- Bishop GA, Pennell CA, Travis W, et al. Antibodies specific for Ig idiotype, but not isotype, can substitute for antigen to induce IgM secretion by a B cell clone. Int Immunol. 1990;2(4):285–290.
- Clarke AJ, Riffelmacher T, Braas D, et al. B1a B cells require autophagy for metabolic homeostasis and self-renewal. J Exp Med. 2018;215(2):399–413.
- Pasparakis M, Schmidt-Supprian M, Rajewsky K. IkappaB kinase signaling is essential for maintenance of mature B cells. J Exp Med. 2002;196(6):743–752.
- Kraus M, Alimzhanov MB, Rajewsky N, et al. Survival of resting mature B lymphocytes depends on BCR signaling via the Igalpha/beta heterodimer. Cell. 2004;117(6):787–800.
- Szegezdi E, Fitzgerald U, Samali A. CASpase-12 and ER-stress-mediated apoptosis: the story so far. Ann N Y Acad Sci. 2003;1010:186–194.
- Pattingre S, Tassa A, Qu X, et al. BCL2 antiapoptotic proteins inhibit Beclin 1-dependent autophagy. Cell. 2005;122(6):927–939.
- Urbanczyk S, Stein M, Schuh W, et al. Regulation of Energy Metabolism during Early B Lymphocyte Development. Int J Mol Sci. 2018;19(8):2192.
- Miller BC, Zhao Z, Stephenson LM, et al. The autophagy gene ATG5 plays an essential role in B lymphocyte development. Autophagy. 2008;4(3):309–314.
- Lahiri V, Hawkins WD, Klionsky DJ. Watch What You (Self-) Eat: autophagic Mechanisms that Modulate Metabolism. Cell Metab. 2019;29(4):803–826.
- Piano Mortari E, Folgiero V, Marcellini V, et al. The Vici syndrome protein EPG5 regulates intracellular nucleic acid trafficking linking autophagy to innate and adaptive immunity. Autophagy. 2018;14(1):22–37.
- Yagi T, Ito D, Suzuki N. TFG-Related Neurologic Disorders: new Insights Into Relationships Between Endoplasmic Reticulum and Neurodegeneration. J Neuropathol Exp Neurol. 2016;75(4):299–305.
- Martini-Stoica H, Xu Y, Ballabio A, et al. The Autophagy-Lysosomal Pathway in Neurodegeneration: A TFEB Perspective. Trends Neurosci. 2016;39(4):221–234.
- Ran FA, Hsu PD, Wright J, et al. Genome engineering using the CRISPR-CAS9 system. Nat Protoc. 2013;8(11):2281–2308.
- Avramidou A, Kroczek C, Lang C, et al. The novel adaptor protein Swiprosin-1 enhances BCR signals and contributes to BCR-induced apoptosis. Cell Death Differ. 2007;14(11):1936–1947.
- Cossarizza A, Chang HD, Radbruch A, et al. Guidelines for the use of flow cytometry and cell sorting in immunological studies (second edition). Eur J Immunol. 2019;49(10):1457–1973.
- Grötsch B, Brachs S, Lang C, et al. The AP-1 transcription factor Fra1 inhibits follicular B cell differentiation into plasma cells. J Exp Med. 2014;211(11):2199–2212.
- Schmid B, Tripal P, Fraaß T, et al. 3Dscript: animating 3D/4D microscopy data using a natural-language-based syntax. Nat Methods. 2019;16(4):278–280.
- Lang VR, Mielenz D, Neubert K, et al. The early marginal zone B cell-initiated T-independent type 2 response resists the proteasome inhibitor bortezomib. J Immunol. 2010;185(9):5637–5647.