
ABSTRACT
Mesenchymal stem cell transplantation (MSCT) has been applied to treat a variety of autoimmune and inflammatory diseases. Psychosocial stress can aggravate disease progression in chronic inflammatory patients. Whether psychological stress affects MSCT is largely unknown. In this study we show that psychological stress attenuates therapeutic effects of MSCT in a DSS-induced colitis mouse model by elevating the levels of exosomal Mir7k/mmu-let-7 k (microRNA 7 k) in circulation. Mechanistically, Mir7k inhibits STAT3 pathway in donor MSCs, leading to upregulated expression of BECN1 (beclin 1, autophagy related) and, thus, activation of macroautophagy/autophagy. Inhibition of autophagy by blocking Mir7k or activating STAT3 signaling can restore MSCT-mediated therapy in psychologically stressed colitis mice. Our study identifies a previously unknown role of autophagy in regulating MSCT therapy via exosomal miRNA Mir7k.
Abbreviations: BafA1: bafilomycin A1; BECN1: beclin 1, autophagy related; DAI: disease activity index; DAPI: 4ʹ,6-diamidino-2-phenylindole; DSS: dextran sulfate sodium; GFP: green fluorescent protein; HAI: histological activity index; IFNG/IFN-γ: interferon gamma; IL10: interleukin 10; IL1RN/IL-1Rra: interleukin 1 receptor antagonist; KD: knockdown; miRNA: microRNA; MSCs: mesenchymal stem cells; MSCT: mesenchymal stem cell transplantation; NTA: nanoparticle tracking analysis; PGE2: prostaglandin E2; SD: standard deviation; siRNA: small-interfering RNA; STAT3: signal transducer and activator of transcription 3; TEM: transmission electron microscopy; TGFB1/TGF-β1: transforming growth factor, beta 1; Th17 cell: T helper cell 17; TNF/TNF-α: tumor necrosis factor; TNFAIP6/TSG6: tumor necrosis factor alpha induced protein 6; Tregs: regulatory T cells
Introduction
Mesenchymal stem cells (MSCs) are a heterogeneous population of pluripotent progenitor cells with the capacity for self-renewal and multipotent differentiation [Citation1–3]. MSCs modulate the immune system by regulating several major types of immune cells, such as T and B lymphocytes, macrophages, dendritic cells and natural killer cells [Citation4–6]. In previous preclinical and clinical reports, MSC transplantation (MSCT) showed significant therapeutic effect for a variety of diseases, such as systemic sclerosis, systemic lupus erythematosus, experimental autoimmune encephalomyelitis, graft versus host disease, sepsis, acute ulcerative colitis, asthma and contact dermatitis [Citation7–13]. However, the detailed mechanisms of MSCT are not fully elucidated. It is known that the recipient microenvironment may have a significant impact on the therapeutic effect of MSCT [Citation14,Citation15]. For example, lack of inflammatory cytokines IFNG/IFN-γ (interferon gamma) and TNF/TNF-α (tumor necrosis factor) can lead to a significant reduction of the immunomodulatory capacity of MSCT [Citation11].
Exosomes, ranging from 30–150 nm in diameter, are lipid extracellular vesicles containing RNA, DNA and proteins. Exosomes are produced by most cell types and secreted into the circulation to reach target cells. By transmitting extrinsic miRNAs and other molecular signals, exosomes play an important role in intercellular communication [Citation16,Citation17]. In response to a variety of pathological challenges, such as injury, infection, stress and disease, the characterization and function of circulating exosomes are dramatically altered [Citation18]. Therefore, circulating exosomes and exosomal miRNAs have been identified as potential diagnostic and prognostic biomarkers for many diseases [Citation19–22]. Also, properties of circulating exosomes have been demonstrated to predict the success of immune therapy for cancers [Citation23]. However, it is largely unknown whether circulating exosomes affect MSCT therapy.
Psychological stress is a quite common burden for people in current societies. Exposure to long-term psychosocial stress is associated with negative health outcomes and increased risk of inflammatory and autoimmune diseases [Citation24–26]. Psychological stress is especially prevalent in chronic inflammatory disorder patients [Citation27]. Under psychosocial stress, the profile of circulating exosomes is substantially modified [Citation18,Citation28]. Previous study indicates that long-term psychological stress-induced elevation of corticosterone levels hinder the therapeutic potential of transplanted MSCs in carbon tetrachloride-induced liver injury condition [Citation29,Citation30]. However, it is unknown whether altered circulating exosomes in psychological stress condition negatively affects the therapeutic efficacy of MSCT in inflammatory diseases.
Autophagy is an evolutionarily conserved process that recycles nonessential cellular components through degradation by lysosomes to ensure cell survival during stress conditions [Citation31,Citation32]. Increasing evidences show that altered autophagy plays a crucial role in psychological stress-related neuropsychiatric disorders, cardiovascular disease and suppression of immune system [Citation33–35]. Furthermore, autophagy has been proven to have significant impact on therapeutic effects on MSCT [Citation36]. However, there is little insight into whether psychological stress affects the therapeutic efficacy of MSCT through the regulation of autophagy. In this study, we show that circulating exosomes can be transferred into systemically infused donor MSCs to regulate their therapeutic effects by regulating autophagy.
Results
Restraint stress impairs therapeutic effects of MSCT in DSS-induced colitis mice
We used MSCT to treat dextran sulfate sodium (DSS)-induced colitis mice (). These colitis mice showed significantly reduced body weight and elevated colitis disease activity index (DAI), a combined score of diarrhea, intestinal bleeding and weight loss, when compared with the control group (). MSCT rescued DSS-induced body weight reduction and DAI score in colitis mice (). Also, DSS induction resulted in significantly decreased colon length, along with severe colonic epithelial and crypt destruction with rampant inflammatory cell infiltration, which was rescued by MSCT (). Analysis of histological activity index (HAI) further confirmed that MSCT reduced DAI (). As expected, the ratio between CD4+ IL17A+ Th17 cells and CD4+ CD25+ FOXP3+ Treg cells prominently increased in colitis mice and MSCT rescued this ratio ( Fig. S1A,B).
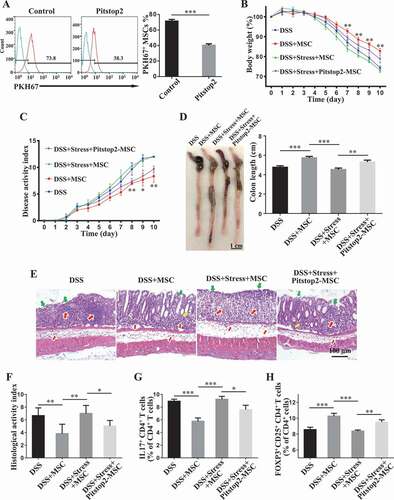
Figure 1. Restraint stress impairs therapeutic effects of MSCT in DSS-induced colitis mice. (A) Schematic diagram showing MSC therapy and restraint stress in dextran sulfate sodium (DSS)-induced experimental colitis mice. (B) Body weight loss and (C) disease activity index (DAI) were monitored daily during the entire experiment (n = 5 per group) (* P < 0.05, ** P < 0.01, *** P < 0.005, DSS+MSC versus DSS; ## P < 0.01, ### P < 0.005, DSS+MSC versus DSS+Stress+MSC; NS, Not statistically significant). At 10 days after DSS induction, mice were euthanized; (D) colon length was recorded, and (E) colonic epithelial/crypt destruction and inflammatory cell infiltration were visualized using HE staining (yellow arrows: goblet cells; green arrows: destruction of epithelial layer; red arrows: inflammatory cell infiltration). (F) Colonic damage was analyzed using histological activity index (HAI). (G, H) Splenocytes were harvested and the ratios of CD4+ IL17A+ Th17 cells and CD4+ CD25+ FOXP3+ Tregs among CD4+ T cells in the spleen were determined using flow cytometry. All results were verified in three independent experiments. A one-way ANOVA with Bonferroni’s comparison test was used for statistical analysis. Error bars represent the mean ± s.d. ***P < 0.005; **P < 0.01; *P < 0.05
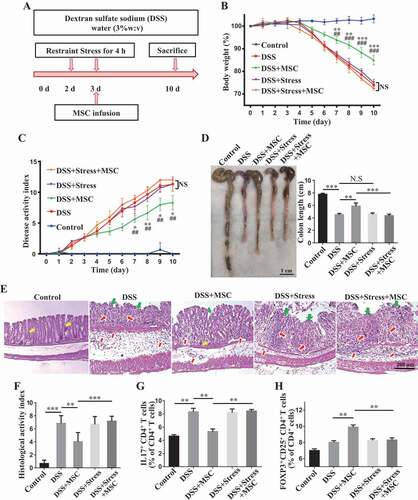
To investigate the potential impact of restraint stress on the therapeutic effect of MSCT in DSS-induced colitis mice, a group of mice were subjected to 2 consecutive days of daily restraint stress starting at 2 days after DSS induction. MSCT was performed at 3 days after DSS induction (). Notably, when mice were exposed to restraint stress, MSCT failed to ameliorate DSS-induced colitis in terms of rescuing body weight loss (), DAI (), colonic length (), epithelial damage and inflammatory cell infiltration (). MSCT also failed to regulate the ratio between Th17 cells and Tregs (, Fig. S1A,B). Although psychosocial stress could impair the colonic barrier function and has been demonstrated to be a risk factor for the development and relapse of inflammatory bowel diseases [Citation27,Citation37,Citation38], we failed to find altered clinical parameters in DSS-induced colitis mice after 2 days of restraint, including body weight and DAI, as well as length and histology of the colon (). The relatively mild frequency of stress, as well as the increased levels of corticosterone, may explain why the restraint stress in our study did not increase the severity of colitis. These results indicate that restraint stress significantly impaired MSCT-mediated therapy in DSS-induced colitis mice.
Altered circulating exosomes by restraint stress inhibit MSCT-mediated therapy in DSS-induced colitis
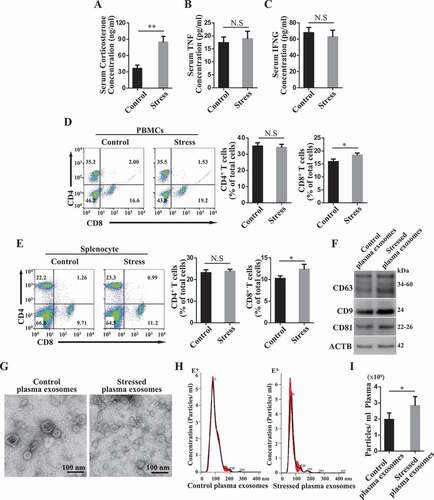
We next investigated whether restraint stress alters recipient circulation microenvironments in DSS-induced colitis mice. Under restraint stress, the serum immunosuppressive corticosterone levels were elevated in colitis mice (). But we failed to observe any significant alteration in the levels of serum TNF/TNF-α and IFNG/IFN-γ () after restraint stress. Although restraint stress slightly increased the ratio of CD8+ T cells, it failed to change the percentage of CD4+ T cells among peripheral blood mononuclear cells (PBMCs) and splenocytes (). Previous study showed that psychological stress may affect the level of circulating exosomes [Citation28]. We purified plasma exosomes form control and restraint stressed mice. We used western blot analysis to confirm that purified plasma exosomes express exosome markers CD63, CD9 and CD81. Furthermore, the expression levels of CD9 and CD81 in restraint restressed exosomes were higher than that in control exosomes (). Using transmission electron microscopy (TEM), we observed a typical cup-shaped exosome-like subjects (). Nanoparticle tracking analysis showed that the peak diameters of plasma exosomes derived from control and restraint stressed mice were 83 nm and 68 nm, respectively (). Besides, we found that restraint stress increased the levels of exosomes in DSS-induced colitis mice (). These findings suggest that the restraint stress altered the characteristics of circulating exosomes in colitis mice.
Figure 2. Restraint stress alters circulating exosomes. (A-C) At 3 days after DSS treatment, the levels of corticosterone (A), TNF/TNF-α(B) and IFNG/IFN-γ (C) in serum were determined using ELISA kits at 4 h post-restraint stress. (D, E) The percentages of CD4+ and CD8+ T cells among peripheral blood mononuclear cells (PBMCs) and splenocytes were analyzed using flow cytometry (n = 4 per group). (F) The expression levels of exosome-specific markers CD63, CD9 and CD81 in purified plasma exosomes derived from control and restraint stressed mice were determined by western blotting. (G) The ultrastructure of control and stressed plasma exosomes was observed using transmission electron microscopy (TEM). (H) The size distribution of purified plasma exosomes was investigated using nanoparticle tracking analysis (NAT). (I) NAT showing the concentration of plasma exosomes isolated from control and restraint stressed mice. All results were verified in three independent experiments. A two-tailed Student’s t test was used for statistical analysis. Error bars represent the mean ± s.d. **P < 0.01; *P < 0.05
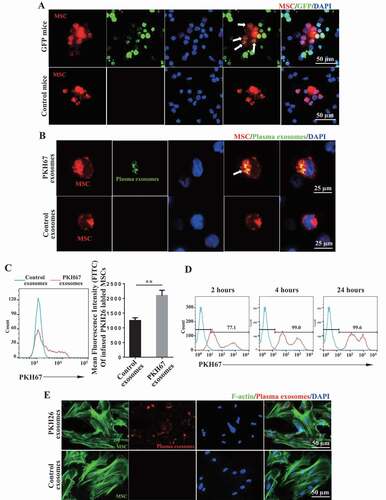
Large numbers of extracellular vesicles (EVs), including exosomes, which can ferry miRNA and proteins, are present in the blood [Citation39,Citation40]. Intravenously infused MSCs come into circulation with potential to interact with circulating exosomes. To examine whether circulating exosomes are endocytosed by infused MSCs, we intravenously injected PKH26-labeled MSCs into green fluorescent protein (GFP) mice, peripheral blood samples were collected and at 2 h post-infusion for immunofluorescent analysis. The results showed that GFP positive signal was found in PKH26+ MSCs, indicating that circulating exosomes may be endocytosed by infused MSCs (). To further verify this phenomenon, we infused PKH67-labeled exosomes into mice, followed by PKH26-labeled MSC infusion, and collected peripheral blood samples at 2 h post-infusion for further analysis. We observed that PKH67-labeled exosomes were transferred into PKH26-labeled MSCs (). Moreover, as accessed by the cytometric analysis, the green fluorescence intensity obviously increased in PKH26+ MSCs (), indicating that the systemically infused MSCs uptake circulating exosomes in vivo. Moreover, we used an in vitro culture system to confirm that MSCs uptake plasma exosomes ().
Figure 3. Circulating exosomes are endocytosed by infused MSCs. (A) PKH26-labeled MSCs were infused into GFP mice intravenously. At 2 h post-infusion, peripheral blood samples were collected and MSCs were observed using fluorescence microscopy. Arrows indicate PKH26+ MSCs containing GFP particles. (B, C) Mice were intravenously injected with PKH67-labeled plasma exosomes, followed by PKH26-labeled MSCs. At 2 h post-infusion, the peripheral blood samples were collected. MSCs were observed using laser-scanning confocal microscope (The white arrow indicates one PKH26+ MSC containing PKH67+ exosomes.) (B) and the FITC fluorescence intensity of PKH26+ MSCs was analyzed using flow cytometry (C). (D) MSCs were treated with PKH67-labeled plasma exosomes for 2, 4, or 24 h in vitro. The uptake of exosomes by MSCs was analyzed by flow cytometry. (E) MSCs were treated with PKH26-labeled plasma exosomes for 24 h in vitro. The endocytosis of exosomes was observed by ActinGreen™ 488 ReadyProbes™ Reagent staining of F-actin in the cytoplasm of MSCs. All results were verified in three independent experiments. A two-tailed Student’s t test was used for statistical analysis. Error bars represent the mean ± s.d. **P < 0.01
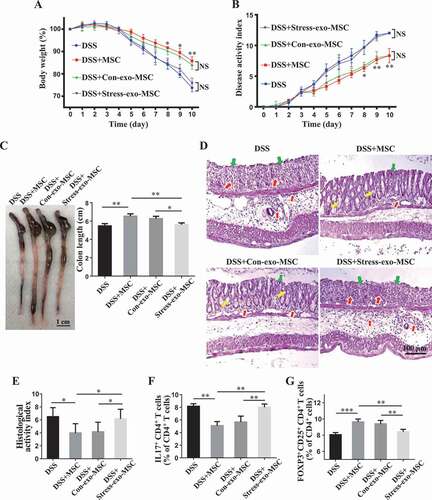
We next asked whether the altered circulating exosomes in stressed mice impaired the therapeutic effects of MSCT in DSS-induced colitis mice. When MSCs were pretreated with restraint stressed mouse-derived circulating exosomes, but not wildtype mouse-derived exosomes, MSCT failed to show therapeutic effects on colitis mice. They were not able to restore the body weight (), reduce the DAI scores (), improve colon length (), recover epithelial and crypt structure, eliminate colonic inflammatory cells () or decrease the ratio of Th17 cells/Tregs (), Fig. S1C,D). Moreover, when isolated CD4+ T-lymphocytes from splenocytes (Fig. S2A) were cocultured with MSCs, we found that MSCs treated with restraint stressed mouse-derived exosomes showed a significantly decreased capacity to downregulate Th17 cells and upregulate Tregs when compared with the MSCs treated with control exosomes in vitro (Fig. S2B,C).
Figure 4. Circulating exosomes altered by restraint stress inhibit therapeutic effects of MSCs in DSS-induced colitis. (A-D) At 3 days after DSS treatment, MSCs under normal culture conditions or pretreated with plasma exosomes derived from control/restraint stressed mice (Con-exo/Stress-exo) were infused into mice to treat colitis (n = 4 per group). Body weight loss and disease activity index (DAI) were monitored daily during the entire experiment (A, B) (* P < 0.05, ** P < 0.01, DSS+Con-exo-MSC versus DSS+Stress-exo-MSC; NS, Not statistically significant). At 10 days after DSS induction, mice were euthanized; colon length was recorded (C) and colonic epithelial/crypt destruction and inflammatory cell infiltration were visualized using HE staining (yellow arrows: goblet cells; green arrows: destruction of epithelial layer; red arrows: inflammatory cell infiltration) (D). (E) Colonic damage was analyzed using histological activity index (HAI). (F, G) Splenocytes were harvested and the ratios of CD4+ IL17A+ Th17 cells and CD4+ CD25+ FOXP3+ Tregs among CD4+ T cells in the spleen were determined using flow cytometry. All results were verified in three independent experiments. A one-way ANOVA with Bonferroni’s comparison test was used for statistical analysis. Error bars represent the mean ± s.d. ***P < 0.005; **P < 0.01; *P < 0.05
Since exosome endocytosis usually uses a clathrin-dependent pathway [Citation41], we assessed whether MSCs uptake circulating exosomes through clathrin and whether inhibition of exosome uptake recues MSCT therapeutic effect in colitis mice subjected to restraint stress. Using flow cytometry, we found that Pitstop2, a selective and cell membrane-permeable clathrin inhibitor, partially inhibited the uptake of circulating exosomes (). MSCs pretreated with Pitstop 2 partially rescued their therapeutic effects in colitis mice subjected to restraint stress. Under the stress condition, Pitstop2-pretreated MSCs still induced immune tolerance (, Fig. S1E,F), improved clinical symptoms of colitis and colonic length (), recovered epithelial damage, and reduced inflammatory cell infiltration (). These data indicate that circulating exosomes from restraint stressed mice are able to abolish the therapeutic effects of MSCT in DSS-induced colitis.
Figure 5. Clathrin-dependent endocytosis of circulating exosomes affects MSC therapy in colitis mice subjected to restraint stress. (A) MSCs were pretreated with Pitstop2, a novel clathrin inhibitor, for 15 min. Then MSCs were exposed to PKH67-labeled plasma exosomes for 2 h. The effects of Pitstop2 on the uptake of plasma exosomes by MSCs were determined using cytometric analysis. Pitstop2-treated MSCs were infused into colitis mice subjected to restraint stress 3 days after DSS treatment. (B) Body weight loss and (C) disease activity index (DAI) were monitored daily during the entire experiment (n = 3 for DSS and DSS+MSC group; n = 4 for DSS+Stress+MSC and DSS+Stress+Pitstop2-MSC group) (*P< 0.05, **P< 0.01, DSS+Stress+Pitstop2-MSC versus DSS+Stress+MSC). At 10 days after DSS induction, mice were euthanized; (D) colon length was recorded, and (E) colonic epithelial/crypt destruction and inflammatory cell infiltration were visualized using HE staining (yellow arrows: goblet cells; green arrows: destruction of epithelial layer; red arrows: inflammatory cell infiltration). (F) Colonic damage was analyzed using histological activity index (HAI). (G, H) Splenocytes were harvested and the ratios of CD4+ IL17A+ Th17 cells and CD4+ CD25+ FOXP3+ Tregs among CD4+ T cells in the spleen were determined using flow cytometry. All results were verified in three independent experiments. A two-tailed Student’s t test (A) and one-way ANOVA with Bonferroni’s comparison test (B, C, D, F, G and H) were used for statistical analysis. Error bars represent the mean ± s.d. ***P < 0.005; **P < 0.01; *P < 0.05
Circulating exosomes from restraint stressed mice induce MSC autophagy via STAT3 pathway
Next, we determine how circulating exosomes, derived from restraint stressed mice, hindered the therapeutic effect of MSCT in DSS-induced colitis mice. Since autophagy has been proven to play a critical role in MSC therapies [Citation12,Citation36,Citation42], we examine whether circulating exosomes from restraint stressed mice regulate MSC autophagy. Compared with control circulating exosomes, restraint stress mouse-derived circulating exosomes promoted autophagy in cultured MSCs, as shown by elevated expression of LC3-II and BECN1 at 6- and 12-h post-treatment (). To determine whether the plasma exosomes derived from stressed mice induced autophagy flux in MSCs, lysosomal inhibitor bafilomycin A1 (BafA1, Cell Signaling Technology, 54645) was used in the presence of control or stress mouse-derived exosomes. Western blot analysis showed that blocking of autophagy flux with BafA1 led to a more LC3-II accumulation in stressed mouse-derived exosome-treated MSCs than control exosome-treated MSCs (). Next, we transduced a lentiviral plasmid encoding mCherry-GFP-LC3B into MSCs. MSCs treated with stressed mouse-derived exosomes showed accumulated LC3 dots and an increase in the ratio of red dots and the number of overall LC3 when compared with control exosome-treated MSCs, confirming an elevated autophagy flux. Consistent with the western blot result, BafA1 blocked GFP degradation in both exosome-treated MSCs and stressed mouse-derived exosome-treated MSCs with showing more LC3 dots (). These results suggest that restraint stressed mouse-derived exosomes increased MSC autophagy flux. STAT3 signaling pathway is involved in multiple aspects of autophagic process and modulates autophagy via both transcription-dependent and transcription-independent pathways [Citation43]. By downregulating essential autophagy genes such as BECN1, STAT3 executes anti-autophagic functions. Western blot analysis showed that both phosphorylated STAT3 and total STAT3 were downregulated in MSCs treated with restraint stress mouse-derived exosomes at 6 and 12 h, respectively (). These results suggest that downregulation of STAT3 may activate autophagy flux in MSCs.
Figure 6. Restraint stressed-circulating exosomes induced MSC autophagy. (A) MSCs were treated with plasma exosomes derived from restraint stressed or control mice for 6 or 12 h. The expression of autophagy-related proteins including LC3-I/II, BECN1, p-STAT3, and STAT3 were assessed by western blotting. (B) MSCs were treated with plasma exosomes derived from restraint stressed or control mice for 12 h in the absence or presence of bafilomycin A1 (BafA1). BafA1 (50 nM) was added 2 h before cell harvest. The expression of LC3-I/II was assessed by western blotting. The histogram shows quantification of LC3-II after normalization to β-actin. (C) MSCs were transfected with a lentiviral plasmid encoding mCherry-GFP-LC3B and the autophagy flux was analyzed after the control and stressed exosomes treatment for 12 h (scale bars: 10 μm). The graph on the right shows the quantification of LC3 dots (**P < 0.01 for the total LC3 dots; ##P < 0.01 for red dots). (D) Western blotting showing the levels of BECN1 and LC3-I/II in control and Becn1 siRNA-treated MSCs. Becn1 siRNA-treated MSCs were infused into colitis mice subjected to restraint stress 3 days after DSS induction. (E) Body weight loss and (F) disease activity index (DAI) were monitored daily during the entire experiment (n = 3 for DSS and DSS+MSC group; n = 4 for DSS+Stress+MSC and DSS+Stress+siBecn1-MSC group) (* P < 0.05, ** P < 0.01, DSS+Stress+siBecn1-MSC versus DSS+Stress+MSC). At 10 days after DSS induction, mice were euthanized; (G) colon length was recorded, and (H) colonic epithelial/crypt destruction and inflammatory cell infiltration were visualized using HE staining (yellow arrows: goblet cells; green arrows: destruction of epithelial layer; red arrows: inflammatory cell infiltration). (I) Colonic damage was analyzed using histological activity index (HAI). (J, K) Splenocytes were harvested and the ratios of CD4+ IL17A+ Th17 cells and CD4+ CD25+ FOXP3+ Tregs among CD4+ T cells in the spleen were determined using flow cytometry. All results were verified in three independent experiments. A one-way ANOVA with Bonferroni’s comparison test was used for statistical analysis. Error bars represent the mean ± s.d. **P < 0.01; *P < 0.05
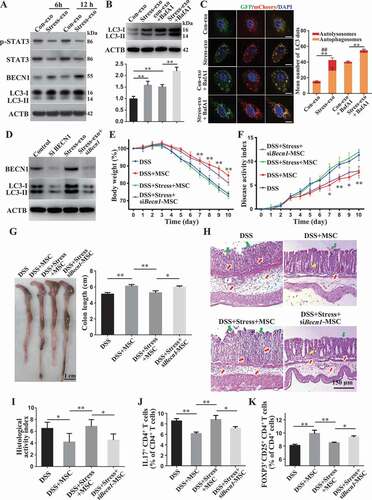
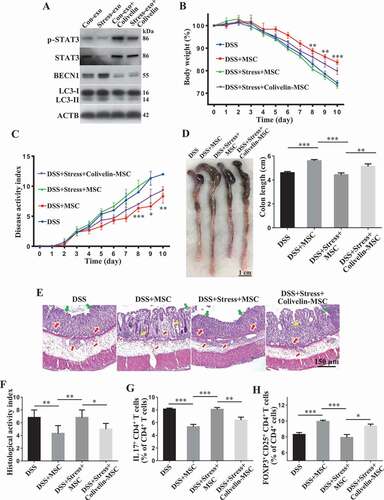
To further confirm whether the induction of autophagy by circulating exosomes from restraint stressed mice underlies the observed inhibition of therapeutic potential of MSCT, we used Becn1 siRNA (siBecn1) to inhibit autophagy and subsequently assessed the therapeutic effect of siBecn1-MSCs in colitis mice subjected to restraint stress. Western blot analysis showed that Becn1 siRNA treatment rescued LC3-II expression in donor MSCs that were treated with restraint stressed mouse-derived exosomes (). Compared with the control group, knockdown of BECN1 partially recued the therapeutic effects of MSCT in colitis mice subjected to restraint stress, as assessed by restored body weight loss (), reduced DAI (), improved colonic length (), recovered epithelial and crypt destruction (), declined HAI (), and restored the balance between Th17 cells and Tregs (, Fig. S3A,B). Moreover, knockdown of BECN1 rescued MSCT-mediated downregulation of Th17 cells and upregulation of Tregs in the restraint stressed mouse-derived exosomes treatment condition (Fig. S2B,C). Western blot analysis showed that colivelin, a STAT3 activator, could antagonize autophagy in MSCs treated with restraint stressed mouse-derived circulating exosomes (). When pretreated with colivelin, MSCT partially regained their therapeutic effect in colitis mice subjected to restraint stress, as indicated by restoring body weight loss (), reduced DAI (), improved colonic length (), recovered epithelial destruction, reduced inflammatory cell infiltration and declined HAI (), and induced immune tolerance (, Fig. S3C,D). Furthermore, activating STAT3 by colivelin treatment rescued MSCT-mediated downregulation of Th17 cells and upregulation of Tregs in the restraint stressed mouse-derived exosomes treatment condition (Fig. S4A,B). Taken together, these results indicate that circulating exosomes from restraint stressed mice induce MSC autophagy via repression of STAT3 signaling, impairing their therapeutic effect in colitis mice.
Figure 7. Restraint stressed circulating exosomes repressed STAT3 expression to induce autophagy to impair MSC therapy. (A) MSCs were treated with colivelin, a potent synthetic peptide activator of STAT3, for 12 h. The expression levels of p-STAT3, STAT3, BECN1, and LC3-I/II were assessed by western blotting. Colivelin-treated MSCs were infused into colitis mice subjected to restraint stress 3 days after DSS treatment. (B) Body weight loss and (C) disease activity index (DAI) were monitored daily during the entire experiment (n = 3 for DSS and DSS+MSC group; n = 4 for DSS+Stress+MSC and DSS+Stress+Colivelin-MSC group) (* P < 0.05, ** P < 0.01, *** P < 0.005, DSS+Stress+Colivelin-MSC versus DSS+Stress+MSC). At 10 days after DSS induction, mice were euthanized; (D) colon length was recorded, and (E) colonic epithelial/crypt destruction and inflammatory cell infiltration were visualized using HE staining (yellow arrows: goblet cells; green arrows: destruction of epithelial layer; red arrows: inflammatory cell infiltration). (F) Colonic damage was analyzed using histological activity index (HAI). (G, H) Splenocytes were harvested and the ratios of CD4+ IL17A+ Th17 cells and CD4+ CD25+ FOXP3+ Tregs among CD4+ T cells in the spleen were determined using flow cytometry. All results were verified in three independent experiments. A one-way ANOVA with Bonferroni’s comparison test was used for statistical analysis. Error bars represent the mean ± s.d. ***P < 0.005; **P < 0.01; *P < 0.05
Exosomal Mir7k inhibits STAT3 to activate autophagy
Our above finding prompted us to further explore how circulating exosomes from restraint stressed mice downregulate STAT3 expression in donor MSCs. Circulating exosomes contain various non-coding RNAs, such as microRNAs (miRNAs), known to be capable of silencing target gene expression at a post-transcriptional level by binding to the 3ʹ end of mRNA, and miRNA cargo appears to be affected by psychological stress [Citation44]. Therefore, we asked whether altered miRNAs in restraint stressed mouse-derived circulating exosomes repress STAT3 expression. We used TargetScan software to computationally identify 11 miRNAs that may target Stat3 gene expression. RT-qPCR analysis showed that Mir7k was significantly increased in stressed mouse-derived circulating exosomes when compared to control circulating exosomes (). Compared with MSCs that were treated with control circulating exosomes, MSCs treated with restraint stressed mouse-derived circulating exosomes showed increased Mir7k expression (). To confirm the functional role of Mir7k, we found that reduction of Mir7k level by Mir7k inhibitor treatment elevated STAT3 expression and decreased autophagy (). In addition, Mir7k inhibitor treatment partially rescued therapeutic efficacy of MSCT in colitis mice subjected to restraint stress, as indicated by restored body weight (), reduced DAI (), improved colonic length (), recovered epithelial and crypt destruction and reduced HAI (), downregulation of Th17 cells and upregulation of Tregs (, Fig. S3E,F). Moreover, Mir7k inhibitor treatment rescued MSC-mediated downregulation of Th17 cells and upregulation of Tregs in restraint stressed exosomes treatment condition (Fig. S4A,B). Conversely, Mir7k mimic repressed STAT3 expression and activated autophagy in MSCs, leading to impaired regulation of Tregs and Th17 cells, along with reduced therapeutic effects in DSS-induced colitis mice (, Fig. S3E,F). When treated with Mir7k mimic, MSCs showed decreased ability to downregulate Th17 cells and upregulate Tregs in vitro (Fig. S4A,B). These experimental data indicate that Mir7k in circulating exosomes from restraint stressed mice attenuated MSCT-mediated therapy in colitis mice via repressing STAT3 pathway and activating autophagy ().
Figure 8. Elevation of exosomal Mir7k in restraint stressed colitis mice activates autophagy via inhibition of STAT3. (A) qPCR analysis showing the levels of miRNAs that were computationally identified to target Stat3 gene expression in plasma exosomes derived from control and restraint stressed mice. (B) qPCR analysis showing the levels of Mir7k in MSCs exposed to control and restraint stressed plasma exosomes. (C) qPCR analysis showing the expression levels of Mir7k in Mir7k mimic- and Mir7k inhibitor-treated MSCs. (D) Western blotting showing the levels of p-STAT3, STAT3, BECN1 and LC3-I/II in Mir7k mimic- and Mir7k inhibitor-treated MSCs. At 3 days after DSS treatment, Mir7k mimic treated-MSCs were infused into control colitis mice and Mir7k inhibitor-treated MSCs were infused into mice subjected to restraint stress. (E) Body weight loss and (F) disease activity index (DAI) were monitored daily during the entire experiment (n = 5 per group) (* P < 0.05, ** P < 0.01, *** P < 0.005, DSS+MSC versus DSS+Mir7k mimic-MSC; # P < 0.05, ## P < 0.01, DSS+Stress+Mir7k KD-MSC versus DSS+Stress+MSC). At 10 days after DSS induction, mice were euthanized; (G) colon length was recorded, and (H) colonic epithelial/crypt destruction and inflammatory cell infiltration were visualized using HE staining (yellow arrows: goblet cells; green arrows: destruction of epithelial layer; red arrows: inflammatory cell infiltration). (I) Colonic damage was analyzed using histological activity index (HAI). (J, K) Splenocytes were harvested and the ratios of CD4+ IL17A+ Th17 cells and CD4+ CD25+ FOXP3+ Tregs among CD4+ T cells in the spleen were determined using flow cytometry. All results were verified in three independent experiments. A two-tailed Student’s t test (A, B) and one-way ANOVA with Bonferroni’s comparison test (C, E, F, G, I, J, K) were used for statistical analysis. Error bars represent the mean ± s.d. ***P < 0.005; **P < 0.01; *P < 0.05; KD, knockdown
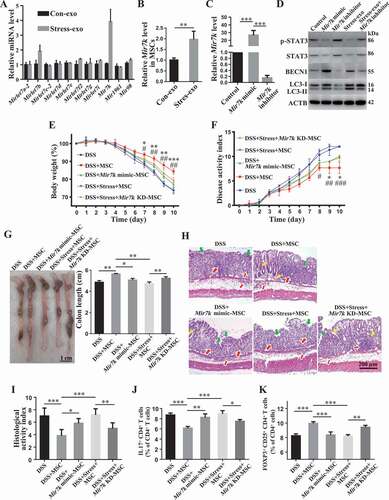
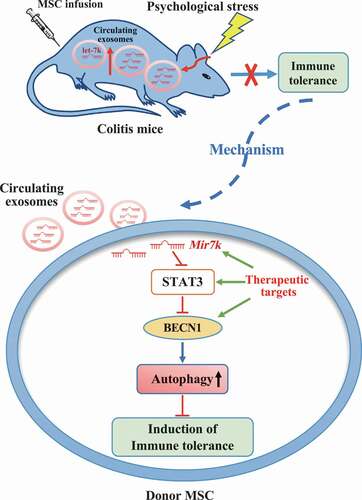
Figure 9. Schematic diagram of how circulating exosomal Mir7k attenuates MSC-mediated therapeutic effects in colitis mice via upregulation of autophagy
Next, we asked how activated autophagy restrained the immunomodulatory function of MSCs. Since autophagy can modulate the immunomodulatory function of MSCs by affecting the production of immunosuppressive factors [Citation42], we compared the levels of serval well-known anti-inflammatory cytokine, including IL10 (interleukin 10), TGFB1/TGF-β1 (transforming growth factor, beta 1), IL1RN/IL-1Rra (interleukin 1 receptor antagonist), TNFAIP6/TSG6 (tumor necrosis factor alpha induced protein 6) and PGE2 (prostaglandin E2), in MSCs treated with control or stressed mouse-derived exosomes. We found that stressed mouse-derived exosomes inhibited the expression levels of TNFAIP6/TSG6 and PGE2 (Fig. S5D,E), but not IL10, TGFB1/TGF-β1 and IL1RN/IL-1Rra (Fig. S5A-C). In order to determine whether Mir7k-STAT3-BECN1-autophagy axis is responsible for the downregulation of TNFAIP6/TSG6 and PGE2 when treated with stressed mouse-derived exosomes, we used qPCR analysis to determine the levels of TNFAIP6/TSG6 and PGE2 in MSCs treated with stressed mouse-derived exosomes, control exosomes and Mir7k mimic, Mir7k inhibitor and stressed mouse derived-exosomes, colivelin and stressed mouse derived-exosomes, Becn1 siRNA and stressed mouse derived-exosomes, and control plasma exosomes. The results showed that Becn1 siRNA treatment could rescue the level of TNFAIP6/TSG6 in stressed mouse exosomes-treated MSCs (Fig. S5D). Mir7k inhibitor, colivelin and Becn1 siRNA treatment elevated the levels of PGE2 in MSCs exposed to stressed mouse-derived exosomes (Fig. S5E). Interestingly, Mir7k mimic treatment reduced the levels of TNFAIP6/TSG6 and PGE2 (Fig. S5D,E). These results indicate that upregulated autophagy by restraint stressed mouse-derived exosome treatment may impair MSC-mediated therapy via inhibiting the production of anti-inflammatory cytokine PGE2.
Discussion
The immunomodulatory effects of MSCs are affected by properties of the recipient microenvironment, such as the levels of inflammatory cytokines. In present study, we identify that circulating exosomes are critical for MSCT therapy in colitis mice. Different types of cells release exosomes into the blood to transmit signals throughout the body and maintain immune homeostasis [Citation28,Citation45]. We found that circulating exosomes could be endocytosed by systemically infused MSCs through a clathrin-dependent pathway. Under pathological conditions, the characterization and function of circulating exosomes may dramatically change [Citation39]. Interestingly, most previous studies in this area have focused on how infused MSCs transfer exosomes to host recipient cells to exert their therapeutic effects [Citation7,Citation46–48]. Here we showed that restraint stress altered circulating exosomes, which abolished the effects of MSCT on DSS-induced colitis. It appears that exosomes are critical messengers for interaction between MSCs and the recipient microenvironment, which may determine the outcome of MSC therapy. We found that one single MSCT could confer long-term therapeutic effects in colitis, it is possible that MSCT may use epigenetic regulation to achieve a therapeutic effect through transferring multiple miRNAs or proteins to recipient immune cells [Citation49]. Also, MSCT could imprint an innate immune memory-like response that provides sustained protection to inflammatory injury in the long-term [Citation50].
Accumulating evidence indicates that autophagy plays a critical role in MSC immunoregulation, differentiation and maintenance of stemness [Citation36,Citation42,Citation51,Citation52]. In this study, we showed that circulating exosomes derived from restraint stressed mice impaired the immunomodulatory function of MSCs by activating autophagy. Inhibition of autophagy by knockdown of BECN1 partially rescued MSC-mediated therapeutic efficacy in the restraint stress condition. Inhibition of autophagy also restored the ability of MSC-mediated downregulating Th17 cells and upregulating Tregs in the stressed condition. Furthermore, downregulation of autophagy rescued the expression levels of TNFAIP6/TSG6 and PGE2 in MSCs treated with restraint stressed exosomes. Previous studies showed that TNFAIP6/TSG6 and PGE2, secreted by MSCs, are capable of promoting Treg generation [Citation53,Citation54]. Also, MSC-produced PGE2 is able to inhibit Th17 [Citation55,Citation56]. However, the previous findings regarding the effects of autophagy on the immunomodulatory characteristics of MSCs are controversial. It was reported that inhibiting autophagy increases MSC immunosuppressive effects on T cell-mediated experimental autoimmune encephalomyelitis through promoting the expression level of PGE2, which impairs the activation and proliferation of T cells [Citation12]. Our results were consistent with this report. In contrast, other studies have indicated that autophagy enhances the therapeutic efficacy of MSCs by increasing production of immunosuppressive TGFB1/TGF-β1, IL10 and IDO (indoleamine 2,3-dioxygenase) [Citation57,Citation58]. Although physiological levels of autophagy help maintain cellular homeostasis during various stress conditions, excessive or prolonged autophagy can induce autophagy-dependent cell death [Citation59,Citation60]. Thus, the amount of autophagy may affect the immunomodulatory functions of MSCs, for better or for worse. Further investigations are required to elucidate the underlying mechanisms by which the activation of autophagy affects MSC-mediated immune therapies.
We also observed that the suppression of STAT3 was responsible for the activation of autophagy by stressed mouse-derived circulating exosomes. STAT3 signaling pathway is involved in multiple aspects of the autophagic process and modulates it via both transcription-dependent and transcription-independent pathways. Through binding to the promoter region of BECN1, STAT3 represses BECN1 transcription by recruiting HDAC3 (histone deacetylase 3) [Citation61]. STAT3 also transcriptionally activates BCL2 and MCL1 expression, leading to autophagy inhibition through interacting with a BH3 domain of BECN1 [Citation62,Citation63]. Furthermore, by binding to EIF2AK2/protein kinase R, STAT3 represses autophagy in a transcription-independent fashion [Citation64]. Previous study demonstrated that blockade of STAT3 phosphorylation leads to impairment of MSC-mediated inhibition of T-cell proliferation [Citation65]. Nevertheless, that study did not investigate the autophagy level or other downstream signaling pathways after blockade of STAT3. Here, we found that activation of STAT3 inhibited the autophagy induced by stressed mouse-derived circulating exosomes and partially rescued the immunomodulatory efficacy of MSCT in DSS-induced colitis mice subjected to restraint stress. Notably, STAT3 and the autophagy pathway may play an essential role in modulation of the immunosuppressive function of MSCs.
Exosomes generally contain intravesicular miRNA, which contributes to intercellular communication through altering the gene expression and functions of the recipient cells [Citation66]. Recent studies showed that large numbers of immunomodulatory miRNAs, including the let-7 family, Mir21a, Mir26a-1, Mir92a, Mir126a, and Mir451a, were enriched in circulating exosomes [Citation28,Citation67]. In addition, previous studies indicated that acute stress alters proteomic and miRNA profiles of circulating exosomes to improve host defense [Citation18]. In this study, we found that restraint stress significantly increased the exosomal Mir7k level in the plasma, which plays a critical role in modulating autophagy and immunoregulation of donor MSCs via suppressing STAT3 pathway. Upon blockage of Mir7k, MSCT-mediated therapeutic effects on restraint stressed colitis mice were partially rescued. Conversely, Mir7k mimic-treated MSCs showed elevated levels of autophagy and reduced therapeutic efficacy in treating colitis mice. Moreover, Mir7k-STAT3-autophagy pathway affected the expression of anti-inflammatory cytokine PGE2 in MSCs. These data suggest that recipient circulating exosomes affect donor MSCs to determine their therapeutic effect in stress conditions by regulating autophagy.
The goal of precision medicine is to match each patient with the optimal treatment, thereby improving the overall success and cost-effectiveness of health care delivery [Citation68–70]. However, due to lack of relevant biomarkers to predict the efficacy of MSC therapy, currently clinicians treat various immune-related disorders using MSCs with little consideration of the individual status of the patients [Citation14]. Since inflammatory status and circulating exosomal miRNAs in the recipients have been proven to modulate the immunosuppressive functions of MSCs, it is possible to develop relevant biomarkers that may predict the efficacy of MSCT therapy. Furthermore, it is urgently necessary to reveal the mechanisms underlying how these biomarkers or microenvironments affect the immunomodulatory capacity of MSCs. These findings would be highly instructive, especially when routine MSC infusion fails to provide effective therapy. In this situation, we may be able to modify MSCs appropriately to achieve optimal therapeutic efficacy. For instance, based on this study, we may be able to modify Mir7k-STAT3-autophagy pathway by using let-7 inhibitor or STAT3 activator to improve MSCT therapy in stressed colitis patients.
In summary, our results reveal that circulating exosomes in the recipient represent a critical factor that may influence MSC therapy in colitis mice. Regulation of the Mir7k-STAT3-autophagy axis may improve MSC-mediated therapy in stressed conditions ().
Materials and methods
Mice
Female C57BL/6 J, C57BL/6-Tg (CAG-EGFP) mice were purchased from the Jackson Laboratory and Laboratory Animal Center of Sun Yat-sen University. All animal experiments were performed under institutionally approved protocols for the use of animal research (University of Pennsylvania IACUC# 805478 and Sun Yat-sen University SYSU-IACUC #2018-000285).
Isolation of mouse bone marrow mesenchymal stem cells (MSCs)
A single suspension of bone marrow-derived all nucleated cells (ANCs, 15 × 106) from mouse femurs and tibias was seeded in 10-cm diameter culture dish (Corning, 430293) at 37°C in 5% CO2. Non-adherent cells were removed after 48 h and attached cells were maintained for an additional 14 days in alpha minimum essential medium (α-MEM, Invitrogen, 12561056) supplemented with 20% fetal bovine serum (Equitech-Bio, SFBU30), 55 μM 2-mercaptoethanol (Gibco, 21985–023), 2 mM L-glutamine (Invitrogen, 25030081), 100 U/mL penicillin, 100 μg/mL streptomycin (Invitrogen, 15140122). Colony-forming attached cells were passaged once for further experimental use.
MSC transplantation (MSCT) in DSS-induced colitis mouse model
Colitis was induced by administering 3% (w:v) dextran sulfate sodium (DSS, molecular mass: 36,000–50,000 Da; MP Biochemicals, 160110) through drinking water ad libitum for 10 days. A total of 0.5 × 10⁶ passage one MSCs were infused into mice intravenously 3 days after the beginning of DSS treatment. In the control group, mice received an equal amount of phosphate-buffered saline (PBS; Gibco, C10010500BT). Body weight and the disease activity index (DAI) were monitored daily. The following parameters were used for calculation of DAI: (a) weight loss (0 point: none; 1 point: 1–5% weight loss; 2 points: 5–10% weight loss; 3 points: 10–15%weight loss; 4 points: more than 15% weight loss); (b) stool consistency/diarrhea (0 point: normal; 2 points: loose stools; 4 points: watery diarrhea); (c) bleeding (0 point: no bleeding; 2 points: slight bleeding; 4 points: gross bleeding). The DAI was calculated as the sum of these scores, resulting in a total DAI score ranging from 0 (normal) to 12 (severe colitis) [Citation71]. All mice were sacrificed at day 10 after being fed DSS water. Colon length was recorded. Afterward, colons were processed for histopathological analysis.
Colon histological analysis
For histological analysis, colon tissues were fixed with 4% paraformaldehyde (Sigma, P6148) for 24 h, followed by paraffin embedding. Paraffin sections 5 mm in thickness were stained with hematoxylin and eosin (H&E). The following parameters were used for estimation of histological activity index (HAI): (a) Epithelial damage (0 point: none; 1 point: minimal loss of goblet cells; 2 points: extensive loss of goblet cells; 3 points: minimal loss of crypts and extensive loss of goblet cells; 4 points: extensive loss of crypts); (b) Infiltration (0 point: none; 1 point: inflammatory cells infiltration around crypt bases; 2 points: infiltration in muscularis mucosa; 3 points: extensive infiltration in muscularis mucosa with edema; 4 points: infiltration of submucosa). HAI was calculated as the sum of the epithelial damage and infiltration scores, resulting in a total HAI score ranging from 0 (normal) to 8 (severe colitis) [Citation71,Citation72].
Restraint stress
To establish a chronic physical restraint stress model, mice were held in ventilated 50 ml centrifuge tubes for 4 h per day (between 18:00 and 22:00) for two consecutive days, beginning on day 2 post-DSS induction. Neither the stressed nor the control mice were allowed food or water during these 4 h period. Food and water were then provided ad libitum after the end of the restraint stress. To investigate the impact of restraint stress on the therapeutic effects of MSCs on DSS-induced colitis, MSCs were injected at day 3 before restraint stress.
Intracellular staining for flow cytometry
For FOXP3 intercellular staining, splenocytes were harvested and stained with anti-CD4-PerCP (BioLegend, 116012) and CD25-APC antibodies (BioLegend, 102012) for 30 min on ice. Next, cells were stained with anti-FOXP3-PE antibody (BioLegend, 320008) using a FOXP3 staining buffer kit (eBioscience, 00–5523-00) for cell fixation and permeabilization. For IL17A straining, splenocytes were treated with 500 ng/ml PMA (Peprotech, 1652981) and 500 ng/ml ionomycin (Peprotech, 5608212) for 5 h, with brefeldin A (BFA; 5 µg/ml, Peprotech, 2031560) added during the last 4 h in culture. Next, cells were stained with anti-CD4-PerCP antibody and then stained with anti-IL17A-PE antibody (BioLegend, 506904) using the FOXP3 staining buffer kit. These samples were analyzed with a FACScalibur flow cytometer (BD Bioscience, San Jose, CA, USA).
In vitro CD4+ IL17A+ Th17 cell and CD4+ CD25+ FOXP3+ Treg cell induction
CD4+ T-lymphocytes were isolated from splenocytes using BD IMag™ anti-mouse CD4 Particles-DM (BD Bioscience, 551539) according to the manufacturer’s instructions. Then these CD4+ T cells were pre-stimulated with plate bounded anti-CD3E antibody (clone 145–2C11, 5 µg/ml, BioLegend, 100302) and soluble anti-CD28 antibody (clone 37.51, 5 µg/ml, BioLegend, 102102) for 2 days. For Th17 cell (T helper cell 17) induction, the activated T cells (1 × 10⁶) were loaded on a culture of 0.2 × 10⁶ MSCs with recombinant human TGFB1/TGF-β1 (2 ng/ml; R&D Systems, 240-B), recombinant mouse Il6 (25 ng/ml; Peprotech, 216–16), recombinant mouse Il23 (20 ng/ml; Peprotech, 200–23), and recombinant mouse IL1B/IL-1β (20 ng/ml; Peprotech, 211–11B) [Citation73]. After 3 days, cells in suspension were collected for IL17A antibody staining and analyzed with FACScalibur (BD Bioscience). For Treg cell (regulatory T cell) induction, the activated T cells (1 × 10⁶) were loaded on a culture of 0.2 × 10⁶ MSCs in the presence of recombinant human TGFB1/TGF-β1 (2 ng/ml) and recombinant mouse IL2 (2 ng/ml; R&D Systems, 402-ML) [Citation74]. After 3 days, cells in suspension were collected for FOXP3 antibody staining and analyzed with FACScalibur.
Isolation, characterization, quantitation and labeling of plasma exosomes
Plasma exosomes derived from restraint-stressed and control mice were isolated using the ExoQuick® ULTRA EV isolation kit (EQULTRA-20A-1, System Bioscience, SBI). Briefly, plasma samples were subjected to centrifugation at 10, 000 × g for 30 min 4°C to remove cell debris and platelets, then filtered with a 0.22-μm filter (Millipore, SLGP033R). The samples were further pre-treated with thrombin (final concentration of 5 U/mL, SBI, EXOQ5TM-1) and then centrifuged at 10, 000 × g for 5 min. The resulting supernatant was mixed with one-fourth of its volume of precipitation buffer and incubated for 30 min at 4°C. Exosomes were pelleted by centrifugation at 3000 × g for 10 min, purified by ExoQuick® ULTRA columns, dissolved in PBS and stored at −80°C. Exosome proteins were quantified using the Pierce BCA Protein Assay (Thermo, 23223). The size distribution and ultrastructure of purified exosomes was determined using a NanoSight and transmission electron microscopy. Furthermore, exosome-specific markers CD63, CD9 and CD81 were detected by western blot. To label plasma exosomes with red/green fluorescence, PKH-26/67 (Sigma, PKH-26GL/67GL) was used according to the manufacturer’s instructions.
Nanoparticle tracking analysis (NTA)
The size distribution and particle concentration of purified exosomes was determined using a NanoSight LM10 (NanoSight Ltd., England) with constant flow injection. The particle movement (detection time: 5 × 30 s) was analyzed using NTA software (NTA 3.1).
Transmission electron microscopy (TEM)
A total of 10 μL purified exosomes was placed on a copper mesh and incubated at room temperature for 1 min. After washing with sterile distilled water, the exosomes enriched fraction was contrasted by uranyl acetate solution for 1 min. The sample was then dried for 2 min under incandescent light. The copper mesh was observed and photographed under the JEM-1400 electron microscope (JEOL Ltd., Japan).
MSCs Uptake exosomes
To determine whether infused MSCs can uptake circulating exosomes in vivo, plasma exosomes were labeled using a PKH67 green fluorescent labeling kit (Sigma, PKH67 GL) and MSCs were labeled using PKH26 red fluorescent labeling kit (Sigma, PKH26 GL) according to the manufacturer’s instructions. Subsequently, PKH67-labeled exosomes (1.5 mg) were infused into mice intravenously, followed by PKH26 labeled-MSC infusion (1 × 10⁶). At 2 h post-infusion, peripheral blood samples were collected, and then observed with a laser-scanning confocal microscope (Zeiss LSM 880, Zeiss, Germany) or analyzed with a FACScalibur flow cytometer.
To determine whether MSCs can uptake circulating exosomes in vitro, PKH-26 labeled plasma exosomes were incubated with MSCs. After 24 h of co-culture, MSCs were stained with ActinGreen™ 488 ReadyProbes™ (Invitrogen, R37110) and DAPI (Abcam, ab104139), and the cellular uptake of exosomes were observed with a fluorescence microscope (Zeiss, Germany). Furthermore, PKH-67 labeled plasma exosomes were incubated with MSCs, the uptake of exosomes by MSCs were analyzed with a FACScalibur flow cytometer after the indicated time of co-culture.
Western blotting
Total protein from MSCs and purified exosomes was extracted using M-PER mammalian protein extraction reagent (Thermo Fisher Scientific, 78501) with protease and phosphatase inhibitors (Cell Signaling Technology, 5872). Protein levels were quantified using a protein concentration assay (Bio-Rad Laboratories). For western blotting of cell lysis, 20 μg of proteins were separated by SDS-polyacrylamide gel electrophoresis (SDS-PAGE; Invitrogen, NP0322PK2) and transferred to 0.2 μm PVDF membranes (Millipore, IEVH85R). The membranes were blocked with 5% bovine serum albumin (BSA; Sigma, V900933) and 0.1% Tween-20 (Sigma, P1379) for 1 h at room temperature, followed by incubation at 4°C overnight with the primary antibodies diluted in blocking solution according to the manufacturer’s instructions. Antibodies to mouse LC3B (3868), STAT3 (124H6; 9139), and phospho-STAT3 (Tyr705; 9145) were purchased from Cell Signaling Technology (Beverly, MA, USA). Antibodies to mouse BECN1 (sc-48341), CD63 (sc-5275), CD9 (sc-13118) and CD81 (sc-70803) were purchased from Santa Cruz Biotechnology (Dallas, TX, USA). Antibody to mouse ACTB/β-actin (A5441) was purchased from Sigma-Aldrich (USA) and used to quantify the amount of loaded protein. The membranes were then incubated for 1 h at room temperature in species-related horseradish peroxidase (HRP)-conjugated secondary antibody (1: 10,000; Santa Cruz Biotechnology, sc-2357 and sc-516102). Immunoreactive proteins were detected using Super Signal West Pico Chemiluminescent Substrate (Thermo Fisher Scientific, 34580) and Biomax film (Kodak).
Enzyme linked immunosorbent assay (ELISA)
Corticosterone in serum was determined using an ELISA kit purchased from R&D Systems (KGE009) according to the manufacturer’s instructions. TNF/TNF-α and IFNG/IFN-γ in serum were analyzed using ELISA kits from eBioscience (88–7324/88-7314) according to the manufacturer’s instructions.
Real-time polymerase chain reaction (RT-PCR)
Total RNA was isolated from the purified plasma exosomes and cultured cells using the miRNeasy Mini Kit (Qiagen, 217004) according to the manufacturer’s instructions. For real-time PCR of mature miRNA, RNA was subjected to complementary DNA (cDNA) synthesis using the miScript II RT Kit (Qiagen, 218161). Real-time PCR was performed using the miScript SYBR Green PCR Kit (Qiagen, 218073). Rnu6 small nuclear RNA (snRNA) was used as an endogenous control for MSCs. Mir39 (Qiagen, 339390) was used as spike-in control for plasma exosomes. Real-time PCR was detected on a CFX96 Real-Time PCR System (Bio-Rad). The relative expression levels of miRNAs were normalized to Rnu6 or Mir39 following the 2–ΔΔCT comparative method. The primers are listed in Table S1. For real-time PCR of mRNA, the cDNA was synthesized using SuperScript III (Life Technologies, 18080044). The real-time PCR was performed using SYBR green supermix (Bio-Rad, 170–8882) and gene-specific primers. The primers included Il10: forward, 5ʹ-CTTACTGACTGG-CATGAGGATCA-3ʹ and reverse, 5ʹ-GCAGCTCTAGGAGCATGTGG-3ʹ; Tgfb1: forward, 5ʹ- GCCACTGCCCATCGTCTACT-3ʹ and reverse, 5ʹ-CACTTGCAGGAGCGCACAAT-3ʹ; Il1rn: forward, 5ʹ-GATTGTAGCATTCCCATAATCTCC-3ʹ and reverse, 5ʹ-GAGGAACTTCTTCA-GGCATCTGT-3ʹ; Tnfaip6: forward, 5ʹ-GCTGGCAGATACAAGCTCACC-3ʹ and reverse, 5ʹ-CATCCATCCAGCAGCACAGAC-3ʹ; Ptgs2: forward, 5ʹ-ATTCCCTCCGGTGTTTGTCC-3ʹ and reverse, 5ʹ-TCCCTTCTCACTGG-CTTATGTAG-3ʹ; Actb: forward, 5ʹ-TCCATCAT-GAAGTGTGACGT-3ʹ and reverse, 5ʹ-TACTCCTGCTTGCTGATCCAC-3ʹ. The relative expression levels of mRNA were normalized to Actb.
Lentiviral transfection
To access the autophagy flux of MSCs, MSCs were transfected with lentiviral plasmid encoding mCherry-GFP-LC3B (pLenti-CMV-MCherry-GFP-LC3B-IRES-Puro, OBiO Technology). The autolysosomes (mCherry only, red dots) and autophagosomes (mCherry and GFP double positive, yellow dots) were observed using a laser-scanning confocal microscope (Zeiss LSM 900, Zeiss, Germany).
siRNA (small-interfering RNA) knockdown, microRNA mimic and inhibitor transfection
MSCs (0.2 × 10⁶) were seeded on a 6-well culture plate and were transfected with BECN1 (beclin1) siRNAs (20 μM; Santa Cruz Biotechnology, sc-29798), Mir7k mimics (50 μM; Ribobio, miR1190129092416), or inhibitors (100 μM; Ribobio, miR2190129092445) using Lipofectamine RNAiMAX transfection reagent (Life Technologies, 13778150) in Opti-MEM (Life Technologies, 31985088) according to the manufacturers’ instructions. Nontargeting control siRNAs (Santa Cruz Biotechnology, sc-37007) were used as negative controls. After 48 h of transfection, BECN1 knockdown was confirmed by western blot, and Mir7k level was determined by RT-PCR.
Statistical analysis
All results are expressed as mean±standard deviation (s.d). Comparisons between two groups were analyzed using independent unpaired two-tailed Student’s t-tests, and comparisons between more than two groups were analyzed using one-way analysis of variance (ANOVA) with the Bonferroni adjustment. P values <.05 were considered statistically significant.
Supplemental Material
Download MS Word (6.2 MB)Disclosure statement
The authors report no conflicts of interest.
Supplementary material
Supplemental data for this article can be accessed here.
Additional information
Funding
References
- Jiang Y, Jahagirdar BN, Reinhardt RL, et al. Pluripotency of mesenchymal stem cells derived from adult marrow. Nature. 2002;418(6893):41–49.
- Pittenger MF, Mackay AM, Beck SC, et al. Multilineage potential of adult human mesenchymal stem cells. Science. 1999;284(5411):143–147.
- Liu Y, Wang L, Kikuiri T, et al. Mesenchymal stem cell-based tissue regeneration is governed by recipient T lymphocytes via IFN-gamma and TNF-alpha. Nat Med. 2011;17(12):1594–1601.
- Nauta AJ, Fibbe WE. Immunomodulatory properties of mesenchymal stromal cells. Blood. 2007;110(10):3499–3506.
- Bernardo ME, Fibbe WE. Mesenchymal stromal cells: sensors and switchers of inflammation. Cell Stem Cell. 2013;13(4):392–402.
- Akiyama K, Chen C, Wang D, et al. Mesenchymal-stem-cell-induced immunoregulation involves FAS-ligand-/FAS-mediated T cell apoptosis. Cell Stem Cell. 2012;10(5):544–555.
- Chen C, Wang D, Moshaverinia A, et al. Mesenchymal stem cell transplantation in tight-skin mice identifies miR-151-5p as a therapeutic target for systemic sclerosis. Cell Res. 2017;27(4):559–577.
- Sun L, Akiyama K, Zhang H, et al. Mesenchymal stem cell transplantation reverses multiorgan dysfunction in systemic lupus erythematosus mice and humans. Stem Cells. 2009;27(6):1421–1432.
- Nemeth K, Keane-Myers A, Brown JM, et al. Bone marrow stromal cells use TGF-beta to suppress allergic responses in a mouse model of ragweed-induced asthma. Proc Natl Acad Sci U S A. 2010;107(12):5652–5657.
- Nemeth K, Leelahavanichkul A, Yuen PS, et al. Bone marrow stromal cells attenuate sepsis via prostaglandin E(2)-dependent reprogramming of host macrophages to increase their interleukin-10 production. Nat Med. 2009;15(1):42–49.
- Ren G, Zhang L, Zhao X, et al. Mesenchymal stem cell-mediated immunosuppression occurs via concerted action of chemokines and nitric oxide. Cell Stem Cell. 2008;2(2):141–150.
- Dang S, Xu H, Xu C, et al. Autophagy regulates the therapeutic potential of mesenchymal stem cells in experimental autoimmune encephalomyelitis. Autophagy. 2014;10(7):1301–1315.
- Sala E, Genua M, Petti L, et al. Mesenchymal stem cells reduce colitis in mice via release of TSG6, independently of their localization to the intestine. Gastroenterology. 2015;149(1):163–176 e120.
- Wang Y, Chen X, Cao W, et al. Plasticity of mesenchymal stem cells in immunomodulation: pathological and therapeutic implications. Nat Immunol. 2014;15(11):1009–1016.
- Shi Y, Wang Y, Li Q, et al. Immunoregulatory mechanisms of mesenchymal stem and stromal cells in inflammatory diseases. Nat Rev Nephrol. 2018;14(8):493–507.
- Pegtel DM, Gould SJ. Exosomes. Annu Rev Biochem. 2019;88:487–514.
- Pluchino S, Smith JA. Explicating exosomes: reclassifying the rising stars of intercellular communication. Cell. 2019;177(2):225–227.
- Beninson LA, Fleshner M. Exosomes: an emerging factor in stress-induced immunomodulation. Semin Immunol. 2014;26(5):394–401.
- Huang X, Yuan T, Liang M, et al. Exosomal miR-1290 and miR-375 as prognostic markers in castration-resistant prostate cancer. Eur Urol. 2015;67(1):33–41.
- Tan KH, Tan SS, Ng MJ, et al. Extracellular vesicles yield predictive pre-eclampsia biomarkers. J Extracell Vesicles. 2017;6(1):1408390.
- Zeng Z, Li Y, Pan Y, et al. Cancer-derived exosomal miR-25-3p promotes pre-metastatic niche formation by inducing vascular permeability and angiogenesis. Nat Commun. 2018;9(1):5395.
- Bjornetro T, Redalen KR, Meltzer S, et al. An experimental strategy unveiling exosomal microRNAs 486-5p, 181a-5p and 30d-5p from hypoxic tumour cells as circulating indicators of high-risk rectal cancer. J Extracell Vesicles. 2019;8(1):1567219.
- Chen G, Huang AC, Zhang W, et al. Exosomal PD-L1 contributes to immunosuppression and is associated with anti-PD-1 response. Nature. 2018;560(7718):382–386.
- Heidt T, Sager HB, Courties G, et al. Chronic variable stress activates hematopoietic stem cells. Nat Med. 2014;20(7):754–758.
- Wu L, Lu Y, Jiao Y, et al. Paternal psychological stress reprograms hepatic gluconeogenesis in offspring. Cell Metab. 2016;23(4):735–743.
- Song H, Fang F, Tomasson G, et al. Association of stress-related disorders with subsequent autoimmune disease. JAMA. 2018;319(23):2388–2400.
- Guerrero-Alba R, Valdez-Morales EE, Jimenez-Vargas NN, et al. Stress activates pronociceptive endogenous opioid signalling in DRG neurons during chronic colitis. Gut. 2017;66(12):2121–2131.
- Fleshner M, Crane CR. Exosomes, DAMPs and miRNA: features of stress physiology and immune homeostasis. Trends Immunol. 2017;38(10):768–776.
- Yang X, Han ZP, Zhang SS, et al. Chronic restraint stress decreases the repair potential from mesenchymal stem cells on liver injury by inhibiting TGF-beta1 generation. Cell Death Dis. 2014;5:e1308.
- Zhang S, Lv C, Yang X, et al. Corticosterone mediates the inhibitory effect of restraint stress on the migration of mesenchymal stem cell to carbon tetrachloride-induced fibrotic liver by downregulating CXCR4/7 expression. Stem Cells Dev. 2015;24(5):587–596.
- Kroemer G, Marino G, Levine B. Autophagy and the integrated stress response. Mol Cell. 2010;40(2):280–293.
- Matsuzawa-Ishimoto Y, Hwang S, Cadwell K. Autophagy and Inflammation. Annu Rev Immunol. 2018;36:73–101.
- Puri D, Subramanyam D. Stress - (self) eating: epigenetic regulation of autophagy in response to psychological stress. Febs J. 2019;286(13):2447–2460.
- Lu X-T, Liu X-Q, Wang B, et al. The role of psychological stress on heart autophagy in mice with heart failure. Psychosom Med. 2017;79(9):1036–1044.
- Qin A, Zhong T, Zou H, et al. Critical role of Tim-3 mediated autophagy in chronic stress induced immunosuppression. Cell Biosci. 2019;9:13.
- Ceccariglia S, Cargnoni A, Silini AR, et al. Autophagy: a potential key contributor to the therapeutic action of mesenchymal stem cells. Autophagy. 2020;16(1):28–37.
- Mawdsley JE, Rampton DS. Psychological stress in IBD: new insights into pathogenic and therapeutic implications. Gut. 2005;54(10):1481–1491.
- Seifi M, Rodaway S, Rudolph U, et al. GABA(A) Receptor Subtypes Regulate Stress-Induced Colon Inflammation in Mice. Gastroenterology. 2018;155(3):852–864.e853.
- Terrasini N, Lionetti V. Exosomes in Critical Illness. Crit Care Med. 2017;45(6):1054–1060.
- Jansen F, Nickenig G, Werner N. Extracellular vesicles in cardiovascular disease: potential applications in diagnosis, prognosis, and epidemiology. Circ Res. 2017;120(10):1649–1657.
- Tian T, Zhu YL, Zhou YY, et al. Exosome uptake through clathrin-mediated endocytosis and macropinocytosis and mediating miR-21 delivery. J Biol Chem. 2014;289(32):22258–22267.
- Jakovljevic J, Harrell CR, Fellabaum C, et al. Modulation of autophagy as new approach in mesenchymal stem cell-based therapy. Biomed Pharmacother. 2018;104:404–410.
- You L, Wang Z, Li H, et al. The role of STAT3 in autophagy. Autophagy. 2015;11(5):729–739.
- Beninson LA, Brown PN, Loughridge AB, et al. Acute stressor exposure modifies plasma exosome-associated heat shock protein 72 (Hsp72) and microRNA (miR-142-5p and miR-203). PLoS One. 2014;9(9):e108748.
- Vicencio JM, Yellon DM, Sivaraman V, et al. Plasma exosomes protect the myocardium from ischemia-reperfusion injury. J Am Coll Cardiol. 2015;65(15):1525–1536.
- Cheng L, Zhang K, Wu S, et al. Focus on Mesenchymal Stem Cell-Derived Exosomes: opportunities and Challenges in Cell-Free Therapy. Stem Cells Int. 2017;2017:6305295.
- Phinney DG, Pittenger MF. Concise Review: MSC-Derived Exosomes for Cell-Free Therapy. Stem Cells. 2017;35(4):851–858.
- Phinney DG, Di Giuseppe M, Njah J, et al. Mesenchymal stem cells use extracellular vesicles to outsource mitophagy and shuttle microRNAs. Nat Commun. 2015;6:8472.
- Liu S, Liu D, Chen C, et al. MSC transplantation improves osteopenia via epigenetic regulation of notch signaling in lupus. Cell Metab. 2015;22(4):606–618.
- Lopez-Santalla M, Hervas-Salcedo R, Fernandez-Garcia M, et al. Cell therapy with mesenchymal stem cells induces an innate immune memory response that attenuates experimental colitis in the long-term. J Crohns Colitis. 2020. DOI:https://doi.org/10.1093/ecco-jcc/jjaa079
- Sbrana FV, Cortini M, Avnet S, et al. The role of autophagy in the maintenance of stemness and differentiation of mesenchymal stem cells. Stem Cell Rev. 2016;12(6):621–633.
- Guan JL, Simon AK, Prescott M, et al. Autophagy in stem cells. Autophagy. 2013;9(6):830–849.
- Kota DJ, Wiggins LL, Yoon N, et al. TSG-6 produced by hMSCs delays the onset of autoimmune diabetes by suppressing Th1 development and enhancing tolerogenicity. Diabetes. 2013;62(6):2048–2058.
- Sharma S, Yang SC, Zhu L, et al. Tumor cyclooxygenase-2/prostaglandin E2-dependent promotion of FOXP3 expression and CD4+ CD25+ T regulatory cell activities in lung cancer. Cancer Res. 2005;65(12):5211–5220.
- Ghannam S, Pène J, Moquet-Torcy G, et al. Mesenchymal stem cells inhibit human Th17 cell differentiation and function and induce a T regulatory cell phenotype. J Immunol. 2010;185(1):302–312.
- Duffy MM, Pindjakova J, Hanley SA, et al. Mesenchymal stem cell inhibition of T-helper 17 cell- differentiation is triggered by cell-cell contact and mediated by prostaglandin E2 via the EP4 receptor. Eur J Immunol. 2011;41(10):2840–2851.
- Gao L, Cen S, Wang P, et al. Autophagy Improves the Immunosuppression of CD4+ T Cells by Mesenchymal Stem Cells Through Transforming Growth Factor-beta1. Stem Cells Transl Med. 2016;5(11):1496–1505.
- Kim KW, Moon SJ, Park MJ, et al. Optimization of adipose tissue-derived mesenchymal stem cells by rapamycin in a murine model of acute graft-versus-host disease. Stem Cell Res Ther. 2015;6:202.
- Kroemer G, Levine B. Autophagic cell death: the story of a misnomer. Nat Rev Mol Cell Biol. 2008;9(12):1004–1010.
- Sun L, Hu L, Cogdell D, et al. MIR506 induces autophagy-related cell death in pancreatic cancer cells by targeting the STAT3 pathway. Autophagy. 2017;13(4):703–714.
- Miao LJ, Huang FX, Sun ZT, et al. Stat3 inhibits Beclin 1 expression through recruitment of HDAC3 in nonsmall cell lung cancer cells. Tumour Biol. 2014;35(7):7097–7103.
- Feng Y, Ke C, Tang Q, et al. Metformin promotes autophagy and apoptosis in esophageal squamous cell carcinoma by downregulating Stat3 signaling. Cell Death Dis. 2014;5:e1088.
- Tai WT, Shiau CW, Chen HL, et al. Mcl-1-dependent activation of Beclin 1 mediates autophagic cell death induced by sorafenib and SC-59 in hepatocellular carcinoma cells. Cell Death Dis. 2013;4:e485.
- Shen S, Niso-Santano M, Adjemian S, et al. Cytoplasmic STAT3 represses autophagy by inhibiting PKR activity. Mol Cell. 2012;48(5):667–680.
- Vigo T, Procaccini C, Ferrara G, et al. IFN-gamma orchestrates mesenchymal stem cell plasticity through the signal transducer and activator of transcription 1 and 3 and mammalian target of rapamycin pathways. J Allergy Clin Immunol. 2017;139(5):1667–1676.
- Cheng L, Sharples RA, Scicluna BJ, et al. Exosomes provide a protective and enriched source of miRNA for biomarker profiling compared to intracellular and cell-free blood. J Extracell Vesicles. 2014;3. DOI:https://doi.org/10.3402/jev.v3.23743
- Ohshima K, Inoue K, Fujiwara A, et al. Let-7 microRNA family is selectively secreted into the extracellular environment via exosomes in a metastatic gastric cancer cell line. PLoS One. 2010;5(10):e13247.
- Hodson R. Precision medicine. Nature. 2016;537(7619):S49.
- Kimmelman J, Tannock I. The paradox of precision medicine. Nat Rev Clin Oncol. 2018;15(6):341–342.
- Salgado R, Moore H, Martens JWM, et al. Steps forward for cancer precision medicine. Nat Rev Drug Discov. 2018;17(1):1–2.
- Alex P, Zachos NC, Nguyen T, et al. Distinct cytokine patterns identified from multiplex profiles of murine DSS and TNBS-induced colitis. Inflamm Bowel Dis. 2009;15(3):341–352.
- Kim HS, Shin TH, Lee BC, et al. Human umbilical cord blood mesenchymal stem cells reduce colitis in mice by activating NOD2 signaling to COX2. Gastroenterology. 2013;145(6):1392–1403 e1391–1398.
- Yosef N, Shalek AK, Gaublomme JT, et al. Dynamic regulatory network controlling TH17 cell differentiation. Nature. 2013;496(7446):461–468.
- Chen C, Akiyama K, Yamaza T, et al. Telomerase governs immunomodulatory properties of mesenchymal stem cells by regulating FAS ligand expression. EMBO Mol Med. 2014;6(3):322–334.