
ABSTRACT
Lipotoxicity is a form of cellular stress caused by the accumulation of lipids resulting in mitochondrial dysfunction and insulin resistance in muscle. Previously, we demonstrated that the mitophagy receptor BNIP3L/Nix is responsive to lipotoxicity and accumulates in response to a high-fat (HF) feeding. To provide a better understanding of this observation, we undertook gene expression array and shot-gun metabolomics studies in soleus muscle from rodents on an HF diet. Interestingly, we observed a modest reduction in several autophagy-related genes. Moreover, we observed alterations in the fatty acyl composition of cardiolipins and phosphatidic acids. Given the reported roles of these phospholipids and BNIP3L in mitochondrial dynamics, we investigated aberrant mitochondrial turnover as a mechanism of impaired myocyte insulin signaling. In a series of gain-of-function and loss-of-function experiments in rodent and human myotubes, we demonstrate that BNIP3L accumulation triggers mitochondrial depolarization, calcium-dependent activation of DNM1L/DRP1, and mitophagy. In addition, BNIP3L can inhibit insulin signaling through activation of MTOR-RPS6KB/p70S6 kinase inhibition of IRS1, which is contingent on phosphatidic acids and RHEB. Finally, we demonstrate that BNIP3L-induced mitophagy and impaired glucose uptake can be reversed by direct phosphorylation of BNIP3L by PRKA/PKA, leading to the translocation of BNIP3L from the mitochondria and sarcoplasmic reticulum to the cytosol. These findings provide insight into the role of BNIP3L, mitochondrial turnover, and impaired myocyte insulin signaling during an overfed state when overall autophagy-related gene expression is reduced. Furthermore, our data suggest a mechanism by which exercise or pharmacological activation of PRKA may overcome myocyte insulin resistance.
Abbreviations: BCL2: B cell leukemia/lymphoma 2; BNIP3L/Nix: BCL2/adenovirus E1B interacting protein 3-like; DNM1L/DRP1: dynamin 1-like; FUNDC1: FUN14 domain containing 1; IRS1: insulin receptor substrate 1; MAP1LC3A/LC3: microtubule-associated protein 1 light chain 3 alpha; MFN1: mitofusin 1; MFN2: mitofusin 2; MTOR: mechanistic target of rapamycin kinase; OPA1: OPA1 mitochondrial dynamin like GTPase; PDE4i: phosphodiesterase 4 inhibitor; PLD1: phospholipase D1; PLD6: phospholipase D family member 6; PRKA/PKA: protein kinase, AMP-activated; PRKCD/PKCδ: protein kinase C, delta; PRKCQ/PKCθ: protein kinase C, theta; RHEB: Ras homolog enriched in brain; RPS6KB/p70S6K: ribosomal protein S6 kinase; SQSTM1/p62: sequestosome 1; YWHAB/14-3-3β: tyrosine 3-monooxygenase/tryptophan 5-monooxygenase activation protein beta
Introduction
Skeletal muscle insulin resistance is one of the earliest detectable perturbations in the natural progression of type 2 diabetes, as muscle insulin resistance often proceeds and may contribute to hepatic steatosis, as well as adipocyte and beta cell dysfunction (reviewed in [Citation1–3]). Although the cellular mechanisms responsible for muscle insulin resistance have been historically challenging to uncover, and are likely unique from the mechanisms responsible for insulin resistance in other tissues, ectopic lipid accumulation and mitochondrial dysfunction appear to be key events leading to muscle insulin resistance in humans and in rodent models of obesity and type 2 diabetes [Citation1–3]. However, the exact nature of this mitochondrial defect, and how mitochondrial dysfunction impacts insulin signaling and glucose uptake in muscle, remain poorly understood.
Lipotoxicity is a form of cellular stress caused by the accumulation of lipid intermediates resulting in insulin resistance [Citation1,Citation3,Citation4]. Lipid infusion studies in humans, and high-fat feeding in rodents have demonstrated that muscle tissue rapidly accumulates diacylglycerols, ceramides, and triglycerides in response to these lipid exposures [Citation1,Citation3]. Accumulation of diacylglycerols activate novel PRKC/PKC signaling, including PRKCD/PKCδ and PRKCQ/PKCθ [Citation5–9]. Importantly, PRKCQ/PKCθ has been shown in both human and rodent studies to phosphorylate and inhibit the IRS1 (insulin receptor substrate 1) to prevent insulin-mediated AKT2 activation and SLC2A4/GLUT4-dependent glucose uptake, where a key residue involved in human IRS1 inhibition is Ser1101 [Citation10]. This pathway may protect myocytes from metabolic stress, by preventing further influx of glucose and/or lipids [Citation11].
Macroautophagy/autophagy is a lysosomal degradation pathway that functions in organelle and protein quality control. During cellular stress, increased levels of autophagy permit cells to adapt to changing nutritional and energy demands through catabolism [Citation12–16]. Although originally described as a cellular response to starvation, autophagy also protects against insulin resistance in fed animals [Citation17]. Acute exercise induces autophagy in skeletal muscle, while transgenic mice harboring a BCL2 mutant preventing autophagy induction display decreased exercise tolerance and altered glucose metabolism during acute exercise [Citation17]. Furthermore, exercise fails to protect these mice from high fat diet-induced insulin resistance [Citation17]. More recent evidence suggests that autophagy can be selectively targeted to specific cellular structures, such as mitochondria, and mitochondrial proteins that contain an LC3 interacting region (LIR) can serve as selective mitochondrial autophagy receptors (i.e., mitophagy receptors) [Citation18,Citation19]. A recent study has demonstrated that a skeletal muscle restricted deletion of a hypoxia-inducible mitophagy receptor, called FUNDC1, blunts the mitophagy response and protects against high fat feeding-induced insulin resistance at the expense of exercise tolerance, suggesting that mitophagy may be a contributing factor in muscle insulin resistance. However, FUNDC1 is hypoxia-inducible and has not been shown to be activated by lipotoxicity; thus, other mitophagy receptors may serve to trigger selective autophagy of dysfunctional mitochondria in a fed lipotoxic state when generalized autophagy is inhibited [Citation20,Citation21].
Mitochondrial quality control also involves dynamic fission and fusion events that serve to compartmentalize dysfunctional or depolarized mitochondrial fragments that can be targeted for autophagic degradation [Citation19,Citation22]. Mitochondrial fission and fusion are regulated by a family of GTPases, where DNM1L/DRP1 initiates mitochondrial fission, and MFN1 (mitofusin 1), MFN2, and OPA1 regulate fusion [Citation19,Citation22]. Moreover, lipotoxicity-induced muscle insulin resistance has been associated with mitochondrial fission and activation of DNM1L [Citation23]. Interestingly, phospholipids such as phosphatidic acid and cardiolipin, regulate mitochondrial fission and fusion, where cardiolipin facilitates fusion through and interaction with OPA1, and mitochondrial phosphatidic acids interact with DNM1L [Citation24–26]. In muscle, phosphatidic acids also regulate MTOR signaling during times of growth [Citation27]. MTOR signaling potently inhibits autophagy in a fed state, and is involved in a negative-feedback pathway that limits glucose uptake through MTOR-RPS6KB/p70S6 kinase-mediated phosphorylation of IRS1 [Citation28,Citation29]. However, it remains to be determined how these interconnected signaling pathways contribute to muscle insulin resistance.
Previously, we described a lipotoxicity-activated signaling pathway leading to increased expression of the mitophagy receptor BNIP3L/Nix [Citation30]. This conserved pathway responds to elevated diacylglycerols by activating PRKCD which inhibits the expression of microRNA-133a, a negative regulator of BNIP3L expression. Furthermore, we established that BNIP3L expression is elevated in muscle tissue of rodents fed a high fat diet (HF) [Citation30].
In order to further explore the role of BNIP3L and mitochondrial dysfunction associated with muscle insulin resistance, we undertook an unbiased gene expression array and a shot-gun metabolomics screen in soleus muscle from rodents on a low fat (LF) or HF diet. We observed a decrease in the most abundant tetralinoleoyl-cardiolipin species and an increase in phosphatidic acids, concurrent with increased BNIP3L expression, suggesting altered mitochondrial dynamics and/or mitophagy contribute to muscle insulin resistance. Using two myocyte cell lines, and human myotubes differentiated from induced pluripotent stem cells (iPSCs), we mechanistically determined that BNIP3L accumulation triggers calcium-dependent activation of DNM1L and mitophagy. In addition, BNIP3L expression can impair insulin signaling in myotubes through MTOR-dependent inhibition of IRS1. Finally, we demonstrate that BNIP3L-induced mitophagy and impaired insulin signaling can be reversed by direct phosphorylation of BNIP3L by PRKA/PKA, leading to the translocation of BNIP3L from the mitochondria and sarcoplasmic reticulum to the cytosol. These findings are consistent with a model whereby BNIP3L responds to myocyte lipotoxicity in order to clear damaged mitochondria through receptor-mediated mitophagy and protect the myocyte against nutrient storage stress by activating MTOR-dependent desensitization of insulin signaling.
Results
Metabolomics and gene expression screen
Numerous lipid species were elevated in soleus muscle with HF feeding, including diacylglycerols, ceramides, and triglycerides ( and Table S1-6). Interestingly, we also observed alterations in the composition of cardiolipin. Cardiolipin is normally found in the inner mitochondrial membrane and uniquely contains four acyl chains, where the tetra-linoleoyl (18:2) cardiolipin is the most abundant species. Interestingly, we observed a reduction in this species of cardiolipin with HF feeding (). We also observed an increase in numerous phosphatidic acid species (). To further explore the relationship between lipotoxicity and skeletal muscle autophagy, we performed a PCR-based array on soleus muscle from rats fed a LF or HF diet. We observed a modest reduction in several autophagy-related genes including Becn1, Atg3, Atg5, Atg12 and Atp6v1g2 in HF fed animals ( and Table S1-6). These observations suggested that global autophagy-related gene expression is reduced in muscle during an over-fed state.
Table 1. Representative metabolites and mRNAs altered by HF feeding
BNIP3L expression alters mitochondrial morphology, mitophagy, and impairs insulin signaling
Given our previous findings that BNIP3L is induced in this rodent model [Citation30], and that phospholipids have been implicated in both mitochondrial dynamics and MTOR signaling, we investigated the role of BNIP3L in regulating aspects of mitochondrial quality control following exposure to lipotoxicity. To begin, we expressed BNIP3L in C2C12 myoblasts and monitored mitochondrial morphology using a mitochondrial-targeted Emerald fluorophore (Mito-Emerald). In control cells we observed predominately elongated mitochondria; however, in cells expressing BNIP3L we observed a decrease in elongated mitochondria and increases in mitochondria with an intermediate or “fissioned” morphology and increases in overt mitochondrial fragmentation with a more pronounced perinuclear distribution (). In addition, expression of BNIP3L in both C2C12 and L6 myoblasts resulted in a significant decrease in mitochondrial membrane potential, determined by TMRM staining (). Previously, we demonstrated that BNIP3L-induced mitochondrial depolarization in cardiomyocytes was due to ER/SR-dependent calcium release and subsequent mitochondrial permeability transition [Citation31]. Thus, we examined both steady-state ER/SR and mitochondrial calcium content in cells expressing BNIP3L using organelle-targeted calcium biosensors called GECOs [Citation32–34]. We observed that BNIP3L expression reduced steady-state ER/SR calcium and increased steady-state mitochondrial calcium (). Furthermore, treatment of C2C12 cells with an IP3-receptor blocker (2APB) prevented BNIP3L-induced mitochondrial depolarization (Figure S1A). Previous work has identified that the mitochondrial fission protein DNM1L is activated by PPP3CA/calcineurin, a calcium-calmodulin dependent phosphatase [Citation35]. Thus, we determined if BNIP3L-induced ER/SR calcium release could result in DNM1L dephosphorylation at a known PPP3CA site (mouse Ser643; human Ser637). In C2C12 cells expressing BNIP3L, we observed a reduction in Ser643 phosphorylation, compared to control cells (). As mitochondrial fission and loss of membrane potential are important precursor events leading to mitochondrial autophagy, we evaluated mitophagy using a mitochondrial matrix-targeted pH biosensor called Mito-pHRed [Citation36]. BNIP3L expression in L6 and C2C12 myoblasts and myotubes increased Mito-pHRed fluorescence (). As positive and negative controls, we expressed PRKN/Parkin and Mito-pHRed and observed increased fluorescence, while expression of a dominate-negative ATG5 prevented BNIP3L-induced Mito-pHRed activation (Figure S1B,C). BNIP3L expression also increased the number of GFP-LC3 puncta and the formation of LC3-II (Figure S1D-F), and increased the colocalization of LysoTracker Red and Mito-Emerald (Figure S1G) and LAMP1 and TOMM20 by immunofluorescence (Figure S2A). Moreover, BNIP3L-induced Mito-pHRed activation was prevented by a dominate-negative DNM1L, the mitochondrial fission inhibitor mdivi-1, and the lysosomal inhibitor bafilomycin A1 ().
Figure 1. BNIP3L regulates mitochondrial dynamics and mitophagy. (A-B) C2C12 myoblast cells were transfected with Mito-mEmerald to assess mitochondrial morphology (left). Quantification of C2C12 myoblast cells transfected with BNIP3L or empty vector control (right). (C-D) Quantification of C2C12 myoblast cells (C) or L6 myoblasts (D) transfected with BNIP3L or an empty vector control; stained with TMRM. (E) Quantification of C2C12 myoblasts transfected with ER-LAR-GECO, BNIP3L, or an empty vector control. (F) Quantification of C2C12 myoblasts transfected with Mito-CAR-GECO, BNIP3L, or an empty vector control. (G) C2C12 cells were transfected with BNIP3L or empty vector. Protein extracts were analyzed as indicated. (H-J) Quantification of (H) C2C12 myoblasts, (I) C2C12 myotubes, and (J) L6 myoblasts cells transfected with BNIP3L, Mito-pHRed, or an empty vector control. (K) C2C12 cells were transfected with Mito-pHRed, BNIP3L, a dominant negative DNM1L/Drp1 (S36A), or an empty vector control and quantified. (L) C2C12 cells were transfected with Mito-pHRed, BNIP3L, or an empty vector control. Cells were treated with Bafilomycin (6 nM, 3 h) or with the mitochondrial fission inhibitor (mdivi-1, 20 µM, 1 h). (M) Quantification of C2C12 myoblast cells transfected with Mito-pHRed, BNIP3L, mitochondrial targeted BNIP3L fusion constructs BNIP3L-MaoB or BNIP3L-ActA, the ER/SR targeted BNIP3L construct BNIP3L-CYB5, or an empty vector control. (N) C2C12 myoblast cells were transfected with Mito-pHRed, BNIP3L, BNIP3L-CYB5, or an empty vector control. Cells were treated with 2-aminoethoxydiphenyl borate (2APB 10 µM, 1 h), or DMSO as control vehicle and quantified. (O) L6 myotubes were transfected with BNIP3L or empty vector followed by 15 min of insulin stimulation (10 nM). Protein extracts were analyzed as indicated. (P) L6 myotubes were transfected with BNIP3L or an empty vector control. Insulin stimulated glucose uptake (10 nM) was determined by 2NBDG fluorescence and quantified. Data are represented as mean ± S.E.M. *P < 0.05 compared with control, while **P < 0.05 compared with treatment, determined by 1-way or 2-way ANOVA
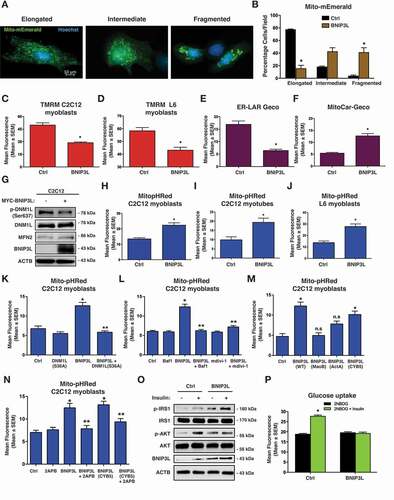
To further delineate the role of BNIP3L as a mitophagy receptor at the mitochondria and as a regulator of calcium release at the ER/SR in our models, we utilized organelle-targeted BNIP3L constructs, as described previously [Citation31]. Interestingly, mitochondrial targeted BNIP3L constructs, using either the MAOB (monoamine oxidase B; (BNIP3L-MaoB) or the Listeria ActA (BNIP3L-ActA) targeting domains, had little to no effect on Mito-pHRed activation; whereas, ER/SR targeted BNIP3L using the CYB5 (cytochrome b5; BNIP3L-CYB5) targeting domain had a similar effect to wild-type BNIP3L (). In addition, we observed that both BNIP3L and BNIP3L-CYB5-induced Mito-pHRed activation was prevented with the IP3-receptor blocker 2APB. Finally, we observed that BNIP3L expression led to enhanced phosphorylation of IRS1 using the phospho-specific Ser1101 antibody and prevented downstream AKT phosphorylation (). In addition, BNIP3L expression prevented insulin-stimulated glucose uptake, determined by 2NBDG fluorescence (). Collectively, our findings suggest that in addition to its role as a mitophagy receptor, BNIP3L regulates mitochondrial fission through its effects on ER/SR calcium, and is also a regulator of insulin signaling.
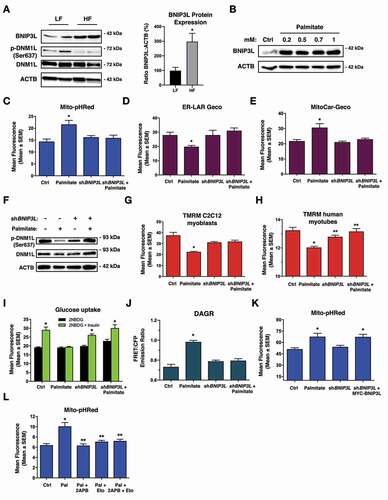
Next, we confirmed that BNIP3L expression is elevated in soleus muscle of rats fed a HF diet compared to those fed a LF diet, concurrent with decreased phosphorylation of DNM1L (). We also observed that SQSTM1 levels increased with HF feeding and LC3-II levels decreased, suggesting that autophagy in soleus muscle is inhibited by this diet (Figure S2B). Interestingly, other markers of mitophagy, such as BNIP3, BCL2L13, FUNDC1, and RHEB, were unchanged or modestly decreased in HF fed rodents, while FKBP8/Fkbp38 and PRKN were increased (Figure S2B). We also evaluated if PRKN activation could be downstream of BNIP3L induction, but BNIP3L expression failed to promote the mitochondrial localization of PRKN-YFP (Figure S2C). In culture, we used palmitate treatment to induce lipotoxicity and performed a dose-response in C2C12 cells. BNIP3L expression was increased by 0.2 mM palmitate and plateaued at higher concentrations (). Palmitate treatment also increased the number of GFP-LC3 puncta in C2C12 cells (Figure S1E). Furthermore, palmitate treatment increased Mito-pHRed fluorescence, which was inhibited by knock-down of BNIP3L (shBNIP3L) (). Knock-down of BNIP3L also prevented palmitate-induced ER/SR calcium release and mitochondrial calcium accumulation (), which were also blocked by 2APB treatment (Figure S2D,E). Furthermore, palmitate treatment decreased DNM1L phosphorylation at the PPP3CA regulated residue and led to mitochondrial fission, which were restored by shBNIP3L (, Figure S2F). In addition, BNIP3L knock-down prevented palmitate-induced mitochondrial depolarization in both C2C12 cells and iPSC-derived human myotubes (), and restored insulin-stimulated glucose uptake following palmitate exposure (). Using a diacylglycerol biosensor called DAGR [Citation37], we observed that palmitate treatment increased FRET emission, which was reversed by BNIP3L knock-down (), suggesting a connection between mitochondrial function and diacylglycerol accumulation. To test the specificity of shBNIP3L, we treated C2C12 myoblasts with palmitate and observed an increase in Mito-pHRed fluorescence, which was prevented when cells expressed shBNIP3L, but was restored by co-expression of a MYC-tagged BNIP3L (MYC-BNIP3L) (). Finally, we observed that palmitate-induced mitophagy was prevented by 2APB and with etomoxir, an inhibitor of mitochondrial fatty acid uptake through carnitine palmitoyltransferase-1 (), consistent with the notion that fatty acid-induced mitochondrial overload may be important trigger for mitophagy.
Figure 2. Knockdown of BNIP3L improves mitochondrial function and insulin sensitivity. (A) Western blot analysis of rat soleus muscle exposed to high fat (HF) or low fat (LF) diet for 12-weeks (left). Quantification of BNIP3L expression relative to actin (n = 4)(right). (B) C2C12 myoblast cells were treated overnight with increasing doses of palmitate conjugated to 2% albumin in low-glucose media. Protein extracts were analyzed as indicated. (C) C2C12 myoblast cells were transfected with Mito-pHRed, shBNIP3L, or a scrambled control shRNA. Cells were treated overnight with palmitate (200 µM). (D) Quantification of C2C12 myoblasts transfected with ER-LAR-GECO and treated as in (C). (E) Quantification of C2C12 myoblast cells transfected with Mito-CAR-GECO and treated as in (C). (F) C2C12 myoblast cells were transfected with shBNIP3L or a scrambled control shRNA, followed by palmitate treatment as described in (C). Protein extracts were analyzed as indicated. (G) C2C12 myoblast and (H) human myotube cells were transfected with shBNIP3L or a control shRNA. Cells were treated overnight with palmitate as in (C), stained for TMRM and quantified. (I) L6 myotubes were transfected with shBNIP3L or a control shRNA. Cells were treated overnight with palmitate as in (C). Insulin stimulated glucose uptake (10 nM) was determined by 2NBDG fluorescence and quantified. (J) C2C12 myoblast cells as transfected as in (H), along with DAGR, a diacylglycerol biosensor. Cells were analyzed by using the emission ratio of YFP:CFP (FRET Ratio). (K) Quantification of C2C12 myoblast cells transfected as in (H), along with MYC-BNIP3L and treated as in (C). (L) C2C12 cells were transfected with Mito-pHRed. Cells were pre-treated overnight with etomoxir (100 µM) and palmitate, as described in (C), followed by co-treatment with 2APB (10 µM, 2 h) or DMSO as control vehicle and quantified. Data are represented as mean ± S.E.M. *P < 0.05 compared with control, while **P < 0.05 compared with treatment, determined by t-test, 1-way or 2-way ANOVA
Identification and characterization of a novel PRKA phosphorylation site in the transmembrane domain of BNIP3L
Next, we explored whether BNIP3L function was directly regulated by cellular signaling pathways to modulate mitophagy and insulin signaling. In silico analysis of the BNIP3L amino acid sequence identified a conserved PRKA consensus motif within the carboxy-terminus of the transmembrane domain (), which is Serine 212 (Ser212) in human BNIP3L. We engineered synthetic peptides spanning the BNIP3L transmembrane domain and subjected them to in vitro kinase reaction with the catalytic subunit of PRKA and analyzed peptides by ion trap mass spectrometry. In the absence of kinase, single ion monitoring (SIM) scans displayed a predominant peak at m/z of 857.28 (z = 2+)(). Following kinase incubation, this peak shifted by m/z of 40 (897.78, z = 2+), corresponding to the addition of a phosphate (PO3) to the peptide (Mass = 80.00 Da)(). However, when Ser212 was mutated to a neutral alanine (S212A) this m/z shift was eliminated (). Next, we analyzed the MS2 spectra produced by collision-induced dissociation (CID) of the precursor ion with m/z = 897.78 (z = 2+). CID of the phospho-peptide yielded a product-ion with m/z of 848.67 (delta = 49.11), consistent with the neutral loss of phosphorylation (98/2 = 49; ). We also evaluated if our BNIP3L peptide could be phosphorylated at more than one site; however, we did not detect an m/z shift equivalent to 160 Da (). We modeled the BNIP3L structure using the Phyre2 engine (). Using known 3D motifs, Phyre2 predicted that Ser212 was exposed within the transmembrane domain, and likely well-positioned for kinase recognition.
Figure 3. PRKA phosphorylates BNIP3L at Ser212. (A) Amino acid sequence alignment for human, mouse and rat BNIP3L. (B) Schematic BNIP3L transmembrane domain and the location of Ser212. (C) SIM scan of the wild-type peptide spanning the PRKA site of BNIP3L. The unphosphorylated peptide has 857.28 m/z (z = 2+). (D) Putative phosphorylation showing an increased m/z of 40 that corresponds to PO3 (M = 80.00 Da). (E) SIM scan of mutated peptide (S212A) incubated with kinase, as in (D). (F) MS2 spectra following collision-induced dissociation of the precursor ion in (D, m/z = 897.78). A neutral loss of 49 m/z confirms phosphorylation. (G) SIM scanning showing BNIP3L peptide is not phosphorylated at two residues within the peptide. (H) BNIP3L structure modeled using Phyre2 engine. (I) 3T3 cells were transfected with wild type BNIP3L or a BNIP3L mutant where Ser212 is converted to alanine (S212A) and treated with 10 μM forskolin for 2 h. Protein extracts were immunoblotted, as indicated. (J) C2C12 myoblast cells were treated with 10 μM cilomilast or vehicle for multiple time points. Protein extracts were immunoblotted, as indicated. (K) p-BNIP3L is decreased as total BNIP3L increases in soleus muscle of rodents treated with high fat (HF) or low fat (LF) diet for 12-weeks. *predicted molecular weight, **predicted dimer weight, #aligned with total BNIP3L
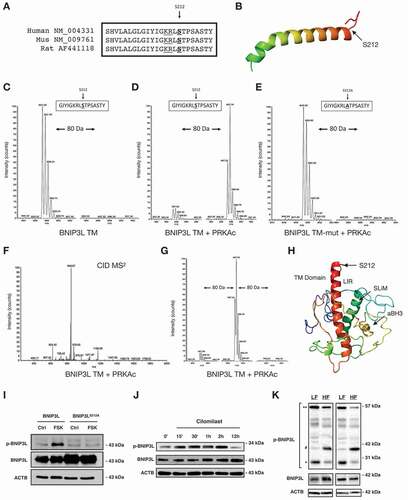
Next, we used a custom antibody designed to specifically detect phosphorylated Ser212 of BNIP3L (p-BNIP3L). Following treatment of C2C12 cells with forskolin (FSK) or a cAMP analog, we detected a band that aligned with transfected MYC-tagged BNIP3L, which migrates slightly above the 43-kDa molecular mass marker ( and Figure S3A). However, when Ser212 was mutated to a neutral alanine, this band was lost (). While investigating the endogenous expression of p-BNIP3L, we observed a notable cell-type specific pattern by western blot. BNIP3L has a predicted molecular weight of 26-kDa, but has been observed to migrate on SDS-PAGE as a 40-kDa monomer, and an 80-kDa dimer [Citation30,Citation38,Citation39]. In both C2C12 and L6 myoblasts, the dominant p-BNIP3L band migrated close to the predicted weight of BNIP3L (Figure S3B-D). This band was also sensitive to H89 treatment and was substantially reduced in cells expressing an shRNA targeting BNIP3L (Figure S3C,D). However, in the human rhabdomyosarcomal cell lines (RH30 and A204), the p-BNIP3L antibody detected multiple bands spanning 40–80-kDa, while in human iPSC-derived myoblasts the dominant band migrated at the predicted dimer weight (Figure S3B). These observations suggest that BNIP3L is likely exposed to other post-translational modifications, and that these modifications occur in a cell-type or species-specific manner. Next, we performed a series of time-courses experiments with pharmacological agents known to activate PRKA signaling in muscle. We used the adrenergic agonist clenbuterol and the PDE4 (phosphodiesterase 4) inhibitor (PDE4i) cilomilast. Both of these agents increased p-BNIP3L expression peaking at 2 h and returning to control levels by 12–18 h ( and Figure S3E), and we confirmed they activated PRKA in C2C12 myoblasts (Figure S4A,B). In addition, expression of PRKA and treatment of C2C12 cells with clenbuterol prevented BNIP3L-induced mitochondrial depolarization (Figure S4C). Lastly, we probed soleus muscle extracts from rodents fed a LF or HF diet. In rodent muscle we observed three dominant p-BNIP3L bands; a predicted 26-kDa, a 52-kDa dimer band, and a 40-kDa band that aligned with monomeric BNIP3L. The 40-kDa band is likely more detectable in muscle tissue as total BNIP3L expression is much greater in muscle tissue compared to C2C12 and L6 myoblasts. In addition, we observed that the 26-kDa band and the dimer band were reduced with HF feeding (), while the 40-kDa band more closely followed monomeric BNIP3L expression. Based on the positioning of the phospho-residue within the transmembrane domain of BNIP3L, we hypothesized that Ser212 is an inhibitory phosphorylation site.
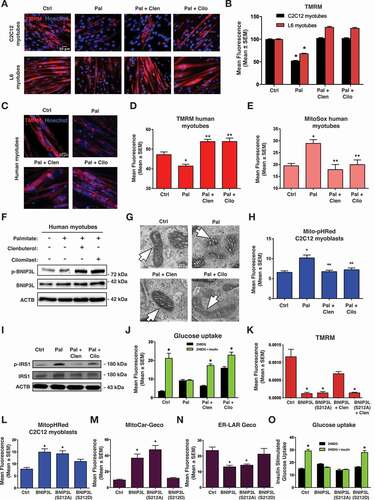
Next, we performed a series of experiments to evaluate if clenbuterol and cilomilast could inhibit palmitate-induced mitochondrial defects. In both C2C12 and L6 myotubes, clenbuterol and cilomilast reversed palmitate-induced mitochondrial depolarization (). We also evaluated human iPSC-derived myotubes and observed similar rescue of TMRM and mitoSOX staining with clenbuterol and cilomilast treatment (). In addition, we confirmed that clenbuterol and cilomilast increase p-BNIP3L expression in human myotubes (). Clenbuterol and cilomilast also prevented palmitate-induced alterations in mitochondrial morphology, mitophagy, insulin signaling, and insulin-stimulated glucose uptake (). Using TMRM as an indicator of BNIP3L activity, we observed that clenbuterol reversed BNIP3L-induced mitochondrial depolarization, but not when Ser212 was mutated to alanine (BNIP3LS212A; ). In addition, we generated a Ser212 phospho-mimetic mutation (S212D) and compared the effects of this construct to wild-type BNIP3L and the BNIP3LS212A mutant. When transfected into C2C12 cells, wild-type BNIP3L and BNIP3LS212A induced mitophagy, increased mitochondrial calcium, reduced ER/SR calcium, and inhibited insulin-stimulated glucose uptake (). However, the BNIP3LS212D mutant did not significantly impact these end-points. Collectively, these findings suggest that clenbuterol and cilomilast treatment leads to PRKA -induced phosphorylation of BNIP3L at Ser212, and this phosphorylation site is inhibitory and can modulate BNIP3L-induced mitophagy, calcium homeostasis, and impaired glucose uptake.
Figure 4. Clenbuterol and cilomilast inhibit palmitate-induced mitochondrial defects. (A) 5-day differentiated C2C12 myotubes and L6 myotubes were treated overnight with palmitate (200 µM) conjugated to 2% albumin in low glucose media. Control cells were treated with 2% albumin alone. Myotubes were treated with clenbuterol (500 nM, 2 h), cilomilast (10 μM, 2 h) or DMSO control vehicle and stained with TMRM (red) and Hoechst (blue) and imaged by standard fluorescence microscopy. (B) Quantification of (A). (C) 7-day differentiated human myotubes were treated and stained as in (A). (D) Quantification of (C). (E) 7-day differentiated human myotubes were stained with MitoSOX and quantified. (F) 7-day differentiated human myotubes were treated as in (A). Protein extracts were immunoblotted, as indicated. (G) C2C12 myoblast cells were treated as in (A) and imaged via electron microscopy. Mitochondria are indicated by arrows. (H) C2C12 myoblasts were transfected with Mito-pHRed and treated as in (A). (I) L6 myotube were treated as in (A) and protein extracts were immunoblotted, as indicated. (J) Insulin stimulated glucose uptake (10 nM) was determined by 2NBDG fluorescence in treated L6 myotubes and quantified. (K) C2C12 myoblast cells were transfected with BNIP3L wild type and BNIP3LS212A followed by clenbuterol treatment (500 nM, 2 h). Cells were stained with TMRM and imaged by standard fluorescence microscopy. (L-N) C2C12 myoblasts cells were transfected with BNIP3L, BNIP3LS212A, or BNIP3LS212D with Mito-pHRed (L), Mito-Car-Geco (M), and ER-Lar-Geco (N). (O) L6 myotubes cells were transfected with BNIP3L, BNIP3LS212A, or BNIP3LS212D. Insulin stimulated uptake (10 nM) was determined by 2NBDG fluorescence and quantified. Data are represented as mean ± S.E.M. *P < 0.05 compared with control, while **P < 0.05 compared with treatment, determined by 1-way or 2-way ANOVA
YWHAB/14-3-3β regulates the subcellular localization and function of BNIP3L
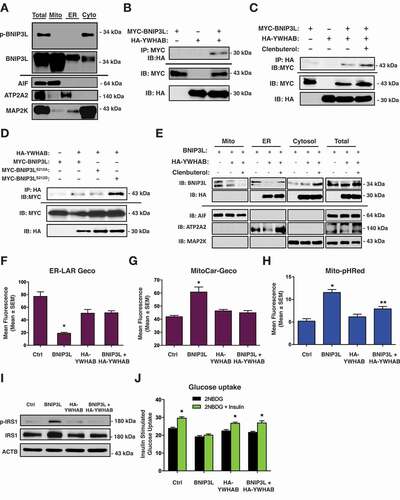
To determine how PRKA phosphorylation of Ser212 leads to inhibition of BNIP3L-induced mitophagy and impaired insulin signaling, we undertook cell fractionation experiments to determine the cellular localization of p-BNIP3L. Although the majority of BNIP3L localized to the mitochondria and ER/SR in C2C12 myoblasts, p-BNIP3L was exclusively localized in the cytosolic fraction (). Moreover, our In silico analysis of BNIP3L predicted that Ser212 lies within a conserved interacting domain of the molecular chaperone family YWHA/14-3-3, which identify the sequence RSxpSxP (BNIP3L: KRLpSTP) and are commonly found within PRKA and CAMK2A/CaMK-II phospho-motifs. Thus, we evaluated whether YWHA proteins could translocate BNIP3L from the mitochondria and/or ER/SR upon PRKA phosphorylation. First, we performed co-immunoprecipitation of BNIP3L with YWHAB. We chose this YWHA family member as it has been shown to interact with other BCL2 proteins [Citation40–42], and YWHAB expression was altered in our gene expression screen of insulin resistant soleus muscle (not shown). We expressed MYC-tagged BNIP3L and HA-tagged YWHAB in 293 T cells. Shown in , we detected HA-YWHAB following immunoprecipitation with a MYC antibody. Furthermore, when transfected C2C12 cells were treated with clenbuterol prior to co-immunoprecipitation, the interaction between BNIP3L and YWHAB was enhanced (). In a complementary experiment, we expressed HA- YWHAB with either wild-type BNIP3L, BNIP3LS212A, or BNIP3LS212D and subjected extracts to co-immunoprecipitation. We observed that the interaction between BNIP3L and YWHAB was enhanced when Ser212 was mutated to aspartic acid (BNIP3LS212D)(). Next, we expressed BNIP3L with and without HA-YWHAB and treated with clenbuterol, and subjected extracts to sub-cellular fractionation. We observed that expression of HA-YWHAB and treatment with clenbuterol reduced the expression of BNIP3L in the mitochondrial and ER/SR fractions, with a corresponding increase in BNIP3L in the cytosolic fraction, and no change in total BNIP3L expression (). Finally, we evaluated if YWHAB could counteract the effects of BNIP3L on mitochondria and insulin signaling. Shown in , and G, co-expression of YWHAB with BNIP3L prevented ER/SR calcium release and mitochondrial calcium accumulation. In addition, YWHAB blocked BNIP3L-induced Mito-pHRed activation (), prevented BNIP3L-induced IRS1 phosphorylation (), and restored insulin-stimulated glucose uptake ().
Figure 5. P-BNIP3L interacts with YWHAB proteins to determine subcellular location. (A) C2C12 myoblasts were subjected to subcellular fractionation. Protein extracts were immunoblotted for p-BNIP3L and total BNIP3L, as indicated. (B) 293 T cells were transfected with MYC-BNIP3L or HA-YWHAB. Extracts were immunoprecipitated (IP) with a MYC antibody and immunoblotted (IB), as indicated. (C) C2C12 myoblasts were transfected as in (B) and treated with clenbuterol (500 nM, 2 h). Extracts were immunoprecipitated (IP) with HA antibody and immunoblotted (IB), as indicated. (D) C2C12 myoblasts were transfected with HA-YWHAB, MYC-BNIP3L, MYC-BNIP3LS212A or MYC-BNIP3LS212D. Extracts were immunoprecipitated (IP) with HA antibody and immunoblotted (IB), as indicated. (E) C2C12 myoblasts were transfected with either MYC-BNIP3L or HA-YWHAB, followed by clenbuterol treatment (500 nM, 2 h). Extracts were fractioned and protein extracts were immunoblotted, as indicated. (F) C2C12 myoblasts cells were transfected with BNIP3L wild type, HA-YWHAB, and ER-Lar-Geco. (G) C2C12 myoblasts cells were transfected with BNIP3L wild type, HA-YWHAB, and mitoCar-Geco. (H) C2C12 myoblasts cells were transfected with BNIP3L wild type, HA-YWHAB, and Mito-pHRed. (I-J) L6 myotubes were transfected with BNIP3L wild type, HA-YWHAB. Proteins were immunoblotted as indicated (I) and insulin stimulated glucose uptake (10 nM) was determined by 2NBDG fluorescence and quantified (J). Data are represented as mean ± S.E.M. *P < 0.05 compared with control, while **P < 0.05 compared with treatment, determined by 1-way or 2-way ANOVA
BNIP3L activates MTOR-RPS6KB, a negative regulator of insulin signaling
Previous studies have demonstrated that Ser1101 is phosphorylated by both novel PRKC isoforms and MTOR-RPS6KB to inhibit insulin signaling [Citation9,Citation10,Citation28]. Interestingly, both of these pathways are activated by lipid intermediates, diacylglycerols and phosphatidic acids, respectively, which were elevated in our metabolomics screen of insulin resistant muscle. To investigated how BNIP3L might activate MTOR-RPS6KB signaling, we expressed BNIP3L in C2C12 cells and evaluated activation of MTOR-RPS6KB by phosphorylation at Thr389 by phospho-specific antibody. BNIP3L expression increased MTOR-RPS6KB phosphorylation, which was prevented by treatment with the MTORC1 inhibitor rapamycin (). In addition, palmitate treatment increased MTOR-RPS6KB phosphorylation, which was attenuated in cells expressing shBNIP3L (). Furthermore, BNIP3L-induced MTOR-RPS6KB phosphorylation was inhibited by clenbuterol and cilomilast treatment (), and prevented by treatment with the mitochondrial fission inhibitor mdivi-1 (), collectively suggesting that BNIP3L is both necessary and sufficient to activate MTOR-RPS6KB phosphorylation in C2C12 cells.
Figure 6. BNIP3L-induced MTOR-RPS6KB activation. (A) C2C12 myoblast cells transfected with MYC-BNIP3L or an empty vector control. Cells were treated with Rapamycin (500 nM, 1 h) or DMSO as vehicle control. Proteins were immunoblotted as indicated. (B) C2C12 myoblast cells transfected with shBNIP3L, or a scramble control shRNA, and treated overnight with palmitate (200 µM) conjugated to 2% albumin in low-glucose media. Proteins were immunoblotted as indicated. (C) C2C12 myoblast cells were transfected as in (A), and were treated with clenbuterol (500 nM), cilomilast (10 μM) or vehicle for 2 h. Proteins were immunoblotted as indicated. (D) C2C12 myoblast cells were transfected as in (A). Cells were treated with mdivi-1 (20 µM) or vehicle for 1 h. Proteins were immunoblotted as indicated. (E) C2C12 myoblast cells were transfected as in (A) and treated with 1-butanol (1%) for 30 min. Proteins were immunoblotted as indicated. (F) C2C12 myoblast cells were transfected as in (A), followed by phosphatidic acid assay and quantification. (G) C2C12 myoblast cells were transfected as in (A), along with the diacylglycerol biosensor DAGR. Cells were treated overnight with palmitate and analyzed by FRET imaging. (H) C2C12 myoblast cells were transfected with MYC-BNIP3L, siRHEB, siPLD6. Proteins were immunoblotted as indicated. (I) C2C12 myoblast cells were transfected with MYC-BNIP3L, RHEB, MYC-BNIP3LS212D, MYC-BNIP3L-ΔTM, along with Mito-pHRed. Cells were imaged by standard fluorescence and quantified. Data are represented as mean ± S.E.M. *P < 0.05 compared with control, while **P < 0.05 compared with treatment, determined by 1-way or 2-way ANOVA
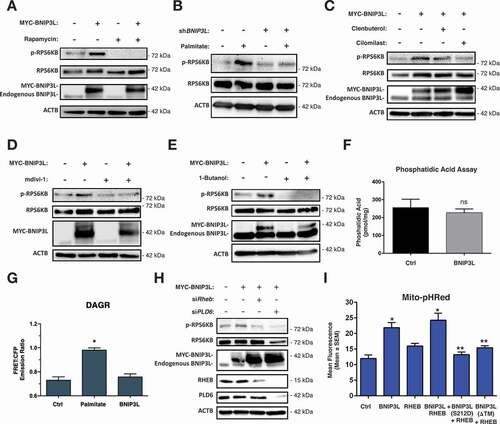
As phosphatidic acids have been implicated as important regulators of MTOR signaling in muscle, we used 1-butanol, a primary alcohol which inhibits phospholipase-D catalyzed phosphatidic acid production, in C2C12 cells expressing BNIP3L. Shown in , BNIP3L-induced MTOR-RPS6KB phosphorylation was completely prevented in the presence of 1-butanol. To determine if BNIP3L activates MTOR signaling by directly influencing phosphatidic acids production, we expressed BNIP3L in C2C12 cells and evaluated phosphatidic acids content using a commercially available assay. Interestingly, phosphatidic acid content remained unchanged in cells expressing BNIP3L (), as did diacylglycerol signaling (), suggesting that BNIP3L alone does not alter lipid intermediate accumulation in the absence of an ectopic lipid source.
The conversion of phosphatidylcholine into phosphatidic acid involves the enzymatic function of PLD1 (phospholipase D1), which has been shown to be an important regulator of MTOR activation [Citation27]. However, the mitochondrial-targeted PLD6 (phospholipase D family member 6) which converts cardiolipin to phosphatidic acid has been shown to modulate mitochondrial dynamics [Citation26]. Moreover, the activation of MTORC1 has been previously shown to be dependent upon lysosomal GTPases, such as RHEB, which can activate mitophagy in a BNIP3L-dependent manner [Citation43]. Thus, we knocked-down both PLD6 and RHEB and determined the effect on BNIP3L-induced MTOR-RPS6KB activation. Shown in , siRNAs targeting RHEB and PLD6 reduced BNIP3L-dependent phosphorylation of MTOR-RPS6KB. In addition, knockdown of PLD6 also reduced the endogenous expression of both total MTOR-RPS6KB and RHEB, suggesting this phospholipase regulates multiple aspects of this pathway. Next, we expressed both BNIP3L and RHEB and observed Mito-pHRed activation (). The addition of RHEB to BNIP3L enhanced Mito-pHRed fluorescence; however, when Ser212 of BNIP3L was mutated to a phospho-mimetic aspartic acid (S212D) or the mitochondrial-targeting transmembrane domain of BNIP3L was deleted (ΔTM), Mito-pHRed fluorescence was returned to control levels. Collectively, these findings suggest that BNIP3L can modulate RHEB-dependent activation of MTOR-RPS6KB, and this pathway has substantial crosstalk with PLD6-dependent production of phosphatidic acid.
Discussion
Mitochondrial dysfunction has been implicated in insulin resistance and diabetic complications in numerous cell types, although the precise nature of this defect, and consequences resulting from it, are not fully defined in muscle. Utilizing two independent myoblast cell lines, a rodent model, and human iPSC-derived myotubes, we characterized a novel pathway initiated by lipotoxicity resulting in BNIP3L-induced mitochondrial fission, depolarization, mitophagy, and MTOR-RPS6KB dependent desensitization of IRS1. Interestingly, we also observed crosstalk between phospholipid metabolism and BNIP3L-induced IRS1 inhibition, where phosphatidic acids are critical modulators of this pathway. Furthermore, this work identifies a novel PRKA phosphorylation site within the BNIP3L transmembrane domain that serves to translocate BNIP3L from both the mitochondria and ER/SR membranes and inhibit mitochondrial perturbations and MTOR-RPS6KB activation.
Previous work has identified that the calcium-calmodulin dependent phosphatase, PPP3CA, activates the mitochondrial fission initiator DNM1L [Citation35]. Furthermore, muscle-specific DNM1L deletion in mice results in changes in mitochondrial volume and altered mitochondrial calcium handling [Citation44]. In addition, we have previously demonstrated in cardiomyocytes that BNIP3L modulates ER/SR calcium to control mitochondrial permeability transition [Citation31]. We extend these findings in the present work and demonstrate that BNIP3L-induced ER/SR calcium release activates DNM1L and mitophagy. These observations suggest that in addition to its role as a mitophagy receptor, BNIP3L modulates mitochondrial turn-over through ER/SR localization and activation of mitochondrial fission. Moreover, in a lipotoxic environment, knockdown of BNIP3L prevents mitochondrial depolarization, mitophagy, DNM1L activation, and restores insulin-stimulated glucose uptake. However, in the present study, it was not possible to delineate which aspect of BNIP3L-induced mitochondrial dysfunction (i.e. Fission vs depolarization vs mitophagy) directly led to MTOR-RPS6KB activation. It is likely that other post-translational modifications of BNIP3L operate to distinguish mitochondrial depolarization from the induction of mitophagy. For example, previous studies have shown that BNIP3L can be phosphorylated at Serine 34 and 35 to enhance the interaction with LC3 proteins [Citation45]. However, additional evidence suggests that muscle-specific deletion of the mitophagy receptor Fundc1 protects against HF feeding induced insulin resistance [Citation46], suggesting that the mitophagy response may directly impact the sensitivity to insulin. Furthermore, BNIP3L and FUNDC1 cooperatively regulate mitophagy during cardiac progenitor differentiation [Citation47]. It is also interesting that the BNIP3L homolog BNIP3 is upregulated during myoblast differentiation to protect against oxidative stress, while BNIP3 and SQSTM1 are increased in muscle during starvation [Citation48]. Interestingly, we observed that following HF feeding BNIP3L expression was most highly induced in soleus muscle compared to other mitophagy receptors. Collectively, these findings suggest that mitophagy receptors may be induced in a stimulus-specific manner to control mitochondrial quality in muscle.
In this report, we provide detailed mass spectrometry analysis of BNIP3L and identify a novel PRKA phosphorylation site within the transmembrane domain. This phospho-acceptor residue serves to inhibit BNIP3L function by promoting the interaction with YWHAB and translocating BNIP3L away from the mitochondria and ER/SR. Using both adrenergic agonists and PDE4 inhibitors, we demonstrate that the function of BNIP3L can be pharmacologically manipulated to modulate myotube mitophagy and the response to insulin. These observations are consistent with previous work demonstrating the glucose lowering effects of the PDE4i roflumilast [Citation49] and suggest an additional peripheral mechanism of action of these agents.
One of the most intriguing observations of the present study is the crosstalk between BNIP3L, mitochondrial dynamics, phospholipid metabolism, and MTOR signaling. Phosphatidic acids are a direct activator for MTORC1 both in vitro and in cells [Citation50]. Phosphatidic acids bind directly to the FKBP12-rapamycin binding domain of MTOR, and compete with the inhibitor FKBP8 (i.e. FKBP38) to activate MTORC1 [Citation51]. The regulation of MTORC1 also involves recruitment to the lysosomal membranes and activation by small GTPases, such as RHEB, which also compete with FKBP8 [Citation52]. Interestingly, stimulation of mitochondrial oxidative phosphorylation results in BNIP3L-dependent recruitment of RHEB to the mitochondria and selective mitochondrial autophagy [Citation43,Citation53]. Our findings suggest crosstalk between these complex signaling pathways operates during myocyte lipotoxicity, and identifies BNIP3L as a regulator of MTOR-RPS6KB through RHEB, but contingent on the availability of phosphatidic acids. This notion is consistent with our metabolomics screen, that identified reduced muscle cardiolipin and increased phosphatidic acids content, while our mechanistic cell culture data demonstrate that knockdown of the mitochondrial PLD6 prevents BNIP3L induced MTOR-RPS6KB activation. While the precise relationship between lipotoxicy-induced mitochondrial overload and the regulation of mitochondrial dynamics by phospholipids requires further investigation to more fully define, the activation of MTOR-RPS6KB and the phosphorylation of IRS1 at Ser-1101 during lipotoxicity suggests an important mechanism linking mitochondrial dysfunction to impaired insulin-stimulated glucose uptake. These observations are consistent with a model whereby BNIP3L responds to lipid-induced mitochondria overload and protects the myocyte against nutrient storage stress by activating MTOR-RPS6KB and IRS1 phosphorylation. However, this model requires further validation using in vivo models, particularly in the context of the heterogenous nature of skeletal muscle fibers.
In summary, these studies document a novel signaling cascade triggered by lipotoxicity and converging on BNIP3L-dependent mitochondrial regulation leading to desensitization of insulin receptor signaling. Furthermore, PRKA activation downstream of adrenergic signaling inhibits BNIP3L function and restores insulin signaling, suggesting a mechanism by which exercise or pharmacological modulation of PRKA may overcome myocyte insulin resistance.
Materials and methods
Plasmids
MYC-tagged BNIP3L (Myc-Nix), BNIP3L-CYB5 (Nix-CytoB5), BNIP3L-MaoB (Nix-MaoB), BNIP3L-ActA (Nix-ActA), BNIP3L-ΔTM (Nix-delta TM) plasmids (Addgene, 100,795, 100,756, 100,757, 100,758, and 100,755; deposited by Joseph Gordon) were described previously [Citation31]. The MYC-tagged BNIP3LS212A and BNIP3LS212D were generated using a Q5 site directed mutagenesis kit (New England Biolabs, E0554S). The lentiviral shBNIP3L (Addgene, 100,770; deposited by Joseph Gordon) was generated by ligating oligonucleotides containing the targeting sequence 5ʹ-CAGTTCCTGGGTGGAGCTA-3ʹ into pLKO.1-puro (Addgene, 8453; deposited by Bob Weinberg). The mitochondrial (CMV-mitoCAR-GECO1) and endoplasmic reticulum (CMV-ER-LAR-GECO1) targeted calcium biosensors were gifts from Robert Campbell (Addgene, 46,022 and 61,244; deposited by Robert Campbell) [Citation32,Citation33]. The shBNIP3L (17,469; deposited by Wafik El-Deiry) [Citation54], mEmerald-Mito-7 and mCherry-Mito-7 (54,160 and 55,102; deposited by Michael Davidson) [Citation55,Citation56], pPHT-PRKA (60,936; deposited by Anne Marie Quinn) [Citation57], DAGR (14,865; deposited by Alexandra Newton) [Citation37], GW1-Mito-pHRed (31,474; deposited by Gary Yellen) [Citation36] and pcDNA3-FLAG-RHEB (19,996; deposited by Fuyuhiko Tamanoi) [Citation58] plasmids were purchased from Addgene.
Cell culture and transfections
C2C12 (ATCC, CRL-1772) and L6 (ATCC, CRL-1458) cell lines were maintained in Dulbecco’s modified Eagle’s medium (DMEM; HyClone, SH3002201), containing penicillin- streptomycin (HyClone, SV30010), and 10% fetal bovine serum (HyClone, SH3039603) at 37°C and 5% CO2. All cells were transfected using JetPrime Polyplus reagent as per the manufacturer’s instructions (Polyplus, 114–15) [Citation30]. The RHEB (19,744) and the PLD6 (194,908) siRNA were purchased from Dharmacon, and the scrambled siRNA control (sc-37,007) and control lentivirus (sc-108,080) were purchased from Santa Cruz Biotechnology. C2C12 and L6 were differentiated by re-feeding confluent cells in 2% fetal bovine serum for to 2–5 days. Human skeletal myoblasts derived from induced pluripotent stem cells were obtained from Cellular Dynamics (iCell SKM-301-020-001-PT). iCell Skeletal Myoblasts were cultured in maintenance medium as per manufacture’s protocol and differentiated for 5–7 days. Palmitate (Sigma, P9767) was conjugated to 2% albumin (BSA; Sigma, A7030) in low-glucose media (DMEM; HyClone, SH3002101) and treatments were performed as described previously [Citation30]. Clenbuterol (C5423), cilomilast (SML0733), roflumilast (SML1099), 8-Br-cAMP (B7880), H89-dihydrochloride hydrate (B1427), 2-aminoethoxydipheny borate (2APB) (D9754), Mdivi-1 (MO199), etomoxir (E1905), rapamycin (553,210), and bafilomycin A1 (B1793) were purchased from Sigma. Butanol-1 (8399) and forskolin (BP25205) were purchased from Fisher Scientific.
Immunoblotting and immunoprecipitation
Protein samples were extracted using a RIPA lysis buffer system containing protease and phosphatase inhibitors (Santa Cruz, SC-24948A). Subcellular organelle fractionation was performed using a Mitochondrial Isolation Kit (Qiagen Qproteome, 37,612) and a Nuclear/Cytosolic Isolation Kit (Pierce, PI78833) [Citation59]. Protein determination was performed using a Bio-Rad protein assay kit (Bio-Rad, 5,000,006) and proteins were separated by reducing SDS-PAGE and transferred to a PVDF membrane (Roche, 03010040001) [Citation30,Citation31,Citation59–61]. Immunoblotting was carried out using the following antibodies for analysis: BNIP3L/Nix (Cell Signaling Technology [CST], 12,396), MYC-Tag (Cell Signaling Technology [CST], 2278), HA-Tag (Cell Signaling Technology [CST],3724), phospho-RPS6KB/p70 S6 Kinase Thr389 (Cell Signaling Technology [CST], 9205), RPS6KB/p70 S6 Kinase (Cell Signaling Technology [CST], 9202), phospho-IRS1 Ser-1101 (Cell Signaling Technology [CST], 2385), IRS1 (ProteinTech, 17,509-1-AP), AKT (ProteinTech, 60,203-2-Ig), phospho-AKT S473 (ProteinTech, 66,444-1-Ig), phospho-DNM1L/DRP1 Ser637 (Cell Signaling Technology [CST], 4867), DNM1L/DRP1-D6C7 (Cell Signaling Technology [CST],8570), RHEB E1G1R (Cell Signaling Technology [CST],13,879), PLD6 (Invitrogen, PA5-71,510), BCL2L13 (ProteinTech, 16,612-1-AP), PRKN/Parkin (PRK8; Cell Signaling Technology [CST], 4211), BNIP3 (Cell Signaling Technology [CST], 3769), FKBP8 (ThermoFisher, PA5-47,513), FUNDC1 (Aviva Systems Biology, ARP53280_P050), LC3B (Sigma, L7543), SQSTM1/p62 (Cell Signaling Technology [CST], 39,749), AIF (Cell Signaling Technology [CST], 5318), MAP2K/MEK (Cell Signaling Technology [CST], 8727), ATP2A2/SERCA2 (Cell Signaling Technology [CST], 9580), and ACTB/actin (Santa Cruz Biotechology, sc-1616). Antibody dilutions was made as per manufacture’s protocol. To detect the rodent phospho-BNIP3L/Nix, a custom rabbit polyclonal antibody was generated by Abgent using the following peptide sequence IGKRL(pS)TPSAS conjugated to adjuvant. Appropriate horseradish peroxidase-conjugated secondary antibody (Jackson ImmunoResearch Laboratories, 711–035-152) was used in a 1:5000 dilution in combination with chemiluminescence to visualize bands using film or a BioRad imager (Mississauga, ON, Canada). Image Lab Software offered by BioRad imager was used to ensure linear exposure.
Fluorescent staining
MitoSOX (Molecular Probes, M36008), MitoTracker Red CMXRos (Cell Signaling Technology, 9082), LysoTracker Red (Invitrogen, L7526), TMRM (Biotium, 70,017) and Hoechst 33,342 (Sigma, B2261) staining were described previously [Citation30,Citation31,Citation59,Citation62–64]. Insulin- (Sigma, I0516) stimulated glucose uptake assay was measured as previously described using the fluorescent D-glucose analog 2NBDG (Invitrogen, N13195) [Citation29]. Microscopy was performed on an Olympus IX70 inverted microscope (Toronto, ON, Canada) with QImaging Retiga SRV Fast 1394 camera (Surrey, BC, Canada) using NIS Elements AR 3.0 software (Nikon Instruments Inc., Melville, NY, USA), or a Zeiss Axiovert 200 inverted microscope fitted with a Calibri 7 LED Light Source and Axiocam 702 mono camera (Pleasanton, USA) [Citation30,Citation59]. Quantification, scale bars, background subtract, and processing were done on Fiji (ImageJ) and Zen 2.3 Pro software.
Transmission electron microscopy (TEM)
TEM imaging was performed according to a protocol described previously [Citation62–64]. Briefly, C2C12 cells myoblasts were seeded in 100-mm plates. Cells were collected using trypsin. Cells were centrifuged three times (1500 × g, 5 min) and then fixed (3% glutaraldehyde in 0.1 M Sorensen’s phosphate buffer [Na2HPO4, KH2PO4 in distilled water, pH 7.3]; Fisher Scientific, 7558–80-7, 7778–77-0 respectively) for 3 h at room temperature. Cells were treated with a post-fixation step using 1% osmium tetroxide in 0.1 M Sorensen’s phosphate buffer (pH 7.3) for 2 h at room temperature, followed by an alcohol dehydration series before embedding in Epon (EMbed 812; Electron Microscopy Sciences, 14,900). TEM was performed with a Philips CM10, at 80 kV, on ultra-thin sections (100 nM on 200 mesh grids; Electron Microscopy Sciences, G200CU). Cells were stained with uranyl acetate and counterstained with lead citrate.
Phosphatidic acid assay
To quantitatively measure phosphatidic acid (PA) in vitro, a PA assay kit was purchased from PicoProbe™ (BioVision, K748-100). Protein extractions and fluorometric analysis were performed as per manufacture’s protocol.
High-fat diet animal model
All procedures in this study were approved by the Animal Care Committee of the University of Manitoba, which adheres to the principles for biomedical research involving animals developed by the Council for International Organizations of Medical Sciences. Male Sprague-Dawley rats were weaned at 3 weeks of age and randomly assigned to a LF diet (10% fat; Research Diets, D12450B) or HF diet (45% fat; Research Diets, D12451), both containing sucrose, for 12 weeks, as previously described [Citation29,Citation65]. Metabolomics analysis was performed on a 1290 Infinity Agilent high-performance liquid chromatography (HPLC) system coupled to a 6538 UHD Agilent Accurate Q-TOF LC/MS equipped with a dual electrospray ionization source, as previously described [Citation29,Citation65]. PCR-based gene expression arrays were purchased from SA Biosciences (Qiagen).
In vitro kinase assay and phospho-peptide mapping
Synthetic peptides (GeneScript) were resuspended at a concentration of 1 mg/ml. These peptides were used as the substrate in a PRKA kinase assay kit (New England Biolabs, P6000S) according to the manufacturer’s instructions, with the exception that [32P]-ATP was replaced with fresh molecular biology grade ATP (SignalChem, A50-09). The Kemptide substrate (LRRASLG; Enzo Life Sciences, P-107) was used as a positive control in each assay. Before mass spectrometry analysis, kinase assays were prepared using C18 ZipTips (Millipore, ZTC18S096). Samples in 50% acetonitrile and 0.1% formic acid were introduced into a linear ion-trap mass spectrometer (LTQ XL; ThermoFisher, San Jose, CA, USA) via static nanoflow, using a glass capillary emitter (PicoTip; New Objective, Woburn, MA, USA), as described previously [Citation29].
Statistics
Data are presented as mean ± standard error of the mean (S.E.M.). Differences between groups in imaging experiments with only 2 conditions were analyzed using an unpaired t-tests, where * indicates P < 0.05 compared with control. Experiments with 4 or more conditions were analyzed using a 1-way ANOVA or 2-way ANOVA, with Tukey’s test for multiple comparison, where * indicates P < 0.05 compared with control, and ** indicates P < 0.05 compared with treatment. All statistical analysis were performed using GraphPad Prism 6 software.
Supplemental Material
Download Zip (3.5 MB)Acknowledgments
This work was support by the Natural Science and Engineering Research Council (NSERC) Canada, through Discovery Grants to JWG and ARW. Seed funding was provided by the Children’s Hospital Research Institute of Manitoba, the DREAM research theme, and the Manitoba Centre for Nursing and Health Research. V.W.D is supported by CIHR and is the Allen Rouse Basic Scientist of the Manitoba Medical Services Foundation. J.W.G., A.R.W., and V.W.D are members of the DEVOTION Research Cluster. Open access support was provided by the College of Nursing Endowment Fund, University of Manitoba. S.C.d.S.R. is supported by a University of Manitoba Graduate Studentship, J.T.F. is supported by an Alexander Graham Bell studentship from NSERC Canada, and M.D.M. and S.M.K. are supported by a studentship from the Children’s Hospital Foundation of Manitoba and Research Manitoba. We wish to thank Drs. Christine Doucette and Grant Hatch for helpful discussions on the manuscript.
Disclosure statement
No potential conflict of interest was reported by the authors.
Supplemental material
Supplemental data for this article can be accessed here.
Additional information
Funding
Related Research Data
References
- Gordon JW, Dolinsky VW, Mughal W, et al. Targeting skeletal muscle mitochondria to prevent type 2 diabetes in youth. Biochem Cell Biol. 2015;93:452–465.
- Hesselink MKC, Schrauwen-Hinderling V, Schrauwen P. Skeletal muscle mitochondria as a target to prevent or treat type 2 diabetes mellitus. Nat Rev Endocrinol. 2016;12:633–645.
- Samuel VT, Shulman GI. The pathogenesis of insulin resistance: integrating signaling pathways and substrate flux. J Clin Invest. 2016;126:12–22.
- Erion DM, Shulman GI. Diacylglycerol-mediated insulin resistance. Nat Med. 2010;16:400–402.
- Schenk S, Horowitz JF. Acute exercise increases triglyceride synthesis in skeletal muscle and prevents fatty acid-induced insulin resistance. J Clin Invest. 2007;117:1690–1698.
- Yang G, Badeanlou L, Bielawski J, et al. Central role of ceramide biosynthesis in body weight regulation, energy metabolism, and the metabolic syndrome. Am J Physiol Endocrinol Metab. 2009;297:E211–224.
- Yu C, Chen Y, Cline GW, et al. Mechanism by which fatty acids inhibit insulin activation of insulin receptor substrate-1 (IRS-1)-associated phosphatidylinositol 3-kinase activity in muscle. J Biol Chem. 2002;277:50230–50236.
- Itani SI, Ruderman NB, Schmieder F, et al. Lipid-induced insulin resistance in human muscle is associated with changes in diacylglycerol, protein kinase C, and IkappaB-alpha. Diabetes. 2002;51:2005–2011.
- Szendroedi J, Yoshimura T, Phielix E, et al. Role of diacylglycerol activation of PKCθ in lipid-induced muscle insulin resistance in humans. Proc Natl Acad Sci USA. 2014;111:9597–9602.
- Li Y, Soos TJ, Li X, et al. Protein kinase C Theta inhibits insulin signaling by phosphorylating IRS1 at Ser(1101). J Biol Chem. 2004;279:45304–45307.
- Saltiel AR. Insulin Resistance in the Defense against Obesity. Cell Metab. 2012;15:798–804.
- Mizushima N, Levine B. Autophagy in mammalian development and differentiation. Nat Cell Biol. 2010;12:823–830.
- Kroemer G, Mariño G, Levine B. Autophagy and the integrated stress response. Mol Cell. 2010;40:280–293.
- Feng Y, He D, Yao Z, et al. The machinery of macroautophagy. Cell Res. 2014;24:24–41.
- He C, Klionsky DJ. Regulation mechanisms and signaling pathways of autophagy. Annu Rev Genet. 2009;43:67–93.
- Mizushima N. A brief history of autophagy from cell biology to physiology and disease. Nat Cell Biol. 2018;20:521–527.
- He C, Bassik MC, Moresi V, et al. Exercise-induced BCL2-regulated autophagy is required for muscle glucose homeostasis. Nature. 2012;481:511–515.
- Villa E, Marchetti S, Ricci J-E. No Parkin zone: mitophagy without Parkin. Trends Cell Biol. 2018;28:882–895.
- Palikaras K, Lionaki E, Tavernarakis N. Mechanisms of mitophagy in cellular homeostasis, physiology and pathology. Nat Cell Biol. 2018;20:1013–1022.
- Liu L, Feng D, Chen G, et al. Mitochondrial outer-membrane protein FUNDC1 mediates hypoxia-induced mitophagy in mammalian cells. Nat Cell Biol. 2012;14:177–185.
- Wu W, Lin C, Wu K, et al. FUNDC1 regulates mitochondrial dynamics at the ER–mitochondrial contact site under hypoxic conditions. Embo J. 2016;35:1368–1384.
- Eisner V, Picard M, Hajnóczky G. Mitochondrial dynamics in adaptive and maladaptive cellular stress responses. Nat Cell Biol. 2018;20:755–765.
- Jheng H-F, Tsai P-J, Guo S-M, et al. Mitochondrial fission contributes to mitochondrial dysfunction and insulin resistance in skeletal muscle. Mol Cell Biol. 2012;32:309–319.
- Kameoka S, Adachi Y, Okamoto K, et al. Phosphatidic acid and cardiolipin coordinate mitochondrial dynamics. Trends Cell Biol. 2018;28:67–76.
- Adachi Y, Iijima M, Sesaki H. An unstructured loop that is critical for interactions of the stalk domain of Drp1 with saturated phosphatidic acid. Small GTPases. 2018;9:472–479.
- Adachi Y, Itoh K, Yamada T, et al. Coincident phosphatidic acid interaction restrains Drp1 in mitochondrial division. Mol Cell. 2016;63:1034–1043.
- Hornberger TA, Chu WK, Mak YW, et al. The role of phospholipase D and phosphatidic acid in the mechanical activation of mTOR signaling in skeletal muscle. Proc Natl Acad Sci USA. 2006;103:4741–4746.
- Tremblay F, Brûlé S, Hee US, et al. Identification of IRS-1 Ser-1101 as a target of S6K1 in nutrient- and obesity-induced insulin resistance. Proc Natl Acad Sci U S A. 2007;104:14056–14061.
- Wang EY, Biala AK, Gordon JW, et al. Autophagy in the heart: too much of a good thing? J Cardiovasc Pharmacol. 2012;60:110–117.
- Mughal W, Nguyen L, Pustylnik S, et al. A conserved MADS-box phosphorylation motif regulates differentiation and mitochondrial function in skeletal, cardiac, and smooth muscle cells. Cell Death Dis. 2015;6:e1944.
- Mughal W, Martens M, Field J, et al. Myocardin regulates mitochondrial calcium homeostasis and prevents permeability transition. Cell Death Differ. 2018;25:1732–1748.
- Wu J, Prole DL, Shen Y, et al. Red fluorescent genetically encoded Ca 2+indicators for use in mitochondria and endoplasmic reticulum. Biochem J. 2014;464:13–22.
- Wu J, Liu L, Matsuda T, et al. Improved orange and red Ca 2+indicators and photophysical considerations for optogenetic applications. ACS Chem Neurosci. 2013;4:963–972.
- Zhao Y, Araki S, Wu J, et al. An expanded palette of genetically encoded Ca2+ indicators. Science (New York, NY). 2011;333:1888–1891.
- Cribbs JT, Strack S. Reversible phosphorylation of Drp1 by cyclic AMP-dependent protein kinase and calcineurin regulates mitochondrial fission and cell death. EMBO Rep. 2007;8:939–944.
- Tantama M, Hung YP, Yellen G. Imaging intracellular pH in live cells with a genetically encoded red fluorescent protein sensor. J Am Chem Soc. 2011;133:10034–10037.
- Violin JD, Zhang J, Tsien RY, et al. A genetically encoded fluorescent reporter reveals oscillatory phosphorylation by protein kinase C. J Cell Biol. 2003;161:899–909.
- Chen G, Cizeau J, Vande Velde C, et al. Nix and Nip3 form a subfamily of pro-apoptotic mitochondrial proteins. J Biol Chem. 1999;274:7–10.
- Yussman MG, Toyokawa T, Odley A, et al. Mitochondrial death protein Nix is induced in cardiac hypertrophy and triggers apoptotic cardiomyopathy. Nat Med. 2002;8:725–730.
- Hsu SY, Kaipia A, Zhu L, et al. Interference of BAD (Bcl-xL/Bcl-2-associated death promoter)-induced apoptosis in mammalian cells by 14-3-3 isoforms and P11. Mol Endocrinol. 1997;11:1858–1867.
- Konishi Y, Lehtinen M, Donovan N, et al. Cdc2 phosphorylation of BAD links the cell cycle to the cell death machinery. Mol Cell. 2002;9:1005–1016.
- Zha J, Harada H, Yang E, et al. Serine phosphorylation of death agonist BAD in response to survival factor results in binding to 14-3-3 not BCL-XL. Cell. 1996;87:619–628.
- Melser S, Chatelain EH, Lavie J, et al. Rheb regulates mitophagy induced by mitochondrial energetic status. Cell Metab. 2013;17:719–730.
- Favaro G, Romanello V, Varanita T, et al. DRP1-mediated mitochondrial shape controls calcium homeostasis and muscle mass. Nat Commun. 2019;10:2576.
- Rogov VV, Suzuki H, Marinković M, et al. Phosphorylation of the mitochondrial autophagy receptor Nix enhances its interaction with LC3 proteins. Sci Rep. 2017;7:1131.
- Fu T, Xu Z, Liu L, et al. Mitophagy directs muscle-adipose crosstalk to alleviate dietary obesity. Cell Rep. 2018;23:1357–1372.
- Lampert MA, Orogo AM, Najor RH, et al. BNIP3L/NIX and FUNDC1-mediated mitophagy is required for mitochondrial network remodeling during cardiac progenitor cell differentiation. Autophagy. 2019;15:1182–1198.
- Bujak AL, Crane JD, Lally JS, et al. AMPK activation of muscle autophagy prevents fasting-induced hypoglycemia and myopathy during aging. Cell Metab. 2015;21:883–890.
- Vollert S, Kaessner N, Heuser A, et al. The glucose-lowering effects of the PDE4 inhibitors roflumilast and roflumilast-N-oxide in db/db mice. Diabetologia. 2012;55:2779–2788.
- Fang Y, Vilella-Bach M, Bachmann R, et al. Phosphatidic acid-mediated mitogenic activation of mTOR signaling. Science. 2001;294:1942–1945.
- Yoon M-S, Sun Y, Arauz E, et al. Phosphatidic acid activates mammalian target of rapamycin complex 1 (mTORC1) kinase by displacing FK506 binding protein 38 (FKBP38) and exerting an allosteric effect. J Biol Chem. 2011;286:29568–29574.
- Bai X, Ma D, Liu A, et al. Rheb activates mTOR by antagonizing its endogenous inhibitor, FKBP38. Science. 2007;318:977–980.
- Bhujabal Z, Birgisdottir ÅB, Sjøttem E, et al. FKBP8 recruits LC3A to mediate Parkin‐independent mitophagy. EMBO Rep. 2017;18:947–961.
- Fei P, Wang W, Kim S, et al. Bnip3L is induced by p53 under hypoxia, and its knockdown promotes tumor growth. Cancer Cell. 2004;6:597–609.
- Olenych SG, Claxton NS, Ottenberg GK, et al. The fluorescent protein color palette. Curr Protoc Cell Biol. 2007;Chapter 21:Unit21.5.
- Planchon TA, Gao L, Milkie DE, et al. Rapid three-dimensional isotropic imaging of living cells using Bessel beam plane illumination. Nat Methods. 2011;8:417–423.
- Ding Y, Li J, Enterina JR, et al. Ratiometric biosensors based on dimerization-dependent fluorescent protein exchange. Nat Methods. 2015;12:195–198.
- Urano J, Sato T, Matsuo T, et al. Point mutations in TOR confer Rheb-independent growth in fission yeast and nutrient-independent mammalian TOR signaling in mammalian cells. Proc Natl Acad Sci USA. 2007;104:3514–3519.
- Field JT, Martens MD, Mughal W, et al. Misoprostol regulates Bnip3 repression and alternative splicing to control cellular calcium homeostasis during hypoxic stress. Cell Death Discov. 2018;5:37.
- Pagiatakis C, Gordon JW, Ehyai S, et al. A novel RhoA/ROCK-CPI-17-MEF2C signaling pathway regulates vascular smooth muscle cell gene expression. J Biol Chem. 2012;287:8361–8370.
- Gordon JW, Pagiatakis C, Salma J, et al. Protein kinase A-regulated assembly of a MEF2middle dotHDAC4 repressor complex controls c-Jun expression in vascular smooth muscle cells. J Biol Chem. 2009;284:19027–19042.
- Alizadeh J, Zeki AA, Mirzaei N, et al. Mevalonate cascade inhibition by simvastatin induces the intrinsic apoptosis pathway via depletion of isoprenoids in tumor cells. Sci Rep. 2017;7:44841.
- Emami A, Shojaei S, da Silva Rosa SC, et al. Mechanisms of simvastatin myotoxicity: the role of autophagy flux inhibition. Eur J Pharmacol. 2019;862:172616.
- Moghadam AR, da Silva Rosa SC, Samiei E, et al. Autophagy modulates temozolomide-induced cell death in alveolar Rhabdomyosarcoma cells. Cell Death Discov. 2018;4:52.
- Pereira TJ, Fonseca MA, Campbell KE, et al. Maternal obesity characterized by gestational diabetes increases the susceptibility of rat offspring to hepatic steatosis via a disrupted liver metabolome. J Physiol. 2015;593:3181–3197.