
ABSTRACT
Cellular metabolism caters to the energy and metabolite needs of cells. Although the role of the terminal metabolic enzyme LDHB (lactate dehydrogenase B) in the glycolysis pathway has been widely studied in cancer cells, its role in viral infection is relatively unknown. In this study, we found that CSFV (classical swine fever virus) infection reduces pyruvate levels while promotes lactate release in pigs and in PK-15 cells. Moreover, using a yeast two-hybrid screening system, we identified LDHB as a novel interacting partner of CSFV non-structural protein NS3. These results were confirmed via co-immunoprecipitation, glutathione S-transferase and confocal assays. Furthermore, knockdown of LDHB via interfering RNA induced mitochondrial fission and mitophagy, as detected reduced mitochondrial mass. Upon inhibition of LDHB, expression of the mitophagy proteins TOMM20 and VDAC1 decreased and the ubiquitination of MFN2, a mitochondrial fusion mediator, was promoted. In addition, a sensitive dual fluorescence reporter (mito-mRFP-EGFP) was utilized to analyze the delivery of autophagosomes to lysosomes in LDHB inhibition cells. Furthermore, LDHB inhibition promoted NFKB signaling, which was regulated by mitophagy; meanwhile, infection with CSFV negated these NFKB anti-viral responses. Inhibition of LDHB also inhibited apoptosis, providing an environment conducive to persistent viral infection. Finally, we demonstrated that LDHB inhibition promoted CSFV growth via mitophagy, whereas its overexpression decreased CSFV replication. Our data revealed a novel mechanism through which LDHB, a metabolic enzyme, mediates CSFV infection, and provides new avenues for the development of anti-viral strategies.Abbreviations: 3-MA:3-methyladenine; CCCP:carbonyl cyanide 3-chlorophenylhydrazone; CCK-8:cell counting kit-8; CSFV:classical swine fever virus; DAPI:4′,6-diamidino-2-phenylindole; DMSO:dimethyl sulfoxide; EGFP:enhanced green fluorescent protein; FBS:fetal bovine serum; FITC:fluorescein isothiocyanate; GST:glutathione-S-transferase; HCV:hepatitis C virus; IFN:interferon; LDH:lactate dehydrogenase; MAP1LC3/LC3:microtubule associated protein 1 light chain 3; MFN2:mitofusin 2; MOI:multiplicity of infection; NFKB:nuclear factor kappa B subunit 1; NFKBIA:nuclear factor inhibitor alpha; NS3:nonstructural protein 3; NKIRAS2:NFKB inhibitor interacting Ras like 2; PRKN:parkin E3 ubiquitin protein ligase; PBS:phosphate-buffered saline; qRT-PCR:real-time quantitative reverse transcriptase polymerase chain reaction; RELA:RELA proto-oncogene, NF-kB subunit; shRNA: short hairpin RNA; siRNA: small interfering RNA; TCID50:50% tissue culture infectious doses; TEM:transmission electron microscopy; TNF:tumor necrosis factor; TOMM20:translocase of outer mitochondrial membrane 20; VDAC1:voltage dependent anion channel 1.
Introduction
CSFV (classical swine fever virus) is the etiological agent of CSF (classical swine fever) and causes hemorrhagic syndrome, high fever, and organ damage in piglets, leading to major economic losses for swine farms [Citation1–3]. CSFV belongs to the genus Pestivirus of the family Flaviviridae. It is a small, enveloped, single-stranded, positive-sense RNA virus with a 12.3-kb RNA genome containing a long open reading frame that encodes a polyprotein of 3898 amino acids [Citation4,Citation5]. The polyprotein could be cleaved by cellular and viral proteases to generate 12 separate mature proteins, including four structural proteins (C, Erns, E1, and E2) and eight non-structural proteins (Npro, p7, NS2, NS3, NS4A, NS4B, NS5A, and NS5B) [Citation6,Citation7], of which, NS2, NS3, and NS5A are believed to be essential for virus replication [Citation8,Citation9]. CSFV can infect a variety of cells, including dendritic cells and macrophages. Interestingly, no cytopathic effect is apparent in CSFV infection cells; rather, persistent infection causes host immune suppression [Citation10,Citation11]. Although extensive studies have been reported on the replication of CSFV [Citation12,Citation13], its pathogenesis remains unclear [Citation14,Citation15].
Human LDH (lactate dehydrogenase), consisting of two subunits, LDHA and LDHB, is a terminal enzyme that catalyzes the interconversion of pyruvate and lactate in the anaerobic glycolytic pathway, and is a key glycolytic enzyme [Citation16,Citation17]. Many studies have shown that LDHB plays an important role in the energy metabolism of tumor cells, meanwhile its upregulation is considered one of the hallmarks of cancer [Citation18]. In fact, in many cancer models, high expression of LDHB is a significant predictor of poor prognosis [Citation19,Citation20]. Macroautophagy/autophagy also plays important role in cancer cells, and Brisson et al. demonstrated that LDHB controls lysosome activity and autophagy in oxidative cancer cells and glycolytic cancer cells [Citation21]. Moreover, studies have shown that LDHB localizes to the mitochondria, while are double-membrane organelles involved in a variety of key cellular processes including ATP production, apoptosis, calcium homeostasis, cell proliferation, as well as nucleotide and lipid synthesis [Citation22,Citation23]. Several studies have also demonstrated that decreased glycolysis and lactic acid affect mitochondrial redox activity [Citation24–26], while M1 macrophage activity is primary impacted by glycolysis and the pentose phosphate pathway (PPP), whereas mitochondrial oxidative phosphorylation and tricarboxylic acid cycle capacities are decreased [Citation27]. However, according to our knowledge, limited studies have described the role that LDHB has in these metabolic changes.
Various extrinsic and intrinsic stimuli trigger mitochondrial fission and fusion and induce selective autophagy, also designated mitophagy [Citation28]. In mammalian cells, the occurrence of mitophagy is primarily mediated by the PINK1-PRKN pathway and the mitophagy receptors. During mitophagy, PRKN is recruited to the damaged mitochondria in a PINK1-dependent manner, where it promotes ubiquitination of mitochondrial outer membrane proteins such as MFN1 and MFN2 [Citation29]. Mitophagy, therefore, prevents the fusion of damaged mitochondria and healthy mitochondria, serves as the primary mechanism for mitochondrial quality control in eukaryotic cells, and is an important component of the mitochondrial stress response and mitochondrial homeostasis regulation. Many viruses, including HCV (hepatitis C), hepatitis B, and influenza can induce mitophagy, thereby inhibiting specific antiviral activity [Citation30–32]. Many viral proteins, such as HCV nonstructural protein 5A [Citation33], human parainfluenza virus type 3 M matrix protein [Citation34], and herpes simplex virus infected cell protein, regulate the release of IFN (interferon) by inducing mitophagy, thereby promoting the replication of the virus [Citation35]. Similarly, our previous studies confirmed that CSFV induces mitophagy as a means to inhibit apoptosis, effectively facilitating persistent viral infection [Citation36]. Further, glycolysis has been reported to serve as the primary energy source for mitochondrial metabolism in disease models such as tumors, liver diseases, and diabetes [Citation37]. Meanwhile, lactate participates in mitochondrial oxidative activity in cultured CHO cells and that LDHB localizes to the mitochondria [Citation25,Citation26]. We and other researchers have found that CSFV infection promoted lactate release and inhibits pyruvate release [Citation38,Citation39]. Based on these results, we hypothesized that LDHB may also elicit an effect on mitophagy.
NFKB is also a well-described key regulator of energy homeostasis as it increases glucose metabolism and induces aerobic glycolysis [Citation40,Citation41]. Meanwhile, recent evidence underlines the pivotal role of energy metabolism in the regulation of immunity. Hence, proper mitochondrial function not only provides required cellular energy but is also essential for, the establishment and maintenance of immune cell phenotypes and activities. Furthermore, since several proteins encoded by NFKB-target genes are involved in the activation of immune and inflammatory responses [Citation42], NFKB activation during viral infection can be interpreted as a host’s protective response to viral pathogens [Citation43]. Interestingly, CSFV replication in cells suppresses type I IFN-inducible antiviral activity and apoptosis by interfering with IFN production, thereby resulting in persistent survival of the virus in host cells in vitro [Citation11]. Moreover, NFKB is a critical transcription factor in various cancers that regulates genes associated with a variety of cellular functions such as cell survival, proliferation, angiogenesis, and cancer metastasis [Citation44,Citation45]. Therefore, although both LDHB and NFKB have been described as being involved in cancer progression [Citation46,Citation47], their co-regulation as well as their role in viral infection remains unclear.
Herein, we employed specific interfering RNA () to inhibit LDHB and found that it induced mitochondrial fission and mitophagy, which also inhibited the activation of NFKB signaling and apoptosis when co-infected with CSFV. Hence, this study successfully identified a novel regulatory mechanism through which LDHB contributes to CSFV persistent infection in host cells.
Table 1. shRNA and siRNA sequences of targeted genes used in this study
Results
CSFV infection affects lactate and pyruvate metabolism via LDHB
Our previous metabolomics studies showed that CSFV infection reprogramed the glycolytic pathways of PK-15 cells and 3D4/2 cells [Citation33]. To further investigate the effects of CSFV infection on lactate and pyruvate metabolism, we selected specific pathogen free Bana pigs and measured lactate and pyruvate levels in the plasma on days −2, 0, 2, 4, 6, and 8 after CSFV infection. We found that after infection with CSFV, the lactate content increased while the pyruvate content decreased (). In vitro, we infected PK-15 cells with CSFV at a multiplicity of infection (MOI) of 0.1 and measured lactate and pyruvate concentrations in the culture supernatant at 24 and 48 h. The results showed that CSFV-infected cells had higher lactate content and lower pyruvate content than uninfected cells (). To explore whether CSFV infection affects the metabolism of lactic acid and pyruvate through LDHB, we transfected LDHB interfering RNA 24 h prior to CSFV infection in PK-15 cells, and found that the concentration of pyruvate increased, but the concentration of lactic acid was not significantly changed at 48 h post-infection (hpi; ). These results showed that CSFV infection upregulated the metabolism of lactate and downregulated pyruvate both in vitro and in vivo, and CSFV infection affects lactate and pyruvate metabolism via LDHB in PK-15 cells.
Figure 1. CSFV infection affects the metabolism of lactic acid and pyruvic acid in pigs and PK-15 cells. (A and B) SPF Bana pigs infected with CSFV at different time points, and the blood was collected from veins. The plasma concentrations of lactic acid (A) and pyruvic acid (B) were measured by spectrophotometric assays. (C and D) PK-15 cells were infected with CSFV at a MOI of 0.1 and measured lactate (C) and pyruvate (D) concentrations by spectrophotometric assays in the culture supernatant at 24 and 48 h. (E and F) PK-15 cells were transfected with siLDHB prior infected with CSFV at a MOI of 0.1 and measured lactate (E) and pyruvate (F) concentrations by spectrophotometric assays in the culture supernatant at 24 and 48 h. All measurements were made in triplicates. Error bars indicate the mean (±SD) of 3 independent experiments. *, P < 0.05; **, P < 0.01; and ***, P < 0.001 (one-way ANOVA)
LDHB interacted with CSFV NS3 and decreased NS3 expression
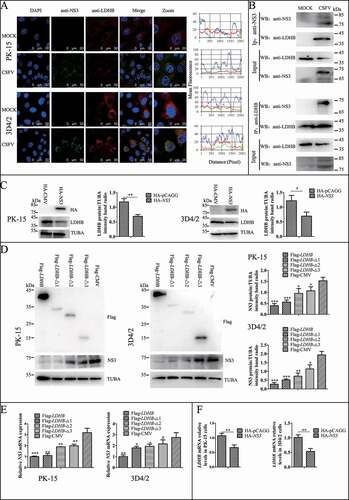
LDHB plays an important role in catalyzing the mutual conversion of lactate and pyruvate. In our previous study, we identified LDHB as one of specific binding partners of the CSFV protein NS3 by yeast two-hybrid screens, which plays a critical role in the replication cycle of CSFV ( and ). We also used the glutathione S-transferase (GST) affinity-isolation assays to confirm the interaction between NS3 and LDHB. Results showed that GST-LDHB but not GST alone interacted with NS3 (). To further confirm this interaction, co-IP experiments were performed with HEK293T cells and 3D4/2 cells transiently co-expressing 3xFlag-tagged LDHB and HA-tagged NS3. After co-IP with anti-HA and anti-3xFlag, respectively, 3xFlag-LDHB was found to form a complex with HA-NS3, but not with PCAGG-HA, and HA-NS3 associated with 3xFlag-LDHB but not with 3xFlag-CMV (). In addition, we used CSFV-NS3 antibody and LDHB antibody in CSFV infected or non-infected 3D4/2 cells for co-IP experiments, and found that there was an interaction between LDHB and NS3 in CSFV-infected cells (). To verify that LDHB and NS3 interact in vivo, we co-transfected p3xFlag-LDHB and pHA-NS3 in PK-15 and 3D4/2 cells; or used CSFV-NS3 antibody and LDHB antibody in CSFV-infected or non-infected PK-15 cells and 3D4/2 cells, confocal images showed that LDHB and NS3 colocalized in the cytoplasm (). Taken together, our data demonstrated that LDHB interacted with the NS3 protein of CSFV. To determine whether NS3 and LDHB effect each other’s mRNA expression in CSFV-infected PK-15 and 3D4/2 cells, we transfected the plasmid lacking the different domains of LDHB and the plasmid of HA-NS3 respectively. It was found that LDHB inhibited the expression of NS3, and NS3 also inhibited the expression of LDHB in CSFV-infected PK-15 and 3D4/2 cells ( to 3F).
Table 2. Primers used in this study
Table 3. Proteins that interact with NS3 by yeast two-hybrid
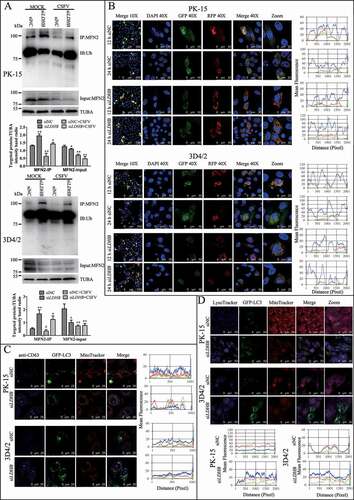
Figure 2. CSFV NS3 interacts with LDHB. (A) Reactivity of CSFV NS3 with LDHB protein in a yeast two-hybrid system. Yeast strain Y2H was co-transformed with a bait plasmid, BD-NS3, and a prey plasmid, pGADT7-LDHB (AD-LDHB), which encodes LDHB fused to the Gal4 activation domain. Co-transformation of BD-lambda/AD-T and BD-P53/AD-T was used as negative and positive controls, respectively. (B) GST affinity-isolation assay. The GST or GST-NS3 fusion proteins expressed in Escherichia coli BL21 (DE3) were purified with glutathione-Sepharose 4B resin and incubated with the lysate of HEK293T cells overexpressing the Flag-tagged LDHB. After washing with cold PBS, the bound proteins were subjected to 10% SDS-PAGE and western blotting using the anti-GST polyclonal antibody, the anti-Flag monoclonal antibody, the anti-LDHB antibody and anti-NS3 antibody. (C) Coimmunoprecipitation (co-IP) analysis of 3x Flag-tagged LDHB and HA-tagged NS3 by the anti-flag monoclonal antibody (mAb) or by the anti-HA mAb. HEK293T and 3D4/2 cells were co-transfected with the indicated plasmids (+) or empty vectors (-) for 48 h. The transfected cells were lysed and incubated with a mouse anti-Flag Mab or anti-HA mAb, followed by incubation with the protein G-Agarose for 6 h at 4°C. The immunoprecipitate was analyzed by western blotting using the anti-Flag and anti-HA. (D) Colocalization of NS3 protein with LDHB. PK-15 and 3D4/2 cells were co-transfected with 3x Flag-tagged LDHB and HA-tagged NS3. Cells were fixed at 48 h post-transfection and subjected to indirect immunofluorescence assay to detect HA-NS3 (red) and 3xFlag-LDHB (green) with mouse anti-Flag and rabbit anti-HA antibodies. The nucleus is indicated by DAPI (blue) staining in the merged image. Image-Pro Plus6.0 software was used to calculate the mean fluorescence intensity of the line profile of the colocalization image (3 times), the red and green curves showed consistent trends, indicating that the colocalization was resulted from the strong correlation between HA-NS3 and 3xFlag-LDHB
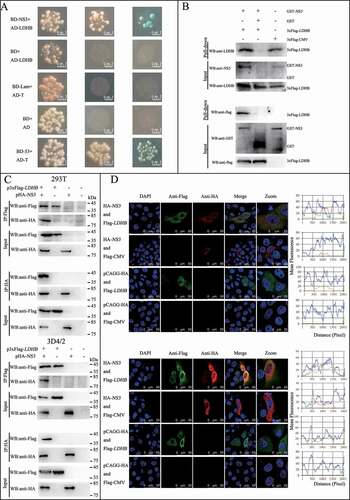
Figure 3. LDHB interacted with CSFV NS3 and decreased NS3 expression. (A) Colocalization of NS3 protein with LDHB. PK-15 and 3D4/2 cells were mock-infected or infected with CSFV (MOI = 0.1). Cells were fixed at 48 h post-transfection and subjected to indirect immunofluorescence assay to detect NS3 (green) and LDHB (red) with mouse anti-NS3 and rabbit anti-LDHB antibodies. The nucleus is indicated by DAPI (blue) staining in the merged image. Image-Pro Plus6.0 software was used to calculate the mean fluorescence intensity of the line profile of the colocalization image (3 times), the red and green curves showed consistent trends, indicating that the colocalization was resulted from the strong correlation between NS3 and LDHB. (B) CSFV-NS3 antibody and LDHB antibody were used in CSFV infected or non-infected 3D4/2 cells for co-IP experiments, operate as above (). (C) PK-15 and 3D4/2 cells were transduced with the HA-NS3 or pCAGG-HA for 24 h, followed by infected with CSFV at a MOI of 0.1. At 24 hpi, cell samples were analyzed by immunoblotting with antibodies against LDHB, HA and TUBA (loading control). The level of protein was quantified using Image-Pro Plus 6.0 software. Error bars indicate the mean (±SD) of 3 independent experiments. *, P < 0.05; **, P < 0.01; and ***, P < 0.001 (one-way ANOVA). (D) PK-15 and 3D4/2 cells were transduced with the p3xFlag-LDHB, p3xFlag-LDHB-Δ1, p3xFlag-LDHB-Δ2, p3xFlag-LDHB-Δ3 and p3xFlag-CMV for 24 h, followed by infected with CSFV at a MOI of 0.1. At 24 hpi, cell samples were analyzed by immunoblotting with antibodies against NS3, Flag and TUBA (loading control). The level of protein was quantified using Image-Pro Plus 6.0 software. Error bars indicate the mean (±SD) of 3 independent experiments. *, P < 0.05; **, P < 0.01; and ***, P < 0.001 (one-way ANOVA). (E) After transfected with targeted plasmid 24 hpi, the LDHB or NS3 mRNA expression in PK-15 and 3D4/2 cells were assessed using a real-time RT-PCR assay as described in Materials and Methods. Error bars indicate the mean (±SD) of 3 independent experiments. *, P < 0.05; **, P < 0.01; and ***, P < 0.001 (one-way ANOVA)
Inhibition of LDHB induced mitochondrial fission and mitophagy
Mitochondria provide energy for normal cell life activities, studies have found that LDHB is localized on the mitochondrial membrane. Our previous studies also found that mitophagy plays an important role in CSFV infection. Therefore, we want to explore whether LDHB affects CSFV by modulating the mitochondria. We used specific siRNA to inhibit LDHB and observed changes in mitochondrial morphology and length by TEM and laser confocal microscopy, the gold standards for studying microscopic morphology [Citation48]. TEM images showed elliptic mitochondria with a dramatic loss in mitochondrial cristae in LDHB-inhibited cells than control cells (). Notably, LDHB inhibition resulted in an increased number of mitochondria that were trapped by double or single membrane vesicles. Quantitative analysis also showed a significant increase in the quantity of autophagosome-like structures in LDHB-inhibited cells (). In contrast, a tubular mitochondrial morphology with typical cristae was observed in the mock group, and mitochondria engulfed by membrane vesicles were rarely found. Laser confocal microscopy images showed that the mitochondrial length became shorter and the division increased, upon labeling with the TOMM20 antibody, in LDHB-inhibited cells ().
Figure 4. LDHB inhibition induced mitochondrial fission and mitophagy. (A) Electron microscopy images revealed the mitochondrial ultrastructure in LDHB-inhibited cells. PK-15 and 3D4/2 cells were mock-inhibited (Left) or LDHB-inhibited (Right) for 48 h and analyzed by electron microscopy. In the zoomed images, typical elongated tubular mitochondria in mock-inhibited cells and fragmented elliptic mitochondria engulfed with membrane-like vesicles in LDHB-inhibited cells were observed. Scale bar: 5 μm. Quantification of the mitophagosome-like vesicles per cell image (mean ± SD; n ≥ 5 cells; ***P < 0.001) (one-way ANOVA). (B) Confocal microscopy images showing mitochondrial fragmentation in LDHB-inhibited cells. Cells were prepared as in (A). At 48 hpi, cells were immunostained with the TOMM20 antibody (red) and DAPI (blue). In the zoomed images, typical tubular mitochondria in mock-inhibited cells and fragmented mitochondria in LDHB-inhibited cells are shown. Image-Pro Plus6.0 software was used to calculate the mean fluorescence intensity of the line profile of the merge image (3 times). (C) Inhibition of LDHB induced autophagy as detected by the relative expression of the autophagy-associated proteins BECN1, MAP1LC3B, SQSTM1, and TUBA (loading control). The marker proteins TOMM20, VDAC1, and TUBA (loading control) of mitophagy in LDHB-inhibited cells were also detected by western blot. The level of protein was quantified using Image-Pro Plus 6.0 software. Error bars indicate the mean (±SD) of 3 independent experiments. *, P < 0.05; **, P < 0.01; and ***, P < 0.001 (one-way ANOVA). (D) The decline in mitochondrial mass was related to mitophagy. PK-15 cells were pretreated with 3-MA (5 mM) or DMSO (control) for 1.5 h, followed by transfection with siLDHB or siNC. At 24 hpi, cell samples were analyzed by immunoblotting with antibodies against TOMM20, VDAC1, and TUBA (loading control)
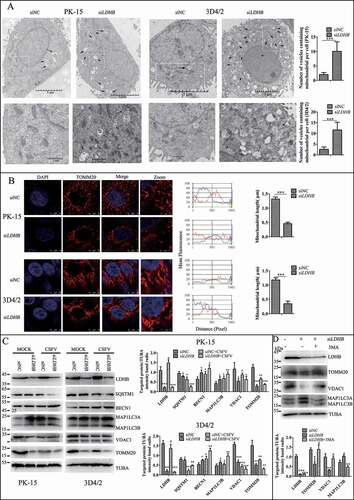
Mitophagy is usually related to a decline in mitochondrial mass, and analyzing the expression of mitochondrial proteins by western blotting is a common way to estimate mitochondrial mass. By detecting autophagy marker proteins MAP1LC3B, BECN1, and SQSTM1, we found that the inhibition of LDHB promoted autophagy; moreover, the detection of mitochondrial inner membrane proteins TOMM20 and VDAC1 revealed that mitophagy was significantly enhanced in LDHB-inhibited cells compared to that in control cells (). To validate that the decline in mitochondrial mass was related to mitophagy, we treated PK-15 cells with autophagic phagophore formation inhibitors 3-MA (3-methlyadenine). It was found that 3-MA inverted the degradation of mitochondrial proteins induced by siLDHB transfection (). Researchers have shown that MFN2 mediates mitochondrial fusion, and ubiquitination of MFN2 has been shown to be critical for initiating mitophagy. To detect the ubiquitination of MFN2 in PK-15 and 3D4/2 cells transfected with siLDHB, immunoprecipitation assay was performed. It was found that LDHB inhibition enhanced the ubiquitination of MFN2 ().
Figure 5. LDHB inhibition induced complete mitophagy. (A) The level of MFN2 ubiquitination in PK-15 and 3D4/2 cells that transfected with siNC or siLDHB and were mock-infected or infected with CSFV (MOI = 0.1) for 24 h. The immunoprecipitation (IP) of MFN2 was confirmed by immunoblotting with anti-MFN2 antibody. The ubiquitinated MFN2 was analyzed by immunoblotting with anti-Ub antibody. In addition, expression of MFN2 in PK-15 and 3D4/2 cells evaluated by immunoblotting was used as the input control. TUBA was used as an internal loading control. (B) PK-15 and 3D4/2 cells transiently expressing Mito-mRFP-EGFP were transfected with siNC or siLDHB for 24 h. In the zoomed images, fluorescence signals indicated the expression of mRFP and GFP protein targeting mitochondria: yellow color, no mitophagy; red color, mitophagy. Image-Pro Plus 6.0 software was used to measure the fluorescence intensity quantitative analysis. (C) PK-15 cells transiently expressing EGFP-LC3 protein were transfected with siNC or siLDHB for 24 h. After staining the mitochondria with MitoTracker (red), cells were immunostained with CD63 antibodies (blue). Image-Pro Plus 6.0 software was used to measure the fluorescence intensity quantitative analysis. (D) PK-15 and 3D4/2 cells transiently expressing EGFP-LC3 protein were transfected with siNC or siLDHB for 24 h. Cells were stained the mitochondria with MitoTracker (red) and the lysosome with LysoTracker (Blue). Image-Pro Plus6.0 software was used to calculate the mean fluorescence intensity of the line profile of the merge image (3 times)
The fusion of mitophagosomes with lysosomes is a typical characteristic of complete mitophagy, in which the mitochondria are degraded and recycled by lysosomes. To test whether LDHB inhibition caused the delivery of mitochondria to lysosomes during complete mitophagy, PK-15 and 3D4/2 cells were transfected with a tandem-tagged mRFP-EGFP plasmids encoding mitochondrial targeting signal sequences, which was based on the differential stabilities of mRFP and GFP in lysosomes to display mitophagy. As shown in , in contrast to siNC transfection cells displaying yellow fluorescence, PK-15 and 3D4/2 cells transfected with siLDHB displayed more red fluorescence, indicating the degradation of mitochondria by lysosomes. To confirm the formation of mitolysosomes in PK-15 and 3D4/2 cells transfected with siLDHB, CD63, a widely used marker for lysosomes, was merged with GFP-LC3 and mitochondria by using confocal microscopy. The images showed that mitochondria wrapped with GFP-LC3 puncta were associated with lysosomes in siLDHB-transfected cells (). These results demonstrated inhibition of LDHB induced mitochondrial fission and mitophagy.
The NFKB pathway and innate immune cytokines were downregulated in LDHB-inhibited cells upon CSFV infection
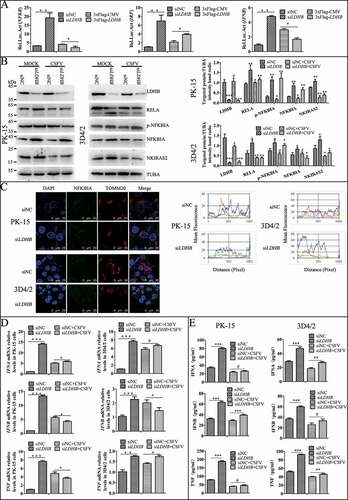
Studies have shown that innate immunity and NFKB signaling pathway play an important role in CSFV infection, therefore we want to determine whether siLDHB LDHB is related to the NFKB signaling pathway and the innate immunity, we used NFKB, IRF3, and IFNB dual luciferase reporter genes and found that LDHB inhibition significantly enhanced the transcriptional activity of NFKB, whereas the overexpression of LDHB significantly attenuated the relative fluorescence of NFKB (). Furthermore, we found that LDHB inhibition upregulated the NFKB signaling pathway proteins IKBIA, p-IKBIA, RELA, and NKIRAS2 (), and that the relative expression of congenital immune factors including IFNA, IFNB, and TNF were significantly increased (). These results suggested that LDHB inhibition had a positive effect on the NFKB signaling pathway. However, the activation of NFKB signaling by siLDHB disappeared and the expression of cytokines decreased when we infected the cells with CSFV at a MOI of 0.1 (). It was demonstrated that siLDHB promoted the activation of NFKB signaling pathway while CSFV infection inhibited activation of the NFKB signaling pathway, and whether CSFV infection inhibit activation of the NFKB signaling pathway via LDHB need be further verify.
Figure 6. NFKB pathway and cytokine were downregulated in the LDHB inhibited cells with CSFV infection. (A) Double luciferase reporter gene detected the relative expression of fluorescence in LDHB overexpression and inhibition cells. HEK293T cells co-transfected with p3xFlag-LDHB or pCMV-Flag with pIFNB-Fluc, pIRF-Fluc and pNFKB-Fluc for 24 h and were assayed for luciferase activity using the dual-luciferase reporter assay system (Promega, USA). (B) PK-15 and 3D4/2 cells were transfected with the siRNA of siLDHB or siNC for 24 h, then mock-infected or infected with CSFV (MOI = 0.1). Western blot was used to analysis the relative expression of proteins IKBIA, RELA, NKIRAS2, and TUBA (loading control). The level of protein was quantified using Image-Pro Plus 6.0 software. Error bars indicate the mean (±SD) of 3 independent experiments. *, P < 0.05; **, P < 0.01; and ***, P < 0.001 (one-way ANOVA). (C) Laser confocal detection of IKBIA expression and localization with TOMM20 in LDHB inhibited cells was descripted as B. Image-Pro Plus6.0 software was used to calculate the mean fluorescence intensity of the line profile of the merge image (3 times). (D) q-RT-PCR was used to detect the relative expression of cytokines IFNA, IFNB, and TNF as described in Materials and Methods. Error bars indicate the mean (±SD) of 3 independent experiments. *, P < 0.05; **, P < 0.01; and ***, P < 0.001 (one-way ANOVA). (E) ELISA was used to detect the relative expression of cytokines IFNA, IFNB, and TNF as described in Materials and Methods
LDHB inhibition promotes NFKB activation via mitophagy regulation
Since mitophagy plays an important role in the activation of NFKB signaling [Citation49], and we have shown LDHB inhibition induced mitophagy (), we next investigated whether the inhibitory effect of LDHB on NFKB signaling is regulated by mitophagy. To this end, we pretreated cells with DMSO or CCCP for 2 h, or transfected cells with an shRNA targeting PRKN, or non-targeting shRNA for 24 h. Cells were then transfected with LDHB siRNA. Results showed that shPARK2, which inhibited mitophagy, decreased NFKB signaling pathway proteins including RELA and p-IKBIA, while significantly attenuating the effect of LDHB on this pathway (). Alternatively, CCCP, which promoted mitophagy, activated the NFKB signaling pathway (). Furthermore, we found that CCCP promoted the release of IFNA, IFNB and TNF, while shPRKN had the opposite effect (). These results suggested that LDHB regulated NFKB signaling through the mitophagy pathway.
Figure 7. Mitophagy has an effect on the LDHB-mediated NFKB signaling pathway activation. (A) PK-15 and 3D4/2 cells were treated with DMSO or CCCP (10 uM) for 2 h, then mock-inhibited or inhibited with the siRNA of LDHB. Western blot analysis of the relative expression of the mitophagy mark proteins of TOMM20 and VDAC1, the NFKB signal pathway protein IKBIA, RELA, NKIRAS2, and TUBA was as a loading control. The level of protein was quantified using Image-Pro Plus 6.0 software. Error bars indicate the mean (±SD) of 3 independent experiments. *, P < 0.05; **, P < 0.01; and ***, P < 0.001 (one-way ANOVA). (B) PK-15 and 3D4/2 cells were transfected with shRNA of PRKN or non-targeting shRNA for 24 h, then mock-inhibited or inhibited with the siRNA of LDHB. Western blot analysis of the relative expression of PRKN protein to detect the effective knockdown of shPRKN, the expression of TOMM20 and VDAC1, the NFKB signal pathway protein IKBIA, RELA, NKIRAS2, the loading control protein TUBA were detected as in . (C) q-RT-PCR was used to detect the relative expression of cytokines IFNA, IFNB, and TNF as described in Materials and Methods. Error bars indicate the mean (±SD) of 3 independent experiments. *, P < 0.05; **, P < 0.01; and ***, P < 0.001 (one-way ANOVA)
LDHB inhibition suppresses apoptosis
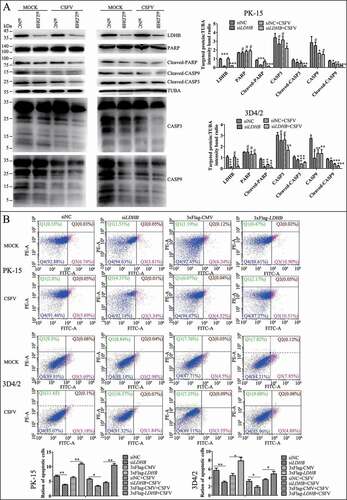
Apoptosis also be considered a defense mechanism against virus replication as it triggers cell death [Citation50]. Our previous studies found that CSFV induces mitochondrial fission and mitophagy to inhibit host cell apoptosis, thereby promoting persistent infection. Considering the relationship between LDHB and mitochondria, we next examined whether the inhibition of LDHB is related to apoptosis. After inhibiting LDHB, we examined both intrinsic and extrinsic apoptosis pathway proteins. Cleaved-PARP, CASP3, and CASP9 levels were reduced in LDHB-inhibited cells compared to control cells. Interestingly, apoptosis was further inhibited in CSFV-infected cells (). Moreover, apoptosis in LDHB-silenced or LDHB-overexpressing cells infected with CSFV was further confirmed by flow cytometry, which showed that CSFV infection clearly downregulated apoptosis in cells transfected with siLDHB (). Together, these results confirm that CSFV infection and siLDHB both prevented the apoptosis of cells, which may facilitate the persistent CSFV infection.
Figure 8. Inhibition of the expression of LDHB gene with target-specific siRNA inhibits apoptosis. (A) PK-15 and 3D4/2 cells were transfected with siNC or LDHB siRNA for 24 h, followed by mock infection and CSFV infection (MOI = 0.1). At 48 hpi, cells were analyzed by immunoblotting with antibodies against LDHB, PARP, cleaved-PARP, cleaved-CASP9, cleaved-CASP3, and TUBA (loading control). The level of protein was quantified using Image-Pro Plus 6.0 software. Error bars indicate the mean (±SD) of 3 independent experiments. *, P < 0.05; **, P < 0.01; and ***, P < 0.001 (one-way ANOVA). (B) PK-15 cells were transfected with siNC or LDHB siRNA for 24 h, followed by mock infection and CSFV infection (MOI = 0.1). At 48 hpi, the rates of apoptotic cells were analyzed by using flow cytometry (Q1: dead cell population that was ANXA5/annexin-V-negative and PI-positive. Q2: end-stage apoptotic or a necrotic cell population that was ANXA5-positive and PI-positive. Q3: early apoptotic cell population that was ANXA5-positive and PI-negative. Q4: cell population not undergoing apoptosis that was both ANXA5-negative and PI-negative). Error bars indicate the mean (±SD) of 3 independent experiments. *, P < 0.05; **, P < 0.01; and ***, P < 0.001 (one-way ANOVA)
Inhibition of LDHB promotes CSFV replication via mitophagy
In above results, we found that LDHB interacted with CSFV NS3, to further investigate the effects of LDHB on CSFV replication, specific siRNAs were used to target LDHB, resulting in the efficient knockdown of protein expression; moreover LDHB plasmids were transiently transfected into PK-15 and 3D4/2 cells, followed by CSFV infection at a MOI of 0.1. By western blot analysis of CSFV Npro protein expression, we found inhibition of LDHB promoted CSFV replication while overexpression of LDHB decreased CSFV replication (). At the same time, we examined CSFV mRNA and virus titer in the cell supernatant after 24 hours of CSFV infection. The results showed that knockdown of LDHB resulted in the upregulation of CSFV mRNA and virus titer in the supernatant, whereas overexpression of recombinant LDHB inhibited CSFV replication (). These results suggested that LDHB had a negative regulatory effect on CSFV replication. In order to further explore the mechanism of inhibiting LDHB by promoting CSFV replication, we treated PK-15 and 3D4/2 cells with mitophagy agonist CCCP, or mitophagy inhibitor interference plasmid shPRKN, and NFKB signaling pathway inhibitor BAY before transfecting siLDHB. After 24 h of CSFV infection, the viral gene copy and Npro protein expression were detected. It was found that CCCP and BAY cooperated with siLDHB to promote the replication of CSFV, while the interference plasmid shPRKN was the opposite (), suggesting that siLDHB promotes CSFV replication through the mitophagy pathway and the NFKB signaling pathway.
Figure 9. Inhibition of LDHB promotes CSFV replication via mitophagy. Overexpress or knockdown LDHB has the opposite effect on CSFV growth. PK-15 (A and C) and 3D4/2 (B and C) cells were transduced with the siNC or siLDHB (left), p3xflag-LDHB or p3xflag-CMV (right) for 24 h, followed by infected with CSFV at a MOI of 0.1 or mock-infected. (A and B) At 24 hpi, cell samples were analyzed by immunoblotting with antibodies against LDHB, CSFV Npro, Flag and TUBA (loading control). The level of protein was quantified using Image-Pro Plus 6.0 software. Error bars indicate the mean (±SD) of 3 independent experiments. *, P < 0.05; **, P < 0.01; and ***, P < 0.001 (one-way ANOVA). (C) At 24 hpi, the CSFV genome copy numbers in PK-15 and 3D4/2 cells were assessed using a real-time RT-PCR assay as described in Materials and Methods. CSFV virus titers in the supernatant were determined as 50% tissue culture infective doses (TCID50)/mL as described in Materials and Methods. Error bars indicate the mean (±SD) of 3 independent experiments. *, P < 0.05; **, P < 0.01; and ***, P < 0.001 (one-way ANOVA). (D) PK-15 and 3D4/2 cells were treated with CCCP, BAY or shPRKN before transfected with siLDHB, followed by infected with CSFV at a MOI of 0.1. At 24 hpi, cell samples were analyzed by immunoblotting with antibodies against CSFV Npro and TUBA (loading control). The level of protein was quantified using Image-Pro Plus 6.0 software. Error bars indicate the mean (±SD) of 3 independent experiments. *, P < 0.05; **, P < 0.01; and ***, P < 0.001 (one-way ANOVA). (E) PK-15 and 3D4/2 cells were treated as (D), At 24 hpi, the CSFV genome copy numbers in PK-15 and 3D4/2 cells were assessed using a real-time RT-PCR assay as described as (C)
Cell viability was not affected by RNA interference
To exclude the possibility that LDHB siRNA prompted CSFV replication, or that PRKN shRNA decreased NFKB signaling by reducing cell viability, we determined the effects of RNA interference on the viability of PK-15 cells. No significant changes in cell viability were observed following the knockdown of the LDHB or PRKN genes (P > 0.05; ).
Figure 10. The effect of RNA interference on cell viability. The cell viability of PK-15(A) cells and 3D4/2(B) cells transfected with scrambled or PRKN shRNA, siNC or siLDHB was analyzed using the CCK8 assay as described in Materials and Methods (mean ± SD; n = 3; NSP > 0.05)
Discussion
Viruses rely entirely on the host for their energy needs, including that required for replication and invasion, which consequently impacts, the host metabolism. In turn, changes in host metabolites also impact the reproduction and replicative capacity of the virus. In our previous studies, we reported that CSFV infection induces autophagy, which provides a dual advantage for the virus in that the virus in permitted to propagate in autophagosome-like vesicles to evade host immunity, while activation of autophagy effectively inhibits apoptosis, thereby facilitating persistent CSFV infection [Citation51,Citation52]. Viruses also exploit the energy and genetic material of the host cell for their reproduction and survival needs [Citation53]. Recently, many studies have revealed that metabolic intermediates serve as signaling molecules and play an important role in immune regulation [Citation54,Citation55]. In particular, the metabolic regulation of immune cells during health and disease has garnered increasing attention, as the active reconfiguration of immune cell metabolism enables these cells to maintain specific functions [Citation56,Citation57]. For instance, Mo et al. found that lactic acid downregulates viral microRNA and promotes the growth of Epstein-Barr virus in immortalized B lymphocytes [Citation58]. Moreover, we, as well as other groups, have found that CSFV infection can alter glycolysis in plasma and cells. In the current study, we found that lactic acid content in plasma was increased, while that of pyruvate decreased in CSFV-infected piglets ( and B). Similar results were obtained in CSFV-infected PK-15 cells ( and D). Since the metabolism of lactic acid and pyruvate in glycolysis is primarily catalyzed by LDH, we speculated that LDHB may have an effect on CSFV infection.
Many tumor cells undergo glycolysis under aerobic conditions, resulting in the production of large amounts of lactic acid, known as the “Warburg effect” [Citation59]. LDHB catalyzes the conversion of lactate and NAD+ to pyruvate, NADH, and H+, which is a key step in the glycolytic pathway. In recent years, the role of LDH in tumor research has attracted the attention of many researchers; however, its role in viral infections has not been clearly characterized. Here, we found that LDHB knockdown promotes CSFV growth, whereas its overexpression decreases CSFV replication (). Furthermore, it has been reported that various viral proteins interact with cellular proteins to evade immune responses. For example, the NS5B protein of HCV interacts with the host protein GBP1, which promotes HCV replication [Citation60]. Similarly, we found that LDHB interacts with the non-structural protein NS3 of CSFV ().
Lactic acid and pyruvate regulate the energy producing function of mitochondria [Citation61]. Additionally, in human hepatoma cells, inhibition of LDHB causes lactic acidosis, and downregulation of mitochondrial phosphorylation through the pyruvate dehydrogenase (PDH)-PDK (pyruvate dehydrogenase kinase) axis, thereby promoting liver cancer progression [Citation62]. Moreover, inhibition of LDHB enhances CLDN1 (claudin 1)-mediated hepatoma cell invasiveness via mitochondrial defects [Citation63]. It has also been reported that transgenic mice overexpressing LDHB in muscles showed enhanced mitochondrial enzyme activity and increased mitochondrial gene expression [Citation64]. Similarly, in HeLa cells and H460 cells, the LDHB inhibitor oxalate decreased respiration of isolated mitochondria incubated in lactic acid, and TEM showed that LDHB localizes to the mitochondria [Citation65]. Therefore, we explored the effects of LDHB on mitochondrial function. After inhibiting LDHB, electron microscopic observation revealed changes in the morphology and length of mitochondria (). Laser confocal microscopy also showed that mitochondrial division was increased following LDHB inhibition (). We also found that LDHB inhibition decreased the expression of mitochondrial membrane proteins TOMM20 and VDAC1, while promoting the ubiquitination of MFN2, suggested that inhibiting LDHB promoted mitophagy ().
Mitophagy plays an important role in a variety of disease models and cellular processes, including red blood cell differentiation, neurodegenerative lesions, inflammation and apoptosis, ischemia-reperfusion injury as well as metabolic-related diseases [Citation66,Citation67]. It has also been reported to contribute to the pathology of paralysis agitans, diabetes and kidney disease [Citation68–70]. Importantly, mitophagy is also linked to cellular antiviral responses [Citation71,Citation72]. It is worth noting that HCV and CSFV induce mitophagy to attenuate the IFN response. Herein, we also determined that the NFKB signaling pathway become activated when LDHB is inhibited via specific siRNA and that expression of the associated pathway proteins, RELA and IKBIA, are upregulated concomitant with a release in cytokines (). Considering that mitophagy is closely related to the immune response and NFKB signaling pathway, we hypothesized that the NFKB signaling pathway, which was inhibited by LDHB suppression, might be involved in mitophagy [Citation73,Citation74]. Moreover, there is ample evidence suggesting that mitophagy is closely related to the PINK1-PRKN pathway [Citation75,Citation76], and thus, we focused on the activation and inhibition of mitochondrial autophagy by CCCP and shPRKN plasmids, respectively. We found that mitophagy can regulate activation of the NFKB signaling pathway mediated by LDHB (). However, during CSFV infection, the activation of NFKB signaling by LDHB is suppressed (). It is unclear whether that CSFV infection can also cause mitophagy, and why CSFV cannot act on NFKB through mitophagy yet can inhibit activation of the NFKB pathway. Based with previous studies, we hypothesize that this may be caused by the NS5B and NS3 proteins of CSFV inhibiting NFKB signaling through interactions with specific host proteins during the proliferation process. Moreover, through long-term evolution, CSFV has adapted to host immunity and can mitigate the threat from the innate immune system, however, the specific regulatory mechanism underlying this effect requires further exploration.
Apoptosis is closely related to mitochondrial functions including mitochondrial fission, fusion, and trafficking [Citation77]. In a previous study, we reported that CSFV can induce mitophagy to inhibit apoptosis, thereby promoting viral replication. Moreover, inhibiting LDHB was found to induce mitophagy and promote viral replication, suggesting that LDHB might have a role in triggering apoptosis. To confirm this, we examined intracellular and extrinsic apoptosis factors after inhibiting LDHB and found that apoptosis was reduced (). Our results also showed that this decrease was more pronounced in cells infected with CSFV, suggested that the inhibition of LDHB decreased the occurrence of apoptosis.
In summary, we found that the metabolic enzyme LDHB was involved in host cell mitochondrial metabolism and the innate immune response through the NFKB signaling pathway. LDHB inhibition diminished the antiviral immune response and suppressed apoptosis, which promoted CSFV infection. Our results have, for the first time, revealed the mechanism through which CSFV replication is regulated by metabolic pathway enzymes, providing a theoretical basis for the prevention and control of this infection.
Materials and Methods
Cell culture
The swine kidney cell line PK-15 (ATCC, CCL-33) and HEK293T (ATCC, CRL-1573) cells were grown in Dulbecco’s modified Eagle’s medium (Thermo Fisher Scientific, 11995500) supplemented with 10% fetal bovine serum (Thermo Fisher Scientific, 10099), 3D4/2 (ATCC, CRL-2845) cells were maintained in complete RPMI 1640 medium (Thermo Fisher Scientific, 1175093) containing 10% FBS. Cells were cultured at 37°C in a 5% CO2 incubator.
Virus infection
The CSFV strain (Shimen) used in the study was propagated in PK-15 cells, and was isolated in our laboratory from a typical symptom of the swine. Viral titers are expressed as 50% tissue culture infective doses (TCID50)/0.1 mL based on PK-15 cell assays. For the comparison of viral replication in cells, virus infections were performed at a MOI of 0.5. For other experiments, viral stocks were prepared at a MOI of 1. PK-15 and 3D4/2 cells were infected at varying MOIs according to the requirements of different experiments. Mock infection comprised treatment with phosphate-buffered saline (PBS; Thermo Fisher Scientific, 10010023). After 1 h, the inoculum was removed by aspiration. The cells were then washed with PBS and cultured in complete medium at 37ºC for various times until harvesting.
Animal experiments
All procedures were conducted following regulations of the Laboratory Animal Ethics Committee of South China Agricultural University. Briefly, a total of five 2-month-old piglets, without porcine reproductive and respiratory syndrome, pseudorabies virus, porcine parvovirus infection, were challenged with 105 TCID50 of CSFV. Piglets were maintained with filtered air of positive pressure in a specific pathogen free animal facility. Before or after CSFV infection, the anterior vena cava blood of piglets was sterilely collected into heparin sodium anticoagulant tubes every other day. Then, the blood samples were centrifuged immediately and serum was harvested and used to measure the content of lactic acid and pyruvate.
Reagents and antibodies
The chemical reagents used in this study are as follows: dimethyl sulfoxide (DMSO; Sigma-Aldrich, V900090), BAY (Selleck Chemical, 11–7082, S2913), 3-methyladenine (3-MA; Sigma-Aldrich, M9281), and carbonyl cyanide 3-chlorophenylhydrazone (CCCP; Sigma-Aldrich, C2759). The primary antibodies used in this study were as follows: rabbit polyclonal anti-PRKN (Abnova, PAB0714), rabbit polyclonal anti-MAP1LC3B (Cell Signaling Technology, 2775), rabbit polyclonal anti-CASP3 (Abclonal, A2156), rabbit polyclonal anti-CASP9 (ThermoFisher Scientific, PA5-16358), rabbit polyclonal anti-MFN2 (Santa Cruz Biotechnology, sc-50331), goat polyclonal anti-VDAC1 (Santa Cruz Biotechnology, sc-32063), goat polyclonal anti-TOMM20 (Santa Cruz Biotechnology, sc-11021), rabbit polyclonal anti-SQSTM1 (Sigma-Aldrich, SAB2104334), mouse monoclonal anti-ubiquitin (Cell Signaling Technology, 3936), mouse monoclonal anti-CSFV E2 (Jai Balajee Trading Company, 9011), rabbit polyclonal anti-PARP (Beyotime, AP102), rabbit monoclonal anti-LDHB (Cloud Clone Corp, PAB698Hu01), mouse monoclonal anti-IKBIA (Cell Signaling Technology, 112B2), mouse monoclonal anti-NKIRAS2 (Santa Cruz Biotechnology, sc-374311), rabbit monoclonal anti-RELA (Santa Cruz Biotechnology, sc-AF1870), mouse monoclonal anti-GAPDH (Beyotime, AG019), mouse monoclonal anti-TUBA (Beyotime, AT819), mouse monoclonal anti-Flag (Sigma-Aldrich, F7425), rabbit monoclonal anti-HA (Earthox, E022050-1), normal rabbit IgG (Beyotime, A7016), and normal goat IgG (Beyotime, A7007). The secondary antibodies used for immunofluorescence were Alexa Fluor 350 goat anti-mouse IgG (Beyotime, A0412), Alexa Fluor 488 goat anti-mouse IgG (Beyotime, A0428), and Alexa Fluor 647 goat anti-rabbit IgG (Beyotime, A0468). The secondary antibodies used for immunoblotting analysis were HRP-conjugated goat anti-mouse IgG (Bioworld Technology, BS12478), HRP-conjugated goat anti-rabbit IgG (Bioworld Technology, BS13278), and HRP-conjugated rabbit anti-goat IgG (Bioworld Technology, BS30503). Mouse polyclonal anti-CSFV Npro and mouse polyclonal anti-CSFV NS3 was kindly provided by Dr. Xinglong Yu (Veterinary Department, Hunan Agricultural University, China).
DNA constructs and RNA interference
The full-length swine LDHB gene (GenBank, XM 013988347) and different truncated regions were amplified by PCR and cloned into the p3xFlag-CMV vector using EcoRI (Takara, 1040S) and KpnI (Takara, 1068A) to generate p3xFlag-LDHB (residues 1–1134), p3xFlag-LDHB-Δ1 (residues 201–1134), p3xFlag-LDHB-Δ2 (residues 1–714), p3xFlag-LDHB-Δ3 (residues 715–1134). The HA-NS3 plasmid, encoding the NS3 protein fused to an HA tag at its N-terminus, was constructed by cloning NS3 cDNA into the HA-CMV vector, using EcoRI and BglII (Takara, 1021A) restriction enzymes. The primers used for LDHB and NS3 genes are listed in . Specific shRNA targeting PRKN, along with the scrambled shRNA, were obtained from Cyagen. siRNAs against LDHB were synthesized by Sangon Biotech. shRNA and siRNA sequences are listed in . PK-15 or 3D4/2 cells were grown to 60% confluence in 6-well cell culture plates and were transfected with siRNAs and shRNAs using Lipofectamine® 3000 reagent (ThermoFisher, L3000015) according to the manufacturer’s instructions. Briefly, 1 μg of shRNA or 50 nM siRNA and 2 μL P3000 was diluted in 50 μL of serum-free OptiMEM (ThermoFisher Scientific, company, 22600050), and 3 μL Lipofectamine® 3000 was also diluted in 50 μL of serum-free OptiMEM. The dilutions were mixed thoroughly and incubated at 25°C for 15 min. The mixture was then pipetted into the OptiMEM and further cultured at 37°C for 24 h. Following CSFV infection, the cells were incubated in fresh medium at 37°C for 48 h. The protein targeted for knockdown was evaluated by western blotting.
Yeast two-hybrid screening
A Matchmaker two-hybrid system (Clontech, 63048) was used to screen host proteins that interact with NS3 from a cDNA library created from swine peripheral blood mononuclear cells. In brief, the bait construct pGBKT7-NS3 (BD-NS3) was transformed into the yeast strain Y2H and transformants were selected for growth on synthetic defined (SD) medium lacking His, Leu, Trp, and Ade (SD/-4) (Clontech, 630428). The colonies were then transferred to SD/-4 plates containing 5-bromo-4-chloro-3-indolyl β-D-galactopyranoside (X-Gal) and aureobasidin A (Aba) (SD/-4/X-Gal-Aba). Blue colonies were selected and cultured in SD/-4 medium and the yeast plasmids were extracted using a yeast plasmid kit (Omega, D3376) according to the manufacturer’s instructions. The target inserts were verified by sequencing using the Gal4 AD and 3ʹAD primers. To validate the interaction between NS3 and cellular proteins, the bait and prey plasmids were co-transformed into the Y2HGold yeast strain using a yeast transformation system 2 (Clontech, 630439). The interaction between murine p53 and SV40 large T-antigen was used as a positive control, and the human LMNA (lamin A/C) protein, which does not interact with the SV40 large T-antigen, was included as a negative control.
Co-immunoprecipitation (co-IP)
To further confirm the LDHB–NS3 interaction, HEK293T cells and 3D4/2 cells were transfected with 3xFlag-tagged LDHB and HA-tagged NS3 plasmids, harvested 48 h post-infection (pi), washed three times with cold PBS, and lysed with NP-40 buffer (Sigma-Aldrich, 127087–87-0) containing 1 mM phenylmethylsulfonyl fluoride (PMSF; Beyotime, ST506) for 1 h at 4°C. Clarified extracts were precleared with protein A/G beads (Santa Cruz Biotechnology, sc-2003) plus anti-Flag monoclonal antibody for 4 h, washed with NP-40 buffer, boiled in sample buffer, and subjected to sodium dodecyl sulfate polyacrylamide gel electrophoresis (SDS-PAGE). This was followed by immunoblot analysis with anti-Flag and anti-HA antibodies. Then, we used HA-NS3 as a bait to check whether 3xFlag-LDHB would bind. 3D4/2 cells mock-infected or infected with CSFV (MOI = 0.1), and the antibodies of mouse anti CSFV-NS3 and rabbit anti LDHB were used to confirm the LDHB–NS3 interaction and operate as above.
GST affinity-isolation assay
GST-tagged NS3 was expressed in Escherichia coli BL21 (DE3) cells and incubated with a glutathione-Sepharose 4B resin (GE Healthcare, 10049253). The resin was washed twice with PBS and incubated with lysates of HEK293T cells transfected with pCAGGS-based plasmids expressing Flag-tagged LDHB for 2 h at 4°C. The resin was then washed six times with PBS, and the bound proteins were subjected to SDS-PAGE and immunoblotting analysis.
Quantitative real-time RT-PCR (qPCR)
For targeted gene expression analysis, total RNA was prepared using a total RNA Kit I (Omega, R6834-01). Complementary DNA (cDNA) was synthesized using PrimeScript RT Master Mix (Takara, RR036A). Real-time qPCR was performed using SYBR Premix Ex Taq II (Takara, RR820A) using an iQ5 iCycler detection system (Bio-Rad, USA). Relative mRNA expression was assessed using the 2-ΔΔCt method and normalized to the housekeeping gene GAPDH. The primers used are described in . For CSFV genomic copies detection, viral RNA was extracted using a MiniBEST Viral RNA/DNA Extraction Kit Ver.5.0 (Takara, 9766) and reverse-transcribed using PrimeScript RT Master Mix (Perfect Real Time; Takara, RR036A). The resulting cDNA was then amplified using SYBR Premix Ex Taq (Tli RNaseH Plus; Takara, RR420B) and an iQ5 iCycler detection system (Bio-Rad, USA). Primer sequences targeting the CSFV NS5B gene were: CSFV1: 5ʹ-CCTGAGGACC AAACACATGTTG-3ʹ; CSFV2: 5ʹ-TGGTGGAAGTTGGTTGTGTCTG-3ʹ. Viral copy number was calculated using a standard curve from a recombinant plasmid containing the CSFV NS5B gene.
Immunoblotting
After treatment, cells were washed with cold PBS and incubated on ice with RIPA lysis buffer (Beyotime, P0013B) supplemented with 1 mM PMSF for 10 min. Cell lysates were then clarified by centrifugation at 15000 × g for 20 min at 4°C. The protein concentration was determined using a BCA protein assay kit (Beyotime, P0012). Equal amounts of protein samples (20 μg) were diluted in 5× SDS-PAGE loading buffer and boiled for 5 min. Proteins were separated by 12.5% SDS-PAGE and electrotransferred onto polyvinylidene fluoride (PVDF) membranes (Beyotime, FFP30). After blocking with PBS containing 2% nonfat milk powder and 0.05% Tween 20 (Sigma-Aldrich, P2287) for 2 h at 25°C, the membrane was incubated with specific primary antibodies overnight at 4°C and then with the corresponding HRP-conjugated secondary antibodies at 37°C for 2 h at appropriate dilutions. The protein bands were visualized using an ECL Plus kit (Beyotime, P0018). Images of protein blots were obtained from a CanoScan LiDE 100 scanner (Canon, Japan) and were measured with Image-Pro Plus 6.0 software. The densitometry results of the ratio of target proteins to TUBA. *P < 0.05; **P < 0.01, ***P < 0.01; #p > 0.05, n = 3. The band detection is within the linear range.
Immunoprecipitation
For immunoprecipitation of the ubiquitinated MFN2 in the whole cell lysates, cells were incubated on ice with IP lysis buffer (Beyotime, P0013) containing 1 mM PMSF for 10 min. The precipitates were removed by centrifugation at 14,000 × g for 10 min at 4°C. The supernatant was immunoprecipitated with the appropriate antibodies (anti-MFN2) and protein A + G Sepharose (7 sea biotech, P001-2). The immunoprecipitated proteins were then analyzed by western blotting with ubiquitin antibodies.
Confocal immunofluorescence microscopy
Cells were grown in 35-mm petri dishes (NEST, GBD-35-20) with a glass bottom. When needed, the indicated plasmid DNA (EGFP-LC3 or p-Mito-mRFP-EGFP) was transfected with siLDHB or no-target siRNA for analyzing the effect of siLDHB induced mitophagy was used for transfection. Mitochondria and lysosomes in live cells were stained with 100 mM MitoTracker CMXRos Red (Beyotime, C1049) and 50 nM Lyso-Tracker Blue (AAT Bioquest, 22642)for 30 min at 37°C. Cells were washed with PBS and fixed with 4% paraformaldehyde (Sigma-Aldrich, P6148) for 30 min at room temperature; they were then permeabilized with 0.2% triton X-100 (Sigma-Aldrich, T8787) for 10 min. The cells were blocked in PBS containing 5% bovine serum albumin (BSA; Beyotime, ST023) for 30 min. Next, the cells were stained with the indicated primary antibody of rabbit polyclonal antibody (anti-TOMM20 or anti-HA; 1: 400) and a mouse monoclonal antibody (anti-Flag or anti-IKBIA;1:200) in PBS buffer at 37°C, followed by a 1 h incubation in PBS containing goat anti-mouse and anti-rabbit secondary antibodies conjugated to FITC and TRITC at a dilution of 1:200. Wherever indicated, nuclei were stained with DAPI (Beyotime, C1002). The fluorescence signals were visualized with a TCS SP2 confocal fluorescence microscope (Leica TCS SP8).
Flow cytometric analysis
For the analysis of cell apoptosis, cultured cells were collected; after washing twice with PBS, the cells were dispersed by trypsin and collected by centrifuging the cell suspension at approximately 300 × g for 5 min. Apoptosis was detected using the Annexin-V-EGFP Apoptosis Detection Kit I (Vazyme Biotech, A212-01/02) according to the manufacturer’s instructions.
Electron microscopy
To detect the effect of inhibiting LDHB on mitochondria, after transfecting PK-15 and 3D4/2 cells grown in 10-cm dishes with siLDHB and siNC, they were washed twice with PBS and fixed with 2.5% glutaraldehyde diluted in PBS at 4°C for 30 min. The cells were then collected in 1.5-mL microcentrifuge tubes and further fixed overnight. Cell pellets were dehydrated with an acetone series and embedded in epoxy resin. Next, ultrathin sections were prepared and observed by JEM-2010 HR transmission electron microscopy (TEM; JEOL).
Lactate acid and pyruvate measurement
Lactate levels in cell supernatant and serum were assessed by spectrophotometric assays. In brief, 100 μL of cultured medium was mixed and incubated with 200 μL ice-cold 1 M perchloric acid (Sigma-Aldrich, 7601–90-3) on ice. After centrifugation at 4000 × g for 15 min, the supernatant was neutralized to pH 7.0 by adding the same volume of 0.7 M tripotassium phosphate solution (Sigma-Aldrich, 529567-M). The neutralized supernatant (10 μL) was applied to spectrophotometric lactate assays using a Thermo Max microplate reader (Molecular Devices, USA). Lactate levels were estimated from a standard lactate calibration curve prepared under the same conditions. The pyruvate levels in cell supernatant and serum were also assessed by spectrophotometric assays.
ELISA
Levels of IFNA, IFNB and TNF in the supernatant were detected using ELISA kits (USCNK, SEA033Po, SEA222Po and SEA133Po) following the manufacturer’s instructions. The samples were quantified using a microplate reader (Bio-Rad, USA).
CCK-8 assay
Cell viability was determined using Cell Counting Kit-8 (CCK-8, Beyotime, C0038) according to the manufacturer’s protocol. Briefly, approximately 1 × 10⁴ cells (PK-15 or 3D4/2) per well were seeded in 96-well culture plates and cultured for 24 h at 37°C in a CO2 incubator. The cells were transfected with shPRKN, non-targeting shRNA, siLDHB or siNC, using Lipofectamine® 3000 reagent. After 48 h, cells were then cultured with 100 μL of fresh medium supplemented with 10 μL of CCK-8 solution, and the plates were further incubated for 4 h at 37°C. Subsequently, the optical density was measured at 450 nm using a microplate reader (Bio-Rad, USA).
Statistical analysis
The data are expressed as the mean ± standard deviation (SD) and were analyzed by one-way ANOVA using SPSS software (version 17.0). P value < 0.05 was considered statistically significant.
Ethics statement
The authors declare that the animal breeding, care and all experiments were performed in adherence to the guidelines of the Laboratory Animal Center of South China Agricultural University and approved by the Animal Ethics Committee.
Acknowledgments
This work was supported by grants from the National Key Research and Development Program (Nos. 2017YFD0500600 and 2016YFD0500700), National Natural Science Foundation of China (Nos. U1405216, 31472200 and 31672590), Science and Technology Program of Guangzhou, China (201803020005), the Key Research Projects of Universities in Guangdong Province (2019KZDXM026), the Science and Technology Program of Guangdong, China (2019B020211003), and 111 Project [D20008].
Disclosure statement
The authors declare that the research was conducted in the absence of any commercial or financial relationships that could be construed as a potential conflict of interest.
Additional information
Funding
References
- Kleiboeker SB Swine fever: classical swine fever and African swine fever. Vet Clin North Am Food Anim Pract 2002; 18 (3): 431–451.
- Lohse L, Nielsen J, Uttenthal A Early pathogenesis of classical swine fever virus (CSFV) strains in Danish pigs. Vet Microbiol 2012; 159 (3–4): 327–336.
- Paton DJ, Greiser-Wilke I Classical swine fever-an update. Res Vet Sci 2003; 75 (3): 169–178.
- Becher P, Avalos Ramirez R, Orlich M, et al. Genetic and antigenic characterization of novel pestivirus genotypes implications for classification. Virology 2003; 311 (1): 96–104.
- Paton DJ, Sands JJ, Lowings JP, et al. A proposed division of the pestivirus genus using monoclonal antibodies, supported by cross-neutralisation assays and genetic sequencing. Vet Res 1995; 26 (2): 92–109.
- Li LF, Yu J, Li Y, et al. Guanylate-binding protein 1, an interferon-induced GTPase, exerts an antiviral activity against classical swine fever virus depending on Its GTPase activity. J Virol 2016; 90 (9): 4412–4426.
- Thiel HJ, Stark R, Weiland E, et al. Hog cholera virus: molecular composition of virions from a pestivirus. J Virol 1991; 65 (9): 4705–4712.
- Lamp B, Riedel C, Wentz E, et al. Autocatalytic cleavage within classical swine fever virus NS3 leads to a functional separation of protease and helicase. J Virol 2013; 87: 11872–11883.
- Moulin HR, Seuberlich T, Bauhofer O, et al. Nonstructural proteins NS2-3 and NS4A of classical swine fever virus: essential features for infectious particle formation. Virology 2007; 365: 376–389.
- Johns HL, Bensaude E, La Rocca SA, et al. Classical swine fever virus infection protects aortic endothelial cells from pIpC-mediated apoptosis. J Gen Virol 2010; 91: 1038–1046. 4
- Bensaude E, Turner JL, Wakeley PR, et al. Classical swine fever virus induces proinflammatory cytokines and tissue factor expression and inhibits apoptosis and interferon synthesis during the establishment of long-term infection of porcine vascular endothelial cells. J Gen Virol 2004; 85: 1029–1037.
- Tautz N, Meyers G, Thiel HJ Pathogenesis of mucosal disease, a deadly disease of cattle caused by a pestivirus. Clin Diagn Virol 1998; 10 (2–3): 121–127.
- Li S, Wang J, Yang Q, et al. Complex virus-host interactions involved in the regulation of classical swine fever virus replication: a minireview. Viruses 2017; 9 (7): E171.
- Summerfield A, Ruggli N Immune responses against classical swine fever virus: between ignorance and lunacy. Front Vet Sci 2015; 2: 10.
- Knoetig SM, Summerfield A, Spagnuolo-Weaver M, et al. Immunopathogenesis of classical swine fever: role of monocytic cells. Immunology 1999; 97: 359–366.
- Drent M, Cobben NA, Henderson RF, et al. Usefulness of lactate dehydrogenase and its isoenzymes as indicators of lung damage or inflammation. Eur Respir J 1996; 9(8): 1736–1742.
- Leiblich A, Cross SS, Catto JW, et al. Lactate dehydrogenase-B is silenced by promoter hypermethylation in human prostate cancer. Oncogene 2006; 25 (20): 2953–2960.
- Ždralević M, Brand A, Di Ianni L et al. Double genetic disruption of lactate dehydrogenase A and B is required to ablate the “Warburg effect” restricting tumor growth to oxidative metabolism. J Biol Chem 2018; 293 (41): A118–A4180.
- Cui J, Quan M, Jiang W, et al. Suppressed expression of LDHB promotes pancreatic cancer progression via inducing glycolytic phenotype. Med Oncol 2015; 32 (5): 143.
- Li C, Chen Y, Bai P, et al. LDHB may be a significant predictor of poor prognosis in osteosarcoma. Am J Transl Res 2016; 8 (11): 4831–4843.
- Brisson L, Banski P, Sboarina M, et al. Lactate dehydrogenase B controls lysosome activity and autophagy in cancer. Cancer Cell 2016; 30 (3): 418–431.
- Mishra P, Chan DC Mitochondrial dynamics and inheritance during cell division, development and disease. Nat Rev Mol Cell Biol 2014; 15 (10): 634–646.
- Lovas JR, Wang X The meaning of mitochondrial movement to a neuron’s life. Biochim Biophys Acta 2013; 1833 (1): 184–194.
- C N Stj R, Rosenthal M inhibition of glycolysis alters potassium ion transport and mitochondrial redox activity in rat brain. J Cereb Blood Flow Metab 1988; 8 (6): 857–865.
- Zagari F, Jordan M, Stettler M, et al. Lactate metabolism shift in CHO cell culture: the role of mitochondrial oxidative activity. N Biotechnol 2013; 30 (2): 238–245.
- Chen YJ, Mahieu NG, Huang X, et al. Lactate metabolism is associated with mammalian mitochondria. Nat Chem Biol 2016; 12 (11): 937–943.
- Haschemi A, Kosma P, Gille L, et al. The sedoheptulose kinase CARKL directs macrophage polarization through control of glucose metabolism. Cell Metab 2012; 15 (6): 813–826.
- Chan DC Fusion and fission: interlinked processes critical for mitochondrial health. Annu Rev Genet 2012; 46: 265–287.
- Gao L-P, Xiao K, Wu Y-Z, et al. Enhanced mitophagy activity in prion-infected cultured cells and prion-infected experimental mice via a Pink1/Parkin-dependent mitophagy pathway. ACS Chem Neurosci 2020; 11 (5): 814–829.
- Kim SJ, Syed GH, Khan M, et al. Hepatitis C virus triggers mitochondrial fission and attenuates apoptosis to promote viral persistence. Proc Natl Acad Sci U S A 2014; 111 (17): 6413–6418.
- Kim SJ, Khan M, Quan J, et al. Hepatitis B virus disrupts mitochondrial dynamics: induces fission and mitophagy to attenuate apoptosis. PLoS Pathog 2013; 9 (12): e1003722.
- Yoshizumi T, Ichinohe T, Sasaki O, et al. Influenza A virus protein PB1-F2 translocates into mitochondria via Tom40 channels and impairs innate immunity. Nat Commun 2014; 5: 4713.
- Jassey A, Liu C-H, Changou C, et al. Hepatitis C virus non-structural protein 5A (NS5A) disrupts mitochondrial dynamics and induces mitophagy. Cells 2019; 8 (4): E290.
- Ding B, Zhang L, Li Z, et al. The matrix protein of human parainfluenza virus type 3 induces mitophagy that suppresses interferon responses. Cell Host Microbe 2017; 21 (4): 538–547.
- Waisner H, Kalamvoki M, Sandri-Goldin RM The ICP0 protein of herpes simplex virus 1 (HSV-1) downregulates major autophagy adaptor proteins sequestosome 1 and optineurin during the early stages of HSV-1 infection. J Virol 2019; 93 (21): e01258–19.
- Gou H, Zhao M, Xu H, et al. CSFV induced mitochondrial fission and mitophagy to inhibit apoptosis. Oncotarget 2017; 8 (24): 39382–39400.
- Mao P, Joshi K, Li J, et al. Mesenchymal glioma stem cells are maintained by activated glycolytic metabolism involving aldehyde dehydrogenase 1A3. Proc Natl Acad Sci U S A 2013; 110 (21): 8644–8649.
- Gou H, Zhao M, Yuan J, et al. Metabolic profiles in cell lines infected with classical swine fever virus. Front Microbiol 2017; 8: 691.
- Gong W, Jia J, Zhang B, et al. Serum metabolomic profiling of piglets infected with virulent classical swine fever virus. Front Microbiol 2017; 8: 731.
- Moretti M, Bennett J, Tornatore L, et al. Cancer: NF-kappaB regulates energy metabolism. Int J Biochem Cell Biol 2012; 44 (12): 2238–2243.
- Ben-Neriah Y, Karin M Inflammation meets cancer, with NF-kappaB as the matchmaker. Nat Immunol 2011; 12 (8): 715–723.
- Pahl HL Activators and target genes of Rel/NF-kappaB transcription factors. Oncogene 1999; 18 (49): 6853–6866.
- Santoro MG, Rossi A, Amici C NF-kappaB and virus infection: who controls whom. Embo J 2003; 22 (11): 2552–2560.
- Meir T, Dror R, Yu X, et al. Molecular characteristics of liver metastases from uveal melanoma. Invest Ophthalmol Vis Sci 2007; 48 (11): 4890–4896.
- Nam SY, Ko YS, Jung J, et al. A hypoxia-dependent upregulation of hypoxia-inducible factor-1 by nuclear factor-kappaB promotes gastric tumour growth and angiogenesis. Br J Cancer 2011; 104 (1): 166–174.
- Dennison JB, Molina JR, Mitra S, et al. Lactate dehydrogenase B: a metabolic marker of response to neoadjuvant chemotherapy in breast cancer. Clin Cancer Res 2013; 19 (13): 3703–3713.
- Vegran F, Boidot R, Michiels C, et al. Lactate influx through the endothelial cell monocarboxylate transporter MCT1 supports an NF-kappaB/IL-8 pathway that drives tumor angiogenesis. Cancer Res 2011; 71 (7): 2550–2560.
- Ding WX, Yin XM Mitophagy: mechanisms, pathophysiological roles, and analysis. Biol Chem 2012; 393 (7): 547–564.
- Zhong Z, Umemura A, Sanchez-Lopez E, et al. NF-kappaB restricts inflammasome activation via elimination of damaged mitochondria. Cell 2016; 164 (5): 896–910.
- Everett H, McFadden G Apoptosis: an innate immune response to virus infection. Trends Microbiol 1999; 7 (4): 160–165.
- Pei J, Zhao M, Ye Z, et al. Autophagy enhances the replication of classical swine fever virus in vitro. Autophagy 2014; 10 (1): 93–110.
- Pei J, Deng J, Ye Z, et al. Absence of autophagy promotes apoptosis by modulating the ROS-dependent RLR signaling pathway in classical swine fever virus-infected cells. Autophagy 2016; 12 (10): 1738–1758.
- Dornburg R From the natural evolution to the genetic manipulation of the host-range of retroviruses. Biol Chem 1997; 378 (6): 457–468.
- Tannahill GM, Curtis AM, Adamik J, et al. Succinate is an inflammatory signal that induces IL-1β through HIF-1α. Nature 2013; 496 (7444): 238–242.
- Haas R, Cucchi D, Smith J, et al. Intermediates of metabolism: from bystanders to signalling molecules. Trends Biochem Sci 2016; 41 (5): 460–471.
- Colegio OR, Chu NQ, Szabo AL, et al. Functional polarization of tumour-associated macrophages by tumour-derived lactic acid. Nature 2014; 513 (7519): 559–563.
- Haas R, Smith J, Rocher-Ros V, et al. Lactate regulates metabolic and pro-inflammatory circuits in control of T cell migration and effector functions. PLoS Biol 2015; 13 (7): e1002202.
- Mo X, Wei F, Tong Y, et al. Lactic acid downregulates viral microrna to promote epstein-barr virus-immortalized B lymphoblastic cell adhesion and growth. J Virol 2018; 92 (9): e00033–18.
- Warburg O On the Origin of Cancer Cells. Science 1956; 123 (3191): 309–314.
- Itsui Y, Sakamoto N, Kakinuma S, et al. Antiviral effects of the interferon-induced protein guanylate binding protein 1 and its interaction with the hepatitis C virus NS5B protein. Hepatology 2009; 50 (6): 1727–1737.
- Kim JY, Lee SH, Bae IH, et al. Pyruvate protects against cellular senescence through the control of mitochondrial and lysosomal function in dermal fibroblasts. J Invest Dermatol 2018; 138 (12): 2522–2530.
- Hong SM, Lee Y-K, Park I, et al. Lactic acidosis caused by repressed lactate dehydrogenase subunit B expression down-regulates mitochondrial oxidative phosphorylation via the pyruvate dehydrogenase (PDH)–PDH kinase axis. J Biol Chem 2019; 294 (19): 7810–7820.
- Kim J-H, Kim E-L, Lee Y-K, et al. Decreased lactate dehydrogenase B expression enhances claudin 1-mediated hepatoma cell invasiveness via mitochondrial defects. Exp Cell Res 2011; 317 (8): 1108–1118.
- Liang X, Liu L, Fu T, et al. Exercise inducible lactate dehydrogenase B regulates mitochondrial function in skeletal muscle. J Biol Chem 2016; 291 (49): 25306–25318.
- Chen YJ, Mahieu NG, Huang X, et al. Lactate metabolism is associated with mammalian mitochondria. Nat Chem Biol 2016; 12 (11): 937–943
- Lin Q, Li S, Jiang N, et al. PINK1-parkin pathway of mitophagy protects against contrast-induced acute kidney injury via decreasing mitochondrial ROS and NLRP3 inflammasome activation. Redox Biol 2019; 26: 101254.
- Tang C, Han H, Yan M, et al. PINK1-PRKN/PARK2 pathway of mitophagy is activated to protect against renal ischemia-reperfusion injury. Autophagy 2018; 14 (5): 880–897.
- Zhao Y, Sun M Metformin rescues Parkin protein expression and mitophagy in high glucose-challenged human renal epithelial cells by inhibiting NF-κB via PP2A activation. Life Sci 2020; 246: 117382.
- Wu H, Chen Q Hypoxia activation of mitophagy and its role in disease pathogenesis. Antioxid Redox Signal 2015; 22 (12): 1032–1046.
- Larsen SB, Hanss Z, Krüger R The genetic architecture of mitochondrial dysfunction in Parkinson’s disease. Cell Tissue Res 2018; 373 (1): 21–37.
- Liu H, You L, Wu J, et al. Berberine suppresses influenza virus-triggered NLRP3 inflammasome activation in macrophages by inducing mitophagy and decreasing mitochondrial ROS. J Leukoc Biol 2020. 108 1 253–266
- Wang R, Zhu Y, Ren C, et al. Influenza A virus protein PB1-F2 impairs innate immunity by inducing mitophagy. Autophagy 2020; 11: 1–16.
- Huang Q, Zhan L, Cao H, et al. Increased mitochondrial fission promotes autophagy and hepatocellular carcinoma cell survival through the ROS-modulated coordinated regulation of the NFKB and TP53 pathways. Autophagy 2016,; 12 (6): 999–1014.
- Khare A, Raundhal M, Chakraborty K, et al. Mitochondrial H2O2 in lung antigen-presenting cells blocks NF-κB activation to prevent unwarranted immune activation. Cell Rep 2016; 15 (8): 1700–1714.
- Eiyama A, Okamoto K PINK1/Parkin-mediated mitophagy in mammalian cells. Curr Opin Cell Biol 2015 33: 95–101.
- Wei X, Qi Y, Zhang X, et al. Cadmium induces mitophagy through ROS-mediated PINK1/Parkin pathway. Toxicol Mech Methods 2014; 24 (7): 504–511.
- Hoppins S, Nunnari J. Cell biology. Mitochondrial dynamics and apoptosis–the ER connection. Science 2012; 337 (6098): 1052–1054