
ABSTRACT
Our previous studies reveal a mechanism for lipid droplet (LD)-mediated proteostasis in the endoplasmic reticulum (ER) whereby unfolded proteins that accumulate in the ER in response to lipid imbalance-induced ER stress are removed by LDs and degraded by microlipophagy (µLP), autophagosome-independent LD uptake into the vacuole (the yeast lysosome). Here, we show that dithiothreitol- or tunicamycin-induced ER stress also induces µLP and identify an unexpected role for vacuolar membrane dynamics in this process. All stressors studied induce vacuolar fragmentation prior to µLP. Moreover, during µLP, fragmented vacuoles fuse to form cup-shaped structures that encapsulate and ultimately take up LDs. Our studies also indicate that proteins of the endosome sorting complexes required for transport (ESCRT) are upregulated, required for µLP, and recruited to LDs, vacuolar membranes, and sites of vacuolar membrane scission during µLP. We identify possible target proteins for LD-mediated ER proteostasis. Our live-cell imaging studies reveal that one potential target (Nup159) localizes to punctate structures that colocalizes with LDs 1) during movement from ER membranes to the cytosol, 2) during microautophagic uptake into vacuoles, and 3) within the vacuolar lumen. Finally, we find that mutations that inhibit LD biogenesis, homotypic vacuolar membrane fusion or ESCRT function inhibit stress-induced autophagy of Nup159 and other ER proteins. Thus, we have obtained the first direct evidence that LDs and µLP can mediate ER stress-induced ER proteostasis, and identified direct roles for ESCRT and vacuolar membrane fusion in that process.
Introduction
The unfolded protein response (UPR) regulates ER quality control by mechanisms including the ER-associated protein degradation pathway (ERAD). ERAD identifies unfolded or mis-assembled ER proteins, retrotranslocates them to the cytosol and targets them for degradation by the proteasome [Citation1]. However, certain proteins are not readily removed from the ER by ERAD. For example, misfolded GPI-anchored proteins are eliminated from the ER by ERAD-independent vesicular transport followed by degradation in the lysosome (the vacuole in yeast) [Citation2–4]. In addition, ERAD-independent degradation of ER by macroautophagy or microautophagy is induced by overexpression of aggregation-prone proteins or ER-resident transmembrane proteins in ER, or by chemically induced ER stress. During macroautophagy, ER is sequestered in and delivered to the lysosomes/vacuole by autophagosomes. In contrast, during microautophagy, ER undergoes autophagosome-independent uptake into vacuoles/lysosomes at sites of vacuolar membrane invagination or by arm-like protrusions that extend from lysosomes/vacuoles [Citation5–7].
Recently, our laboratory identified a novel mechanism for ER proteostasis in the budding yeast Saccharomyces cerevisiae that relies on lipid droplets (LDs) [Citation8]. LDs are organelles that form at and bud from ER membranes, and consist of a phospholipid monolayer surrounding a core of neutral lipids. LDs have well-established functions as sites for lipid storage and energy mobilization. However, it is now clear that LDs have additional functions including storage of signaling proteins, their precursors, and hydrophobic vitamins, and protein quality control [Citation9].
LDs affect proteostasis by several mechanisms. They are a source of sterol-based metabolites that function as protein chaperones and promote clearance of inclusion bodies in yeast [Citation10]. LDs can also sequester proteins that are misfolded and/or destined for degradation. For example, aggregates of proteins including the Alzheimer and Parkinson disease-associated proteins amyloid β peptide and SNCA/α-synuclein localize to LDs in cultured neurons and neurons isolated from Alzheimer or Parkinson disease patients [Citation11,Citation12]. Similarly, apolipoprotein B is enriched in LDs in human hepatoma cells and degraded by the proteasome or vacuole [Citation13]. Interestingly, there is a clear link between LDs and ER stress in yeast: deletion of the 4 genes that are required for LD biogenesis results in activation of the UPR [Citation14].
We found previously that lipid imbalance produced by inhibition of phosphatidylcholine (PC) biosynthesis leads to ER stress and activation of LD biogenesis, and that LD biogenesis is essential for survival in yeast exposed to lipid imbalance [Citation8,Citation15]. Our studies support the model that LDs function in removal of excess lipids and unfolded proteins from the ER, and are targeted for degradation by microautophagy [Citation8]. Although microautophagy is not well characterized, it is clear that peroxisomes [Citation16], nuclei [Citation17], ER [Citation6], mitochondria [Citation18], LDs [Citation19,Citation20], and the cytoplasm [Citation21] can be degraded by microautophagy in yeast. Microautophagy also occurs in mammalian cells, where it is thought to function in the turnover of long-lived proteins [Citation22]. Moreover, recent studies revealed a role for microautophagy in mouse development [Citation23].
Interestingly, there are multiple mechanisms underlying LD microautophagy (microlipophagy, µLP) in yeast. µLP that occurs during nitrogen starvation or transition into stationary phase requires core autophagy-related (ATG) genes [Citation19,Citation20]. Studies from our laboratory and others reveal an alternative, ATG gene-independent mechanism for µLP in yeast exposed to lipid imbalance or undergoing the diauxic shift from glycolysis- to respiration-driven growth when glucose becomes limiting [Citation8,Citation24]. ATG gene-dependent and -independent µLP rely on the endosome sorting complexes required for transport (ESCRT) machinery, a conserved protein complex that functions in many membrane budding or bending events [Citation25]. ESCRT contributes to ATG gene-dependent µLP through its function in multivesicular body (MVB) formation. MVBs deliver sterols to the vacuolar membrane, which are required for uptake of LDs into the organelle [Citation26]. Although Vps4, an ESCRT-associated ATPase, is required for ATG gene-independent µLP [Citation8,Citation24], the mechanism underlying ESCRT function in this form of µLP is not well understood.
Here, we report that treatment with either of two ER stressors, tunicamycin (TM) or dithiothreitol (DTT), also induces LD-mediated ER proteostasis. We identify ER proteins that may be targets for this stress-induced proteostasis pathway, which reveals a broad role for µLP in ER proteostasis. We present the first direct evidence that LDs are associated with ER proteins as they undergo ER stress-induced removal from ER membranes. We also visualized vacuolar membrane invagination and scission during ER stress-induced µLP for the first time, and obtained evidence that uptake of LDs into vacuoles is linked to and requires homotypic vacuolar membrane fusion. Finally, we obtained evidence for a direct role for ESCRT and homotypic vacuolar fusion in µLP.
Results
Treatment with TM or DTT induces ATG-independent microlipophagy (µLP) and vacuolar membrane remodeling during µLP
Our previous studies revealed that treatment with the ER stressors TM or DTT induces accumulation and autophagy of LDs in yeast [Citation8]. Here, we provide evidence that TM- or DTT-induced LD degradation is ATG gene-independent and occurs by microautophagy. We tagged the LD marker protein Erg6 with mCherry and carried out quantitative analysis of Erg6-mCherry degradation to free mCherry, an established assay to measure LD autophagy [Citation8,Citation27]. We confirmed previous findings that DTT or TM treatment results in degradation of Erg6. Moreover, Erg6 degradation required the vacuolar protease Pep4, and therefore occurred by autophagy ()). Finally, we found that DTT- or TM-induced LD autophagy did not require core ATG genes. The core Atg component Atg8 is a small membrane-bound ubiquitin-like protein that localizes to phagophores and autophagosomes, and is required for efficient autophagosome formation [Citation28,Citation29]. Another core Atg component, Atg1, is a cytosolic protein kinase that is required for phagophore formation [Citation30,Citation31]. Deletion of either ATG8 or ATG1 inhibited macroautophagy. However, deletion of either ATG8 or ATG1 had no significant effects on TM- or DTT-induced LD autophagy () and S1A-B).
Figure 1. TM- and DTT-induced ER stress induce vacuolar remodeling and LD degradation by microautophagy. (A and B) Representative western blots of autophagy assay of Erg6-mCherry in wild-type (WT), atg1Δ, atg8Δ and pep4Δ cells treated with 5 mM DTT or 2 µg/ml TM for 8 h. -Erg6-mCh, full-length fusion protein; -mCh, free mCherry generated by vacuolar degradation of Erg6-mCherry; TCE, total protein loading control. Protein ladders (kDa) are shown at left. Quantification is shown in Figure S1 A and B. (C) Representative images of wild-type cells expressing Vph1-GFPEnvy to label the vacuolar membrane. Cells were grown on synthetic complete media (SC), SC + 5 mM DTT or SC + 2 µg/ml TM for 8 h. Maximum projections are shown. V, vacuole. Bar: 2 μm. (D) Quantification of vacuole number in untreated (SC) and DTT or TM-treated WT cells. The data shown are a representative trial from 3 independent trials (n > 55 cells per condition per trial. Left and middle panels: ****, p < 0.0001, by unpaired two-tailed Mann-Whitney test. Right panel: ****, p < 0.0001, by Kruskal-Wallis test with Dunn’s post-hoc test for multiple comparisons). (E) Transmission electron microscopy (TEM) images of WT cells grown on SC, SC + 5 mM DTT or SC + 2 µg/ml TM for 8 h. V, vacuole; N, nucleus; LD, lipid droplet. Bars: 0.5 µm. (F) Frames from time-lapse series showing events associated with microlipophagy in response to chemically induced ER stress. Single optical sections are shown of vacuoles (V) and LDs visualized using Vph1-GFPEnvy and Erg6-mCherry, respectively. Yeast were treated with DTT (5 mM) (upper panels) or TM (2 µg/ml) (lower panels) at the onset of imaging. Numbers indicate elapsed time in seconds. Bar: 2 µm
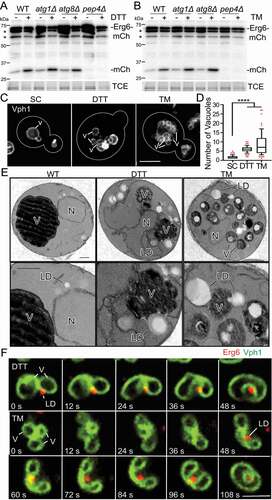
We confirmed that chemically induced ER stress also stimulated vacuolar fragmentation [Citation32]. Here, we tagged Vph1, a subunit of the vacuolar ATPase [Citation33], at its chromosomal locus with GFPEnvy (green fluorescent protein Envy) and visualized vacuoles in living yeast that were untreated or treated with DTT or TM (). In contrast to untreated control cells, which typically contain one or two large vacuoles, we detected multiple smaller vacuoles in cells treated with DTT or TM. Quantification of live-cell images indicated that there is a statistically significant increase in vacuole number with DTT or TM treatment ().
Our ultrastructural analysis confirmed that vacuoles become fragmented in response to DTT or TM treatment (). It also revealed that LDs are not found within autophagosomes in TM- or DTT-treated cells. Instead, LDs were associated with vacuoles at sites of invagination of the vacuolar membrane, and were also found within vacuoles (). Thus, ultrastructural analysis indicated that LD degradation in response to chemically induced ER stress occurred by µLP.
Finally, we visualized, for the first time, the membrane dynamics that occur during ER stress-induced µLP and found that vacuolar membrane remodeling during µLP is more complex than was previously appreciated. In both DTT- and TM-treated cells, we detected association of a LD with a cluster of 2 or more vacuoles (, Movie S1, 2). Thereafter, vacuoles within the cluster underwent fusion to form a single flattened structure that is in contact with the LD (Figure S1C). This structure then enveloped the LD within an invagination in the vacuolar membrane. Finally, vacuolar membrane scission occurred, which released the LD encapsulated by vacuolar membranes into the lumen of the vacuole (). This process was rapid and could occur within 60 s. This is the first direct evidence that LDs are degraded by µLP in response to chemically induced ER stress. Our studies also revealed an unexpected link between homotypic vacuolar fusion and vacuolar membrane remodeling during µLP.
The ESCRT complex has a direct role in µLP in response to lipid stress and TM- or DTT-induced ER stress
Vps4 is a AAA-ATPase (ATPase Associated with diverse cellular Activities) that mediates ESCRT III complex remodeling and force generation during membrane scission in vitro [Citation34,Citation35]. Our previous studies reveal that lipid stress induces an increase in VPS4 transcripts, and that deletion of VPS4 inhibits lipid stress-induced µLP in yeast [Citation8]. These findings support a role for ESCRT in lipid stress-induced µLP. However, they do not reveal the function of ESCRT in this process.
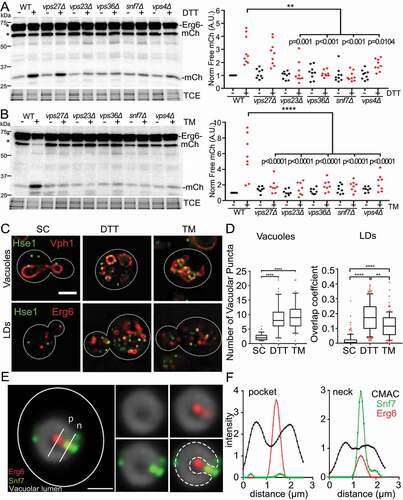
We found that deletion of ESCRT I, II or III complex proteins (Vps23, Vps36 or Snf7, respectively) resulted in >90% inhibition of LD autophagy in DTT- or TM-treated cells ()). Thus, ESCRT is the major driving force for µLP in cells exposed to DTT or TM. Interestingly, deletion of VPS4 inhibited but did not completely abolish LD autophagy in DTT- and TM-treated cells. Thus, Vps4 is critical but not essential for µLP in response to chemically induced ER stress. Finally, we found that deletion of the ESCRT 0 protein Vps27 completely blocked TM-induced LD autophagy but had no obvious effect on DTT-induced LD autophagy.
Figure 2. ESCRT components are required for DTT- and TM-induced µLP. (A and B) Western blot autophagy assay of ESCRT mutants treated with DTT (A) or with TM (B). Left panels: Representative western blot of Erg6-mCherry in WT, vps27Δ, vps23Δ, vps36Δ, snf7Δ and vps4Δ cells grown on SC, SC + 5 mM DTT or SC + 2 µg/ml TM for 8 h. -mCh, free mCherry generated by vacuolar degradation of Erg6-mCherry. TCE, Total protein loading control. Protein ladders (kDa) are shown at left. Right panels: Quantification of vacuolar degradation of Erg6-mCherry from western blots as in left panel. Bar graph shows average + SEM of total intensity of free mCherry bands normalized to TCE for each lane and to WT. (n > 50 for each of 3 independent trials, ***, p < 0.001 by one-way ANOVA with Bonferroni’s post-hoc test for multiple comparisons). (C) Representative images of WT cells tagged with Hse1-GFPEnvy and Vph1-mCherry or Erg6-mCherry grown on SC, SC + 5 mM DTT or SC + 2 µg/ml TM for 8 hrs. Images are single optical sections through the middle of the cell. Bar: 2 μm. (D) Number of Hse1 puncta that colocalize with vacuoles (left) and overlap coefficient of Hse1 and Erg6 (right) in WT cells grown on SC, SC + 5 mM DTT or SC + 2 µg/ml TM as shown in (C). Representative trial from 3 independent experiments (n > 40 cells/condition/trial. **, p < 0.01; ****, p < 0.0001 by Kruskal-Wallis test with Dunn’s post-hoc test for multiple comparisons). (E) Localization of LDs and ESCRT complexes at sites of vacuolar membrane invagination in DTT-treated cells. Yeast expressing Snf7-GFPEnvy and Erg6-mCherry were propagated in SC medium at 30°C with aeration in the presence or absence of DTT for 8 h. The vacuolar lumen (gray) was stained by incubation with 20 µM 7-amino-4-chloromethylcoumarin (CMAC) at 30°C for 10 min in the dark. Deconvolved single optical planes showing the disposition of LDs (red), ESCRT complexes (green) and the vacuolar lumen (gray). The cell outline is shown in white. Dotted lines: Outline of the vacuole and vacuolar membrane invagination. White lines: Location of line profiles through the pocket (P) and neck (N) of the vacuolar membrane invagination shown in panel G. Bar: 1 µm. (F) Intensity profile of Snf7-GFPEnvy (green), Erg6-mCherry (red) and CMAC (black) along the white lines shown in panel F, expressed in arbitrary units
We also found that ESCRT complexes were required for lipid stress-induced µLP (Figure S2A). Specifically, we found that deletion of ESCRT 0, I, II or III complex subunits (Vps27, Vps23, Vps36 and Snf7, respectively), or of Vps4, reduced but did not completely abolish LD autophagy in yeast undergoing phospholipid imbalance. Moreover, we found that the degree of inhibition of LD autophagy is similar upon deletion of any ESCRT component or Vps4. Thus, in contrast to chemically-induced ER stress, which required ESCRT, lipid stress-induced µLP occurred by ESCRT-dependent and -independent processes.
Next, we studied the localization of the ESCRT complex relative to LDs or vacuoles in control yeast or cells exposed to the 3 stressors studied (), S2B). We confirmed that the ESCRT 0 component Hse1 localized to punctate structures in the cytosol in control cells. In contrast, we found that the colocalization of Hse1 with LDs or vacuoles increased in response to DTT, TM or lipid imbalance (), S2B). Indeed, we found that exposure to each stressor resulted in a statistically significant increase in colocalization of ESCRT 0-III subunits and Vps4 with vacuolar membranes (Figure S2C). These findings, together with our data showing that ESCRT complexes and Vps4 were required for lipid stress-, TM-, or DTT-induced LD autophagy (, S2), support a direct role for ESCRT in µLP in response to all stressors. Interestingly, we found that an ESCRT 0 subunit is recruited to LDs and to vacuoles in DTT-treated cells (), despite the fact that ESCRT 0 is not essential for DTT-induced µLP ().
To further characterize ESCRT function during µLP, we carried out simultaneous 3-color imaging of the vacuole, LDs and ESCRT in DTT-treated living yeast cells. Here, the vacuolar lumen was visualized using 7-amino-4-chloromethylcoumarin (CMAC), a membrane-permeant fluorescent dye that is converted to a membrane-impermeant form upon conjugation to glutathione and accumulates in the vacuolar lumen in fungi. We found that a LD that colocalizes with the ESCRT component Snf7 was also associated with the vacuole (Figure S2E).
Finally, previous studies reveal that ESCRT localizes to narrow membrane necks at sites of membrane scission during processes including MVB formation, cytokinetic abscission, and viral budding [Citation25]. We found that ESCRT localized to sites of membrane scission during µLP. In the example shown (), an invagination in the vacuolar membrane in a DTT-treated yeast cell is resolved as a rounded pocket with a narrow neck within the organelle where CMAC staining is excluded. We detected LDs both within the pocket and at the invagination neck, which indicates that the vacuole detected in these studies was actively engaged in µLP. We also found that 2 ESCRT-containing puncta localized to the invagination neck (). Line profile plots of the fluorescence intensity of CMAC and labeled Erg6 and Snf7 confirmed that LDs and ESCRT localized to the invagination within the membrane of a vacuole engaged in µLP (). Together, these findings support the model that ESCRT mediates vacuolar membrane remodeling at sites of membrane invagination and scission during ER stress-induced µLP.
The effect of ER stressors on the LD proteome
Our previous studies reveal that lipid stress results in recruitment of ubiquitinated, presumably unfolded ER proteins and the ER chaperone Kar2 to LDs [Citation8]. However, it was not clear whether ER proteins besides Kar2 are recruited to LDs in response to ER stress. We used mass spectrometry to study the proteome of LDs isolated from mid-log phase yeast and how it changes in response to different forms of ER stress (Table S1).
Previous high-confidence proteomic studies reveal 35 LD proteins in yeast [Citation36]. We recovered 33 of those proteins with LDs isolated from mid-log phase control yeast cells (Table S1). In cells subjected to ER stress, we detected LD proteome remodeling (Table S2). Erg1, Tgl3, Hfd1, and Erg7 were enriched in LDs in response to all 3 stressors. Rer2, Pgc1, Erg27, Yju3 and Faa1 were enriched in LDs under conditions of lipid imbalance or DTT treatment. Interestingly, Pet10 was enriched in LDs in response to TM treatment, but not in response to other stressors studied.
We also detected many proteins that are not established LD proteins in our LD preparations, and may therefore be substrates for or contribute to LD-mediated ER proteostasis. Here, we focused only on proteins whose apparent association with LDs changes in response to the ER stressors studied. These proteins fell into 2 categories: 1) proteins that were present in LDs isolated from non-stressed mid-log phase cells but enriched in LDs in response to ER stressors, and 2) proteins that were detected only in LDs isolated from cells exposed to stressors. The latter will be referred to as proteins that are recruited to LDs by ER stressors (Table S1-S2).
We detected similarities in the patterns of protein enrichment in LDs in response to all 3 stressors. The number of enriched proteins (40–60) was similar. Moreover, similar proteins were enriched in LDs under all stressors studied (). Proteins that bind to unfolded ER proteins in the ER lumen and facilitate their folding (Kar2, Lhs1, Scj1 and Pdi1) were enriched in LDs in response to all stressors studied and were enriched to a greater extent than other proteins (Table S1).
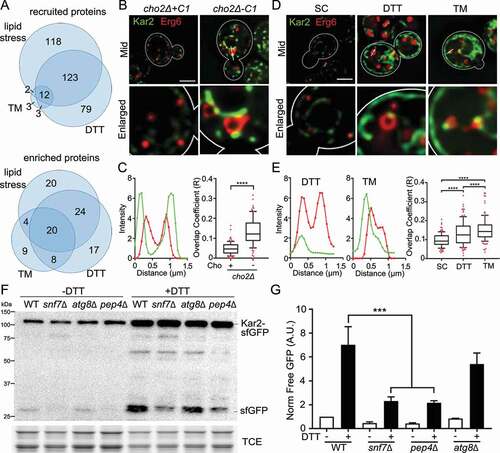
Figure 3. Stress-induced changes in the proteome of isolated LDs. (A) Venn diagrams showing overlap in proteins that are recruited to LDs in response to the 3 stressors studied. (B) Representative images of cho2Δ+C1 and cho2Δ-C1 cells expressing Kar2-sfGFP and Erg6-mCherry. Mid, single optical section through the middle of the cell. White straight line, location of profile shown in (C). Bar: 2 μm. (C) Intensity profile (left) of Kar2-sfGFP and Erg6-mCherry along the white line shown in (B). Intensity is measured as arbitrary units from the raw unadjusted images. Quantification of colocalization (right) between Kar2-sfGFP and Erg6-mCherry using Manders’ overlap coefficient (R). The box indicates the middle quartiles with the horizontal line representing the median; whiskers show the 10th and 90th percentiles, and red dots represent values in the top and bottom 10th percentiles. Representative trial from 3 independent experiments (n = 108–135 cells for each condition, ****, p < 0.0001, by unpaired two-tailed Mann-Whitney test). (D, E) Representative images, intensity profiles and quantification of overlap coefficient of Kar2-sfGFP and Erg6-mCherry in untreated yeast (SC), or yeast treated with DTT or TM. Imaging and quantification were carried out as for (B, C). Representative trial from 3 independent experiments (n > 60 cells for each condition, ****, p < 0.0001, by Kruskal-Wallis test with Dunn’s post-hoc test for multiple comparisons). (F) Representative western blots of autophagy assay of Kar2-sfGFP in wild-type (WT), snf7∆, atg8∆, and pep4∆ cells in the presence or absence of 5 mM DTT. -Kar2-sfGFP, full-length fusion protein; -sfGFP, free sfGFP generated by vacuolar degradation of Kar2-sfGFP; TCE, total protein loading control; Protein ladders (kDa) are shown in the left. (G) Quantification of Kar2 autophagy in (J). Mean ± SEM is shown, normalized as in (n > 3 independent trials, ***, p < 0.001 by one-way ANOVA with Sidak’s multiple comparisons test)
Our previous studies indicate that isolated LDs contain some ER contamination. However, several factors argue against the idea that the ER folding factors that we detected in LDs from stressed cells are due to contamination of the LD fraction by ER. First, the levels of ER contamination are similar in fractions prepared from control and stressed yeast cells [Citation8]. Moreover, although many ER folding factors are induced in response to ER stress, we found that the enrichment of Kar2 and Pdi1 in LDs was not due to the stress-stimulated induction of these factors. Specifically, our previous studies show that lipid imbalance induce a 3.5-fold increase in KAR2 transcript and protein in whole cells, and an 8-fold increase in Kar2 protein levels in isolated LDs [Citation8]. In addition, analysis of the levels of Kar2 and Pdi1 from DTT-treated yeast revealed 2.74- and 2.02-fold increases of Kar2 and Pdi1, respectively, in LDs, compared to 1.73- and 1.29-fold increases of those proteins in whole-cell lysates (, S3, and Table S1). Thus, both of the ER protein folding factors analyzed show a more pronounced increase in LD preparations than in whole cells in response to DTT treatment.
Approximately 217 and 255 proteins were recruited to LDs in response to lipid imbalance and DTT treatment, respectively. 135 of these proteins (53% or 62% respectively) were identical (). Although these recruited proteins have diverse functions, proteins that function in lipid (fatty acid and ergosterol) synthesis and protein folding (Eug1, Ssa4, Ssc1, Ssa2, Ssc1, Gsf2, Ero1 and Hsp82), are prominent among proteins that are recruited to LDs by these 2 stressors (Table S2). In contrast, TM treatment resulted in recruitment of only 20 proteins to LDs. 85% of these proteins were also recruited to LDs by lipid imbalance or DTT treatment. Many of these proteins (Sse2, Cpr1, FPr1, Ssc1, Ssa2, Ero1) also function in protein folding (Tables S2-S3).
Chaperones that are recovered with LDs during ER stress colocalize with LDs and undergo ATG gene-independent degradation in the vacuole
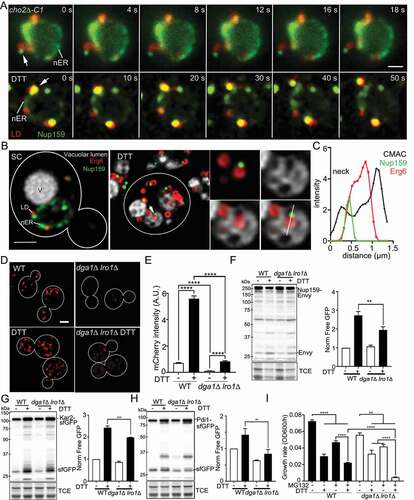
To determine whether ER and cytosolic protein folding factors that we recovered with LDs in ER stressed cells are indeed associated with LDs, we studied the localization of Kar2, cytosolic chaperones (Ssa1, Ssa2, Ssa4 and Hsp82) and LDs under conditions of lipid imbalance and chemically induced ER stress. Chaperones were tagged with GFP, GFPEnvy, or sfGFP (superfolder GFP) and the LD marker Erg6 was tagged with mCherry. In all cases, genes were tagged at their chromosomal loci. We detected colocalization of Kar2 with Erg6 in LDs and statistically significant increases in the overlap coefficients of Kar2 with Erg6 in LDs in yeast exposed to lipid imbalance, DTT or TM treatment ()). This observed colocalization was not a consequence of interaction of LDs with ER: Kar2 that colocalizes with LDs was resolved as punctate structures that are not associated with ER tubules, sheets or the nuclear ER (nER, ER associated with the outer nuclear envelope) ()).
Interestingly, we found that cytosolic chaperones accumulated in large cloud-like structures in the cytosol in ER-stressed cells (Figure S3). Equally important, we found that LDs were present within those structures and that lipid imbalance-induced ER stress resulted in a statistically significant increase in the overlap coefficients of all 4 cytosolic chaperones with LDs (Figure S3A-L). Thus, we obtained additional evidence that ER stress-induced recovery of ER and cytosolic chaperones with LDs is not a consequence of contaminants in our LD preparations. Our findings also support the model that unfolded proteins are associated with LDs in cells exposed to ER stress.
To explore possible consequences of interaction of ER folding factors with LDs, we used the western blot-based autophagy assay to determine whether Kar2 and Pdi1 undergo stress-induced autophagy. We found that DTT treatment resulted in an increase in the degradation of Kar2-sfGFP and Pdi1-sfGFP to free sfGFP and that deletion of the vacuolar protease Pep4 inhibited degradation of both proteins (), and S3M, N). Since stress-induced µLP was ATG gene-independent and required ESCRT (), we also tested whether DTT-induced autophagy of Kar2 and Pdi1 required these processes. We found that deletion of SNF7, but not ATG8, inhibited DTT-induced autophagy of Kar2 and Pdi1 (), and S3M, N). Thus, 2 ER proteins factors that were enriched in LDs in response to ER stress were degraded by ESCRT-dependent microautophagy.
Identification of possible targets for LD-mediated ER proteostasis
We identified possible targets for LD-mediated ER proteostasis as proteins that ordinarily localize to the ER, Golgi or nucleus and were recruited to LDs in response to specific ER stressors. Indeed, we found that 63–65% of the proteins that were recruited to LDs in response to lipid imbalance or DTT treatment, respectively, were either ER proteins or traffic through the ER (), S4A). Similarly, 35% of the proteins that were recruited to LDs by TM treatment localize to or traffic through the ER. Interestingly, the subcellular localization of proteins that were recruited to LDs in response to TM was considerably less complex than that of proteins that are recruited to LDs in response to lipid imbalance or DTT treatment (), S4A).
Figure 4. Candidate substrates for LD-mediated ER proteostasis. (A) Reported subcellular localization of proteins that are recruited to LDs under the stress conditions studied. Nuc: nucleus/nuclear membrane; vac: vacuole; PM: plasma membrane; and cyt: cytosol. (B) Candidate substrates for LD-mediated ER proteostasis under different stress conditions. Proteins highlighted in bold are predicted to contain at least one disulfide bridge using DIANNA 1.1. Proteins highlighted in red are known substrates for the ERAD pathway for ER proteostasis. (C) Representative images of cho2Δ+C1 and cho2Δ-C1 cells tagged with Nup159-GFPEnvy and Erg6-mCherry. Mid, single optical section through the middle of the cell. nER: nuclear ER. White straight line, location of profile shown in (D). Bar: 2 μm. (D) Intensity profile (left) of Nup159-GFPEnvy and Erg6-mCherry along the white line shown in (C). Intensity is measured as arbitrary units from the raw unadjusted images. Quantification of colocalization (right) between Nup159-GFPEnvy and Erg6-mCherry using Manders’ overlap coefficient (R). The box indicates the middle quartiles with the horizontal line representing the median; whiskers show the 10th and 90th percentile, and red dots represent values in the top and bottom 10th percentiles. Representative trial from 3 independent experiments (n = 91–105 for each condition, **, p < 0.01, by unpaired two-tailed Mann-Whitney test). (E) Number of extranuclear Nup159-GFPEnvy puncta (left) in cho2Δ+C1 and cho2Δ-C1 cells. The box indicates the middle quartiles with the horizontal line representing the median; whiskers show the 10th and 90th percentile, and red dots represent values in the top and bottom 10th percentiles. Representative trial from 3 independent experiments (n = 80–92 for each condition, ****, p < 0.0001, by unpaired two-tailed Mann-Whitney test). Percentage of extranuclear Nup159 puncta that colocalize with LD (LD +) or do not colocalize with LD (LD -) (Right) in cho2Δ+C1 and cho2Δ-C1 cells. Graph shows average + SEM from 3 independent trials. (n > 43 cells per conditions for each independent trial. ***, p < 0.001 by one-way ANOVA with Bonferroni’s post-hoc test for multiple comparisons). (F, G) Representative images, intensity profiles and quantification of the overlap coefficient of Nup159-GFPEnvy and Erg6-mCherry in untreated yeast (SC), or yeast treated with DTT or TM. Imaging and quantification were carried out as for panels C and D. Representative trial from 3 independent experiments (n > 60 cells for each condition, ****, p < 0.0001, by Kruskal-Wallis test with Dunn’s post-hoc test for multiple comparisons). (H) Number of extranuclear Nup159-GFPEnvy puncta (left) and percentage of extranuclear Nup159 puncta that either colocalized with LDs (LD +) or did not colocalize with LDs (LD -) (right) in WT cells grown on SC, SC + 5 mM DTT or SC + 2 µg/ml TM for 8 h (Left, n = 80–92 for each condition, Kruskal-Wallis test with Dunn’s post-hoc test for multiple comparisons. Right, n > 43 cells per conditions for each independent trial. One-way ANOVA with Bonferroni’s post-hoc test for multiple comparisons. ***, p < 0.001; ****, p < 0.0001). (I) Representative western blots of autophagy assay of Nup159-GFPEnvy in wild-type (WT), snf7∆, and pep4∆ cells treated with 5 mM DTT for 8 hrs. -Nup159-Envy, full-length fusion protein; Envy, free GFPEnvy generated by vacuolar degradation of Nup159-Envy; TCE, total protein loading control; Protein ladders (kDa) are shown in the left. (J) Quantification of Nup159 autophagy in (I) (n > 3 independent trials, *p < 0.05; ****, p < 0.0001 by one-way ANOVA with Sidak’s multiple comparisons test for multiple comparisons)
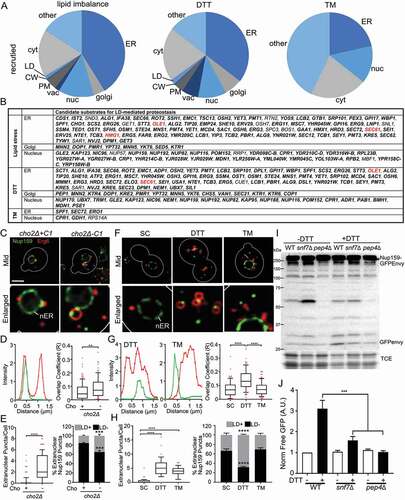
Moreover, we found that proteins recruited to LDs by different stressors were predicted to be sensitive to stressor-specific protein destabilization. Specifically, 91% and 97% of the candidates for LD-mediated ER proteostasis in lipid imbalance and DTT treatment, respectively, contained predicted disulfide linkages. These proteins may therefore undergo oxidative folding in the ER and are expected to be destabilized by reducing agents like DTT. Similarly, 100% of the candidate clients for LD-mediated ER proteostasis in response to TM treatment were predicted to be N-glycoproteins and are therefore expected to be destabilized by TM-dependent inhibition of protein glycosylation. 88% of those proteins are also predicted to contain one or more disulfide bond ().
Candidate substrates for LD-mediated ER proteostasis undergo stress-induced colocalization with LDs and ATG gene-independent vacuolar degradation
Here, we studied the localization of Nup159, Alg1, Tcb3 and Spf1 relative to LDs in yeast exposed to ER stressors. Nup159 is a nuclear pore complex component that is found on the cytosolic face of the nuclear pore and therefore associated with nER [Citation37]. Alg1 is an integral ER membrane protein and mannosyltransferase that is required for asparagine-linked glycosylation [Citation38]. Tcb3 is a yeast tricalbin and ER membrane protein involved in ER-plasma membrane tethering and transport of phophatidylinositol-4-phosphate across membranes [Citation39]. Spf1 is a P-type ATPase ion transporter in the ER membrane [Citation40].
Our analysis of the LD proteome revealed that Nup159 and Alg1 were recruited to LDs in response to DTT treatment or lipid imbalance, but not in response to TM treatment. We confirmed that Nup159 localizes to nER in non-stressed cells, and detected a statistically significant increase in colocalization of Nup159 with LDs in response to DTT- or lipid imbalance-induced ER stress, but not to TM treatment ()). Moreover, we found that Nup159 was enriched in punctate structures that localize to both the nER and the cytosol in response to the stressors studied. Some but not all extranuclear Nup159 puncta colocalized with LDs in cells exposed to DTT treatment or lipid imbalance but not in TM-treated cells. Nonetheless, DTT treatment or lipid imbalance resulted in a statistically significant increase in the colocalization of extranuclear Nup159 puncta with LDs (). Consistent with this, we detected a statistically significant increase in colocalization of Alg1 with LDs in cells exposed to DTT- or lipid imbalance-induced ER stress, but not in TM-treated cells (Figure S4B-G). Finally, we found that Tcb3 and Spf1 also colocalized with LDs and exhibited a significant increase in overlap coefficient with LDs in yeast exposed to lipid imbalance-induced ER stress (Figure S4H-M). Overall, our findings support the model that proteins that are recovered with isolated LDs in response to stress are genuinely associated with LDs.
Finally, using the western blot autophagy assay, we found that DTT treatment resulted in an increase in degradation of Nup159-GFPEnvy to free GFPEnvy and that this degradation was blocked by deletion of the vacuolar protease Pep4 ()). We also found that DTT-induced autophagy of Nup159 was inhibited by deletion of SNF7 ()). These findings support the model that stress induces vacuolar degradation of Nup159 and that the observed Nup159 autophagy, like µLP, requires ESCRT.
Role for LDs in stress-induced microautophagy of Nup159
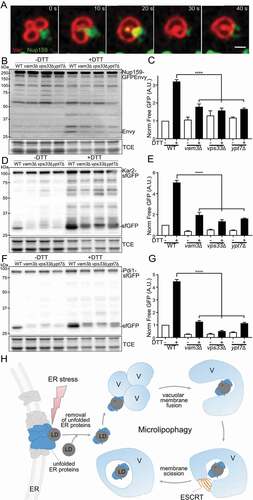
Next, we visualized Nup159 interactions with LDs and vacuoles in living yeast. Our time-lapse imaging studies revealed that LDs colocalized with punctate Nup159-containing structures in the nER, and as they moved within the nER and from the nER to the cytosol in DTT-treated cells (, Movie S3). We also detected colocalization of LDs with Nup159-containing puncta as they moved in the cytosol in yeast undergoing lipid imbalance (, Movie S4). To further characterize the role of LDs in Nup159 microautophagy, we visualized Nup159, LDs and the vacuolar lumen in untreated and DTT-treated yeast cells ()). We confirmed that extranuclear Nup159 puncta colocalize with LDs. Moreover, we detected colocalization of Nup159 puncta with LDs within the vacuolar lumen ()). These data support the model that LDs associate with Nup159-containing puncta during movement within nER membranes, from the nER to the cytosol, within the cytosol and in the vacuolar lumen in yeast exposed to chemically induced ER stress.
Figure 5. Substrates are associated with LDs for LD-mediated ER proteostasis. (A) Time-lapse frames of Nup159-GFPEnvy and Erg6-mCherry in yeast undergoing lipid imbalance (cho2Δ-C1, Upper panels) or DTT-induced stress (DTT, lower panels). Images were taken immediately after DTT treatment. nER: nuclear ER. Arrow points to a LD that colocalizes with a punctate Nup159-containing structure in the nER and moves with it from the nER to the cytosol. Times shown are in seconds. Bar: 0.75 µm. (B) Yeast expressing Nup159-GFPEnvy (green) and Erg6-mCherry (red) were propagated in SC medium at 30°C with aeration in the presence or absence of DTT for 8 h. The vacuolar lumen (gray) was stained by incubation with 20 µM 7-amino-4-chloromethylcoumarin (CMAC) at 30°C for 10 min in the dark. Deconvolved single optical planes are shown. V, vacuole. nER, nuclear ER. Arrow in DTT-treated cells point to a Nup159-containing punctate structure and its associated LD which both localize to the vacuolar lumen. Enlarged images shown are single optical sections in the plane where the Nup159 structure indicated by the arrow. White line: Localization of the line profile shown in (C). Bar: 1 µm. (C) Intensity profile of Nup159-GFPEnvy (green), Erg6-mCherry (red) and CMAC (black) along the white lines shown in (B), expressed in arbitrary units. (D) Representative images of WT and dga1Δ lro1Δ cells tagged with Erg6-mCherry. Bar: 2 μm. (E) Lipid droplet amounts are quantified as intensity of Erg6-mCherry shown in (C) (n > 94 cells, ****, p < 0.0001 by one-way ANOVA with Dunn’s multiple comparisons test for multiple comparisons). (F, G, and H) Representative western blots and quantification of autophagy assay of Nup159-GFPEnvy (F), Kar2-sfGFP (G), and Pdi1-sfGFP (H) in wild-type (WT), and dga1∆ lro1∆ cells treated with 5 mM DTT for 8 h. -Nup159-Envy, -Kar2-sfGFP, -Pdi1-sfGFP, full-length fusion protein; Envy, free GFPEnvy generated by vacuolar degradation of Nup159-Envy; sfGFP, free sfGFP generated by vacuolar degradation of the fusion protein. TCE, total protein loading control. Protein ladders (kDa) are shown to the left of the blots (n > 3 independent trials, **, p < 0.01; ***, p < 0.001 by one-way ANOVA with Sidak’s multiple comparisons test). (I) Growth rates of WT and dga1Δ lro1Δ cells in the absence or presence of DTT and MG132 (n = 12, **, p < 0.01; ****, p < 0.0001 by one-way ANOVA with Dunn’s test for multiple comparisons)
To test whether the ER stress-induced degradation of Nup159 and other candidate substrates relies on LDs, we tested the effect of deletion of genes involved in LD biogenesis on the autophagic degradation of these substrates. Deletion of 4 LD biosynthetic genes, DGA1, LRO1, ARE1, and ARE2, results in loss of all detectable LDs in yeast. However, it also results in activation of the UPR and chronic stress [Citation14]. In contrast, deletion of LRO1 and DGA1, which inhibits triglyceride synthesis [Citation41–43], results in a significant decrease in LDs but does not induce ER stress [Citation14,Citation44]. Therefore, we tested the effect of deletion of LRO1 and DGA1 in stress-induced µLP of Nup159 and other ER proteins.
We confirmed that LD abundance is reduced by 85% under basal and stress conditions in dga1∆ lro1∆ cells ()). In addition, we found that deletion of DGA1 and LRO1 resulted in a statistically signification inhibition of DTT-induced autophagy of Nup159, Kar2 and Pdi1. ()). These findings provide further support for the notion that Nup159 and potentially other proteins identified in our studies are clients for LD-mediated ER proteostasis. Moreover, we found that autophagic degradation of all 3 proteins studied was not completely blocked in the dga1∆ lro1∆ mutant. The observed partial inhibition may have occurred because LD biogenesis was inhibited but not completely blocked under the conditions studied. However, it is also possible that there are LD-dependent and -independent mechanisms for stress-induced degradation of the ER proteins studied.
Finally, we found that 3 proteins that are known ERAD substrates (Hmg1, Ole1 and Sec61) [Citation45–47] were recruited to LDs in response to ER stress and may therefore be substrates for both LD- and ERAD-mediated ER proteostasis. This finding raises the possibility that LD- and ERAD-dependent pathways have overlapping function in ER proteostasis. To test this hypothesis, we studied the effect of inhibition of these pathways on the sensitivity of yeast to DTT-induced ER stress (, S4N). Here, LD-mediated proteostasis was inhibited by deletion of LD biosynthetic enzymes (DGA1 and LRO1), ERAD was inhibited by treatment with the proteasome inhibitor MG132, and cell growth was used as a readout for cell fitness. MG132 treatment inhibited growth of both WT and dga1∆ lro1∆ cells to a similar extent. Moreover, inhibition of either ERAD or LD-mediated ER proteostasis resulted in defects in the growth of DTT-treated cells. Finally, we found that MG132-treated dga1∆ lro1∆ cells grew significantly slower than WT cells treated with MG132, or untreated dga1∆ lro1∆ cells, during DTT challenge. Thus, inhibition of both ERAD and LD-mediated ER proteostasis produced more severe defects in cell fitness in response to DTT-induced ER stress compared to inhibition of either pathway alone. Overall, our data indicate that LD-mediated ER proteostasis and ERAD each have critical roles in the cellular response to DTT-induced ER stress, and these pathways have overlapping function in cell fitness under these ER stress conditions.
Vacuolar fusion and vacuolar membrane remodeling during stress-induced µLP
We found that vacuolar membrane dynamics during DTT-induced microautophagic uptake of Nup159 and LD were similar. Specifically, live-cell imaging of DTT-treated yeast revealed that 1) extranuclear Nup159-containing punctate structures interacted with a cluster of fragmented vacuoles, 2) vacuoles associated with Nup159 fused and form a cup-shaped structure surrounding Nup159, and 3) Nup159 was taken up into the vacuole at cup-shaped invaginations in the vacuolar membrane (, Movie S5). These findings indicate that DTT treatment can induce degradation of Nup159 by microautophagy. They also support a role for homotypic vacuolar fusion and membrane remodeling in this process.
Figure 6. Homotypic vacuolar fusion and vacuolar membrane remodeling during µLP. (A) Time-lapse frames of Nup159-GFPEnvy and Vph1-mCherry in yeast were taken immediately after DTT treatment. Images shown are single optical sections. Times shown are in seconds. Bar: 0.75 µm. (B, D, and F) Representative western blots of autophagy assay of Nup159-GFPEnvy (B), Kar2-sfGFP (D), and Pdi1-sfGFP (F) in wild-type (WT) ypt7∆, vps33∆ or vam3∆ cells treated with 5 mM DTT for 8 h. sfGFP, free sfGFP; Envy, free GFPEnvy generated by vacuolar degradation of Kar2-sfGFP, Pdi1-sfGFP, or Nup159-Envy; TCE, total protein loading control. Protein ladders (kDa) are shown at left. (C, E, and G) Quantification of Nup159-GFPEnvy (C), Kar2-sfGFP (E), and Pdi1-sfGFP (G) autophagy in (B), (D), and (F), respectively (n > 3 independent trials, ****, p < 0.0001 by one-way ANOVA with Sidak’s multiple comparisons test); A.U., arbitrary units. (H) Proposed model of microlipophagy under ER stress
Next, we tested whether DTT-induced autophagy of Kar2, Pdi1, or Nup159 required vacuolar fusion. Here, we tested the effect of deletion of multiple vacuolar fusion proteins. Ypt7 is a Rab family GTPase that is required for homotypic vacuolar fusion in addition to its functions in endosome fusion and interaction of mitochondria with lysosomes [Citation48,Citation49]. Vps33 is a component of the CORVET complex that tethers and promotes fusion of Rab5-positive membranes (vacuoles and other components of the endomembrane system) [Citation50,Citation51]. Vam3 is a syntaxin-like vacuolar t-SNARE that mediates docking of vacuoles and other late transport intermediates to the vacuole [Citation52]. We found that deletion of YPT7, VPS33 or VAM3 inhibited DTT-induced autophagy of Kar2, Pdi1, or Nup159 ()). Thus, we obtained the first evidence that vacuolar membrane fusion is required for stress-induced µLP.
Discussion
Our previous studies support the model that LDs mediate ER proteostasis in response to lipid imbalance by removal of proteins from the ER and targeting those proteins for degradation in the yeast lysosome by µLP. Here, we uncovered evidence for specific mechanisms of LD-mediated ER proteostasis in response to lipid imbalance and chemically induced ER stress. We visualized ER stress-induced µLP for the first time, and obtained direct evidence that LDs associate with ER proteins as they move from ER membrane to the cytosol and within the cytosol. We identified possible targets for LD-mediated ER proteostasis under different ER stress conditions and identified a direct role for homotypic vacuolar fusion and ESCRT in microautophagic degradation of those targets. Finally, we found that inhibition of LD biogenesis inhibited stress-induced ER proteostasis and compromised the ability of cells to withstand chemically induced ER stress.
Substrates for LD-mediated ER proteostasis
We identified possible targets for LD-mediated ER proteostasis as proteins that normally localize to or traffic through the ER and are recovered with isolated LDs only under conditions of ER stress. We found that several possible targets for LD-mediated ER proteostasis colocalized with LDs in living cells in response to ER stress. Indeed, we obtained definitive evidence that Nup159, a protein that localizes to nuclear ER, is a client for LD-mediated ER proteostasis in response to DTT-induced ER stress. We found that Nup159 was enriched in LDs isolated from cells exposed to different ER stressors and observed a stressor-specific increase in colocalization of Nup159 with LDs. Indeed, in DTT-treated cells, Nup159 colocalized with LDs at the nuclear envelope, cytosol, and vacuolar membrane, and within the vacuole. Our time-lapse imaging studies also revealed that 1) LDs colocalized with Nup159 as they move in the nER, from the nER to the cytosol and within the cytosol of DTT-treated yeast, and 2) Nup159 could be taken up into the vacuole by microautophagy by a mechanism that resembled µLP. Finally, we found that Nup159 was degraded by autophagy in response to DTT-induced ER stress, and demonstrated a role for LDs in stress-induced microautophagy of Nup159 and other ER proteins.
Since Nup159 localizes to the nuclear envelope, it is formally possible that piecemeal nucleophagy, a specialized form of microautophagy, contributes to the observed stress-induced Nup159 degradation. However, a recent study reports that deletion of NVJ1, which inhibits piecemeal nucleophagy, does not influence the vacuolar degradation of Nup-containing structures [Citation53]. Together, these studies provide the first direct evidence that LDs and µLP can mediate ER proteostasis of proteins including Nup159. They also support the notion that other candidates identified in our mass spectrometry-based approach are substrates for LD-mediated ER proteostasis.
Role for µLP in ER protein quality control
Several findings indicate that the ER proteins that are recruited to LDs in response to the ER stressors studied are unfolded. First, the potential targets were sensitive to specific stresses. Specifically, all of the TM-dependent candidates were predicted to be N-glycoproteins and are therefore expected to be sensitive to TM treatment. Similarly, over 90% of the possible targets for LD-mediated ER proteostasis in response to lipid imbalance or DTT treatment contained predicted disulfide linkages and are expected to be sensitive to DTT. Second, possible targets were recruited to LDs in a stressor-specific manner. Putative clients for TM-induced µLP were distinct from those for lipid stress- or DTT-induced µLP. Finally, there are clear links between protein folding factors and stress-induced µLP. We found that ER and cytosolic chaperones were enriched in isolated LDs and colocalized with LDs in response to all stressors studied. We also obtained evidence that an ER chaperone (Kar2) and a protein that mediates oxidative folding in the ER (Pdi1) underwent LD-dependent, ATG gene-independent ER stress-induced degradation in the vacuole.
These findings, together with previous findings that the ubiquitination levels of the proteins in LDs increase in response to lipid imbalance [Citation8], support the model that the targets for stress-induced µLP are unfolded. Thus, they support a role for µLP in ER quality control. It is possible that ER folding factors (Kar2 and Pdi1) are also destabilized by ER stress and are degraded by µLP. However, we favor the model that protein folding mediators are bound to unfolded ER proteins and removed from the ER with their binding partners prior to degradation by µLP.
Finally, we obtained evidence that LD-mediated ER proteostasis has a functionally significant role in the cellular response to ER stress. Specifically, we found that inhibition of LD biogenesis inhibited ER stress-induced microautophagy of ER proteins and reduced cell growth in response to DTT treatment. Thus, we obtained evidence that LD-mediated ER proteostasis is critical for cellular defense against ER stress. Beyond this, we found that ERAD and LD-mediated ER proteostasis had common targets and that inhibition of both of these pathways increased the sensitivity of yeast to DTT to a greater extent that inhibition of each pathway alone. Thus, LD-mediated ER protein quality control has overlapping function with ERAD in the ER stress response.
Yet to be determined is the mechanism(s) for recruitment of unfolded ER proteins to LDs during stress-induced µLP. We found that Nup159 colocalized and moved with LDs in the nER and during movement from the nER to the cytosol. Thus, unfolded proteins that accumulate in the ER may enter nascent LDs at ER membranes. Since LD membrane proteins that contain hydrophobic hairpins are incorporated into LD membranes during LD biogenesis in the ER [Citation54], there is a precedent for transfer of proteins from ER to LDs. Alternatively, unfolded ER proteins may be incorporated into mature LDs that associate with ER. On the other hand, unfolded ER proteins may be recruited to LD from the cytosol. Again, there is a precedent for this possible mechanism: cytosolic proteins can insert into LD membranes through amphipathic α-helices or bind to LD membrane proteins [Citation54]. Moreover, inclusion bodies can associate with LDs [Citation10], and we find that Hsp104, a cytosolic heat shock protein that associates with inclusion bodies, co-localizes with LDs in response to lipid imbalance [Citation8]. Therefore, it is possible that substrates for LD-and µLP-mediated ER proteostasis are incorporated into LDs 1) as they form in and bud from the ER membrane, 2) during interactions of mature LDs with the ER, and 3) within the cytosol.
Role for homotypic vacuolar fusion during ER stress-induced µLP
Our live-cell imaging studies revealed that vacuolar membrane dynamics during µLP are more complex than was previously appreciated. We found that DTT or TM treatment induced vacuolar fragmentation and µLP. Interestingly, we found that LDs and a client for LD-mediated ER proteostasis (Nup159) exhibited similar interactions with the vacuole during microautophagy. In both cases, LDs or Nup159 initially interacted with clusters of 2 or more fragmented vacuoles. The vacuoles then fused to form a single flattened or curved structure that is associated with the LD or Nup159, and later formed a cup-shaped organelle which surrounded the LD or Nup159 within an invagination in the vacuolar membrane. Finally, vacuolar membrane scission resulted in release of membrane-encapsulated LD or Nup159 into the vacuolar lumen. Consistent with this, we found that DTT-induced autophagy of Nup159 was inhibited by deletion of YPT7, VPS33 or VAM3 and was therefore dependent upon homotypic vacuolar membrane fusion.
Our studies revealed novel membrane dynamics associated with µLP. Specifically, we have provided the first link between vacuolar membrane fusion and µLP, which raises the possibility that vacuolar membrane fusion may be linked to other forms of autophagy. Our findings may also shed light on a fundamental question in cell biology: how do mammalian lysosomes, typically 100 nm in diameter, incorporate and degrade larger intracellular structures including autophagosomes which can be up to 900 nm? Our finding that yeast lysosomes fuse prior to µLP raises the possibility that lysosome fusion during micro- and/or macroautophagy may allow lysosomes to reach sizes necessary for effective cargo uptake and degradation in mammalian cells.
Direct role for ESCRT in LD uptake during µLP
Although ESCRT was originally identified for its role in vacuolar protein sorting and MVB formation, ESCRT functions at different target membranes. For example, ESCRT complexes and Vps4 are critical for nuclear envelope repair, cell abscission during cell division, and release of exovesicles or viruses from cells [Citation34]. Recent studies also reveal that ESCRT complexes mediate invagination, scission and release of vacuolar membrane into the lumen of the organelle during the diauxic shift or uptake of ubiquitinated vacuolar membrane proteins [Citation24,Citation55]. Studies from our lab and others reveal a role for ESCRT in µLP in cells undergoing lipid imbalance or the diauxic shift.
We found that ESCRT was required for µLP in response to all stressors studied. Interestingly, while ESCRT is the main driving force for TM- or DTT-induced µLP, µLP in cells challenged by lipid imbalance is partially dependent upon ESCRT. Nonetheless, our studies revealed a direct role for ESCRT in µLP under the 3 different stress conditions in this study. Specifically, we found that all 3 stressors stimulated upregulation of all ESCRT complexes and recruitment of ESCRT complex proteins both to LDs and vacuolar membranes. In addition, our imaging studies revealed that ESCRT was recruited to the neck of vacuolar membrane invaginations that are engaged in LD uptake by microautophagy in response to DTT treatment.
Based on our evidence for a direct role for vacuolar membrane fusion and ESCRT in this process, and the known function of ESCRT to generate forces for membrane invagination and scission, we propose a model for membrane dynamics during ER stress-induced µLP (). ER stress induces removal of unfolded proteins from ER either directly or indirectly by LDs. It also induces vacuolar membrane fragmentation. LDs and their associated unfolded ER proteins then interact with clusters of fragmented vacuoles, triggering homotypic vacuolar membrane fusion to generate a single organelle that encapsulates the LD. ESCRT is recruited to LDs and vacuolar membranes in a stress-dependent manner. ESCRT then generates forces to 1) reorganize the vacuole into a cup-shaped structure that surrounds the LD cargo in an invagination in the vacuolar membrane, and 2) drive vacuolar membrane scission. This, in turn, releases LDs surrounded by vacuolar membrane into the vacuolar lumen. Ongoing studies will reveal mechanisms for recruiting unfolded ER proteins to LDs, extraction of proteins from the ER by LDs, recruiting and activating ESCRT at vacuolar membranes and activating vacuolar fusion during µLP, and whether a similar mechanism occurs in other eukaryotes.
Materials and Methods
Yeast strains and growth conditions
All strains used in this study were derived from wild-type BY4741 (MATa his3Δ1 leu2Δ0 met15Δ0 ura3Δ0) obtained from Open Biosystems and are listed in . All strains were propagated at 30°C with shaking as previously described [Citation56]. cho2Δ yeast strains were grown on liquid rich-glucose medium (Yeast-Peptone-Dextrose, YPD) or synthetic complete (SC) medium supplemented with 1 mM choline chloride (Sigma-Aldrich, C7071) or on solid YPD supplemented with 4 mM choline chloride. Acute phospholipid imbalance was induced as previously described [Citation8]. Briefly, cho2Δ strains were grown for 6 h on SC + 1 mM choline chloride until mid-log phase (OD600 0.10–0.35). After 6 h, cho2Δ cells were washed once with choline-free SC medium and grown for 24 h on choline-free SC to induce acute phospholipid imbalance or on SC + 1 mM choline chloride to maintain normal phospholipid levels. Cells grown on SC + choline are noted as cho2Δ+C1 while cells undergoing acute phospholipid imbalance are noted as cho2Δ-C1. For all experiments, cells were kept at mid-log phase unless otherwise noted.
Table 1. Plasmids used in this study
Table 2. Yeast strains used in this study
ER stress was induced by treating mid-log phase cells with 5 mM DTT (Sigma-Aldrich, D9779) or 2 µg/ml TM (Sigma-Aldrich, T7765). Briefly, cells were grown overnight on SC until mid-log phase. The next day, cells were diluted and grown for 8 h on SC, SC + 5 mM DTT or SC + 2 µg/ml TM. After 8 h, cells were used for endpoint imaging or western blot experiments. Time-lapse imaging of Vph1 and Erg6, Erg6 and Nup159, or Vph1 and Nup159 was performed immediately after DTT treatment. As in the induction of acute lipid imbalance, cells were always kept at mid-log phase during the induction of ER stress. For analysis at 2-day (2D) stationary phase, cells were grown as previously described [Citation20]. Briefly, cells were grown overnight on SC until late mid-log phase. The next day, cells were diluted to OD600 = 0.15 and allowed to continue growing. When the OD600 reached ~1.7, cells were left to grow for another 48 h before performing imaging experiments.
During strain construction, cells were grown on corresponding amino acid dropout SC media or on YPD media with the required antibiotics (200 μg/ml G418, Sigma-Aldrich, G5013; 300 μg/ml Hygromycin B, ThermoFisher, 10,687,010) for selection.
Yeast Strain Construction
Since deletion of genes can result in second-site suppressors in yeast [Citation57], a knockout strain for each gene of interest was generated and maintained under conditions that reduced adaptation. Knockout strains were generated by swapping the loci of interest with an auxotrophy selection marker amplified from pOM12/13 (Euroscarf, P30387/P30388) or a kanMX6 cassette from pFA6a-kanMX6 [Citation58,Citation59]. pFA6a-kanMX6 was a gift from Jurg Bahler and John Pringle (Addgene, 39,296).
The localization of proteins of interest was carried out by tagging genes at their chromosomal loci as described below. In all cases, tagging was carried out at sites that do not perturb protein function or localization. We confirmed that tagged ER proteins exhibited normal localization and that the tag had no effect on cell growth rate. Moreover, we confirmed that tagging ESCRT complex proteins had no effect on protein localization or vacuolar morphology.
GFPEnvy and mCherry protein fusions were generated by tagging the endogenous loci at the C terminus with modules amplified from pFA6a-link-GFPEnvy-SpHis5 [Citation60] or pCY3090-02 [Citation61] respectively. pFA6a-link-GFPEnvy-SpHis5 was a gift from Linda Huang (Addgene, 60,782) while pCY 3090–02 was a gift from Anne Robinson (Addgene, 36,231). Lhs1-sfGFP and Kar2-sfGFP strains were created by tagging the corresponding genomic loci at the C terminus with a sfGFP-HDEL cassette amplified from plasmid pYM28 sfGFP-HDEL [Citation62]. The pYM28 sfGFP-HDEL plasmid was a kind gift from Erik L. Snapp (Janelia Research Campus, Ashburn, VA, USA).
The GFPEnvy-Vps27 strain was generated by swapping the endogenous ORF with a GFPEnvy-VPS27-His3MX6 cassette. First, VPS27 was cloned in frame to the C terminus of GFPEnvy in pFA6a-link-GFPEnvy-SpHis5 using restriction enzymes BsrGI and AscI. In parallel, VPS27 was deleted from a WT strain with LEU2 as described above. Subsequently, LEU2 at the genomic locus of VPS27 was swapped with the GFPEnvy-VPS27-His3MX6 cassette from the newly generated plasmid pFA6a-GFPEnvy-VPS27-SpHis5.
Vps4-3 HA-GFPEnvy was generated by tagging Vps4 at the C terminus with GFPEnvy and a 3 HA linker in order to maintain normal protein function [Citation63]. Three copies of the HA tag (3 HA) with SalI and PacI overhangs was cloned in frame immediately 5ʹ of the N terminus of GFPEnvy on pFA6a-link-GFPEnvy-SpHis5 to create pFA6a-3 HA-GFPEnvy-SpHis5. Finally, Vps4 was tagged at the C terminus with a 3 HA-GFPEnvy-His cassette amplified from the newly generated plasmid.
The Snf7p-LAP-GFPEnvy strain was generated by inserting an extra copy of Snf7p tagged with LAP-GFPEnvy in a WT strain. First, GFPEnvy was swapped for eGFP using KasI and AscI restriction enzymes on pSM57 (pFA6a-LAP-eGFP-His) [Citation63], a kind gift from David Teis (Medical University of Innsbruck, Innsbruck, Austria), to generate pFA6a-LAP-GFPEnvy-His. Using this plasmid, Snf7 was endogenously tagged at the C terminus with LAP-GFPEnvy-His. The promoter (1000 bp upstream of the ORF), Snf7p-LAP-GFPEnvy and the terminator were amplified from the previously generated strain and cloned into HO-poly-kanMX4-HO using BglII and SalI to generate HO-proSnf7-LAP-GFPEnvy-kanMX6-HO [Citation64]. Finally, the cassette proSnf7-LAP-GFPEnvy-Terminator was inserted in the HO locus of a WT strain to generate Snf7p-LAP-GFPEnvy strain. HO-polyKanMX4-HO was a gift from David Stillman (Addgene, 51,662). We confirmed that expressing tagged Snf7 in cells expressing endogenous Snf7 had no effect on GFP-tagged protein localization or vacuolar morphology. All plasmids used are listed in
Electron microscopy
Mid-log cells undergoing ER stress were fixed and processed for electron microscopy as previously described in [Citation8,Citation65]. Briefly, 15–20 mL of mid-log phase cells with OD600 of 0.3 (~ 50 OD600 • mL) grown on SC, SC + 5 mM DTT or SC + 2 µg/ml TM for 8 h were collected and resuspended in fixation buffer (3% glutaraldehyde [Electron Microscopy Sciences, 16,120], 0.1 M Na-cacodylate pH 7.4 [Electron Microscopy Sciences, 12,300], 5 mM CaCl2, 5 mM MgCl2, 2.5% sucrose) and incubated at room temperature (RT) for 1 h with gentle agitation. Cells were first washed with 100 mM cacodylate pH 7.4 and then with TDES buffer (0.1 M Tris-HCl, pH 7.5, 25 mM DTT, 5 mM EDTA, 1.2 M sorbitol [Sigma-Aldrich, S1876]). Cells were resuspended in TDES and incubated at RT for 10 min, washed with 1 ml 0.1 M phosphocitrate/1 M sorbitol and incubated with zymolyase solution (0.5 ml phosphocitrate/sorbitol, 50 μl β-glucuronidase [Sigma-Aldrich, G0876], 25 μl of 10 mg/ml zymolyase 100 T [Seikagaku Corporation, 120,493]). Cultures were incubated in this solution for 30 min at 30°C with gentle agitation. Cultures were then washed with 0.1 M cacodylate, 5 mM CaCl2, 1 M sorbitol and embedded in 2% low-melting agarose. Blocks were then post-fixed with 1% OsO4 (Electron Microscopy Sciences, 19,110), 1% K-ferrocyanide (Sigma-Aldrich, P9387) in 0.1 M cacodylate, 5 mM CaCl2, pH 6.8 and incubated at RT for 30 min. Blocks were washed 4x in ddH2O and transferred to 1% thiocarbohydrazide (Electron Microscopy Sciences, 21,900) at RT for 5 min, then washed 4x with ddH2O. Blocks were then stained with Kellenberger’s Uranyl Acetate overnight. To prepare Kellenberger’s Uranyl Acetate, add 51 mL ddH2O, 28 mL 0.1 N HCl, and 0.5 g uranyl acetate (Electron Microscopy Sciences, 22,400) to 20 mL veronal-acetate stock (0.14 M sodium acetate [Sigma-Aldrich, S2289] and 0.14 M sodium barbiturate [Sigma-Aldrich, B0500]). Cultures were dehydrated through a graded series of ethanol (50% to 100% on ice), and transferred to 1:1 ethanol/propylene oxide for 10 min, and 100% propylene oxide 2 × 5 min. Blocks were then transferred to 1:1 propylene oxide:Spurr resin (Electron Microscopy Sciences, 14,300) for overnight incubation under vacuum. Blocks were then transferred to fresh Spurr resin for 4–6 h before being transferred to beem capsules and polymerized in fresh Spurr resin overnight, section, and post-stained with lead and uranyl acetate.
Western blotting
Western blot analysis was performed as previously described in [Citation8]. Briefly, 2 mL of mid-log phase cells with OD600 of 0.3 (~ 5 OD600 • mL) of cells were collected for each condition and resuspended in 150 μL of lysis buffer (50 mM imidazole, pH 7.4, 10 mM EDTA, 1% Triton X-100 [Sigma-Aldrich, T9284], 2 mM PMSF [Roche, 10,837,091,001], and protease inhibitor cocktail: 0.5 µg/mL pepstatin A [Sigma-Aldrich, P4265], 0.5 µg/mL chymostatin [Sigma-Aldrich, C7268], 0.5 µg/mL antipain [Sigma-Aldrich, A6191], 0.5 µg/mL leupeptin [Sigma-Aldrich, L2884], 0.5 µg/mL aprotinin [Sigma-Aldrich, A1153], 10 µM benzamidine-HCl [Sigma-Aldrich, B6506], 1 µg/mL phenanthroline [Sigma-Aldrich, P9375]). Samples were vortexed with 100 μL of glass beads for 5 min. After vortexing, 50 μL of 4x SDS Sample buffer was added and samples were boiled at 100°C for 10 min. Protein lysate (35 μL) was loaded for each condition onto a 10% SDS-PAGE gel with 0.5% 2,2,2-trichloroethanol (TCE; Sigma-Aldrich, T54801). Before transferring, TCE was activated by exposing the gel to UV light (300 nm) for 2.5 min. Cross-linked proteins were detected by 2.0 s exposure to 300-nm illumination, and used as a total protein loading control [Citation66]. Proteins were transferred to a PVDF membrane (MilliporeSigma, IPFL00010). After transfer, the PVDF membrane was rinsed with H2O and dried for 1 h prior to blocking with 3% skim milk in TBST for 30 min. Primary antibodies used include mouse monoclonal anti-mCherry (Abcam, ab125096; 1:2000 dilution) and mouse monoclonal anti-GFP (Proteintech, 66,002-1-Ig; 1:1000 dilution). Western blots were imaged using Luminata Forte Western HRP substrate (EMD Millipore, WBLUF0500) and the Chemidoc MP imaging system (Bio-Rad). Western blot images were analyzed with Image Lab v5.2.1 (Bio-Rad). Total protein load was quantified from the TCE images as follows. First, individual free mCherry bands were selected and a rolling disk background subtraction was applied with disk size = 10.0 mm. Later, the complete lane for each corresponding sample in the TCE image was selected and was analyzed with a rolling disk background subtraction with disk size = 70.0 mm. Total integrated intensity of free mCherry was normalized to the integrated intensity of total protein for each corresponding lane. Finally, for each independent experiment, all the samples were normalized to control, either cho2Δ+C1 cells or cells grown on SC.
Lipid droplet isolation
Lipid droplets were isolated as previously described in [Citation67]. Briefly, yeast cells was grown until mid-log phase (OD600 < 0.5) under the appropriate conditions/treatment as mentioned above. Since LDs are not abundant in healthy mid-log phase cells, LDs were prepared from 28 L of non-stressed mid-log phase cells and from 7 L of mid-log phase cells exposed to the stressors studied. The cells were pelleted by centrifugation (4,500 x g for 5 min), washed with water and incubated in spheroplasting buffer A (SP-A; 0.1 M Tris-SO4, pH 9.4), 1.54 mg DTT/mL) for 10 min at 30°C with shaking. Next, cells were washed with spheroplasting buffer B (SP-B; 1.2 M sorbitol, 20 mM KH2PO4, pH 7.4). Spheroplasts were generated by incubating the cells with pre-warmed SP-B buffer with 0.33 mg/ml of zymolyase-20 T (Seikagaku Corporation, 120,491), at a ratio of 6 mL SP-B/g cell wet weight, for 1 h at 30°C with shaking. Cells were concentrated by centrifugation, washed twice with cold SP-B + 2 mM PMSF and resuspended in LD-A buffer (12% Ficoll PM 400 [Sigma-Aldrich, F8016] in 10 mM MES/Tris pH 6.9, 0.2 mM EDTA, 2 mM PMSF and protease inhibitor cocktail described above) and homogenized using a 40 mL glass Dounce homogenizer (Wheaton) with a loose pestle (30 strokes at 4°C). The homogenate was diluted with 1:1 with LD-A and centrifuged at 6,000 x g for 5 min at 4°C. The resulting pellet was resuspended in LD-A buffer and subjected to another round of homogenization. The supernatants from both rounds of homogenization were subjected to another round of centrifugation as before. The final supernatant was transferred to a 13.2-ml ultracentrifuge tube (Ultra-Clear, Beckman-Coulter, 344,059), overlayered with LD-A, and subjected to ultracentrifugation at 100,000 x g for 45 min at 4°C. The crude LD (top layer) was removed and resuspended on LD-A buffer and briefly homogenized in a small 2 ml glass Dounce homogenizer (Wheaton) with 8 strokes. The crude LD homogenate was added to a new ultracentrifuge tube, overlayered with LD-B buffer (8% Ficoll PM 400, 10 mM MES, 10 nM Tris, pH 6.9, 0.2 mM EDTA, 2 mM PMSF and protease inhibitor cocktail) and centrifuged again at 100,000 x g for 30 min at 4°C. The crude LD (top layer) was removed again, resuspended on LD-B buffer and briefly homogenized in a small 2 ml glass Dounce homogenizer with 8 strokes. The second crude LD homogenate was added to the bottom of a new ultracentrifuge tube previously filled with LD-C buffer (0.25 M Sorbitol, 10 mM MES, 10 mM Tris, pH 6.9, 0.2 mM EDTA, 2 mM PMSF and protease inhibitor cocktail) and centrifuged one more time at 100,000 x g for 30 min at 4°C. The pure LD (top layer) fraction was removed, resuspended in 0.5 ml of LD-C buffer and stored at −80°C.
Lipid droplet mass spectrometry
Lipid droplets were concentrated by centrifugation at 24,000 x g at 4°C for 15 min. LDs, which floated to the top of the solution, were separated from the lower LD-free aqueous layer and resuspended in ~ 50–100 μL of LD-C buffer. Proteins in the LD preparation were then precipitated from the mixture by addition of 10x volume of ice cold 100% acetone and standing at −80°C overnight. The precipitated LD proteins were concentrated by centrifugation at 24,000 x g at 4°C for 15 min and washed twice with 1 mL cold acetone. Precipitated proteins were briefly dried at RT for 5 min, resuspended in resuspension buffer (4 M urea [Sigma-Aldrich, 33,247], 0.1 M ammonium bicarbonate, and protease inhibitors [1 mini-Complete EDTA-free tablet; Roche, 11,836,170,001]) and solubilized by sonication for 5 min in a water bath. Insoluble material in the protein homogenate was concentrated by centrifugation (24,000 x g for 5 min at 4°C) and the supernatant was removed for subsequent analysis. Ten µg of total proteins were reduced with 5 mM DTT (56°C, 30 min) and alkylated with 10 mM iodoacetamide at RT for 30 min in the dark. Excess iodoacetamide was quenched with 5 mM DTT and proteins were diluted 2-fold with 50 mM ammonium bicarbonate and digested overnight at 37°C with trypsin (Promega, V5111) added to 1:100 (w:v). The digestion was stopped by the addition of 1% TFA (final v:v). The mixture was then centrifuged at 14,000 x g for 10 min at RT to pellet precipitated lipids. Cleared supernatant was desalted on an SDB-RP Stage-Tip. Desalted peptides were dried down partially (to ∼1 μL) in a SpeedVac with no heat.
Thermo Scientific™ UltiMate™ 3000 RSLCnano system and Thermo Scientific EASY Spray™ source with Thermo Scientific™ Acclaim™ PepMap™100 2 cm x 75 μm trap column and Thermo Scientific™ EASY-Spray™ PepMap™ RSLC C18. A column (50 cm x 75 μm ID) was used to separate desalted peptides with a 5–30% acetonitrile gradient in 0.1% formic acid over 45 min at a flow rate of 250 nL/min. After each gradient, the column was washed with 90% buffer B for 10 min and re-equilibrated with 98% buffer A (0.1% formic acid, 100% HPLC-grade water) for 40 min. Thermo Scientific™ Orbitrap Fusion™ Tribrid™ mass spectrometer was used for peptide MS/MS analysis. Survey scans of peptide precursors were performed from 400 to 1575 m/z at 120 K FWHM resolution (at 200 m/z) with a 2 × 10⁵ ion count target and a maximum injection time of 50 ms. The instrument was set to run in top speed mode with 3 s cycles for the survey and the MS/MS scans. After a survey scan, tandem MS was performed on the most abundant precursors exhibiting a charge state from 2 to 6 of greater than 5 × 10³ intensity by isolating them in the quadrupole at 1.6 Th. CID fragmentation was applied with 35% collision energy and resulting fragments were detected using the rapid scan rate in the ion trap. The AGC target for MS/MS was set to 1 × 10⁴ and the maximum injection time limited to 35 ms. The dynamic exclusion was set to 45 s with a 10-ppm mass tolerance around the precursor and its isotopes. Monoisotopic precursor selection was enabled.
Raw mass spectrometric data was analyzed using the MaxQuant environment v.1.6.1.0 and employed Andromeda for database search at default settings with a few modifications [Citation68,Citation69]. The default was used for first search tolerance and main search tolerance: 20 ppm and 6 ppm, respectively. MaxQuant was set up to search the reference Saccharomyces cerevisiae (ATCC, 204,508; S288c) proteome database downloaded from Uniprot. MaxQuant performed the search trypsin digestion with up to 2 missed cleavages. Peptide, Site and Protein FDR were all set to 1% with a minimum of 1 peptide needed for Identification but 2 peptides needed to calculate a protein level ratio. The following modifications were used as variable modifications for identifications and included for protein quantification: Oxidation of methionine (M), Acetylation of the protein N-terminus, Phosphorylation of serine, threonine and tyrosine residues (STY) and Deamination for asparagine or glutamine (NQ). The Maxquant output combined folder was uploaded in Scaffold (Proteome Software) for data visualization.
Protein mass spectrometry data was further analyzed as follows. All proteins with >10 spectral counts were defined as detectable. The peptide counts for detected proteins were normalized to the total spectral count of Erg6 for each condition. Proteins were defined as enriched if they were present at levels 2.8-fold (1.5 log2) higher in LDs isolated from cells exposed to ER stress compared to LDs isolated from control (cho2Δ+C1) cells. Proteins were defined as recruited if they were present in LD preparations from cells exposed to ER stress and not detected in LDs preparations from control (cho2Δ+C1) cells. GO terms for the biological function of enriched or recruited proteins were determined using FunSpec (http://funspec.med.utoronto.ca/) [Citation70]. Proteins highlighted in bold font are predicted to contain at least one disulfide bridge using DIANNA 1.1 [Citation71].
Fluorescence microscopy
Yeast strains were grown as detailed above and concentrated by centrifuging for 30 s at 3,800 x g at RT, and 1.6 μL of cells were placed on a glass slide and covered with a #1.5 coverslip. Images were acquired with an Axioskop 2 microscope equipped with a 100x/1.4 Plan-Apochromat objective (Zeiss) and an Orca-ER cooled CCD camera (Hamamatsu) and a pE-4000 LED illumination system (coolLED) controlled by NIS Elements 4.60 Lambda software (Nikon). GFP and mCherry were excited using a 470 nm LED with a ET470/40x filter, and a 561 nm LED with a ET572/35x filter respectively (Chroma). Emission was collected through a dual eGFP/mCherry cube (Chroma, 59,222). GFP and mCherry images were deconvolved using a constrained iterative restoration algorithm assuming 507 nm and 610 nm excitation wavelength, respectively, with 100% confidence limit and 60 iterations using Volocity 6.3.
Image analysis
All image analysis and processing were performed on Volocity 6.3 (Quorum Technologies) or Fiji [Citation72]. For visualization, all images were contrast-enhanced with similar parameters in each channel. All analysis was performed on deconvolved un-enhanced images.
Colocalization: Images were thresholded, and colocalization between ER proteins and lipid droplets was quantified by measuring Manders’ overlap coefficient (R) for each cell in Volocity 6.3 [Citation73].
Line profiles
Deconvolved images were exported to Fiji. A single optical slice was selected and a line was drawn traversing the region of interest. The line profile tool was used to measure the raw fluorescent intensity across the line profile for each channel.
Integrated intensity measurements
Total integrated intensity for each fluorescent probe was measured in Volocity 6.3. Briefly, objects in the corresponding channels were identified after thresholding and appropriate size exclusion on the deconvolved images. The total integrated intensity for each probe per cell was determined by adding the voxel values over all identified objects in the cell.
Vacuolar ESCRT measurement
ESCRT puncta colocalization with the vacuole was quantified using Volocity 6.3. Briefly, objects (ESCRT and vacuole) in the corresponding channels were identified after thresholding and appropriate size exclusion on the deconvolved images. ESCRT objects that did not colocalize with the vacuole were excluded by applying an “object not touching” filter. Number and total integrated fluorescence intensity of ESCRT puncta colocalizing with the vacuole were measured.
Live imaging of µLP in cells under ER stress
A live imaging chamber for yeast was prepared essentially as described in [Citation74]. A razor blade was used to cut out a 1.5 × 1.5 cm square from a prewarmed SC agar culture plate. For drug treatments, 5 mM DTT or 2 µg/mL TM was spread onto the prewarmed SC agar plates and allowed to sink in before the agar square was removed.
Cells were grown in SC media for 5 h prior to inoculation. Cultures were inoculated to an OD of 0.0003 and grown for 16 h overnight to mid-log phase. Cells in 1 mL of mid-log culture were concentrated by centrifugation at 4,500 x g for 1 min, and resuspended in 10–20 µL of SC media, according to cell pellet size. Resuspended cells (1.6 µL) were placed on the glass coverslip bottom of an imaging dish (Bioptechs, 0420041500 C) and covered with the agar square, allowing the cells to disperse evenly. The edges of the agar square were trimmed with a razor blade to ensure that the agar made good contact with the coverslip. SC media (100 µL) with the appropriate concentration of drug was added to the top of the agar block and covered with a glass coverslip to prevent drying. The lid was placed on the dish, and the edges were sealed with parafilm. Treated cells were imaged immediately following treatment.
Images were acquired with a CSU-X1 spinning-disk confocal head (Yokogawa) mounted on a TiE Eclipse inverted microscope (Nikon Instruments, Melville, NY), equipped with a 100 × 1.49 Apo TIRF objective (Nikon) and a Zyla-sCMOS camera (Andor), controlled by NIS Elements software (Nikon). The Bioptechs dish was maintained at 30°C using a stage-top incubator (Tokai Hit). GFP and mCherry were excited with lasers at 488 nm and 561 nm respectively, and emission was collected through standard single-band filter sets. Z-stacks were acquired using a piezoelectric focus drive (Mad City Labs) with axial spacing of 0.3 µm for a depth of 5 slices (1.2 µm) and focus was stabilized using a hardware-based autofocus (PFS, Nikon). Timepoints were acquired every 6.5 s for a total of 20 min.
Growth rate analysis
Yeast cells were grown to mid-log phase in SC and were diluted to OD600 = 0.07. 10 μL culture was added into 200 μL SC containing 0.003% SDS or SC containing 0.003% SDS, 1 mM DTT, or/and 100 µM Z-Leu-Leu-Leu-al (MG132; Sigma-Aldrich, C2211) in a 96-well flat-bottom plate (Corning, 3596) [Citation75]. The final OD600 is 0.0035 in each well. The growth curves were plotted by measuring OD600 every 20 min for 72 h using a plate reader (Tecan Infinite M200). The maximum growth rate (slope) were calculated using the greatest change in OD600 over a 240-min interval using Magellan software.
Statistical analysis
GraphPad Prism7 (GraphPad Software) was used to conduct all statistical analysis and to create all graphs. All data was analyzed for normality with the D’Agostino and Pearson normality test. p values for two-group independent comparison were determined with an unpaired two-tailed Student’s t-test for parametric distributions, and unpaired Mann-Whitney test for non-parametric data. For multiple group comparisons, p values were determined with a 1-way ANOVA with Bonferroni post-hoc test or Sidak’s multiple comparisons test for parametric distributions and Kruskal-Wallis test with Dunn’s post-hoc test for non-parametric distributions. Bar graphs show the mean and SEM, while boxes indicate the middle quartiles with the midline representing the median; whiskers show the 10th and 90th percentile, and red dots represent values in the top and bottom 10th percentiles. For all tests, p values are classified as follows: *, p < 0.05; **, p < 0.01; ***, p < 0.001; ****, p < 0.0001, unless otherwise noted in the figure legends.
Abbreviations:
AAA-ATPase: ATPase associated with diverse cellular activities; ATG: autophagy-related; CMAC: 7-amino-4-chloromethylcoumarin; DTT: dithiothreitol; ER: endoplasmic reticulum; ERAD: ER-associated degradation; eroGFP: ER-targeted, redox-sensing GFP; ESCRT: endosome sorting complexes required for transport; GFPEnvy: green fluorescent protein Envy; LD: lipid droplet; µLP: microlipophagy; MVB: multivesicular body; nER: nuclear ER; PC: phosphatidylcholine; PE: phosphatidylethanolamine; RT: room temperature; SC: synthetic complete; sfGFP: superfolder GFP; TG: triglycerides; TM: tunicamycin; UPR: unfolded protein response; YPD: yeast-peptone-dextrose.
Supplemental Material
Download Zip (35.7 MB)Acknowledgments
We thank the members of the Pon laboratory as well as Drs. Ai Yamamoto, Howard Worman, Eric Schon, Theresa Swayne and Rajesh Soni (Columbia University) for support and valuable discussion. We also thank Dr. William Wickner (Dartmouth College) for support, invaluable advice and yeast strains for the work on homotypic vacuolar fusion. This work was supported by awards from the National Institutes of Health (NIH) (GM122589 and AG051047) and Muscular Dystrophy Association (MDA 314107) to LAP, NIH 5T32 GM007367 and 1F31 AR070013 to EJG, Howard Hughes Medical Institute (HHMI 56006760) to JDV and NIH/NCRR 1S10RR023454 to JMM. We thank the Proteomics Shared Resource for mass spectrometry, and the Confocal and Specialized Microscopy Shared Resource for assistance with time-lapse microscopy and image analysis. Both cores are in the Herbert Irving Comprehensive Cancer Center at Columbia University Medical Center, which is supported in part by an award from the NIH/NCI (5 P30 CA13696).
Data availability statement
The data that support the findings of this study are available from the corresponding author, L.P., upon reasonable request.
Disclosure statement
The authors declare no competing interests.
Supplementary material
Supplemental data for this article can be accessed here.
Additional information
Funding
Related Research Data
References
- Brodsky JL. Cleaning up: ER-associated degradation to the rescue. Cell. 2012 Dec 7;151(6):1163–1167. PubMed PMID: 23217703; PubMed Central PMCID: PMC3521611.
- Sikorska N, Lemus L, Aguilera-Romero A, et al. Limited ER quality control for GPI-anchored proteins. J Cell Biol. 2016 Jun 20;213(6):693–704. PubMed PMID: 27325793; PubMed Central PMCID: PMCPMC4915193.
- Ashok A, Hegde RS. Selective processing and metabolism of disease-causing mutant prion proteins. PLoS Pathog. 2009 Jun;5(6):e1000479. PubMed PMID: 19543376; PubMed Central PMCID: PMCPMC2691595
- Satpute-Krishnan P, Ajinkya M, Bhat S, et al. ER stress-induced clearance of misfolded GPI-anchored proteins via the secretory pathway. Cell. 2014 Jul 31;158(3):522–533. PubMed PMID: 25083867; PubMed Central PMCID: PMCPMC4121523.
- Kruse KB, Brodsky JL, McCracken AA. Characterization of an ERAD gene as VPS30/ATG6 reveals two alternative and functionally distinct protein quality control pathways: one for soluble Z variant of human alpha-1 proteinase inhibitor (A1PiZ) and another for aggregates of A1PiZ. Mol Biol Cell. 2006 Jan;17(1):203–212. PubMed PMID: 16267277; PubMed Central PMCID: PMCPMC1345659
- Schuck S, Gallagher CM, Walter P. ER-phagy mediates selective degradation of endoplasmic reticulum independently of the core autophagy machinery. J Cell Sci. 2014 Sep 15;127(Pt18):4078–4088. . PubMed PMID: 25052096; PubMed Central PMCID: PMCPMC4163648.
- Schafer JA, Schessner JP, Bircham PW, et al. ESCRT machinery mediates selective microautophagy of endoplasmic reticulum in yeast. Embo J. 2020 Jan 15;39(2):e102586. PubMed PMID: 31802527; PubMed Central PMCID: PMCPMC6960443.
- Vevea JD, Garcia EJ, Chan RB, et al. Role for lipid droplet biogenesis and microlipophagy in adaptation to lipid imbalance in yeast. Dev Cell. 2015 Dec 7;35(5):584–599. PubMed PMID: 26651293; PubMed Central PMCID: PMCPMC4679156.
- Welte MA, Gould AP. Lipid droplet functions beyond energy storage. Biochim Biophys Acta. 2017 Oct;1862(10 Pt B):1260–1272. . PubMed PMID: 28735096; PubMed Central PMCID: PMCPMC5595650. eng
- Moldavski O, Amen T, Levin-Zaidman S, et al. Lipid droplets are essential for efficient clearance of cytosolic inclusion bodies. Dev Cell. 2015 Jun 8;33(5):603–610. PubMed PMID: 26004510.
- Cole NB, Murphy DD, Grider T, et al. Lipid droplet binding and oligomerization properties of the Parkinson’s disease protein alpha-synuclein. J Biol Chem. 2002 Feb 22;277(8):6344–6352. PubMed PMID: 11744721; eng.
- Gomez-Ramos P, Asuncion Moran M. Ultrastructural localization of intraneuronal Abeta-peptide in Alzheimer disease brains. J Alzheimers Dis. 2007 Mar;11(1):53–59. PubMed PMID: 17361035; eng
- Ohsaki Y, Cheng J, Fujita A, et al. Cytoplasmic lipid droplets are sites of convergence of proteasomal and autophagic degradation of apolipoprotein B. Mol Biol Cell. 2006 Jun;17(6):2674–2683. PubMed PMID: 16597703; PubMed Central PMCID: PMCPMC1474802. eng.
- Velazquez AP, Tatsuta T, Ghillebert R, et al. Lipid droplet-mediated ER homeostasis regulates autophagy and cell survival during starvation. J Cell Biol. 2016 Mar 14;212(6):621–631. PubMed PMID: 26953354; PubMed Central PMCID: PMCPMC4792078.
- Thibault G, Shui G, Kim W, et al. The membrane stress response buffers lethal effects of lipid disequilibrium by reprogramming the protein homeostasis network. Mol Cell. 2012 Oct 12;48(1):16–27. PubMed PMID: 23000174; PubMed Central PMCID: PMCPMC3496426.
- Sakai Y, Koller A, Rangell LK, et al. Peroxisome degradation by microautophagy in Pichia pastoris: identification of specific steps and morphological intermediates. J Cell Biol. 1998 May 4;141(3):625–636. PubMed PMID: 9566964; PubMed Central PMCID: PMCPMC2132739. eng
- Roberts P, Moshitch-Moshkovitz S, Kvam E, et al. Piecemeal microautophagy of nucleus in Saccharomyces cerevisiae. Mol Biol Cell. 2003 Jan;14(1):129–141. PubMed PMID: 12529432; PubMed Central PMCID: PMCPMC140233. eng.
- Kissova I, Salin B, Schaeffer J, et al. Selective and non-selective autophagic degradation of mitochondria in yeast. Autophagy. 2007 Jul-Aug;3(4):329–336. PubMed PMID: 17377488; eng
- van Zutphen T, Todde V, de Boer R, et al. Lipid droplet autophagy in the yeast Saccharomyces cerevisiae. Mol Biol Cell. 2014 Jan;25(2):290–301. PubMed PMID: 24258026; PubMed Central PMCID: PMCPMC3890349.
- Wang CW, Miao YH, Chang YS. A sterol-enriched vacuolar microdomain mediates stationary phase lipophagy in budding yeast. J Cell Biol. 2014 Aug 04;206(3):357–366. . PubMed PMID: 25070953; PubMed Central PMCID: PMCPMC4121974. eng.
- Muller O, Sattler T, Flotenmeyer M, et al. Autophagic tubes: vacuolar invaginations involved in lateral membrane sorting and inverse vesicle budding. J Cell Biol. 2000 Oct 30;151(3):519–528. PubMed PMID: 11062254; PubMed Central PMCID: PMCPMC2185586. eng
- Mijaljica D, Prescott M, Devenish RJ. Microautophagy in mammalian cells: revisiting a 40-year-old conundrum. Autophagy. 2011 Jul 7;7:673–682. PubMed PMID: 21646866; eng
- Kawamura N, Sun-Wada GH, Aoyama M, et al. Delivery of endosomes to lysosomes via microautophagy in the visceral endoderm of mouse embryos. Nat Commun. 2012;3:1071. . PubMed PMID: 22990867; eng
- Oku M, Maeda Y, Kagohashi Y, et al. Evidence for ESCRT- and clathrin-dependent microautophagy. J Cell Biol. 2017 Aug 24;216(10):3263–3274. PubMed PMID: 28838958; PubMed Central PMCID: PMCPMC5626533. eng.
- Vietri M, Radulovic M, Stenmark H. The many functions of ESCRTs. Nat Rev Mol Cell Biol. 2019 Nov 8. DOI:https://doi.org/10.1038/s41580-019-0177-4. PubMed PMID: 31705132.
- Tsuji T, Fujimoto M, Tatematsu T, et al. Niemann-Pick type C proteins promote microautophagy by expanding raft-like membrane domains in the yeast vacuole. Elife. 2017 Jun 7;6. DOI:https://doi.org/10.7554/eLife.25960 PubMed PMID: 28590904; PubMed Central PMCID: PMCPMC5462540.
- Klionsky DJ, Abdalla FC, Abeliovich H, et al. Guidelines for the use and interpretation of assays for monitoring autophagy. Autophagy 2012 Apr 1;8(4):445–544. PubMed PMID: 22966490; PubMed Central PMCID: PMCPMC3404883. eng.
- Kirisako T, Baba M, Ishihara N, et al. Formation process of autophagosome is traced with Apg8/Aut7p in yeast. J Cell Biol. 1999 Oct 18;147(2):435–446. PubMed PMID: 10525546; PubMed Central PMCID: PMCPMC2174223. eng
- Suzuki K, Kirisako T, Kamada Y, et al. The pre-autophagosomal structure organized by concerted functions of APG genes is essential for autophagosome formation. Embo J. 2001 Nov 1;20(21):5971–5981. PubMed PMID: 11689437; PubMed Central PMCID: PMCPMC125692. eng.
- Straub M, Bredschneider M, Thumm M. AUT3, a serine/threonine kinase gene, is essential for autophagocytosis in Saccharomyces cerevisiae. J Bacteriol. 1997 Jun;179(12):3875–3883. PubMed PMID: 9190802; PubMed Central PMCID: PMCPMC179195. eng
- Matsuura A, Tsukada M, Wada Y, et al. Apg1p, a novel protein kinase required for the autophagic process in Saccharomyces cerevisiae. Gene. 1997 Jun 19;192(2):245–250. PubMed PMID: 9224897; eng
- Stauffer B, Powers T. Target of rapamycin signaling mediates vacuolar fragmentation. Curr Genet. 2017 Feb;63(1):35–42. . PubMed PMID: 27233284; PubMed Central PMCID: PMCPMC5124550
- Toulmay A, Prinz WA. Direct imaging reveals stable, micrometer-scale lipid domains that segregate proteins in live cells. J Cell Biol. 2013 Jul 08;202(1):35–44. . PubMed PMID: 23836928; PubMed Central PMCID: PMCPMC3704982.
- Christ L, Raiborg C, Wenzel EM, et al. Cellular functions and molecular mechanisms of the ESCRT membrane-scission machinery. Trends Biochem Sci. 2017 Jan;42(1):42–56. PubMed PMID: 27669649; eng.
- Schoneberg J, Pavlin MR, Yan S, et al. ATP-dependent force generation and membrane scission by ESCRT-III and Vps4. Science. 2018 Dec 21;362(6421):1423–1428. PubMed PMID: 30573630; PubMed Central PMCID: PMCPMC6309985. eng.
- Currie E, Guo X, Christiano R, et al. High confidence proteomic analysis of yeast LDs identifies additional droplet proteins and reveals connections to dolichol synthesis and sterol acetylation. J Lipid Res. 2014 Jul;55(7):1465–1477. PubMed PMID: 24868093; PubMed Central PMCID: PMCPMC4076087.
- Kraemer DM, Strambio-de-Castillia C, Blobel G, et al. The essential yeast nucleoporin NUP159 is located on the cytoplasmic side of the nuclear pore complex and serves in karyopherin-mediated binding of transport substrate. J Biol Chem. 1995 Aug 11;270(32):19017–19021. PubMed PMID: 7642562; eng
- Albright CF, Robbins RW. The sequence and transcript heterogeneity of the yeast gene ALG1, an essential mannosyltransferase involved in N-glycosylation. J Biol Chem. 1990 Apr 25;265(12):7042–7049. PubMed PMID: 2182636; eng
- Manford AG, Stefan CJ, Yuan HL, et al. ER-to-plasma membrane tethering proteins regulate cell signaling and ER morphology. Dev Cell. 2012 Dec 11;23(6):1129–1140. PubMed PMID: 23237950; eng.
- Cronin SR, Rao R, Hampton RY. Cod1p/Spf1p is a P-type ATPase involved in ER function and Ca2+ homeostasis. J Cell Biol. 2002;157(6):1017.
- Dahlqvist A, Stahl U, Lenman M, et al. Phospholipid:diacylglycerolacyltransferase: an enzyme that catalyzes the acyl-CoA-independent formation of triacylglycerol in yeast and plants. Proc Natl Acad Sci U S A. 2000 Jun 6;97(12):6487–6492. PubMed PMID: 10829075; PubMed Central PMCID: PMCPMC18631.
- Oelkers P, Cromley D, Padamsee M, et al. The DGA1 gene determines a second triglyceride synthetic pathway in yeast. J Biol Chem. 2002 Mar 15;277(11):8877–8881. PubMed PMID: 11751875.
- Sorger D, Daum G. Synthesis of triacylglycerols by the acyl-coenzyme A: diacyl-glycerolacyltransferase Dga1p in lipid particles of the yeast Saccharomyces cerevisiae. J Bacteriol. 2002 Jan;184(2):519–524. . PubMed PMID: 11751830; PubMed Central PMCID: PMCPMC139573
- Jacquier N, Choudhary V, Mari M, et al. Lipid droplets are functionally connected to the endoplasmic reticulum in Saccharomyces cerevisiae. J Cell Sci. 2011 Jul 15;124(Pt14):2424–2437. PubMed PMID: 21693588.
- Braun S, Matuschewski K, Rape M, et al. Role of the ubiquitin-selective CDC48(UFD1/NPL4)chaperone (segregase) in ERAD of OLE1 and other substrates. Embo J. 2002 Feb 15;21(4):615–621. PubMed PMID: 11847109; PubMed Central PMCID: PMCPMC125867
- Garza RM, Sato BK, Hampton RY. In vitro analysis of Hrd1p-mediated retrotranslocation of its multispanning membrane substrate 3-hydroxy-3-methylglutaryl (HMG)-CoA reductase. J Biol Chem. 2009 May 29;284(22):14710–14722. . PubMed PMID: 19324879; PubMed Central PMCID: PMCPMC2685653.
- Vashistha N, Neal SE, Singh A, et al. Direct and essential function for Hrd3 in ER-associated degradation. Proc Natl Acad Sci U S A. 2016 May 24;113(21):5934–5939. PubMed PMID: 27170191; PubMed Central PMCID: PMCPMC4889393.
- Haas A, Scheglmann D, Lazar T, et al. The GTPase Ypt7p of Saccharomyces cerevisiae is required on both partner vacuoles for the homotypic fusion step of vacuole inheritance. Embo J. 1995 Nov 1;14(21):5258–5270. PubMed PMID: 7489715; PubMed Central PMCID: PMCPMC394635
- Schimmoller F, Riezman H. Involvement of Ypt7p, a small GTPase, in traffic from late endosome to the vacuole in yeast. J Cell Sci. 1993 Nov;106(Pt 3):823–830. PubMed PMID: 8308065.
- Seals DF, Eitzen G, Margolis N, et al. A Ypt/Rab effector complex containing the Sec1 homolog Vps33p is required for homotypic vacuole fusion. Proc Natl Acad Sci U S A. 2000 Aug 15;97(17):9402–9407. PubMed PMID: 10944212; PubMed Central PMCID: PMCPMC16876.
- Peplowska K, Markgraf DF, Ostrowicz CW, et al. The CORVET tethering complex interacts with the yeast Rab5 homolog Vps21 and is involved in endo-lysosomal biogenesis. Dev Cell. 2007 May;12(5):739–750. PubMed PMID: 17488625.
- Srivastava A, Jones EW. Pth1/Vam3p is the syntaxin homolog at the vacuolar membrane of Saccharomyces cerevisiae required for the delivery of vacuolar hydrolases. Genetics. 1998 Jan;148(1):85–98. PubMed PMID: 9475723; PubMed Central PMCID: PMCPMC1459781
- Lee CW, Wilfling F, Ronchi P, et al. Selective autophagy degrades nuclear pore complexes. Nat Cell Biol. 2020 Feb;22(2):159–166. PubMed PMID: 32029894.
- Olzmann JA, Carvalho P. Dynamics and functions of lipid droplets. Nat Rev Mol Cell Biol. 2019 Mar;20(3):137–155. . PubMed PMID: 30523332; PubMed Central PMCID: PMCPMC6746329.
- Zhu L, Jorgensen JR, Li M, et al. ESCRTs function directly on the lysosome membrane to downregulate ubiquitinated lysosomal membrane proteins. Elife. 2017 Jun 29;6. DOI:https://doi.org/10.7554/eLife.26403 PubMed PMID: 28661397; PubMed Central PMCID: PMCPMC5507667. eng.
- Sherman F. Getting started with yeast. Methods Enzymol. 2002;350:3–41. PubMed PMID: 12073320; eng
- Teng X, Dayhoff-Brannigan M, Cheng WC, et al. Genome-wide consequences of deleting any single gene. Mol Cell. 2013 Nov 21;52(4):485–494. PubMed PMID: 24211263; PubMed Central PMCID: PMCPMC3975072.
- Longtine MS, McKenzie A 3rd, Demarini DJ, et al. Additional modules for versatile and economical PCR-based gene deletion and modification in Saccharomyces cerevisiae. Yeast. 1998 Jul;14(10):953–961. PubMed PMID: 9717241; eng.
- Gauss R, Trautwein M, Sommer T, et al. New modules for the repeated internal and N-terminal epitope tagging of genes in Saccharomyces cerevisiae. Yeast. 2005 Jan 15;22(1):1–12. PubMed PMID: 15565729; eng.
- Slubowski CJ, Funk AD, Roesner JM, et al. Plasmids for C-terminal tagging in Saccharomyces cerevisiae that contain improved GFP proteins, Envy and Ivy. Yeast. 2015 Apr;32(4):379–387. PubMed PMID: 25612242; PubMed Central PMCID: PMCPMC4390471. eng.
- Young CL, Raden DL, Caplan JL, et al. Cassette series designed for live-cell imaging of proteins and high-resolution techniques in yeast. Yeast. 2012;29(3–4):119–136. PubMed PMID: 22473760
- Lajoie P, Moir RD, Willis IM, et al. Kar2p availability defines distinct forms of endoplasmic reticulum stress in living cells. Mol Biol Cell. 2012 Mar;23(5):955–964. PubMed PMID: 22219379; PubMed Central PMCID: PMCPMC3290652. eng.
- Adell MAY, Migliano SM, Upadhyayula S, et al. Recruitment dynamics of ESCRT-III and Vps4 to endosomes and implications for reverse membrane budding. Elife. 2017 Oct 11;6. DOI:https://doi.org/10.7554/eLife.31652 PubMed PMID: 29019322; PubMed Central PMCID: PMCPMC5665648. eng.
- Voth WP, Richards JD, Shaw JM, et al. Yeast vectors for integration at the HO locus. Nucleic Acids Res. 2001 Jun 15;29(12): E59-9. PubMed PMID: 11410682; PubMed Central PMCID: PMCPMC55758
- Perkins EM, McCaffery JM. Conventional and immunoelectron microscopy of mitochondria. Methods Mol Biol. 2007;372:467–483. PubMed PMID: 18314746; eng
- Ladner CL, Yang J, Turner RJ, et al. Visible fluorescent detection of proteins in polyacrylamide gels without staining. Anal Biochem. 2004 Mar 01;326(1):13–20. PubMed PMID: 14769330.
- Schmidt C, Ploier B, Koch B, et al. Analysis of yeast lipid droplet proteome and lipidome. Methods Cell Biol. 2013;116:15–37. . PubMed PMID: 24099285; eng
- Cox J, Mann M. MaxQuant enables high peptide identification rates, individualized p.p.b.-range mass accuracies and proteome-wide protein quantification. Nat Biotechnol. 2008 Dec;26(12):1367–1372. PubMed PMID: 19029910
- Cox J, Neuhauser N, Michalski A, et al. Andromeda: a peptide search engine integrated into the MaxQuant environment. J Proteome Res. 2011 Apr 1;10(4):1794–1805. PubMed PMID: 21254760.
- Robinson MD, Grigull J, Mohammad N, et al. FunSpec: a web-based cluster interpreter for yeast. BMC Bioinformatics. 2002 Nov 13;3:35. PubMed PMID: 12431279; PubMed Central PMCID: PMCPMC139976. eng
- Ferre F, Clote P. DiANNA 1.1: an extension of the DiANNA web server for ternary cysteine classification. Nucleic Acids Res. 2006 Jul 1;34(Web Server issue):W182–5. PubMed PMID: 16844987; PubMed Central PMCID: PMCPMC1538812. eng.
- Schindelin J, Arganda-Carreras I, Frise E, et al. Fiji: an open-source platform for biological-image analysis. Nat Methods. 2012 Jun 28;9(7):676–682. PubMed PMID: 22743772; PubMed Central PMCID: PMCPMC3855844.
- Dunn KW, Kamocka MM, McDonald JH. A practical guide to evaluating colocalization in biological microscopy. Am J Physiol Cell Physiol. 2011 Apr;300(4):C723–42. . PubMed PMID: 21209361; PubMed Central PMCID: PMCPMC3074624. eng
- Davidson R, Liu Y, Gerien KS, et al. Real-time visualization and quantification of contractile ring proteins in single living cells. Methods Mol Biol. 2016;1369:9–23. . PubMed PMID: 26519302; PubMed Central PMCID: PMCPMC5312653
- Liu C, Apodaca J, Davis LE, et al. Proteasome inhibition in wild-type yeast Saccharomyces cerevisiae cells. Biotechniques. 2007 Feb;422:158. PubMed PMID: 17373478 160, 162.