
ABSTRACT
RNF5 is implicated in ERAD and in negative regulation of macroautophagy/autophagy. To better understand the function of RNF-5 under ER-stress conditions, we studied the ability of Caenorhabditis elegans rnf-5(tm794) mutant animals to cope with stress in the background of impaired UPR machinery. We demonstrate that downregulation of RNF-5 decreased sensitivity to tunicamycin both in wild type and in an ire-1 mutant. Double-mutant rnf-5;ire-1 animals showed increased starvation resistance and extended lifespan when compared to the ire-1 mutant. This partial rescue of ire-1 required functional autophagy. Downregulation of RNF-5 rescued ER maturation defects and protein secretion of a DAF-28::GFP intestinal reporter in the ire-1 background. Proteomics and functional studies revealed an increase in lysosomal protease levels, in the frequency of intestinal lysosomes, and in lysosomal protease activity in rnf-5(tm794) animals. Together, these data suggest that RNF-5 is a negative regulator of ER stress, and that inactivation of RNF-5 promotes IRE-1-independent elevation of ER capacity.
Introduction
Endoplasmic reticulum (ER) stress is caused primarily by an increase in misfolded protein load in the ER. The unfolded protein response (UPR) [Citation1,Citation2] and ER-associated degradation (ERAD) [Citation3] are key interconnected quality-control pathways that sense and respond to ER stress and act in coordination to resolve the stress in this organelle [Citation2,Citation4]. One hallmark of the UPR is the activation of a set of stress-regulated transcription factors, that transcribe genes that promote protein folding (via expression of ER-resident protein chaperones), as well as protein degradation (via expression of proteins related to proteasome function, ERAD and autophagy) [Citation2,Citation4]. Together, the UPR orchestrates and coordinates between quality-control pathways that sense and respond to ER stress. The main sensor of the UPR is the ER membrane protein ERN1/IRE1, a type-I transmembrane ER-resident protein highly conserved along evolution [Citation5,Citation6]. In C. elegans the UPR system maintains ER homeostasis during development and under stress [Citation7,Citation8]. In normal growth conditions ire-1 mutant animals develop slowly [Citation7,Citation8], exhibit impaired secretory protein metabolism [Citation9], have a shortened lifespan [Citation10] and fail to recover from starvation-induced developmental arrest [Citation11].
Macroautophagy/autophagy is an evolutionarily conserved process of degradation of cytoplasmic components by the lysosome, including organelles and long-lived misfolded proteins. This process enables the recycling of amino acids, carbohydrates, lipids, and nucleotides as well as the removal of aberrant macromolecules and organelles. In this way, autophagy contributes to the health and functionality of cells and organisms [Citation12,Citation13]. Autophagy involves the formation of a double-membrane organelles which transport intracellular components to the lysosome for degradation [Citation12,Citation13]. More than 30 autophagy-related (ATG) genes have been identified to be required for the process of autophagy in S. cerevisiae, most of which are conserved from yeast to mammals [Citation14,Citation15]. Autophagy is induced by the activation of a serine/threonine protein kinase complex. Nucleation of the phagophore requires the class III phosphatidylinositol 3-kinase Vps34-containing complex, which includes Vps30/Atg6/BEC-1, Vps34/VPS-34, Vps15/VPS-15, Atg14/EPG-8 and Atg38. Expansion of the phagophore in yeast requires two ubiquitin-like conjugation systems resulting in the ubiquitin-like protein Atg8 (in C. elegans LGG-1 and LGG-2) to be conjugated to phosphatidylethanolamine (PE), with the aid of Atg4 cysteine proteases, the E1-like activating enzyme Atg7 and the E2-like conjugating enzyme, Atg3 [Citation14,Citation15]. Orthologs to all of these components exist in C. elegans [Citation16]. While autophagy occurs at a basal constitutive level to mediate global turnover of cytoplasmic materials [Citation17], it can be further induced in response to nutrient deprivation and prevents amino acid insufficiency as well as energy production, both of which are essential for survival and adaptation to starvation [Citation18,Citation19]. Autophagy is also induced by other stresses, such as ER stress [Citation20–25]. In this case, autophagy induction may be used to eliminate misfolded proteins that exceed the ERAD capacity for their clearance [Citation26,Citation27].
The ERN1/IRE1-MAPK/JNK pathway has been demonstrated to promote autophagy activation following ER stress [Citation21]. Specifically, activated ERN1/IRE1α can result in MAPK/JNK‐mediated phosphorylation of BCL2, thereby disrupting the BECN1-BCL2 inhibitory complex [Citation28–30]. This frees BECN1 to form the PIK3C3/Vps34-BECN1 complex to promote vesicle nucleation, a critical step in the generation of the phagophore [Citation31,Citation32]. In addition, activated ERN1 removes an inhibitory intron from the XBP1 transcript, generating the transcription factor spliced XBP1, which promotes the transcription of BECN1 [Citation33]. Neuronal XBP-1 activates intestinal lysosomes to improve proteostasis in C. elegans [Citation34]. Furthermore, additional stages in the process of autophagy such as autophagy induction, vesicle nucleation, and elongation are regulated by UPR components as well as by Ca2+ signaling [Citation35,Citation36].
RNF5 is a highly conserved E3 ubiquitin ligase implicated in clearance of misfolded proteins from the ER through the ERAD pathway [Citation37–39]. One of the most established substrates of the mammalian RNF5 is the ERAD substrate CFTRΔF508, a mutant form of CFTR (CF transmembrane conductance regulator) [Citation37,Citation40–42]. RNF5 has been demonstrated to regulate glutamine carrier proteins, which are aberrantly folded following chemotherapy-induced ER stress [Citation43]. RNF5 mediates viral-triggered ubiquitination and degradation of STING1/MITA [Citation44] and MAVS/VISA [Citation45] acting as a negative regulator of type I IFNs induction during cellular antiviral response [Citation45]. Importantly, a recent study has demonstrated that Rnf5-deleted mice exhibit attenuated activation of key UPR components but increased expression of ER-stress markers in the intestine, including the ER chaperone BIP [Citation46]. A cDNA library screen using a yeast-based functional assay for ATG4B inhibitors identified RNF5 and highlighted its role in the negative regulation of autophagy [Citation47]. The study demonstrated that RNF5 functions to limit basal levels of autophagy in cultured cells, mice and C. elegans by ubiquitination and degradation of a membrane-associated pool of ATG4B and subsequent control of LC3 processing [Citation47]. In C. elegans, RNF-5 regulates the molting process through regulation of the dense body protein UNC-95 [Citation48,Citation49] and modulates cell migration similarly to the mammalian ortholog [Citation50,Citation51]. We have shown that the role of RNF5 in autophagy is conserved along evolution and downregulation of RNF-5 in C. elegans increases autophagy [Citation47]. In this study, we investigated the molecular mechanisms by which RNF-5 contributes to the maintenance of ER homeostasis. We show that downregulation of RNF-5 increased ER stress resistance and partially rescued ire-1 mutant animals in an autophagy-dependent manner.
Results
Increased ER stress resistance of rnf-5(tm794) mutant animals
We have previously demonstrated that RNF-5 is a negative regulator of autophagy both in C. elegans and mammalian systems through its regulation of ATG4B [Citation47]. In order to examine if the increase in autophagy induced by RNF-5 depletion also enables animals to better cope with ER stress, we examined if downregulation of RNF-5 affects sensitivity to ER stress. Growing rnf-5(tm794) deletion mutant in media containing the ER stress inducer tunicamycin resulted in a better ability of the mutant animals to develop to L4 larvae and adults when compared to wild type animals. This rescue was limited to mild ER stress (tunicamycin ≤2 µg/ml) as rnf-5(tm794) animals exhibited similar sensitivity as wild type animals in tunicamycin concentrations of ≥3 µg/ml resulting in developmental arrest ().
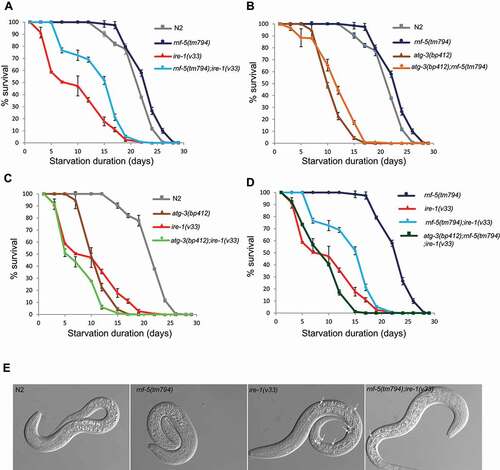
Figure 1. Inactivation of RNF-5 increases resistance to tunicamycin when autophagy is intact and partially rescues ire-1 mutant animals. (A) N2 (wild-type) and rnf-5(tm794) embryos were treated with the indicated concentrations of tunicamycin. L4 larvae and adult animals were counted after 72 h incubation at 20°C. The mean values and SEM are shown. p < 0.001(**), and p < 0.0001 (***) by t-test. (B) N2 and rnf-5(tm794) embryos were treated with 1.5 µg/ml tunicamycin on RNAi plates of the autophagy genes indicated. The mean values and SEM are shown. Statistical significance was calculated by one-way ANOVA F(13,76) = 22.19, P value < 0.0001, followed by Tukey’s multiple comparisons test p < 0.02 (*), p < 0.0005(**), and p < 0.0001 (***). (C) Double mutant rnf-5;ire-1 improves development under physiological conditions and ER stress when compared to single ire-1 mutant. N is the total number of plates analyzed (~150 embryos/plate) in 3–5 experiments. The mean values and SEM are shown. Statistical significance was calculated by one-way ANOVA F(7,157) = 22.79, P value < 0.0001, followed by Tukey’s multiple comparisons test p < 0.03 (*), p < 0.007(**), and p < 0.0001 (***)
To examine the relation between the increased ER stress resistance of rnf-5(tm794) to the known role of RNF-5 in autophagy, we examined sensitivity to 1.5 µg/ml tunicamycin following down-regulation of autophagy genes by RNAi. Both wild-type and rnf-5(tm794) animals became more sensitive to tunicamycin following atg-4.1, atg-4.2, bec-1, atg-7 and lgg-1 RNAi (). There was no inhibition of growth on solvent DMSO RNAi plates (Fig. S1). In general, rnf-5(tm794) showed higher resistance compared to wild type in most of the conditions, but when lgg-1 was downregulated or both atg-4.1 (ortholog to the human ATG4A and ATG4B) and atg-4.2 (ortholog to the human ATG4C) were co-downregulated, rnf-5(tm794) animals lost their resistance and showed sensitivity similar to wild-type animals. This data suggests that the ability of downregulation of RNF-5 to increase resistance to ER stress depends on functional autophagy.
rnf-5 knockout partially rescues the ire-1 mutant animals with impaired UPR
To elucidate the association between elevated ER stress resistance and the unfolded protein response (UPR) in rnf-5(tm794) mutant animals we next analyzed mutants with impaired UPR. The IRE-1 stress sensor plays a key role in maintaining ER homeostasis by initiating the signaling through the IRE-1/XBP-1 arm of the UPR and is required for cell-survival after tunicamycin-induced ER-stress [Citation7]. We examined the ability of rnf-5;ire-1 double mutants to develop in the presence of tunicamycin. While 70 ± 2.5% of ire-1(v33) mutant animals developed to L4 and adults in DMSO control plates, only 60 ± 3.5% developed in mild ER stress (1 µg/ml tunicamycin). In this concentration of tunicamycin 77 ± 2.3% of WT animals developed normally. Double mutant rnf-5(tm794);ire-1(v33) rescued the developmental arrest in DMSO control plates as well as the sensitivity of ire-1(v33) to 1 µg/ml tunicamycin to 81 ± 2.4% and 72 ± 3.1% respectively ( and Table S1).
Similarly, we examined the ability of rnf-5; ire-1 double mutants to recover from a prolonged heat shock, which is associated with proteostasis stress in various cellular organelles including the ER. We performed heat shock experiments on WT, rnf-5 and ire-1 single mutant and ire-1;rnf-5 double mutants (Fig. S2). Surprisingly, under acute heat shock conditions (37°C for 5 h 30 min), we found that rnf-5 mutant animals showed a trend of higher sensitivity to heat shock compared to WT. We hypothesize that the basal high levels of autophagy in rnf-5 mutant animals along with the additional induction of autophagy by heat shock conditions probably resulted in excessive autophagy, leading to lower thermo-resistance. In contrast, ire-1; rnf-5 double mutants showed increased thermo-resistance compared to single mutants and to WT animals. This result highlights the benefits provided by rnf-5 depletion in ire-1 deficient animals, whose ERAD and lysosome functions are compromised.
We next assayed another stress condition, the ability of L1 animals to complete normal development when returned to food following starvation. L1 larvae reversibly arrest development in response to starvation [Citation52]. This starvation-induced quiescence increases stress resistance [Citation11]. Different mutants exhibit difference in starvation survival, for example daf-2 mutants survive longer in starvation than wild type [Citation53,Citation54] and IRE-1 is essential for recovery from L1 arrest [Citation11]. While wild type and rnf-5(tm794) animals resumed development after 21.8 ± 0.2 and 23.3 ± 0.2 days of starvation respectively, ire-1(v33) mutant animals accumulated dead cell vacuoles () and could develop to adults only after maximum 10.2 ± 0.5 days of starvation. Interestingly, rnf-5(tm794);ire-1(v33) double mutants displayed a dramatically improved survival of 15.2 ± 0.3 days ( and Table S2). To determine the requirement for autophagy in this process we next performed L1 starvation assay in the background of atg-3(bp412), a hypomorphic atg-3 allele [Citation55,Citation56]. ATG-3 is an ortholog of human ATG3 and is predicted to have Atg8 ligase activity [Citation57,Citation58]. Autophagy is required to resist starvation [Citation59] and indeed the survival of atg-3(bp412) animals was similar to ire-1(v33). In contrast to ire-1(v33), double mutant with rnf-5(tm794) did not improve the atg-3(bp412) phenotype suggesting that functional autophagy is required for rescuing the starved L1s (). Double and triple mutants ire-1(v33); atg-3(bp412) and ire-1(v33); atg-3(bp412);rnf-5(tm794) developed to adults similarly to ire-1(v33) (). When analyzed under ER stress conditions the double mutant atg-3(bp412);rnf-5(tm794) did not improve the weak sensitivity of atg-3(bp412) to mild ER stress (tunicamycin ≤2 µg/ml) (Fig. S3). We conclude that autophagy contributes to the rescue of ire-1;rnf-5 double mutant ability to overcome L1 starvation.
Figure 2. Increased survival of L1 arrest in double mutant ire-1;rnf-5 compared to ire-1 single mutant. (A) Survival rates of rnf-5;ire-1 double mutant are higher than ire-1 single mutant. (B) Survival rates of atg-3 single mutant and atg-3;rnf-5 double mutant are lower than wild-type and rnf-5 single mutant. (C) Survival rates of atg-3;ire-1 double mutant are lower than single atg-3 or ire-1 mutants. (D) Survival rates of atg-3(bp412);rnf-5(tm794);ire-1(v33) triple mutant are lower than rnf-5(tm794);ire-1(v33) double mutant. Animals were incubated in M9 buffer without food for the indicated time points and then dropped on plates with OP50 bacteria (food). The percentage of worms developed into L4 larvae and adults during 3 days of re-feeding is shown. Errors bars are the SEs at each time point indicated. (E) DIC images at day 10 of L1 arrest. Arrows point to dying cells
rnf-5 knockout increases the lifespan of ire-1 mutant animals
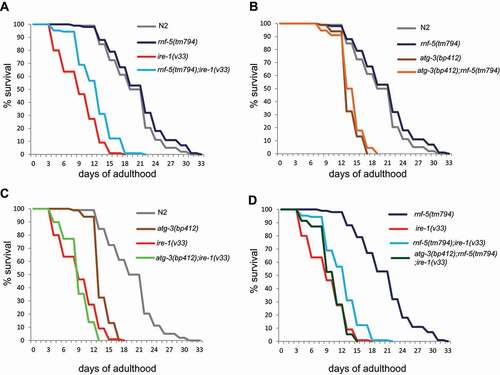
The lifespan of ire-1(v33) animals is much shorter (9.4 ± 0.3 days) when compared to wild type and rnf-5(tm794) (20 ± 0.5 and 21.1 ± 0.5 days, respectively), but in double mutant rnf-5(tm794);ire-1(v33) the lifespan was extended to 12.5 ± 0.3 days ( and Table S3). Similarly to the starvation assay, also the lifespan of atg-3(bp412) was shorter while double mutant atg-3(bp412);rnf-5(tm794) did not rescue the short lifespan of atg-3 mutant animals (13.9 ± 0.2 and 14.1 ± 0.2 days respectively; ). In addition, downregulation of autophagy did not further decrease ire-1 mutant lifespan (). Importantly, we find that autophagy is required for the extension of ire-1 mutant lifespan by downregulation of RNF-5 as the triple mutant atg-3(bp412);rnf-5(tm794);ire-1(v33) had a shorter lifespan (10.5 ± 0.3 days) when compared to rnf-5;ire-1 double mutant (). In summary, we conclude that the knockout of rnf-5 extends the lifespan of ire-1 mutant worms in an atg-3 dependent manner.
Figure 3. Extended lifespan of double mutant ire-1;rnf-5 compared to ire-1 single mutant. (A) Lifespan extension of rnf-5;ire-1 double mutant compared to ire-1 single mutant. (B) Lifespan of atg-3 single mutant and atg-3;rnf-5 double mutant is shorter compared to wild-type and rnf-5 single mutant. (C) Lifespan of atg-3;ire-1 double mutant is shorter than single atg-3 or ire-1 mutants. (D) Lifespan of atg-3(bp412);rnf-5(tm794);ire-1(v33) triple mutant are shorter than rnf-5(tm794);ire-1(v33) double mutant
Knockout of rnf-5 improved ER function in ire-1 mutant animals
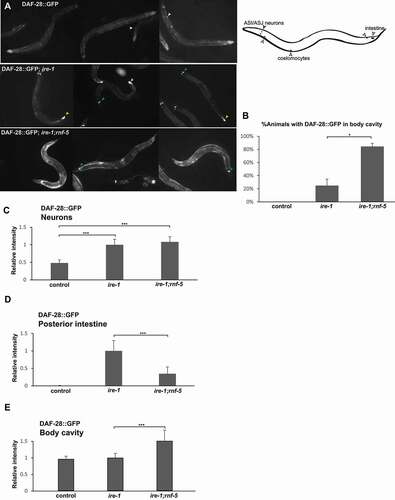
IRE-1 plays a central role in secretory protein metabolism also under normal growth conditions [Citation9]. To better understand how downregulation of RNF-5 affects protein secretion in ire-1 mutant animals we analyzed the daf-28p::DAF-28::GFP reporter [Citation60,Citation61]. DAF-28 is one of the worm insulins. In wild-type animals DAF-28::GFP is produced in several anterior sensory neurons and in the posterior intestine and secreted to the coelom. The coelomocytes uptake and remove the secreted protein from the body cavity. In wild-type animals, a GFP signal is detected in anterior sensory neurons, the posterior intestine and in coelomocytes. There is only a weak signal in the body cavity since the reporter is rapidly removed by the coelomocyte cells following its secretion. As previously described [Citation9], in ire-1 mutant worms the reporter accumulates in the producing cells leading to relatively high signal in the anterior sensory neurons and posterior intestine. In these animals, the DAF-28::GFP reporter is not secreted from the producing cells due to abnormal ER function in ire-1 mutant and therefore there is only a low signal in the body cavity. However, we found that in ire-1;rnf-5 double mutants more than 80% of the animals had DAF-28::GFP fluorescence in the body cavity () suggesting an increased secretion of the DAF-28::GFP from the producing cells, but no clearance by the coelomocytes (coelomocytes are present in ire-1 mutants, but are dysfunctional [Citation9]). We could not detect a difference in the fluorescence in the sensory neurons, which remained high in rnf-5; ire-1 double mutants (), but detected a significant decrease in fluorescence in the posterior intestine () and an increase in the fluorescence in the body cavity in ire-1;rnf-5 animals (). Altogether, this suggests that downregulation of RNF-5 partially rescues the secretory ER activity at least in the DAF-28::GFP intestinal producing cells, allowing secretion of the reporter from these cells. However, the rescue is partial as secretion of the reporter from the neurons was not restored, and the coelomocytes of ire-1;rnf-5 animals remained nonfunctional. A similar rescue pattern (i.e. rescue of secretion of the reporter from the intestine producing cells, but not from the producing neuronal cells, and lack of rescue of coelomocyte activity) has been observed in the insulin/IGF-1 receptor daf-2 mutants [Citation62]. Interestingly, this implies that RNF-5 probably acts in a cell non-autonomous manner through an hormonal signaling pathway to enhance secretion in the intestine, since a transcriptional rnf-5p::mCherry reporter was expressed in head and tail neurons and in the epidermis but not in intestinal cells (Fig. S4).
Figure 4. RNF-5 inactivation restores DAF-28::GFP secretion from the intestine of ire-1 mutants. (A) Representative fluorescence micrographs of day-3 transgenic animals of the indicated genotype expressing an integrated DAF-28::GFP transgene. Arrowheads indicate DAF-28::GFP in the coelomocytes (white arrows), in the posterior intestine (yellow arrows) and in the anterior sensory neurons (green arrows). (B) Percentage of transgenic animals of the indicated genetic backgrounds with high levels of DAF-28::GFP in their body cavity (each animal was qualitatively scored for the accumulation of fluorescent GFP in the posterior intestine). (C-E) Bar graphs showing the relative mean fluorescence measured in the DAF-28::GFP expressing neurons (C), in the DAF-28::GFP expressing intestinal cells (D) and in the body cavity of the animals (E). Note that the rnf-5 mutation increases the GFP signal beyond background autofluorescence from the intestine (see materials and methods). More than 45 animals were analyzed per strain. In C and D, values are the normalized total fluorescence ± SEM. In E, values are the normalized mean fluorescence ± SEM p < 0.05 (*), p < 0.001(**), and p < 0.0001 (***) by t-test
Increased levels of lysosomal proteases in rnf-5(tm794) mutant animals
To identify downstream elements regulated by RNF-5, we performed a quantitative proteomic profiling of wild type and rnf-5(tm794) mutant animals under mild ER stress induced by 1 µg/ml tunicamycin. Our analysis identified 44 proteins with higher levels in rnf-5(tm794) animals compared to wild-type animals and 4 proteins with lower levels ( and Table S3). Functional annotation (DAVID) showed enrichment in two main clusters: hydrolases (p < 0.00001) and RNA helicases (p < 0.003). We identified an increase in the levels of 19 hydrolases including cysteine proteases, aspartic peptidases, additional lysosomal hydrolases and oxidoreductases. Network of protein-protein interactions in the two clusters was identified using STRING [Citation63] (). Because many of these hydrolases were shown to be involved in lysosomal function and autophagy also in C. elegans [Citation34] it is possible that RNF-5 regulates the levels of these components through a lysosomal or authophagy central regulator and therefore their levels are increased in rnf-5(tm794) mutant animals. We have previously showed that RNF-5 regulates the ATG4B cysteine protease [Citation47] and these new data suggest that RNF-5 may regulate a larger family of proteases.
Figure 5. Increased levels of lysosomal proteases and RNA helicases in rnf-5(tm794) mutant animals. (A) Protein-protein interactions for differentially expressed proteins identified in a proteomics screen of rnf-5(tm794) and wild type animals grown on 1 µg/ml Tunicamycin (mild ER stress). Analysis was performed with STRING software (string-db.org) [Citation81]. The network plot is based on known and predicted interactions (enrichment p-value: 1.9e-12). Two main clusters were identified: lysosomal proteases (marked red, clustering coefficient 0.832) and RNA helicases (marked purple, clustering coefficient 0.667). AIR-1 (labeled with asterisk) was downregulated in rnf-5(tm794) mutant worms compared to wild type. The entire list of differentially expressed proteins is presented in Table S3. (B) Representative fluorescence micrographs of day-1 adult GFP::LGG-1 and rnf-5(tm794);GFP::LGG-1 stained with LysoTracker Red DND-99. The region of the anterior intestine is shown, n > 20. Scale bar: 10 µm. (C) Representative fluorescence micrographs of day-1 adult wild type, rnf-5(tm794), ire-1(v33) and rnf-5(tm794);ire-1(v33) animals stained with LysoTracker Red DND-99. Scale bar: 10 µm. (D) Intestinal lysosome quantification using LysoTracker Red DND-99 staining. The graphs show the number of lysosomes and the average lysosome size in each animal (1 µm = 10.7 pixels). The mean values and SEM are shown in black. n = 25 animals were imaged and analyzed for each genotype in 3 independent experiments. Statistical significance was calculated by one-way ANOVA F(3,97) = 52.63 for the analysis of the number of lysosomes, F(3,96) = 12.66 for the analysis of lysosome size, P value < 0.0001, followed by Tukey’s multiple comparisons test p < 0.002 (*), p < 0.0004(**), and p < 0.0001 (***)
![Figure 5. Increased levels of lysosomal proteases and RNA helicases in rnf-5(tm794) mutant animals. (A) Protein-protein interactions for differentially expressed proteins identified in a proteomics screen of rnf-5(tm794) and wild type animals grown on 1 µg/ml Tunicamycin (mild ER stress). Analysis was performed with STRING software (string-db.org) [Citation81]. The network plot is based on known and predicted interactions (enrichment p-value: 1.9e-12). Two main clusters were identified: lysosomal proteases (marked red, clustering coefficient 0.832) and RNA helicases (marked purple, clustering coefficient 0.667). AIR-1 (labeled with asterisk) was downregulated in rnf-5(tm794) mutant worms compared to wild type. The entire list of differentially expressed proteins is presented in Table S3. (B) Representative fluorescence micrographs of day-1 adult GFP::LGG-1 and rnf-5(tm794);GFP::LGG-1 stained with LysoTracker Red DND-99. The region of the anterior intestine is shown, n > 20. Scale bar: 10 µm. (C) Representative fluorescence micrographs of day-1 adult wild type, rnf-5(tm794), ire-1(v33) and rnf-5(tm794);ire-1(v33) animals stained with LysoTracker Red DND-99. Scale bar: 10 µm. (D) Intestinal lysosome quantification using LysoTracker Red DND-99 staining. The graphs show the number of lysosomes and the average lysosome size in each animal (1 µm = 10.7 pixels). The mean values and SEM are shown in black. n = 25 animals were imaged and analyzed for each genotype in 3 independent experiments. Statistical significance was calculated by one-way ANOVA F(3,97) = 52.63 for the analysis of the number of lysosomes, F(3,96) = 12.66 for the analysis of lysosome size, P value < 0.0001, followed by Tukey’s multiple comparisons test p < 0.002 (*), p < 0.0004(**), and p < 0.0001 (***)](/cms/asset/d886bd0d-4a0e-4618-ac1e-b0cacff3ed6a/kaup_a_1827778_f0005_oc.jpg)
To examine the lysosomes in rnf-5(tm794) mutant animals we stained animals with LysoTracker Red DND-99 and analyzed the region of the anterior intestine, immediately posterior to the pharyngeal-intestinal valve. We detected more lysosomes in rnf-5(tm794) which in most cases did not co-localize with autophagosomes marked by GFP::LGG-1 reporter (). Quantification of the lysosomes showed significant increase in lysosome number as well as significant decrease in lysosome size suggesting an increase in newly formed lysosomes in rnf-5(tm794) mutant animals when compared to WT. Quantification of the lysosomes in ire-1(v33) revealed weaker staining and smaller number of lysosomes that was rescued in the double mutant rnf-5(tm794); ire-1(v33). The size of the lysosomes was not significantly different from WT in all strains except rnf-5(tm794) with significantly smaller lysosomes (). Finally, to examine the effect of RNF-5 depletion on lysosomal activity we stained the worms with Magic Red cathepsin B substrate. This substrate produces fluorescence in the intestine upon cleavage by lysosomal proteases. As expected, rnf-5 mutant animals exhibited higher lysosomal activity while ire-1 mutant animals showed low activity as evidenced by reduced fluorescence. Importantly, the cathepsin B activity was increased in ire-1; rnf-5 double mutants compared to ire-1 single mutants mainly in the anterior and posterior intestine, but not to the level of WT (Fig. S5). Altogether, these experiments prove that rnf-5 deficiency modulates lysosome biogenesis and increases lysosomal protease activity as predicted by our proteomics data.
Discussion
In this study we show that downregulation of the conserved E3 ligase RNF-5 enhances C. elegans resistance to the ER toxin tunicamycin and improves the physiology of IRE-1-compromised animals. Given the well-established role of RNF-5 in limiting autophagy, we examined whether these benefits could be mediated by the autophagy-enhancing effects of RNF-5 depletion. Consistent with this hypothesis, we found that RNF-5 depletion was less beneficial in improving the physiology of ire-1 mutants in a starvation recovery assay and in a lifespan assay, in the background of the autophagy hypomorph atg-3(bp412). Likewise, RNF-5 depletion was less beneficial in improving tunicamycin resistance in animals treated with RNAi of autophagy genes. Interestingly, RNF-5 depletion was still beneficial in improving tunicamycin resistance in animals treated with RNAi against atg-4.1 and atg-4.2 individually, or upon silencing bec-1 and atg-7. This tunicamycin resistance may be due to residual autophagic activity in these animals, or due to differences in RNAi efficiency. Since combination of atg-4.1 and atg-4.2 had the strongest affect, it could be that RNF-5 depletion also improves the resistance of the animals to tunicamycin in an ATG4-dependent but autophagy-independent mechanism. These findings are consistent with the established role of RNF5 as an ATG4B regulator [Citation47] and with the broad implications of a variety of ATG gene functions in different membrane-trafficking and signaling pathways [Citation64]. Interestingly, when compared to wild-type animals, knockout of rnf-5 was not beneficial in all the conditions tested. Specifically, rnf-5 inactivation improved resistance only to low concentrations of tunicamycin and did not affect the resistance to high concentrations of this drug. Likewise, it extended the lifespan and improved the recovery of L1 larvae from starvation in ire-1 deficient animals, with only a slight effect on wild-type animals. Whereas rnf-5 depletion significantly improved the recovery of ire-1(-) animals from prolonged heat stress, it actually showed sensitivity to heat stress. We hypothesize that the underlying cause for these differential effects of rnf-5 depletion may reflect the characteristics double-edged sword activity of autophagy [Citation65]. For example, in conditions where autophagy levels are naturally low (for example under low concentrations of tunicamycin or in L1-arrested ire-1-deficient animals), the rnf-5(-) mediated increase in autophagy levels may be beneficial for the organism. In contrast in conditions where autophagy levels are increased (for example when exposed to high concentrations of tunicamycin or in aging or L1-arrested wild-type animals), a further increase in autophagy levels may not have an added value for the organism. Furthermore, having too much autophagy may even harm the animals, as in the case of rnf-5-deficient animals exposed to heat stress. Consistent with this interpretation, too much or too little autophagy reduces recovery from L1 arrest [Citation52]. Likewise, it has been shown that excessive autophagy in the pharyngeal muscles causes damage to the pharynx and result in animal death [Citation59].
We demonstrated that downregulation of RNF-5 increased survival of ire-1 mutant animals following starvation and extended ire-1 mutant lifespan if the autophagy system remains intact. Our current observations together with our previous study [Citation47] suggest that the increased autophagy levels following RNF5 downregulation is independent of the ERN1 UPR system. Using the DAF-28::GFP model for protein secretion we demonstrated that downregulation of RNF-5 rescued intestinal protein secretion in ire-1 mutant animals. Interestingly, analysis of the transcriptional rnf-5 reporter strain suggests that RNF-5 is expressed in neurons, rather than in the intestine. This suggests that RNF-5 acts cell non-autonomously to promote ER function in the intestine, and possibly in additional tissues. Accordingly, RNF-5 depletion increased Cathepsin B activity throughout the organism, primarily in the intestine. This suggests that RNF-5 may be involved in a hormonal signaling pathway that regulates autophagy and lysosomal activity. This pathway is yet to be identified in future studies. Interestingly, RNA-seq analysis of intestines of animals expressing neuronal XBP-1, has recently identified upregulation of the same lysosomal genes [Citation34], suggesting that RNF-5 acts in a parallel pathway potentially compensating for IRE-1 deficiency.
Secretory proteins are critical for cell-to-cell communication within an organism and between organisms. ER stress conditions, induced by toxins such as tunicamycin, or by defects in the ER homeostasis stress response pathway, perturb ER function, and consequently perturb secretory protein metabolism [Citation9]. These in turn may account for the reduced survival of ER-stressed animals under different challenging conditions. Here we demonstrate that depletion of rnf-5 partially restores protein secretion in ire-1-deficient animals, improving their resistance to ER stress and their longevity. We attribute these improvements to two distinct mechanisms, that most likely act in parallel and complement each other. First, blocking ER secretion per se is sufficient to cause ER stress and activate the ER-UPR [Citation66]. Thus, a relive in protein secretion can by itself reduce the load on the ER and thus promote ER homeostasis and function. Second, the improved physiology of the animals may be due to restoration of hormonal signals that rely on functional protein secretion. Accordingly, longevity and activation of the ER stress response, both involve secreted proteins that function in a hormonal like fashion.
The results from the proteomics screen suggest that RNF-5 depletion increases the level of a large family of lysosomal proteases. The lysosome is the terminal organelle for the autophagic cargo. Interestingly, lysosomes function decline with age in a lifespan and proteostasis-limiting manner [Citation55,Citation67,Citation68]. We analyzed lysosome size and number in the anterior intestine using lysotracker. We measured significant increase in the number of lysosomes and decrease in their size in rnf-5(tm794) animals. Furthermore, we found that there is no colocalization between the lysosomes and the GFP::LGG-1 autophagosomes, supporting an increase in autophagosome formation in rnf-5(tm794) animals as well as increase in nascent lysosome formation or budding . In ire-1 mutants we observed weak staining of the lysosomes suggesting increased lysosomal pH/impaired lysosome acidification or abnormal retention properties inside the organelle. This inefficient staining was rescued in the double mutant rnf-5(tm794); ire-1(v33). We confirmed that rnf-5 mutant animals have higher lysosomal protease activity as predicted by the proteomics data. In addition, the proteomic screen identified an increase in the level of several RNA helicases including GLH-1, GLH-2 and H20J04.4 which encode DEAD-box RNA helicases. GLH-1 and GLH-2 have known roles in germline development [Citation69]. In mammals, a family of DExD/H box RNA helicases recruit the STING1/MITA and MAVS/VISA adaptors, that are RNF5 substrates [Citation44,Citation45], to activate the transcription factor NFKB/NF-κB leading to transcriptional induction of the genes encoding type I IFNs and other antiviral effectors [Citation70]. Thus, RNF-5 may also play a role in basal defense mechanisms against pathogens. Consistent with this possibility, one of the enriched proteins upon RNF-5 depletion is the innate immunity-related protein IRG-7(F40F4.6) (Table S4) [Citation71]. Interestingly, there was a major decrease in the levels of Aurora-A kinase AIR-1 (Table S4, red) in rnf-5(tm794) animals when compared to wild-type. Autophagy was shown to increase following downregulation of AURKA/Aurora-A kinase [Citation72] but the functional association between RNF-5 and AIR-1 is still unknown.
In summary, we present evidence suggesting that RNF-5 negatively regulates lysosomal proteases levels. Downregulation of RNF-5 elevated lysosomal number and function and animal resistance to stress probably by enhancing lysosome capacity and by this also ER stress resistance. Our findings may contribute to therapeutic developments for lysosomal storage disorders and late-onset neurodegenerative diseases like Alzheimer and Parkinson diseases.
Materials and methods
Strains
Strains were cultured and maintained at 20° unless specified otherwise. The following strains were used in this study: rnf-5(tm794), ire-1(v33), ire-1(ok799), atg-3(bp412), NX169 [ire-1(v33)II;rnf-5(tm794)III], VB1605 svIs69[pdaf-28::daf-28::gfp], SHK11 ire-1(ok799); svIs69[Pdaf-28::DAF-28::GFP], SHK495 ire-1(ok799)II; rnf-5(tm794); svIs69 [Pdaf-28::daf-28::gfp]. The rnf-5(tm794) deletion allele is a probable null allele and has a 647-bp deletion in exon 2 that results in a frameshift and a stop codon after 37 amino acids [Citation48,Citation50].
Tunicamycin sensitivity assay
Tunicamycin (Sigma, T7765) plates were prepared by spreading tunicamycin on NGM (51 mM NaCl, 2.5 g/L Bacto Tryptone, 17 g/L Bacto Agar, 5 µg/ml cholesterol, 25 mM KH2PO4/K2HPO4, pH 6, 1 mM MgSO4, 1 mM CaCl2) plates, and allowing plates to dry for 24 h before adding the bacteria. An overnight culture of E. coli OP50 was inoculated 1:100 and grown at 37°C to OD600nm = 0.5–0.6. The bacteria were concentrated to OD600nm = 4 before seeding onto plates with tunicamycin. Plates were dried at room temperature for 1 day before use. Embryos were obtained by standard bleaching of gravid adult and ~150 embryos were placed on each of 3 plates. Counting of L4 and adults was performed 72 h later. To examine tunicamycin sensitivity of worms treated with RNAi, embryos were transferred to RNAi feeding plates seeded with dsRNA-producing bacteria of the tested autophagy genes or with bacteria containing the empty feeding vector L4440 as a control as described in [Citation73]. At least three independent experiments were performed for each tunicamycin concentration, RNAi clone or mutant. Statistical significance was determined by two-sample t-test after first testing for equal variance by F-test or by one-way ANOVA followed by Tukey’s multiple comparisons test.
L1 survival assay
Gravid adults were bleached and ~10,000 embryos/ml were incubated in M9 buffer (86 mM NaCl, 22 mM KH2PO4, 42 mM Na2HPO4, pH 7) in 15 ml conical tubes, in a rotator at 20°C for the indicated time points (starvation time). Day 1 of starvation counted as 24 h after bleaching. At each time point, a 20-µl aliquot (100–150 worms) was dropped on three NGM plates seeded with HB101, and placed at 20°C. After 3 days of recovery on food plates, worms that reached L4/adult were counted and averaged. The number of worms developed from day 1 of starvation (first time point) was used as control to calculate the number of dead worms at each time point. To apply log-rank statistics, survival rates were smoothed to a non-increasing function. The experimental noise (variability) was reduced by applying centered moving averaging over each consecutive three time points before the survival rate decreased to 90%. Therefore, the smoothing was performed only on the early time points of the survival curves, before significant numbers of animals had lost viability. The experimental noise is assumed to result from pipetting and counting errors. This correction allowed using OASIS – Online Application for Survival Analysis [Citation74] for performing the Log-Rank statistics. The L1 survival assay showed some variability between experiments [Citation11], therefore we compared populations assayed simultaneously (Table S1). The L1 survival shown in is representative of 4 independent experiments (Table S1).
Lifespan assay of adults
Gravid adults were allowed to lay eggs on NGM plates seeded with OP50 for 3 h. Plates were maintained at 15°C until larvae reached the 1st day of adulthood. 120 1st day adults were placed on NGM plates with 1 µM FUdR (Sigma, F0503) [Citation75] at 20°C and this was determined as day 1 of lifespan counting (8 plates per strain). Animals were transferred to fresh NGM+FUdR plates every 48 h during the reproductive period, and if plates were contaminated thereafter. Animals were scored as dead when they failed to respond to touch. Animals that died from internal hatching, dried, exploded, disappeared, and worms on contamination were censored and removed from the plates. Statistical analysis of lifespan assays was calculated with Log-Rank test using OASIS- Online Application for Survival Analysis [Citation74]. The lifespan data shown in are representative of 3 independent experiments (Table S2).
Analysis of DAF-28::GFP reporter
3-day old transgenic animals were anaesthetized on 2% agarose pads containing 2 mM levamisole (Sigma, L9756). Images were taken with a CCD digital camera using a Nikon 90i fluorescence microscope. For each trial, exposure time was calibrated to minimize the number of saturated pixels and was kept constant through the experiment. The NIS element software was used to quantify total fluorescence intensity in selected areas including the head region (the DAF-28::GFP expressing neurons, ), the posterior intestine (the DAF-28::GFP expressing intestinal cells, ) and the body cavity of the animal (the area between the producing cells of the rear intestine and the middle of the animal, not including ceolomocytes, ). Note that the natural autofluorescence from the intestine significantly contributes to the whole body fluorescence measurements, and accounts for the signal detected in the control and ire-1 mutants (). In addition, each animal was qualitatively scored for the accumulation of fluorescent GFP in the posterior intestine ().
Quantitative proteomics profiling
We performed metabolic labeling with 15N stable isotope followed by quantitative mass spectrometry (MS) [Citation76,Citation77]. For labeling C. elegans with 15N, the NA22 E. coli strain was grown ON in Spectra 9 medium (15N, 98%, Cambridge Isotope Laboratories, CGM-3030-N-1), pelleted and concentrated 10x. Worm plates were prepared with nitrogen-free medium including (12 g agarose [Amersco, 0710], 3 g NaCl, 1 ml 5 mg/ml cholesterol, 1 ml 1 M CaCl2, 1 ml 1 M MgCl2 and 25 ml 1 M K2HPO4/KH2PO4, pH 6.0 per liter). Worms were grown on either 15N -labeled or unlabeled NA22 bacteria till the plate was almost cleared from bacteria and containing F1 and F2 progeny – this was considered one passage. Worms were transferred to new plates and were fed either 15N -labeled or unlabeled bacteria for a second passage. For the third and final passage, plates were prepared with 50x concentrated bacteria. Tunicamycin (1 µg/ml) was spread and allowed to dry one day before adding the bacteria. The SJ4005 strain [Citation5] was used as a control for ER stress induction on the tunicamycin plates. For each experiment, the control group was grown on unlabeled bacteria, and the experimental group carrying the rnf-5(tm794) allele was grown on 15N labeled bacteria. Worms were collected and washed once in M9, the supernatant was removed, the pellet was frozen in liquid nitrogen and then stored at −80ᵒC. Worm pellets were lysed with 1 volume of lysis buffer (20 mM HEPES, pH 7.4, 10 mM KCl, 1.5 mM MgCl2, 1 mM DTT, and 2x EDTA-free protease inhibitor cocktail [Roche, 05 892 791 001]) . Worms were lysed by sonication and spun at 1000 g for 10 min. Protein was determined using BCA Protein Assay (Pierce, 23227). Supernatants of the 15N-labeled and unlabeled worms from the 1000 g spin were combined at a 1:1 protein ratio and centrifuged at 100,000 g for 1 h. A portion (1.2 mg) of each sample was methanol-chloroform precipitated, the pellet air-dried and frozen at −80ᵒC. Tandem mass spectrometry (MS/MS), data analysis and protein quantification was performed according to [Citation78] at the Proteomics Shared Resource facility, Sanford Burnham Prebys Medical Discovery Institute. Cutoff for differentially expressed proteins was protein ratio of 1.5(or 0.66) and p-value of 0.05 and 0.1. The data set was analyzed using DAVID [Citation79] and STRING [Citation63]. We analyzed two biological replicates and three technical replicates for each strain.
Heat stress assay
Mid-L4 larvae from a mixed population grown in 20°C (without bleach) were singly plated to freshly seeded OP50 (50 µl; OD = 0.54) NGM plates and grown at 20°C for 24 h. Day 1 adult animals were shifted to 37°C for 5 h 30 min heat shock followed by recovery at 20°C for 12 h. Animals were counted for live (including very sick but alive ire-1(v33) animals) or dead animals. Worms were scored by gentle touch with a platinum transfer pick. Five independent repeats were performed and 40–50 worms for each strain were analyzed on single plates in each experiment. We decided to plate the worms individually before the heat stress treatment since in our hands it seems that there is a population effect on resistance to heat shock. Statistical analysis was conducted by one-way ANOVA followed by Tukey’s multiple comparisons test.
RNF-5 transcriptional reporter
The Exrnf-5p::mCherry transcriptional reporter incudes 6.4kb upstream of rnf-121, the first gene in the operon of rnf-5 (CEOP3156) followed by the mCherry coding sequence and let-858 3ʹUTR.
Lysosome quantification with LysoTracker
Following hatching in M9, 30–50 L1 animals were dropped on 24 well plates containing OP50 with final concentration of 2 µM LysoTracker Red DND-99 (Invitrogen, L7528). Day 1 adult animals were imaged using confocal microscopy (Zeiss LSM 5 Exciter). The anterior intestine immediately posterior to the pharyngeal-intestinal valve was imaged in all animals. Three independent experiments were performed and 10–20 animals from each genotype were imaged in each experiment. The diameter of the detection pinhole was set to 1 Airy. Images were collected at a fixed pixel size of 0.54 µm selecting a region of interest of 820 × 282 pixels. Quantification of the number and size of lysosomes in the same z-focal plane was carried out using a custom made ImageJ macro in Fiji [Citation80]. In brief, lysosomes were detected using the “adaptive threshold” plugin and the size measured using “analyze particles” with a size exclusion of 20 pixels. Statistical analysis was conducted by one-way ANOVA followed by Tukey’s multiple comparisons test. GFP::LGG-1 animals were stained with 2 µM LysoTracker Red DND-99 as described above and images were acquired using confocal system (Zeiss LSM 5 Exciter). GFP was excited using a 488 nm argon laser and the fluorescence emission was collected using a band pass 505–530 nm filter. LysoTracker Red DND-99 was excited using a 543 nm HeNe laser and the emission was collected using a long pass 560 nm laser.
Magic red assay to measure lysosomal activity
Magic Red (ImmunoChemistry Technologies, 6133) produces red fluorescence following proteolytic cleavage by cathepsin B in functional lysosomes. Magic Red stain was prepared in 260x DMSO stock according to the manufacturer’s instructions and 4 µl stock was diluted x10 with M9. The diluted stock (15 µl) was added into wells of a 24-well-plate containing 1 ml NGM and a dried circle of OP50. The plate was dried in dark after addition of the Magic Red solution. L4 stage worms were transferred (50 worms/well) and grown overnight at 20°C. Day 1 adult worms were washed with M9 and imaged with Nikon SMZ18 and the anterior intestine region was quantified by Fiji. Four independent experiments were performed with n ≥ 40. Statistical analysis was conducted by one-way ANOVA followed by Tukey’s multiple comparisons test.
Statistical analysis
The data were presented as the mean ± SEM from at least 3 independent experiments. Statistical differences were determined as described above for each assay.
Acknowledgment
We thank WormBase for C. elegans genetic annotation. Several strains were provided by the Caenorhabditis Genetics Center (CGC), which is funded by NIH Office of Research Infrastructure Programs (P40 OD010440) and Dr. Shohei Mitani, National Bioresource Project for the nematode, Tokyo Women’s Medical University School of Medicine, Japan. We thank Prof. Dieter A. Wolf from the Sanford Burnham Prebys Medical Discovery Institute for advices on proteomics analysis and comments on the manuscript. We thank Prof. Peter Naredi (Umea University, Sweden) for the DAF-28::GFP expressing strain. We thank Sharon Sheffy-Levin for sample preparation for the proteomics analysis and initial hit analysis and Hanna Grobe for writing and optimizing the ImageJ Macro for lysosome analysis.
Abbreviations
ATG: autophagy; ER: endoplasmic reticulum; ERAD: ER-associated protein degradation; RNF5: RING finger protein 5; UPR: unfolded protein response; WT: wild-type
Supplemental Material
Download Zip (1.7 MB)Disclosure statement
No potential conflict of interest was reported by the authors.
Supplemental material
Supplemental data for this article can be accessed here.
Additional information
Funding
Related Research Data
References
- Schröder M, Kaufman RJ, Kaufman RJ. The mammalian unfolded protein response. Annu Rev Biochem. 2005;74:739–789.
- Ron D, Walter P. Walter P: signal integration in the endoplasmic reticulum unfolded protein response. Nat Rev Mol Cell Biol. 2007;8:519.
- Vembar SS, Brodsky JL. One step at a time: endoplasmic reticulum-associated degradation. Nat Rev Mol Cell Biol. 2008;9:944.
- Hetz C. The unfolded protein response: controlling cell fate decisions under ER stress and beyond. Nat Rev Mol Cell Biol. 2012;13:89–102.
- Calfon M, Zeng H, Urano F, et al. IRE1 couples endoplasmic reticulum load to secretory capacity by processing the XBP-1 mRNA. Nature. 2002;415:92.
- Gardner BM. Walter P. Unfolded proteins are Ire1-activating ligands that directly induce the unfolded protein response. Science. 2011;333:1891–1894.
- Shen X, Ellis RE, Sakaki K, Kaufman RJ. Genetic interactions due to constitutive and inducible gene regulation mediated by the unfolded protein response in C. elegans. PLoS Genet. 2005;1:e37.
- Richardson CE, Kinkel S, Kim DH. Physiological IRE-1-XBP-1 and PEK-1 signaling in caenorhabditis elegans larval development and immunity. PLoS Genet. 2011;7:e1002391.
- Safra M, Ben-Hamo S, Kenyon C Henis-Korenblit S. The ire-1 ER stress-response pathway is required for normal secretory-protein metabolism in C. elegans. J Cell Sci. 2013;126:4136–4146.
- Henis-Korenblit S, Zhang P, Hansen M, et al., Insulin/IGF-1 signaling mutants reprogram ER stress response regulators to promote longevity. Proc National Academy Sci 2010, 107:9730–9735.
- Roux AE, Langhans K, Huynh W. Reversible age-related phenotypes induced during larval quiescence in C. elegans. Cell Metab. 2016;23:1113–1126.
- Ohsumi Y. Historical landmarks of autophagy research. Cell Res. 2013;24:9.
- Levine B, Klionsky DJ. Development by self-digestion: molecular mechanisms and biological functions of autophagy. Dev Cell. 2004;6:463–477.
- Nakatogawa H, Suzuki K, Kamada Y, et al. Dynamics and diversity in autophagy mechanisms: lessons from yeast. Nat Rev Mol Cell Biol. 2009;10:458–467.
- Feng Y, He D, Yao Z, et al. The machinery of macroautophagy. Cell Res. 2014;24:24–41.
- Palmisano NJ, Meléndez A, et al. Autophagy in C. elegans development. Dev Biol. 2019;447:103–125.
- Mizushima N, Komatsu M, et al. Autophagy: renovation of cells and tissues. Cell. 2011;147:728–741.
- Kroemer G, Mariño G, Levine B. Autophagy and the integrated stress response. Mol Cell. 2010;40:280–293.
- Kaur J, Debnath J. Autophagy at the crossroads of catabolism and anabolism. Nat Rev Mol Cell Biol. 2015;16:461–472.
- Bachar-Wikstrom E, Wikstrom JD, Kaiser N, et al. Improvement of ER stress-induced diabetes by stimulating autophagy. Autophagy. 2013;9:626–628.
- Ogata M, S-I H, Saito A, et al. Autophagy is activated for cell survival after endoplasmic reticulum stress. Mol Cell Biol. 2006;26:9220–9231.
- Rzymski T, Milani M, Pike L, et al. Regulation of autophagy by ATF4 in response to severe hypoxia. Oncogene. 2010;29:4424–4435.
- Song S, Tan J, Miao Y, et al. Crosstalk of ER stress-mediated autophagy and ER-phagy: involvement of UPR and the core autophagy machinery. J Cell Physiol. 2018;233:3867–3874.
- Yorimitsu T, Nair U, Yang Z, et al. Endoplasmic reticulum stress triggers autophagy. J Biol Chem. 2006;281:30299–30304.
- Bernales S, McDonald KL, Walter P. Autophagy counterbalances endoplasmic reticulum expansion during the unfolded protein response. PLoS Biol. 2006;4:e423.
- Kouroku Y, Fujita E, Tanida I, et al. ER stress (PERK/eIF2α phosphorylation) mediates the polyglutamine-induced LC3 conversion, an essential step for autophagy formation. Cell Death Differ. 2007;14:230–239.
- Senft D, Ronai ZeA. UPR, autophagy, and mitochondria crosstalk underlies the ER stress response. Trends Biochem Sci. 2015;40:141–148.
- Muscarella DE, Bloom SE. The contribution of c-Jun N-terminal kinase activation and subsequent Bcl-2 phosphorylation to apoptosis induction in human B-cells is dependent on the mode of action of specific stresses. Toxicol Appl Pharmacol. 2008;228:93–104.
- Yamamoto K, Ichijo H, Korsmeyer SJ BCL-2 K. Is phosphorylated and inactivated by an ASK1/Jun N-terminal protein kinase pathway normally activated at G2/M. Mol Cell Biol. 1999;19:8469–8478.
- Zalckvar E, Berissi H, Mizrachy L, et al. DAP-kinase-mediated phosphorylation on the BH3 domain of beclin 1 promotes dissociation of beclin 1 from Bcl-XL and induction of autophagy. EMBO Rep. 2009;10:285–292.
- Pattingre S, Tassa A, Qu X, et al. Bcl-2 antiapoptotic proteins inhibit beclin 1-dependent autophagy. Cell. 2005;122:927–939.
- Pattingre S, Bauvy C, Carpentier S, et al. Role of JNK1-dependent Bcl-2 phosphorylation in ceramide-induced macroautophagy. J Biol Chem. 2009;284:2719–2728.
- Margariti A, Li H, Chen T, et al. XBP1 mRNA splicing triggers an autophagic response in endothelial cells through BECLIN-1 transcriptional activation. J Biol Chem. 2013;288:859–872.
- Imanikia S, Özbey NP, Krueger C, et al. Neuronal XBP-1 activates intestinal lysosomes to improve proteostasis in C. elegans. Curr Biol. 2019;29:2322–2338.e2327.
- B’chir W, Maurin A-C, Carraro V, et al. The eIF2α/ATF4 pathway is essential for stress-induced autophagy gene expression. Nucleic Acids Res. 2013;41:7683–7699.
- Høyer-Hansen M, Bastholm L, Szyniarowski P, et al. Control of macroautophagy by calcium, calmodulin-dependent kinase kinase-β, and Bcl-2. Mol Cell. 2007;25:193–205.
- Younger JM, Chen L, Ren H-Y, et al. Sequential quality-control checkpoints triage misfolded cystic fibrosis transmembrane conductance regulator. Cell. 2006;126:571–582.
- Delaunay A, Bromberg KD, Hayashi Y, et al. The ER-bound ring finger protein 5 (RNF5/RMA1) causes degenerative myopathy in transgenic mice and is deregulated in inclusion body myositis. PLoS ONE. 2008;3:e1609.
- Kuang E, Qi J, Ronai Z. Emerging roles of E3 ubiquitin ligases in autophagy. Trends Biochem Sci. 2013;38:453–460.
- Tomati V, Sondo E, Armirotti A, et al. Genetic inhibition of the ubiquitin ligase Rnf5 attenuates phenotypes associated to F508del cystic fibrosis mutation. Sci Rep. 2015;5:12138.
- Sondo E, Falchi F, Caci E, et al. Pharmacological Inhibition of the ubiquitin ligase RNF5 rescues F508del-CFTR in cystic fibrosis airway epithelia. Cell Chem Biol. 2018;25:891–905.e898.
- Morito D, Hirao K, Oda Y, et al. Gp78 cooperates with RMA1 in endoplasmic reticulum-associated degradation of CFTRΔF508. Mol Biol Cell. 2008;19:1328–1336.
- Jeon Young J, Khelifa S, Ratnikov B, et al. Regulation of glutamine carrier proteins by RNF5 determines breast cancer response to ER stress-inducing chemotherapies. Cancer Cell. 2015;27:354–369.
- Zhong B, Zhang L, Lei C, et al. The ubiquitin ligase RNF5 regulates antiviral responses by mediating degradation of the adaptor protein MITA. Immunity. 2009;30:397–407.
- Zhong B, Zhang Y, Tan B, et al. The E3 ubiquitin ligase RNF5 targets virus-induced signaling adaptor for ubiquitination and degradation. J Immunol. 2010;184:6249–6255.
- Li Y, Tinoco R, Elmén L, et al. Gut microbiota dependent anti-tumor immunity restricts melanoma growth in Rnf5−/− mice. Nat Commun. 2019;10:1492.
- Kuang E, Okumura CYM, Sheffy-Levin S, et al. Regulation of ATG4B stability by RNF5 limits basal levels of autophagy and influences susceptibility to bacterial infection. PLoS Genet. 2012;8:e1003007.
- Broday L, Kolotuev I, Didier C, et al. The LIM domain protein UNC-95 is required for the assembly of muscle attachment structures and is regulated by the RING finger protein RNF-5 in C. elegans. J Cell Biol. 2004;165:857–867.
- Zaidel-Bar R, Miller S, Kaminsky R, et al. Molting-specific downregulation of C. elegans body-wall muscle attachment sites: the role of RNF-5 E3 ligase. Biochem Biophys Res Commun. 2010;395:509–514.
- Kovacevic I, Ho R, Cram EJ. CCDC-55 is required for larval development and distal tip cell migration in C. elegans. Mech Dev. 2012;128:548–559.
- Didier C, Broday L, Bhoumik A, et al. RNF5, a RING finger protein that regulates cell motility by targeting paxillin ubiquitination and altered localization. Mol Cell Biol. 2003;23:5331–5345.
- Baugh LR. To grow or not to grow: nutritional control of development during caenorhabditis elegans L1 arrest. Genetics. 2013;194:539–555.
- Muñoz MJ, Riddle DL. Positive selection of caenorhabditis elegans mutants with increased stress resistance and longevity. Genetics. 2003;163:171–180.
- Baugh LR, Sternberg PW. DAF-16/FOXO regulates transcription of cki-1/Cip/Kip and repression of lin-4 during C. elegans L1 arrest. Curr Biol. 2006;16:780–785.
- Chang JT, Kumsta C, Hellman AB, et al. Spatiotemporal regulation of autophagy during caenorhabditis elegans aging. eLife. 2017;6:e18459.
- Tian Y, Li Z, Hu W, et al. C. elegans screen identifies autophagy genes specific to multicellular organisms. Cell. 2010;141:1042–1055.
- Ichimura Y, Kirisako T, Takao T, et al. A ubiquitin-like system mediates protein lipidation. Nature. 2000;408:488–492.
- Zhang Y, Yan L, Zhou Z, et al. SEPA-1 mediates the specific recognition and degradation of p granule components by autophagy in C. elegans. Cell. 2009;136:308–321.
- Kang C, You Y-J, Avery L. Dual roles of autophagy in the survival of Caenorhabditis elegans during starvation. Genes Dev. 2007;21:2161–2171.
- Kao G, Nordenson C, Still M, et al. Positively regulates insulin secretion in C. elegans and mammalian cells. Cell. 2007;128:577–587.
- Safra M, Henis-Korenblit S. A new tool in C. elegans reveals changes in secretory protein metabolism in ire-1-deficient animals. Worm. 2014;3:e27733.
- Safra M, Fickentscher R, Levi-Ferber M, et al. The FOXO transcription factor DAF-16 bypasses ire-1 requirement to promote endoplasmic reticulum homeostasis. Cell Metab. 2014;20:870–881.
- Szklarczyk D, Morris JH, Cook H, et al. The STRING database in 2017: quality-controlled protein–protein association networks, made broadly accessible. Nucleic Acids Res. 2017;45:D362–D368.
- Levine B, Kroemer G. Biological functions of autophagy genes: a disease perspective. Cell. 2019;176:11–42.
- Thorburn A. Autophagy and Its effects: making sense of double-edged swords. PLoS Biol. 2014;12:e1001967.
- Levi-Ferber M, Salzberg Y, Safra M, et al. It’s all in your mind: determining germ cell fate by neuronal IRE-1 in C. elegans. PLoS Genet. 2014;10:e1004747.
- Bohnert KA, Kenyon C. A lysosomal switch triggers proteostasis renewal in the immortal C. elegans germ lineage. Nature. 2017;551:629–633.
- Hughes AL, Gottschling DE. An early age increase in vacuolar pH limits mitochondrial function and lifespan in yeast. Nature. 2012;492:261–265.
- Gruidl ME, Smith PA, Kuznicki KA, et al., Multiple potential germ-line helicases are components of the germ-line-specific P granules of Caenorhabditis elegans. Proc National Academy Sci USA 1996; 93:13837–13842.
- Takeuchi O, Akira S. Pattern recognition receptors and inflammation. Cell. 2010;140:805–820.
- Yunger E, Safra M, Levi-Ferber M, et al. Innate immunity mediated longevity and longevity induced by germ cell removal converge on the C-type lectin domain protein IRG-7. PLoS Genet. 2017;13:e1006577.
- Zou Z, Yuan Z, Zhang Q, et al. Aurora kinase A inhibition-induced autophagy triggers drug resistance in breast cancer cells. Autophagy. 2012;8:1798–1810
- Tsur A, Bening Abu-Shach U, Broday L. ULP-2 SUMO protease regulates E-Cadherin recruitment to adherens junctions. Dev Cell. 2015;35:63–77.
- Yang J-S, Nam H-J, Seo M, et al. OASIS: online application for the survival analysis of lifespan assays performed in aging research. PLoS ONE. 2011;6:e23525.
- Mitchell DH, Stiles JW, Santelli J, et al. Synchronous growth and aging of caenorhabditis elegans in the presence of fluorodeoxyuridine. J Gerontol. 1979;34:28–36.
- Krijgsveld J, Ketting RF, Mahmoudi T, et al. Metabolic labeling of C. elegans and D. melanogaster for quantitative proteomics. Nat Biotechnol. 2003;21:927.
- Dong M-Q, Venable JD, Au N, et al. Quantitative mass spectrometry identifies insulin signaling targets in C. elegans. Science. 2007;317:660–663.
- Wu S, Zhu W, Nhan T, et al. CAND1 controls in vivo dynamics of the cullin 1-RING ubiquitin ligase repertoire. Nat Commun. 2013;4:1642.
- Huang DW, Sherman BT, Lempicki RA. Systematic and integrative analysis of large gene lists using DAVID bioinformatics resources. Nat Protoc. 2008;4:44.
- Schindelin J, Arganda-Carreras I, Frise E, et al. Fiji: an open-source platform for biological-image analysis. Nat Methods. 2012;9:676–682.
- Szklarczyk D, Gable AL, Lyon D, et al. STRING v11: protein–protein association networks with increased coverage, supporting functional discovery in genome-wide experimental datasets. Nucleic Acids Res. 2018;47:D607–D613.