
ABSTRACT
Paralytic poliomyelitis is a rare disease manifestation following poliovirus (PV) infection. The disease determinants remain largely unknown. We used whole exome sequencing to uncover possible contributions of host genetics to the development of disease outcome in humans with poliomyelitis. We identified a patient with a variant in ATG7, an important regulatory gene in the macroautophagy/autophagy pathway. PV infection did not induce a prominent type I interferon response, but rather activated autophagy in neuronal-like cells, and this was essential for viral control. Importantly, virus-induced autophagy was impaired in patient fibroblasts and associated with increased viral burden and enhanced cell death following infection. Lack of ATG7 prevented control of infection in neuronal-like cells, and reconstitution of patient cells with wild-type ATG7 reestablished autophagy-mediated control of infection. Collectively, these data suggest that ATG7 defect contributes to host susceptibility to PV infection and propose autophagy as an unappreciated antiviral effector in viral infection in humans.
Introduction
Poliovirus (PV) infection can cause paralytic poliomyelitis (PPM) and has historically caused epidemics, with the 1940–50s post Second-World War epidemics being the most devastating, resulting in about half a million paralytic cases per year [Citation1]. Although PPM is now a rare disease manifestation due to the existence of two different efficient polio vaccines, important challenges of global expansion and immunization against PV remains. In 2018, the World Health Organization reported 33 cases of wild PV and 104 cases of circulating vaccine-derived PV. Approximately 0.1–1% of PV type I infections lead to PPM [Citation1], and the existing knowledge of disease determinants remains incomplete [Citation2]. Thus, the precise basis for why some individuals develop PPM is yet to be elucidated, but a role of host genetic factors has been suggested [Citation3]. Indeed single-gene inborn errors of immunity can underlie enhanced susceptibility or increased severity to infectious diseases in otherwise healthy individuals [Citation4].
PV is an enterovirus, which after oral transmission initially replicates in lymphoid/monocytic cells in the tonsils before transit to the lower gastrointestinal tract, where replication in both epithelial cells and Peyers patches takes place [Citation5,Citation6,Citation7]. From the primary sites of viral replication, it is thought that PV drains to the blood to establish viremia, which may be followed by viral CNS invasion, infection of anterior horn motor neurons, and eventually paralysis. The current understanding of antiviral mediators in PV infection (as reviewed in [Citation2,Citation8,Citation9]) includes a role for neutralizing antibodies [Citation10,Citation11] as well as type I interferon (IFN), which are both thought to be important in control of viremia in non-neural tissues [Citation12,Citation13]. Furthermore, the TLR3 (toll like receptor 3) pathway as well as the IFIH1/MDA5 (interferon induced with helicase C domain 1) pathway are suggested to play important roles for the generation of antiviral responses to PV in mice [Citation14,Citation15]. This notion is supported by some studies reporting on increased susceptibility to enterovirus infection in humans with single nucleotide polymorphisms (SNPs) in genes, including IFNAR1 (interferon alpha and beta receptor subunit 1), TLR3 and IFIH1 [Citation16,Citation17,Citation18,Citation19,Citation20]. However, the limited knowledge on human host barriers to PV infection underlines the significance of identifying additional host antiviral mechanisms.
In recent years, autophagy has emerged as part of the innate immune system, and serves a role to protect organisms against invading pathogens and danger [Citation21]. Macroautophagy (referred to as autophagy) is an evolutionary conserved surveillance system that digests dysfunctional or foreign cytoplasmic material to maintain homeostasis [Citation22,Citation23,Citation24]. In addition, reports from in vitro and mouse model studies have suggested that autophagy contributes to antiviral defense [Citation21,Citation25,Citation26,Citation27,Citation28]. Importantly, autophagy governs cellular homeostasis in the CNS and prevents the degeneration of cells, including motor neurons, which have limited regenerative capacity compared to immune cells [Citation29,Citation30]. Indeed, autophagy has been suggested to protect against neurodegenerative diseases [Citation24]. The autophagy process involves more than thirty autophagy-related (ATG) genes [Citation31], including ATG5, BECN1/Beclin 1, and ATG7, central for the execution of canonical autophagy [Citation23]. The autophagosome biogenesis depends on ATG7, which participates in two conjugation systems, eventually leading to the lipidation of MAP1LC3/LC3 (microtubule associated protein 1 light chain 3) [Citation32]. This LC3 lipidation (LC3-I to LC3-II conversion) is thought to be mandatory for efficient formation of mature autophagosomes [Citation33,Citation34] and monitoring LC3 has been used as an indirect measure of autophagy. ATG7 is organized into three domains, including an N-terminal domain, a central adenylation domain (AD), and an extreme C-terminal domain (ECTD) [Citation35,Citation36,Citation37]. ATG7 functions as an E1-like enzyme for the two ubiquitin binding ligands (UBLs) LC3 and ATG12. The ADcontaining a catalytic cysteine binds the UBL thereby , catalyzing UBL activation [Citation35,Citation37]. Next, ATG7 transfers the UBL from the catalytic cysteine to the two E2-like enzymes ATG3 or ATG10. In addition, the AD mediates homodimerization, giving rise to a 2:2 ATG7:UBL stoichiometry [Citation35,Citation36,Citation38]. The combined actions of ATG7 and the cognate E2-like enzymes eventually results in LC3 lipidation.
In the present work, we describe the identification and characterization of a rare missense variant localized within the AD of ATG7 in a patient with PPM. We demonstrate impaired virus-induced autophagy in cells from this patient, resulting in increased viral burden and enhanced cell death due to defective antiviral defenses. This study builds on our previous findings and provides functional genomic evidence for the mutations we previously identified, implicating a host genetic variant in the autophagy machinery and possibly contributing to disease severity in viral infections in humans.
Results
Identification of a genetic variant in the autophagy gene ATG7 in a patient with severe paralytic poliomyelitis
The study included eighteen patients with severe PPM due to previous infection with PV during the pre-vaccination years (1940–1955). By whole-exome sequencing (WES), we identified a rare variant in the autophagy gene ATG7 with a combined annotation-dependent depletion (CADD) score of 33 and mutation significance cutoff (MSC) of 3.31 [Citation39] (), thus predicting a high likelihood of deleteriousness of the variant. Among all human variants identified in ATG7 and reported in Genome Aggregation Database (gnomAD), the ATG7A388T variant demonstrates one of the highest CADD scores (). The variant is also predicted to be deleterious by SIFT and WS-SNPs&GO [Citation40,Citation41,Citation42]. The gene damage index (GDI) of ATG7 is 3.96, which indicates that ATG7 is not a highly damaged gene, and therefore increasing the likelihood of a disease-causing potential of the variant [Citation43]. Cloning and sequencing showed equal expression of WT (c.1162A) and mutant (c.1162 G) ATG7 transcripts in patient peripheral blood mononuclear cells (PBMCs) (). The ATG7A388T variant did not affect ATG7 protein expression levels neither in fibroblasts nor in PBMCs (). The ATG7 protein is organized into three domains, including an N-terminal domain, a central AD, and an extreme C-terminal domain, of which the identified mutation is localized in the AD carrying the enzymatic activity of the protein. Notably, the A388 residue has been highly conserved throughout evolution (), also supporting an important role of this residue for function of the ATG7 molecule. Based on previously described filtration criteria [Citation20], no additional relevant variants were found in ATG7 by manually searching the gene. Altogether, these data suggest that the patient is heterozygous for a rare, potentially deleterious variant of ATG7. Strikingly, additional patients from our poliomyelitis cohort previously published (Andersen et al., 2019 [Citation20]) were found to harbor variants in genes related to autophagy, namely ULK1 (unc-51 like autophagy activating kinase 1) (c.1096 + 1 G > A; CADD score 25.8) in one patient and CTSL (cathepsin L) (c.205 G > A; CADD score 25.9) and CTSC (cathepsin C) (c.1324 C > T; CADD score 29.2) in another patient, thus lending further support to the idea that autophagy defects may play a pathogenic role in patients with severe poliomyelitis.
Figure 1. ATG7A388T is a rare variant with high CADD score. (A) Table showing characteristics of the ATG7A388T variant identified in the patient. The gene damage index (GDI) for ATG7 is 3.96, which is well below the suggested cutoff of 12.4. (B) Sanger sequencing confirming the ATG7A388T variant in P compared to a healthy control (C). (C) Frequency and combined anotation dependent depletion (CADD) score for all variants reported in the Genome Aggregation Database (gnomAD). The dotted line corresponds to the mutation significance cutoff (MSC). The CADD score of 33 for the ATG7A388T variant is well above the MSC of 3.31 for ATG7, and among the highest CADD scores identified for variants within ATG7. (D) Expression of ATG7 c.1162 G/A mRNA in PBMCs from P. mRNA from patient PBMCs was reverse transcribed into cDNA, from which ATG7 was amplified and inserted into pJET1.2 and transformed into NEB 5-alpha cells. Eight bacteria colonies were Sanger sequenced for the expression of c.1162 G or c. 1162A, n = 14. (E) Conservation of the A388 amino acid in 11 species. The amino acids conserved across species are highligthed in black. The amino acids highlighted in gray indicate that the sequence contains a residue with similar properties as those in the same position across species, whereas white indicates an amino acid whith different properties. A388 is marked in red. (F) ATG7 protein expression measured in patient and controls (NHDF-1 [C1] and NHDF-2 [C2]) primary fibroblasts by western blotting. CADD, Combined anotation dependent depletion; GDI, gene damage index; MSC; mutation significance cutoff; SIFT, sorting intolerant from tolerant
![Figure 1. ATG7A388T is a rare variant with high CADD score. (A) Table showing characteristics of the ATG7A388T variant identified in the patient. The gene damage index (GDI) for ATG7 is 3.96, which is well below the suggested cutoff of 12.4. (B) Sanger sequencing confirming the ATG7A388T variant in P compared to a healthy control (C). (C) Frequency and combined anotation dependent depletion (CADD) score for all variants reported in the Genome Aggregation Database (gnomAD). The dotted line corresponds to the mutation significance cutoff (MSC). The CADD score of 33 for the ATG7A388T variant is well above the MSC of 3.31 for ATG7, and among the highest CADD scores identified for variants within ATG7. (D) Expression of ATG7 c.1162 G/A mRNA in PBMCs from P. mRNA from patient PBMCs was reverse transcribed into cDNA, from which ATG7 was amplified and inserted into pJET1.2 and transformed into NEB 5-alpha cells. Eight bacteria colonies were Sanger sequenced for the expression of c.1162 G or c. 1162A, n = 14. (E) Conservation of the A388 amino acid in 11 species. The amino acids conserved across species are highligthed in black. The amino acids highlighted in gray indicate that the sequence contains a residue with similar properties as those in the same position across species, whereas white indicates an amino acid whith different properties. A388 is marked in red. (F) ATG7 protein expression measured in patient and controls (NHDF-1 [C1] and NHDF-2 [C2]) primary fibroblasts by western blotting. CADD, Combined anotation dependent depletion; GDI, gene damage index; MSC; mutation significance cutoff; SIFT, sorting intolerant from tolerant](/cms/asset/205dfbf1-6194-4ed0-b531-f95c5026437d/kaup_a_1831800_f0001_oc.jpg)
Autophagy proteins are important for control of PV replication in neuronal-like cells
Based on our finding of a variant in an autophagy-related gene, we wished to investigate the role of autophagy during PV infection. We used the neuronal-like cell line SK-N-SH and targeted two of the best-characterized autophagy genes, namely ATG5 and BECN1, by CRISPR-Cas9 technology. The efficiency of gene targeting on the whole pool of cells was determined by Western blotting (Figure S1A). Immunoblotting for LC3 and immunofluorescence imaging of LC3 puncta formation are standard assays for measuring active autophagy. First, we found that PV infection resulted in increased accumulation of LC3-II compared to mock, whereas this phenomenon was not observed in the genome-edited cell lines (), demonstrating that full expression of ATG5 and BECN1 most probably is important for PV-induced autophagy in the neuronal-like cells used. Next, we infected the neuronal-like cell lines with PV at a multiplicity of infection (MOI) of 0.1 and measured infectious virus in the cell culture supernatants. Following 24 h of infection, we observed a significant increase in viral titer in both ATG5 sgRNA and BECN1 sgRNA cell lines compared to WT (). Additionally, ATG5 sgRNA cells exhibited significantly enhanced cell death. This observation did not reach statistical significance in the BECN1 sgRNA cells, which may be explained by lower efficiency of the gene targeting on the whole pool of cells ( and Figure S1A). Interestingly, we did not observe induction of IFNB expression after PV infection (), and CXCL10 (C-X-C motif chemokine ligand 10) and TNFA (tumor necrosis factor) transcripts were not detectable (data not shown). The lack of induction of the classical innate antiviral IFN responses was confirmed by analysis of transcriptomes from PV-infected SH-SY5Y neuroblastoma cell line, a subclone of the SK-N-SH cell line, for expression of IFN-stimulated genes (ISGs) (, Table S2, and Table S3). Analysis of this dataset for expression of autophagy-related genes showed a modest general downregulation of many genes in this group ( and Table S4). Collectively, these data demonstrate a lack of correlation between low IFNB/IFNβ expression and increased PV replication in ATG5- and BECN1-deficient SK-N-SH cells as well as an absence of IFN pathway activation in PV-infected SH-SY5Y cells. These findings may suggest that an intact autophagy machinery, rather than exclusively the IFN system, is of critical importance for viral control and cell survival following PV infection in human neuronal-like cells.
Figure 2. Impaired viral control in the neuronal-like cell lines SK-N-SH ATG5 sgRNA and BECN1 sgRNA. (A) Neuronal-like SK-N-SH cells were infected with poliovirus (PV) at an MOI of 0.1. Western blots and quantification representative of three different experiments are shown. (B) Cells were infected with PV at an MOI of 0.1, and supernatants were harvested at the indicated time points. Data are shown with SEM, n = 3, and nonparametric Mann-Whitney rank sum test was used for statistical analysis. (C) Following 24 h of infection, supernatants were subjected to LDH cytotoxicity assay Data are shown with SD, n = 2, Students t-test. (D) Cells were infected with PV at an MOI of 0.1 for 6 h and total RNA was purified for measurement of IFNB mRNA by RT-qPCR. Data are shown with SD, n = 3, Students t-test. (E-F) Heat maps clustered by rows representing color-coded expression levels of 599 interferon stimulated genes (ISGs) [Citation79] (E) or 598 human autophagy genes [Citation80] and HADb (http://autophagy.lu/) (F) in the SH-SY5Y cell line infected with PV at an MOI of 1. Expression levels were normalized relative to uninfected cells as control group to accommodate probable technical or cell line specific effects. All experiments were performed three times, except data shown in C) which were performed twice. Table S3 and S4 show the expression values of the annotated ISGs or human autophagy genes in the heat maps. UT, Untreated; PV, Poliovirus; IFNB, Interferon beta. ISGs, Interferon signature genes. *, p ≤ 0.05; **, p ≤ 0.01; ***, p ≤ 0.001; ****, p ≤ 0.0001
![Figure 2. Impaired viral control in the neuronal-like cell lines SK-N-SH ATG5 sgRNA and BECN1 sgRNA. (A) Neuronal-like SK-N-SH cells were infected with poliovirus (PV) at an MOI of 0.1. Western blots and quantification representative of three different experiments are shown. (B) Cells were infected with PV at an MOI of 0.1, and supernatants were harvested at the indicated time points. Data are shown with SEM, n = 3, and nonparametric Mann-Whitney rank sum test was used for statistical analysis. (C) Following 24 h of infection, supernatants were subjected to LDH cytotoxicity assay Data are shown with SD, n = 2, Students t-test. (D) Cells were infected with PV at an MOI of 0.1 for 6 h and total RNA was purified for measurement of IFNB mRNA by RT-qPCR. Data are shown with SD, n = 3, Students t-test. (E-F) Heat maps clustered by rows representing color-coded expression levels of 599 interferon stimulated genes (ISGs) [Citation79] (E) or 598 human autophagy genes [Citation80] and HADb (http://autophagy.lu/) (F) in the SH-SY5Y cell line infected with PV at an MOI of 1. Expression levels were normalized relative to uninfected cells as control group to accommodate probable technical or cell line specific effects. All experiments were performed three times, except data shown in C) which were performed twice. Table S3 and S4 show the expression values of the annotated ISGs or human autophagy genes in the heat maps. UT, Untreated; PV, Poliovirus; IFNB, Interferon beta. ISGs, Interferon signature genes. *, p ≤ 0.05; **, p ≤ 0.01; ***, p ≤ 0.001; ****, p ≤ 0.0001](/cms/asset/a1ae16f1-d6d1-4df8-80a0-1ae7c6a8e327/kaup_a_1831800_f0002_oc.jpg)
Impaired viral control in patient cells heterozygous for ATG7A388T
To address whether the ATG7 variant identified in the patient might have an impact on activation of autophagy, primary fibroblasts from the patient and two controls were infected with PV for 24 h () or 48 h (Figure S2A-B). Identification of LC3 puncta following infection was reproduced robustly in the two controls, whereas limited LC3 puncta were detected in patient cells. Similar results were obtained by Western blotting when examining infection of both primary and SV40-immortalized fibroblasts with different neurotropic viruses, including PV, encephalomyocarditis virus (EMCV), and herpes simplex virus type I (HSV-1) (, Figure S2C-D).
Figure 3. Impaired LC3-I to LC3-II conversion and viral control in patient fibroblasts heterozygous for the ATG7A388T variant. (A) Immunofluorescence images of primary fibroblasts stained for LC3 (green), and 49-6-diamidino-2-phenylindole dihydrochloride (DAPI) (blue) following 24 h of PV infection at 0.1 MOI. Turquoise arrows indicate cytoplasmic LC3 (LC3-I), and yellow arrows indicate autophagosome-associated LC3 (LC3-II). (B) Quantification of the data shown in (A). Similar results were obtained following 48 h (Figure S2A-B), data are shown with SD, n = 3, nonparametric Mann-Whitney rank sum test was used for statistical analysis. The number of LC3 puncta-positive cells was quantified based on a minimum of three different pictures (from different regions of the slide) and 100 cells per slide. (C) Western blotting for LC3 and GAPDH on lysates from primary fibroblasts from P and three controls infected for 24 h with PV (MOI 50) EMCV (MOI 0.1), HSV-1 (MOI 0.1 or 1) and/or stimulated with 20 μm chloroquine 4 h prior to lysing. Western blot showing the patient and one control representative of the three independent experiments is shown. (D) Quantification of the three experiments from (C), data are shown with SEM, n = 3, nonparametric Mann-Whitney rank sum test was used for statistical analysis (E) Western blotting for LC3 and GAPDH on lysates from primary fibroblasts from P and 3 controls stimulated with 500 nM rapamycin for 12 h with and/or chloroquine 4 h prior to cell lysis l. Western blot showing the patient and one control representative of the three independent experiments is shown. (F) Quantification of the three experiments from (E), data are shown with SEM, n = 3, nonparametric Mann-Whitney rank sum test was used for statistical analysis. (G) SV40-immortalized fibroblasts were infected with PV at an MOI of 0.1 and supernatants were harvested at the indicated time points for measurement of viral yield. Data are shown with SEM, n = 3, nonparametric Mann-Whitney rank sum test was used for statistical analysis. Results were confirmed in primary fibroblast using four different controls (Figure S2G-H). (H) SV40-immortalized fibroblasts were infected with PV at an MOI of 0.1 and supernatants were isolated 48 and 72 h post infection and subjected to LDH release assay. Data are shown with SEM, n = 3, nonparametric Mann-Whitney rank sum test was used for statistical analysis. All experiments were performed at least three times. UT, untreated; Rapa, rapamycin; DMSO, dimethylsulfoxide; Chl, chloroquine; EMCV, encephalomyocarditis virus; HSV, herpes simplex virus; PV, poliovirus. # indicates SV40 immortalized cells. *, p ≤ 0.05; **, p ≤ 0.01; ***, p ≤ 0.001; ****, p ≤ 0.0001
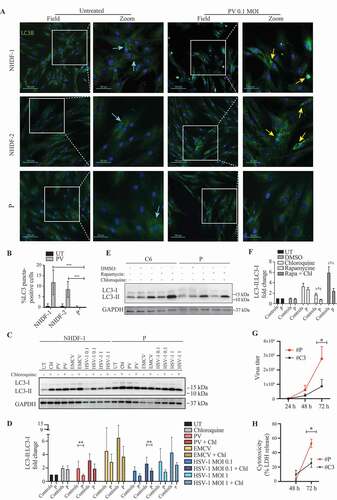
To ensure that the decreased virus-induced autophagy was due to impaired activation and not increased autophagosome degradation, we next measured autophagic flux by infecting the cells in the presence or absence of chloroquine to block autophagosome-lysosome fusion and acidification. For all viruses tested, the presence of chloroquine enhanced autophagy induction as evidence of virus-induced autophagy flux. These data confirmed impaired PV-induced autophagy in patient cells, along with impaired HSV1-induced autophagy, thus revealing and overall tendency toward decreased virus-induced autophagy (, Figure S2E-F). Importantly, rapamycin-induced autophagy and flux was also significantly impaired in patient cells with the ATG7A388T variant (). Interestingly, along with the defective autophagy we found a significant increase in viral yield from PV-infected patient cells (, Figure S2G-H). In addition, fibroblasts from the patient showed enhanced cell death following PV infection, in line with impaired control of viral replication ().
Next, we sought to understand, whether these observations also applied to patient cells beyond fibroblasts. Monocyte-derived macrophages (MdMs) from the patient and from nine controls were infected with PV, after which we observed a significant increase in viral burden in the patient MdMs compared to pooled controls (Figure S2I). By Western blotting we also observed reduced constitutive autophagy in the MdMs, although the difference was most robustly seen following addition of rapamycin to cells (Figure S2J-K). Importantly, the high viral burden was unlikely to be due to impaired production of antiviral cytokines, since levels of IFNB, CXCL10 or IL6 (interleukin 6) were unaffected in patient PBMCs (Figure S3A-D) and MdMs (Figure S3E). In addition, the patient did not display any obvious impairment in cytokine production following stimulation with TLR3 or TLR8 ligands (Figure S3F-H). Notably, two additional patients from the cohort previously published [Citation20] were found to harbor variants in ULK1 (involved in induction of the autophagosome) and CTSL and CTSC (involved in lysosomal degradation) together with a high viral burden in MdMs, thus further supporting the hypothesis that autophagy exerts antiviral activities against PV in humans and that impaired autophagy may increase susceptibility and/or severity of PV infection (Figure S3I-K). Taken together, these data demonstrate impaired activation of autophagy in patient fibroblast and MdMs, correlating with increased viral replication and enhanced cell death.
ATG7 is essential for viral control in neuronal-like cells
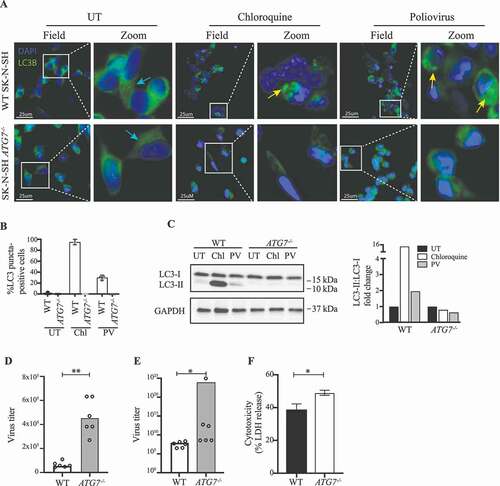
To establish more conclusively a role for ATG7 in control of PV replication, we targeted the gene in SK-N-SH cells using CRISPR-Cas9 technology. Several clones were confirmed to lack ATG7 expression (Figure S1B-D), and to be unable to activate autophagy (). We infected four different SK-N-SH ATG7−/- clones or WT with PV or stimulated with chloroquine for 6 h. In contrast to ATG7 WT cells, no accumulation of LC3 puncta or LC3-I to LC3-II conversion was observed in the ATG7-deficient cells, demonstrating a key regulatory role of ATG7 in autophagy pathways during PV infection in neuronal-like cells (). With this experimental set-up, consisting of ATG7-deficient cells, we investigated the viral load of the ATG7−/- cell line following PV infection. Interestingly, we found an increased viral burden in all of the clones infected ( and Figure S4A), which can indeed be attributed to ATG7 deficiency, because transduction of ATG7−/- neuronal-like cells with a lentiviral vector encoding WT ATG7 restored control of infection (Figure S4C). In addition, the majority of clones displayed enhanced cell death ( and Figure S4B). Together, these data confirm the results from patient fibroblasts and MdMs with the monoallelic ATG7A338T variant and further underscore the major implication of ATG7 disruption on the autophagy response to PV infection .
Figure 4. Impaired viral control in SK-N-SH ATG7−/- neuronal-like cell line. (A) Immunofluorescence images of neuronal-like SK-N-SH cells stained for LC3 (green), and 49-6-diamidino-2-phenylindole dihydrochloride (DAPI) (blue). Cells were infected with PV at an MOI of 50 or stimulated with 50 nM chloroquine for 6 h. Turquoise arrows indicate cytosolic LC3 (LC3-I), and yellow arrows indicate autophagosome-associated LC3 (LC3-II). Images representative of the four different clones are shown. (B) Quantification of (A). The number of LC3 puncta-positive cells was quantified based on a minimum of three different pictures (from different regions of the slide) and 100 cells per slide. (C) Cell lysates were prepared from WT SK-N-SH and SK-N-SH ATG7−/- cells and immunoblotting for LC3 was performed. Western blots and quantification representative of 2 different clones. (D) Cell lines were infected with PV at an MOI of 10 and supernatants were harvested 8 h post infection. All data points are shown with bar line at mean, n = 2, nonparametric Mann-Whitney rank sum test was used for statistical analysis. (E) Cell lines were infected with PV at an MOI of 0.1 and supernatants were harvested 24 h post infection. Data representing all data points from two independent experiments are shown with bar line at mean, n = 3, nonparametric Mann-Whitney rank sum test was used for statistical analysis. Similar results were obtained for six different clones (Figure S4A). (F) Cell lines were infected with PV at an MOI of 0.1. Following 24 h supernatants were subjected to LDH release assay. Data are shown with SD, n = 2, nonparametric Mann-Whitney rank sum test was used for statistical analysis. Similar results were obtained in four different clones (Figure S4B). UT, untreated; Chl, chloroquine 50 nM; PV, poliovirus; WT, wild-type. *, p ≤ 0.05; **, p ≤ 0.01; ***, p ≤ 0.001; ****, p ≤ 0.0001
Rescue of WT ATG7 restores PV-induced autophagy and control of infection
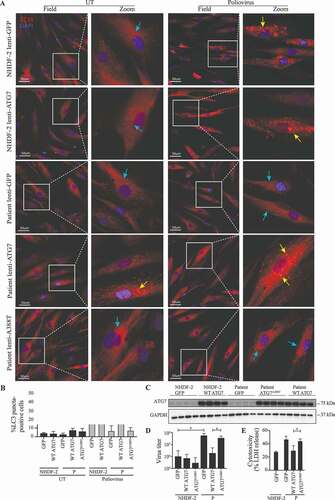
Finally, we wanted to examine the effect of re-introducing WT ATG7 expression into fibroblasts from the patient. Cells were transduced with lentiviral vectors encoding eGFP, WT ATG7, or ATG7A388T and infected with PV or stimulated with rapamycin. Importantly, expression of WT ATG7 in patient fibroblasts restored the ability of virus to induce autophagy to the same level as in control fibroblasts (). By contrast, cells transduced with vectors encoding eGFP or the patient variant ATG7A388T remained unable to induce autophagy in response to PV infection (). Western blotting for ATG7 and GAPDH on lysates from primary fibroblasts from P and the control transduced with lentiviral vectors encoding eGFP, WT ATG7 or ATG7A388T demonstrated similar levels of endogenous ATG7 in patient and control fibroblasts, as well as similar levels of exogenous WT ATG7 and ATG7A388T protein expression levels (). To ensure that the autophagy defect observed in patient cells was due to impaired activation, we measured autophagy flux by stimulating cells with rapamycin in the presence or absence of chloroquine. We found that autophagy flux induced by rapamycin and chloroquine was reduced in patient cells compared to controls and reconstituted to high levels when expressing WT ATG7 in patient cells (Figure S5). To examine the cellular phenotype and consequences of defective autophagy, we next measured viral replication and cell death. The increase in PV-activated autophagy in patient cells transduced with WT ATG7 was mirrored by reduced viral load (), and virus-induced cell death was reduced to the same level as in control cells transduced with eGFP (). Transduction with lentiviral vectors encoding eGFP, WT ATG7 or ATG7A388T into fibroblasts from a healthy control did neither affect PV-induced autophagy nor the ability to control viral infection. Thus, reconstitution of WT ATG7 expression in patient fibroblasts restored the ability of cells to activate autophagy upon PV infection and rapamycin stimulation, and to control PV replication and avoid excessive cell death.
Figure 5. Rescue of WT ATG7 restores PV-induced autophagy and control of infection. (A) Immunofluorescence images of primary fibroblasts stained for LC3 (red), and 49-6-diamidino-2-phenylindole dihydrochloride (DAPI) (blue). The fibroblasts were transduced with lentiviral vectors encoding eGFP, WT ATG7 or ATG7A388T and infected with PV at an MOI of 0.1 for 24 h. Turquoise arrows indicate cytosolic LC3 (LC3-I), and yellow arrows indicate autophagosome-associated LC3 (LC3-II). (B) Quantification of the data shown in (A). The number of LC3 puncta-positive cells was quantified based on a minimum of three different pictures (from different regions of the slide) and 100 cells per slide. Data are shown with SD, n = 2, Students t-test was used for statistical analysis. (C) Western blotting for ATG7 and GAPDH on lysates from primary fibroblasts from P and the control transduced with lentiviral vectors encoding eGFP, WT ATG7 or ATG7A388T. (D) Primary fibroblasts were transduced with lentiviral vectors encoding eGFP, WT ATG7 or ATG7A388T and infected with PV at an MOI of 0.1. Supernatants were harvested following 72 h for measurement of viral yield. Data are shown with SD, n = 2, nonparametric Mann-Whitney rank sum test was used for statistical analysis. (E) Primary fibroblasts were transduced with lentiviral vectors encoding eGFP, WT ATG7 or ATG7A388T and infected with PV at an MOI of 0.1. Supernatants were harvested following 72 h for measurement of viral yield. Data are shown with SD, n = 2. All experiments were performed twice. Students t-test was used for statistical analysis. WT, wild-type; UT, untreated; P, patient; GFP, green fluorescent protein. *, p ≤ 0.05; **, p ≤ 0.01; ***, p ≤ 0.001; ****, p ≤ 0.0001
Discussion
Here we present data demonstrating a previously unappreciated antiviral role of autophagy in control of PV infection. Using an unbiased exome-wide approach in a cohort of individuals with severe clinical manifestations following PV infection, we identified a rare variant in ATG7 in an adult Caucasian female who developed severe PPM in young adolescence. The ATG7A388T variant is predicted to be damaging by various in silico tools, but does not affect ATG7 protein expression levels. We demonstrate impaired autophagy flux, elevated PV replication, and increased cell death in cells from the patient. This cellular phenotype was further supported by similar findings in the neuronal-like cell line SK-N-SH made deficient in ATG7 by CRISPR-Cas9 technology. Reconstitution of patient cells with WT ATG7 enabled normal PV-induced activation of autophagy, restored the ability to control PV replication, and led to avoidance of excessive virus-induced cell death. Predicted defects in autophagy-related genes and elevated viral replication were also identified in two other poliomyelitis patients.
Mice lacking ATG7 are born with multiple cellular abnormalities and die within one day after birth [Citation44], hence it is more likely that the variant in the patient described here causes reduced signaling capacity of the abnormal molecule rather than total gene disruption. Furthermore, the patient is heterozygous for the ATG7 variant and thus expresses one WT ATG7 allele. Altogether, this suggest that the genetic mechanism explaining the clinical phenotype is haploinsufficiency, although some dominant negative effect of the mutated ATG7 cannot be entirely excluded, since ATG7 homodimerizes prior to ATG8-lipidation (yeast analog of LC3) in yeast and possibly in humans [Citation38,Citation45]. We did not observe any difference in autophagy induction when transducing control fibroblasts with lentiviral vectors encoding ATG7A388T, thus arguing against a dominant negative mechanism (). ATG7 is key regulator of LC3-I to LC3-II conversion [Citation32], although LC3 lipidation is not, in it self, a measure of autophagy, which is a limitation of this study.
Indeed, we showed impaired LC3-I to LC3-II conversion following infection of cells from the patient or stimulation with rapamycin. Interestingly, we also observed defective LC3-I to LC3-II conversion, as measured by Western blotting, when stimulating with chloroquine or infecting with HSV-1. This suggests that the autophagy machinery in response to various stimuli is reduced in the patient in agreement with ATG7 haploinsufficiency. Indeed, it has previously been reported that the genetic mechanism underlying many primary immunodeficiencies with heterozygous inheritance involves haploinsufficiency with incomplete penetrance [Citation46,Citation47,Citation48]. A limitation of the present study is that autophagy levels may decline with age, and regrettably we did not have material from age-matched controls available. However, given the consistency of our results obtained from different gender-matched controls, genome-edited cell lines as well as reconstitution experiments, we do not think that this issue represents a substantial bias for the interpretation of the results and the conclusions drawn.
A major finding of the present study was the observation of increased viral burden in patient MdMs and fibroblasts while antiviral IFN responses were normal. Furthermore, the defective autophagy pathways were associated with elevated virus-induced cell death. This suggests that cytoplasmic digestion of PV particles through autophagy might represent an important mechanism in control of PV replication. The implications of an antiviral role of autophagy in PV infection probably extends beyond the CNS [Citation21], but it may be most prominent in this compartment [Citation49]. Previous studies with Sindbis virus and HSV mutants have suggested an important role for autophagy in control of viruses in the CNS in mice [Citation25,Citation26,Citation28]. Moreover, it has been demonstrated that autophagy prevents cellular damage in terminally differentiated cells, such as neurons [Citation49,Citation50]. It could therefore be speculated that one purpose of autophagy as an antiviral defense in the CNS is to protect the integrity of non-renewable motor neurons [Citation51], and to prevent the production of excessive antiviral IFN, which can be pathological and neurotoxic [Citation28]. In support of this, we observed a very limited PV-induced ISG response in neuronal-like cell lines, but a robust IFN response in macrophages. We speculate that an increased viral burden in MdMs is in agreement with a “Trojan horse” model for PV transport in macrophages into the CNS [Citation52,Citation53]. Indeed, monocytes have recently been described as a primary replication site for PV [Citation7]. Collectively, these data highlight the importance of ATG7 and autophagy in neuronal-like cells, but also in non-neural tissue such as fibroblasts, and suggest a central role in antiviral defenses against PV with direct impact on virus load and cellular survival.
Previous studies have also suggested pro-viral roles for autophagy during virus infections, including PV. Current knowledge state that PV converts components from the autophagy machinery to a membrane-bound focus for replication, generation of virus progeny, and exit in a non-lytic manner [Citation54,Citation55,Citation56,Citation57,Citation58], thus PV utilizes non-canonical autophagy. However, because infection leads to reorganization of intracellular membranes [Citation54,Citation56,Citation57,Citation58,Citation59,Citation60,Citation61,Citation62,Citation63] a cytoprotective stress response may be induced later during infection. This would lead to the induction of cytoprotective ATG7-dependent canonical autophagy. Indeed, the impact of the ATG7A388T variant was prominent at a late stage of infection.
Our study does not necessarily contradict previous studies, but adds a new layer of complexity to the field. In the evolutionary race for survival, in which viruses have evolved different strategies to subvert or combat autophagy, a fine balance is crucial for both virus and host continuance [Citation64]. Indeed, a complete viral subversion of autophagy poses an intriguing impossibility: effective subversion of antiviral mechanisms cannot occur; otherwise the affected host would not exist. Several studies have pointed toward an antiviral role of autophagy against PV [Citation65,Citation66], suggesting that autophagy seems to contribute to both anti-viral and pro-viral pathways, in a setting where the roles of autophagy may depend on virus, cell type, phase of infection, and the cellular environment, Indeed, recent data demonstrate that host factors, such as PLAAT3/PLA2G16 facilitates viral genome translocation into the cytoplasm and prevents clearance, whereas LGALS8/galectin-8 detects permeated endosomes and marks them for autophagic degradation. Knockout of LGALS8 but also ATG7 restored viral susceptibility in PLAAT3/PLA2G16-deficient cells, suggesting a role for ATG7 as an important host factor protecting against viral escape [Citation66]. Indeed, the idea of an antiviral role in concert with a proviral role for autophagy in PV infection is in line with descriptions of both pro- and anti-apoptotic mechanisms orchestrated during PV infection. It has been proposed that picornaviruses initially trigger the pro-apoptotic pathway, but terminate the process before resulting cell death to prolong the agony of the infected cell, furnishing itself with the required time to complete its replication, the final result of the apoptotic status of PV-infected cells being finely balanced [Citation67,Citation68].
Collectively, we here report a missense ATG7 variant in a patient with PPM, and suggest that it contributed to the severe clinical manifestation of the infection progressing to severe disease. Given that reconstitution of patient cells with WT ATG7 protein restored the phenotype to the one observed in control cells [Citation48], these data suggest a causal relationship between the ATG7 variant and impaired autophagy in patient cells together with inability to control PV replication. Although the data obtained in the CRISPR-Cas9 gene-edited neuronal-like cells are the result of total (biallelic) ATG7-deficiency, we think that the overall pattern is largely identical to the picture seen in the patient cells with the monoallelic ATG7A338T variant with respect to autophagy, viral replication and cytotoxicity, for which reason we think that the SK-N-SH neuronal-like cell line represents a fair reflection of the physiological situation. Altogether, this is in agreement with the hypothesis of a disease-causing role of the ATG7 variant in causing severe PPM in this patient.
Based on our data we suggest a role for autophagy in cytoprotective stress responses evoked by viral infection. Restriction factors, in the original meaning of the term, are proteins that inhibit viral replication by blocking specific steps in the viral replication cycle. Based on these criteria, ATG7 alone is not a restriction factor, but is part of a biological process, namely autophagy, which exhibit virus-restricting activity Paludan et al Nat rev immunol 2020 PMID 32782357. We advocate that the role of autophagy should be investigated in larger cohorts in future studies on genetic susceptibility to PV and other neurotropic viruses. This approach will contribute not only to the field of primary immunodeficiencies, but also add knowledge on the complex pro- and antiviral roles of autophagy in PV infection, as well as teach us about the pathogenesis,antiviral mechanisms, and protective immunity to other neurotropic viruses. Finally, the perspectives of studying autophagy include novel treatment strategies for viral infections of the CNS. Previous studies showing a proviral role for autophagy in PV infection have proposed to target host autophagy as a novel treatment modality. In light of our data, these suggestions should be considered with caution as targeted pharmalogical drugs that impair host autophagy in the CNS might accelerate the morbidity and mortality of PPM and potentially other viral CNS infections.
Materials and methods
Case report
We investigated an 81-year old Caucasian female infected with PV in 1949 at the age of twelve years. The case report is based on the memory of the patient: The clinical manifestation started as a neck-pain and evolved to paralysis of both legs overnight. The patient (P) was hospitalized and a lumbar puncture showed PV in the cerebrospinal fluid. Over the following days the paralysis developed to include arms, trunk, back, and respiratory muscles. However the patient survived the infection. During a 9-month recovery period, the patient regained enough strength in her arms to lift a heavy book over her head. She learned how to walk using leg-bandages and the remaining muscle function in her hips. Moreover, she was able to sit with a straight back, probably because of compensatory muscle functions. Today, her minimal walking ability is attributable to crutches, together with her remaining muscle-function in hips and bandages. She has no muscle function in the abdomen or back, and she struggles with breathing problems. She can lift her arms to some extent, however, she cannot comb her own hair. Her lungs are underdeveloped and her liver, heart and kidneys are misplaced due to impaired muscle tone at the level of the trunk. She is otherwise healthy, has completed one pregnancy and has never received any medications. In particular, she has neither experienced any increased frequency nor severity of infections, and standard clinical immunological examination was unremarkable (Table S1). The patient is an only child and most of her family members are deceased, and there are no medical reports of PPM in any of these. The daughter is alive and well, and vaccinated against PV.
Patient material
The patient was part of a cohort including eighteen patients with PPM, six of whom harbored potential deleterious variants in genes related to autophagy pathways [Citation20]. Blood was collected in lithium heparin-stabilized tubes (BD Diagnostics, 368,480) and isolated by a ficoll (VWR, 17–1440-03) density gradient in SepMate tubes (Stemcell Technologies, 85,450). Briefly, heparinized blood was diluted 1:1 in PBS and added to Ficoll (VWR, 17–1440-03) containing SepMate tubes (Stemcell Technologies, 85,450). PBMCs were isolated by centrifugation at 1200 g for 10 min. Supernatants containing PBMCs were transferred to new tubes and the PBMCs were washed twice in PBS (Biowest, L0615). PBMCs were subsequently resuspended in HI-FBS (Biowest, S181H) containing 10% DMSO (Merck, 102,952). PBMCs were stored in liquid nitrogen until use. Frozen PBMCs were resuspended in RPMI 1640 (Biowest, L0498) supplemented with 10% heat inactivated (HI) FBS (Biowest, S181H), 100 IU/ml penicillin, and 100 μg/ml streptomycin (1% P/S) (Biowest, L0500, S140B, L0018). PBMCs were incubated overnight at 37°C in 5% CO2 before infections. MdMs were differentiated from 5 × 10⁵ PBMCs in RPMI containing 10% HI-FBS, 10% human AB serum (Sigma-Aldrich, H4522), 1% P/S and 15 ng/ml human CSF1/M-CSF (colony stimulating factor 1) (Peprotech, 300–25). Medium was changed to DMEM (Biowest, L0102) with 10% human AB serum, 15 ng/ml CSF1 on days 4 and 7. The MdMs were used for experiments on day 9. Primary fibroblasts were isolated from a 6 mm punch biopsy and immortalized using SV40 large T antigen. All fibroblasts were cultured in DMEM with 10% HI-FBS and 1% P/S. PBMCs were collected from fourteen healthy gender-matched controls recruited from Aarhus University Blood bank in accordance with ethical standards of the Helsinki Declaration. Control fibroblasts were a gift from the lab of Prof. Jacob Giehm Mikkelsen.
Whole-exome sequencing (WES), Sanger sequencing, and bioinformatics
Genomic DNA isolation and WES was performed as previously described [Citation69,Citation70]. Briefly, genomic DNA was isolated using the DNeasy Blood and Tissue Kit (Qiagen, 69,504) according to manufacturer instruction. WES was performed using Kapa HTP Library preparation and Nimblegen SeqCap EZ MedExome Plus kit (Roche, 07681364001) and analyzed with Nextseq version 2 chemistry [2 × 150 base pairs (bp)]. Single nucleotide polymorphisms (SNPs) were called relative to hg19. The variant call files (VCF) were uploaded to Ingenuity variant analysis (IVA; Qiagen, Valencia, VA, USA) version 5.2.20180419. Variants were filtered based on frequency below 0.01%, a gene list of 2363 genes based on biological filters in IVA, a CADD score [Citation71] above 15, or frameshift, missense, insertions or deletions. The filter settings are available upon request and described in details elsewhere [Citation20]. A full list of the filtered variants from the patient as well as a separate analysis for less rare variants (<2%) in genes known to be involved in autophagy or those picked up in library screens for regulating PV replication [Citation66,Citation72,Citation73] is available from the authors upon request. Finally 452 known PID genes were searched and not found to harbor variants in the patient. The PopViz plot was generated by use of PopViz webserver and subsequently modified in Adobe Illustrator SC6 [Citation74].
Sanger sequencing of ATG7 in patient and control PBMCs
gDNA ATG7 was amplified by PCR using the PCR primers and Phusion Hot Start II DNA polymerase (Thermo Fischer Scientific, F549S). Sanger sequencing using the sequencing primers confirmed the variant in ATG7. PCR primers were: Forward 5ʹ-ATCTTGGGTCCTTGTTGGC-3ʹ, Reverse 5ʹ-TGCACCAGTCAGAACTCTG-3ʹ. Sequencing primers were: Forward 5ʹ-TGGAGGAGTTCATTCAGGC’-3ʹ, Reverse 5ʹ-ACCAAGAACGCACTGAAGG-3ʹ. The control fibroblasts from healthy donors and the WT SK-N-SH cell line used for experiments were Sanger sequenced to rule out the presence of the ATG7A338T mutation, which was not present in any of these controls.
Cloning and sequencing of ATG7 mRNA expression in PBMCs
RNA was isolated from P’s PBMCs using NucleoSpin® 96 RNA kit (Macherey–Nagel, 740,709.4,), followed by reverse transcription into cDNA using QuantiTect Reverse Transcription kit (Qiagen, 205,314) and Oligo(dT) primers (Sigma-Aldrich). Then, ATG7 was amplified by PCR using Phusion Hot Start II DNA polymerase (Thermo Fischer Scientific, F-549S) and the following primers: ATG7 forward: 5′-ATGGACCCTAAAAGGTTAGCTGAG-3ʹ and ATG7 reverse: 5ʹ-GGCATAGGTATGCTCATGTTGA-3ʹ and blunt-end ligated into pJET1.2 using CloneJET PCR cloning kit (Thermo Fischer Scientific, K1231) according to manufacturer’s instructions. The cloned products were subsequently transformed into NEB 5-alpha competent E. coli cells and colonies investigated to determine the expression of either c.1162 G or c.1162A using Sanger sequencing and the following primers: pJET forward: 5′-CGACTCACTATAGGGAGAGCGGC-3′ and pJET reverse: 5ʹ-AAGAACATCGATTTTCCATGGCAG-3.
Sequence alignment
The following ATG7 protein sequences were obtained from UniProt (http://www.uniprot.org/): Homo sapiens isoform 1 O95352, Homo sapiens isoform 2 O95352-2, Homo sapiens isoform 3 O95352-3, Chimpanzee A0A2I3ST48, Mouse Q9D906, Rat Q641Y5, Pig A0A286ZKK7, Dog F1PI66, Bos_Taurus E1BNN7, Horse F6UQV4, Chicken Q5ZKY2, Zebrafish A0A0G2KPR3, Fruitfly Q7JY94. Sequences were aligned using Clustal Omega CLUSTAL O(1.2.4) multiple sequence alignment [Citation75]. BoxShade 3.21 was used for converting the alignment file to a EPS.
CRISPR-Cas9 genome editing in SK-N-SH neuronal-like cell lines
Genome editing in the ATG5, BECN1, and ATG7 genes in the neuronal-like cell line SK-N-SH (ATCC® HTB-11™) was done using CRISPR-Cas9 technology.
SK-N-SH ATG5 sgRNA and SK-N-SH BECN1 sgRNA neuronal-like cell lines
The ATG5 sgRNA and BECN1 sgRNA SK-N-SH neuronal-like cell lines were generated by cloning annealed sgRNA sequences into lentiCRISPRv2 puro plasmid (Addgene, 98,290; deposited by Brett Stringer). The cell lines were generated as a pool by transducing lentiviral vector encoding Cas9 and corresponding sgRNA followed by selection with puromycin to remove non-transduced cells. We designed two sets of sgRNAs for each gene. The sgRNAs targeting ATG5 were 1-hatg5-sense: 5ʹ-CACCGATCACAAGCAACTCTGGAT-3ʹ, 1-hatg5-antisense: 5ʹ-AAACATCCAGAGTTGCTTGTGATC-3ʹ and 2-hatg5-sense: 5ʹ-CACCGCCTTAGATGGACAGTGCAGA-3ʹ, 2-hatg5-antisense: 5ʹ-AAAC TCTGCACTGTCCATCTAAGGC-3ʹ. The sgRNAs targeting BECN1 were 1-hatg6-sense: 5ʹ-CACC GAAACTCGTGTCCAGTTTCAG-3ʹ, 1-hatg6-antisense: 5ʹ-AAACCTGAAACTGGACACGAGTTTC-3ʹ and 2-hatg5-sense: 5ʹ-CACCGGACACGAGTTTCAAGATCC-3ʹ, 2-hatg6-antisense: 5ʹ-AAACGGATCTTGAAACTCGTGTCC-3ʹ. Genomic DNA was harvested following PCR amplification of the region of interest. The following primers were used for PCR amplification and sequencing of ATG5: Forward hatg5 5ʹ-CTCCATTCCACATCTTTGCC-3ʹ, Reverse hatg5 5ʹ-CTTAGAGTAATGGCATTTCC-3ʹ. The following primers were used for PCR amplification and sequencing of BECN1: Forward hatg6 5ʹ-GAGGTGAAGAGCATCGGGGG-3ʹ, Reverse hatg6 5ʹ-CCATCACGCCCGGCTAATTT-3ʹ. All sequences were analyzed using TIDE version 2.0.1 [Citation76]. The efficiency of gene targeting on whole pools of cells was determined by western blotting.
SK-N-SH ATG7−/- neuronal-like cell line
The CRISPR-Cas9 system was employed to generate clonal ATG7 knockout cell lines. We designed three sets of sgRNAs: g68 sense: 5ʹ-CCACTCATAGAGAGGCTGCCTCAC-3ʹ, g68 antisense: 5ʹ-AAACGTGAGGCAGCCTCTCTATGA-3ʹ. g69 sense: 5ʹ-CCACCGTGAGACACATCACATTTG-3ʹ, g69 antisense: 5ʹ-AAACCAAATGTGATGTGTCTCACG-3ʹ. g70 sense: 5ʹ-CCACTCTCCTACTCCAATCCTGTG-3ʹ, g70 antisense: 5ʹ-AAACCACAGGATTGGAGTAGGAGA-3ʹ. CRISPR-Cas9 plasmid px330 (Addgene, 48,138; deposited by Feng Zhang) was cut with BbsI and ligated to annealed sgRNAs. The plasmids were amplified by transformation of E. coli, and purified using GeneJet Plasmid Miniprep Kit (Thermo Fischer Scientific, K0503) according to manufacturer’s instructions. Sanger sequencing verified successful insertion of the guides. SK-N-SH cells were transfected with 500 ng sgRNA-encoding plasmid DNA using 5 µL Lipofectamine 2000 (Thermo Fischer Scientific, 11,668,030) according to manufacturer’s instructions. After 48 h, single eGFP-positive cells were sorted into 96-well plates using a FACSAria III high-speed cell sorter. Fifty single-cell clones were sequenced by harvesting genomic DNA following PCR amplification of the region of interest. The following primers were used for PCR amplification and the forward primer was used for sequencing: Forward 5ʹ-TACAGGAAACCAGGCACTGAG-3ʹ, Reverse 5ʹ-CAACAACATACCACACCGGG-3ʹ. Knockout was verified using TIDE version 2.0.1 [Citation76] and by western blotting.
Virus strains and stimulations
Infections were performed with Human PV 1, LSa strain (a variant of the Mahoney strain), (ATCC®, VR-59™) at an MOI of 0.1, 1, 10 or 50 for fibroblasts, 10 MOI for MdMs, 100 MOI for PBMCs, and 0.1 or 50 MOI for SK-N-SH neuronal-like cell lines, at indicated time points. Fibroblasts were infected with EMCV at an MOI of 0.1, and HSV-1 + 17 strain at an MOI of 0.1 or 1 for 24 h. For the RNA sequencing we used a SH-SY5Y (ATCC®, CRL-2266™) cell line infected with PV at an MOI of 1 for 4, 12 or 24 h. Fibroblasts were stimulated with 500 nm rapamycin (Enzo, ENZ-51,031-K200) in DMSO for 12 h and/or 20 μM chloroquine (Enzo, ENZ-51,031-K200) for 4 h. SK-N-SH cell lines or MdMs were stimulated with 50 μM chloroquine or 200 nM rapamycin in DMSO (Enzo, ENZ-51,031-K200) at indicated time points. PBMCs were stimulated with 2 ug/mL high molecular weight (HMW) poly(I:C), (Invivogen, tlrl-pic), or 4.5 ug/mL ssRNA40/LyoVec™ (Invivogen, tlrl-lrna40) for 6 h.
Lentiviral vector production and transduction of primary fibroblasts
For plasmid construction, ATG7 isoform B-encoding cDNA missing exon 17 was acquired commercially (PlasmID: HsCD00449157) and inserted into a BamHI -and XhoI-digested pCCL/PGK-eGFP [Citation77] using NEBuilder HiFi DNA Assembly (New England Biolabs, Ipswich, MA) according to manufacturer’s instructions together with a GeneArt Strings DNA fragment (ThermoFisher Scientific) encoding ATG7 exon 17 to create pCCL/PGK-ATG7 encoding the ATG7 isoform A. The ATG7 c.1162 G > A patient variant was subsequently introduced by PCR amplification of the ATG7 isoform A variant and insertion into BamHI -and XhoI-digested pCCL/PGK-eGFP to create pCCL/PGK-ATG7(1162 G > A) by NEBuilder HiFi DNA Assembly. Lentiviral vectors were produced by standard calcium phosphate transfection of the packaging plasmids pMD2.G, pRSV-Rev and pMDIg/pRRE together with either pCCL/PGK-eGFP, pCCL/PGK-ATG7 or pCCL/PGK-ATG7(c.1162 G > A) into HEK293T cells. Virus-containing supernatants were harvested 48 h after transfection, filtered through 0.45-µm filters (Agilent 5190–5270), and finally polybrene (Sigma-Aldrich, 107,689) was added to a final concentration of 8 µg/ml. For transduction of patient and NHDF-2 fibroblasts, filtered supernatants were added to fibroblasts seeded at 2–3 × 10⁵ cells/flask in T25 culture flasks one day prior to transduction. The transduction efficiency as evaluated by eGFP expression was between 80 and 90%.
Immunofluorescence and quantification of LC3 puncta-positive cells
Fibroblasts were grown to 50% confluency on 12-mm coverslips and fixed with 100% methanol on ice before washing with PBS (Biowest, L0615) and permeabilized with 0.1% Triton X-100 (Sigma-Aldrich, T8787) in PBS. Blocking was done in 10% FBS-PBS. Staining with primary rabbit monoclonal antibody (mAb) anti-LC3B (Abcam, ab192890;) was performed at 4°C overnight following staining with secondary F(ab’)2-Goat anti-Rabbit IgG (H + L) Cross-Adsorbed antibody, Alexa Fluor 488 (Thermo Fischer Scientific, A-11,070,) 1 ug/mL in 1% FBS-PBS, 1 h at RT. In the experiments including lentiviral vector reconstitution we used F(ab’)2-Goat anti-Rabbit IgG (H + L) Cross-Adsorbed Secondary Antibody, Alexa Fluor 647 (Invitrogen, A21246, Lot 1,884,893), 4 ug/mL in 1% FBS-PBS as the secondary antibody. The coverslips were incubated 10 min with DAPI Solution (Thermo Fischer Scientific, 62,248) 1:25,000, before being moved to a slide containing one drop of ProLong™ Diamond Antifade Mountant with DAPI, (Thermo Fischer Scientific, P36966). Images were taken on a fluorescence microscope (Leica DM2000 LED, HC PL 20X FLUOTAR objective (NA 0.55) or 40X FLUOTAR objective (NA 0.80) using LAS 4.12 software. The number of LC3 puncta-positive cells was quantified using FIJI [Citation78] on a minimum of 3 pictures (from different regions of the slide) and 100 cells per slide. The reconstitution experiments were blinded in a way so the person acquiring the images and performing the quantification, did not know the conditions or donors of the slides.
Western blotting
Western blotting was performed as previously described [Citation46]. Briefly, 2–6 × 10⁴ fibroblasts or 6 × 10⁵ SK-N-SH cells were seeded for overnight incubation, or until 70% confluent, in 12- or 24-well plates. Following infection, supernatant was discarded and cells were lysed on ice using RIPA Lysis and Extraction Buffer supplemented with Halt™ Protease Inhibitor Cocktail (Thermo Fischer Scientific, 89,901, 78,439) and benzonase (Sigma-Aldrich, E1014-25KU). Cell lysates were denatured together with DTT (Sigma Aldrich, 43,816) and Laemmli sample buffer (Bio-Rad, 1,610,747). One or 2 ug of protein (fibroblasts) or 4 ug of protein (SK-N-SH cell lines) was loaded to each well on a 4–20% Criterion™ TGX™ Precast Protein Gel (Bio-Rad, 5,671,095, 5,671,094, 5,671,093, 5,671,093). Proteins were transferred to a PVDF membrane (Bio-Rad, 1,704,156, 1,704,157) and blocked in 5% BSA (Sigma-Aldrich, A8022) for 1 h at room temperature. For the ATG7 western blot, the membrane was blocked in 5% skimmed milk. Following blocking, membranes were incubated with primary antibody at 4°C overnight on a rocking table. Secondary antibody was added for 1 h at room temperature and developed in Clarity Max™ Western ECL Substrate (Bio-Rad, 1,705,062) for 1 min and visualized using ChemiDoc gel imaging system (Bio-Rad, USA). Primary antibodies were rabbit mAb anti-ATG7 antibody (Abcam, ab133528) 1:10,000, rabbit mAb anti-LC3B antibody (Abcam, ab192890) 1:1000, mouse mAb anti-GAPDH/glyceraldehyde-3-phosphate dehydrogenase (Santa Cruz Biotechnology, Inc., sc-47,724;) 1:10,000. For the western blot including ATG5 sgRNA and BECN1 sgRNA cell lines we used rabbit polyclonal antibody (pAb) anti-LC3B (Cell Signaling Technology, 2775) 1:1000, rabbit pAb anti-ATG5 (Cell Signaling Technology, 2630S) 1:1000, rabbit pAb anti-BECN1/Beclin-1 (Cell Signaling Technology, 3738) 1:1000 and rabbit mAb anti-VCL/vinculin (E1E9V) XP® (Cell Signaling Technology, 13,901) 1:1000. Secondary antibodies were donkey anti-rabbit (Jackson ImmunoResearch, 711–035-152, lot#115,414) and donkey anti-mouse (Jackson Immuno-Research, 715–036-150) 1:10,000.
Viral replication
SK-N-SH cells were grown to 80% confluency in 96-well plates. Fibroblasts were grown to 50% confluency in 48-well plates. MdMs were differentiated from 5 × 10⁵ PBMCs and infected on day 9. Following 1 h of infection at 0.1 MOI (SK-N-SH cells and fibroblasts) or 10 MOI (MdMs), the inoculum was removed and cells were washed 7 times before adding fresh media. The supernatant was harvested at various time points post infection and applied in serial dilution to a confluent monolayer of HeLa Cells. The viral titer was measured by endpoint dilution assay and calculated by Reed-Munch method.
LDH release assay
We used Pierce LDH Cytotoxicity Assay Kit (Thermo Fischer Scientific, 88,953) to quantitatively measure LDH (lactate dehydrogenase) released into the media from damaged cells as a biomarker for cellular cytotoxicity and cytolysis). SK-N-SH cells were grown to 80% confluency and fibroblasts were grown to 50% confluency prior to infection. Cells were infected at 0.1 MOI for 1 h (SK-N-SH cell line) or continually (fibroblast) and left until harvest of supernatant. Percentage cytotoxicity was calculated as 100 × (experimental LDH − spontaneous LDH)/(maximum LDH – spontaneous LDH) according to manufacturer's instruction.
RNA isolation, reverse transcription, and quantitative Real-Time PCR (RT-qPCR)
5x10⁵ PBMCs or MdMs differentiated from 5 × 10⁵ PBMCs were infected for 6 h. 3 × 10⁵ SK-N-SH cells were infected for 6 or 12 h. Cells were lysed and total RNA was purified by Macherey-Nagel™ NucleoSpin™ 96 RNA Kit (Macherey-Nagel™, 740,709.4) according to manufacturer instructions. cDNA was synthesized from 170 ng RNA (SK-N-SH cells) or 12 uL total RNA (PBMCs and MdMs) using the Quantitect Reverse Transcription Kit (Qiagen, 205,314) and mRNA expression levels were measured by RT–qPCR using Fastmix II (Quanta Bio, VWR, 733–2108) and TaqMan primer/probe sets (Life Technologies), according to the manufacturer instructions. TaqMan primer/probes were: IFNβ: Hs01077958_s1, CXCL10 (C-X-C motif chemokine ligand 10): Hs01124251_g1, TNF (tumor necrosis factor): Hs01113624_g1, TBP (TATA-box binding protein): Hs00427620_m1, and RNA18S: Hs03928985_g1.
RNA sequencing
15x104 SH-SY5Y cells were seeded in 24-well culture plates. Following 24-h incubation, cells were washed and infected at an MOI of 1 for 4 h, 12 h or 24 h. The supernatants were discarded, and the cells were used for RNA isolation and mRNA-Seq. Two biological replicates for each experiment and uninfected cells as the negative control were included in the study. Total RNA was isolated using an RNA isolation kit (Roche, 11,828,665,001) according to the manufacturer instructions. mRNA-Seq libraries from total RNA were prepared and indexed with KAPA mRNA Hyper Prep Kit (Roche, 07962347001) and sequenced on Illumina’s NovaSeq-S1 sequencing platform using a paired end protocol at Aarhus University Hospital (Department of Molecular Medicine). On average, each time point yielded 44 million paired reads, which passed FASTQC quality control. Sequencing data composed of four technical replicates, were processed using CLC bio workbench; reads from each time point was first mapped against PV genome (V01149.1). The remaining unmapped reads were mapped against human transcripts (hg38) for differential gene expression analysis. The CLC RNA-Seq tool uses multi-factorial statistics based on a negative binomial generalized linear model (GLM) and supports the paired design of the experiment. From the read-mapping, expression values relative to the uninfected as the control group were calculated for every gene and transcript. For further analysis, log2 fold-change ≥± 2 and p ≤ 0.05 cutoff were applied. BioVinci software was used to generate the heat map with Ward’s minimum variance as clustering method with Euclidean distance. Heat maps were clustered by rows.
Statistical analysis
Experiments were performed in experimental triplicates and repeated two or three times. Statistics were calculated using nonparametric Mann-Whitney test or Students t-test (Graphpad Prism 8).
List of abbreviations
AWOL: autophagosome-mediated exit without lysis; AD: adenylation domain; ATG: autophagy related; CADD: combined annotation-dependent depletion; CRISPR: clustered regularly interspaced short palindromic repeats; EMCV: encephalomyocarditis virus; GDI: gene damage index; gnomAD: genome aggregation database; HSV-I; herpes simplex virus type 1; IFN, interferon; LDH: lactate dehydrogenase; MAP1LC3/LC3: microtubule associated protein 1 light chain 3; MOI: multiplicity of infection; MdMs: monocyte-derived macrophages; PBMC: peripheral blood mononuclear cell; PPM: paralytic poliomyelitis; PV: poliovirus; WES: whole-exome sequencing.
Ethics
The project was approved by the Danish National Committee in Health Research Ethics (#1-10-72-66-16) and the Danish Data protection Agency (#1-16-02-216-16) in accordance with the ethical standards of the Helsinki Declaration. Written informed consent was obtained from all study participants.
Supplemental Material
Download Zip (2.2 MB)Acknowledgments
We wish to thank the patient for participating in the study and Polio Denmark for the collaboration. In addition, we thank Bente Ladegaard and Kirsten Stadel Pedersen for technical assistance in the laboratory. Cell sorting was performed at the FACS Core Facility, Aarhus University, Denmark.
THM received funding from Aarhus University Research Fund (AUFF-E-215-FLS-8-66), the Danish Council for Independent Research-Medical Sciences (# 4004-00047B), The Novo Nordisk Foundation (NNF15OC0017462) and The Lundbeck Foundation (R268-2016-3927). SRP was funded by the European Research Council (ERC-AdG ENVISION; 786602), the Novo Nordisk Foundation (NNF18OC0030274) and the Lundbeck Foundation (R198-2015-171). The project was funded by A.P. Møller og Hustru Chastine Mc-Kinney Møller.
Disclosure statement
The authors declare that they have no competing interests.
Supplementary material
Supplemental data for this article can be accessed here.
Additional information
Funding
Related Research Data
References
- Nathanson N, Kew OM. From emergence to eradication: the epidemiology of poliomyelitis deconstructed. Am J Epidemiol. 2010;172(11):1213–1229.
- Nathanson N. The pathogenesis of poliomyelitis: what we don’t know. Adv Virus Res. 2008;71:1–50.
- Kindberg E, Ax C, Fiore L, et al. Ala67Thr mutation in the poliovirus receptor CD155 is a potential risk factor for vaccine and wild-type paralytic poliomyelitis. J Med Virol. 2009;81(5):933–936.
- Bucciol G, Moens L, Bosch B, et al. Lessons learned from the study of human inborn errors of innate immunity. J Allergy Clin Immunol. 2019;143(2):507–527.
- Sabin AB. Pathogenesis of poliomyelitis; reappraisal in the light of new data. Science. 1956;123(3209):1151–1157.
- Bodian D. Emerging concept of poliomyelitis infection. Science. 1955;122(3159):105–108.
- Shen L, Chen CY, Huang D, et al. Pathogenic events in a nonhuman primate model of oral poliovirus infection leading to paralytic poliomyelitis. J Virol. 2017;91(14):e02310-16.
- Pfeiffer JK. Innate host barriers to viral trafficking and population diversity: lessons learned from poliovirus. Adv Virus Res. 2010;77:85–118.
- Racaniello VR. One hundred years of poliovirus pathogenesis. Virology. 2006;344(1):9–16.
- Lennette EH, Schmidt NJ. Studies on the development and persistence of complement-fixing and neutralizing antibodies in human poliomyelitis. Am J Hyg. 1957;65(2):210–238.
- Misbah SA, Spickett GP, Ryba PC, et al. Chronic enteroviral meningoencephalitis in agammaglobulinemia: case report and literature review. J Clin Immunol. 1992;12(4):266–270.
- Ida-Hosonuma M, Iwasaki T, Yoshikawa T, et al. The alpha/beta interferon response controls tissue tropism and pathogenicity of poliovirus. J Virol. 2005;79(7):4460–4469.
- Kuss SK, Etheredge CA, Pfeiffer JK. Multiple host barriers restrict poliovirus trafficking in mice. PLoS Pathog. 2008;4(6):e1000082.
- Oshiumi H, Okamoto M, Fujii K, et al. The TLR3/TICAM-1 pathway is mandatory for innate immune responses to poliovirus infection. J Immunol (Baltimore, Md: 1950). 2011;187(10):5320–5327.
- Abe Y, Fujii K, Nagata N, et al. The toll-like receptor 3-mediated antiviral response is important for protection against poliovirus infection in poliovirus receptor transgenic mice. J Virol. 2012;86(1):185–194.
- Witso E, Cinek O, Tapia G, et al. Genetic determinants of enterovirus infections: polymorphisms in type 1 diabetes and innate immune genes in the MIDIA study. Viral Immunol. 2015;28(10):556–563.
- Cinek O, Tapia G, Witso E, et al. Enterovirus RNA in peripheral blood may be associated with the variants of rs1990760, a common type 1 diabetes associated polymorphism in IFIH1. PLoS One. 2012;7(11):e48409.
- Pang L, Gong X, Liu N, et al. A polymorphism in melanoma differentiation-associated gene 5 may be a risk factor for enterovirus 71 infection. Clin Microbiol Infect. 2014;20(10):O711–7.
- Gorbea C, Makar KA, Pauschinger M, et al. A role for toll-like receptor 3 variants in host susceptibility to enteroviral myocarditis and dilated cardiomyopathy. J Biol Chem. 2010;285(30):23208–23223.
- Andersen NB, Larsen SM, Nissen SK, et al. Host genetics, innate immune responses, and cellular death pathways in poliomyelitis patients. Front Microbiol. 2019;10:1495.
- Ahmad L, Mostowy S, Sancho-Shimizu V. Autophagy-virus interplay: from cell biology to human disease. Front Cell Dev Biol. 2018;6:155.
- Levine B, Mizushima N, Virgin HW. Autophagy in immunity and inflammation. Nature. 2011;469(7330):323–335.
- Levine B, Kroemer G. Autophagy in the pathogenesis of disease. Cell. 2008;132(1):27–42.
- Levine B, Kroemer G. Biological functions of autophagy genes: a disease perspective. Cell. 2019;176(1–2):11–42.
- Orvedahl A, Alexander D, Talloczy Z, et al. HSV-1 ICP34.5 confers neurovirulence by targeting the Beclin 1 autophagy protein. Cell Host Microbe. 2007;1(1):23–35.
- Orvedahl A, MacPherson S, Sumpter R Jr., et al. Autophagy protects against Sindbis virus infection of the central nervous system. Cell Host Microbe. 2010;7(2):115–127.
- Zhou D, Kang KH, Spector SA. Production of interferon alpha by human immunodeficiency virus type 1 in human plasmacytoid dendritic cells is dependent on induction of autophagy. J Infect Dis. 2012;205(8):1258–1267.
- Yordy B, Iijima N, Huttner A, et al. A neuron-specific role for autophagy in antiviral defense against herpes simplex virus. Cell Host Microbe. 2012;12(3):334–345.
- Stavoe AKH, Holzbaur ELF. Axonal autophagy: mini-review for autophagy in the CNS. Neurosci Lett. 2018;697:17–23.
- Gonzalez Porras MA, Sieck GC, Mantilla CB. Impaired autophagy in motor neurons: a final common mechanism of injury and death. Physiology (Bethesda). 2018;33(3):211–224.
- Ohsumi Y. Historical landmarks of autophagy research. Cell Res. 2014;24(1):9–23.
- Klionsky DJ, Schulman BA. Dynamic regulation of macroautophagy by distinctive ubiquitin-like proteins. Nat Struct Mol Biol. 2014;21(4):336–345.
- Nakatogawa H, Ichimura Y, Ohsumi Y. Atg8, a ubiquitin-like protein required for autophagosome formation, mediates membrane tethering and hemifusion. Cell. 2007;130(1):165–178.
- Tsuboyama K, Koyama-Honda I, Sakamaki Y, et al. The ATG conjugation systems are important for degradation of the inner autophagosomal membrane. Science. 2016;354(6315):1036–1041.
- Noda NN, Satoo K, Fujioka Y, et al. Structural basis of Atg8 activation by a homodimeric E1, Atg7. Mol Cell. 2011;44(3):462–475.
- Taherbhoy AM, Tait SW, Kaiser SE, et al. Atg8 transfer from Atg7 to Atg3: a distinctive E1-E2 architecture and mechanism in the autophagy pathway. Mol Cell. 2011;44(3):451–461.
- Hong SB, Kim BW, Lee KE, et al. Insights into noncanonical E1 enzyme activation from the structure of autophagic E1 Atg7 with Atg8. Nat Struct Mol Biol. 2011;18(12):1323–1330.
- Komatsu M, Tanida I, Ueno T, et al. The C-terminal region of an Apg7p/Cvt2p is required for homodimerization and is essential for its E1 activity and E1-E2 complex formation. J Biol Chem. 2001;276(13):9846–9854.
- Itan Y, Shang L, Boisson B, et al. The mutation significance cutoff: gene-level thresholds for variant predictions. Nat Methods. 2016;13(2):109–110.
- Capriotti E, Calabrese R, Fariselli P, et al. WS-SNPs&GO: a web server for predicting the deleterious effect of human protein variants using functional annotation. BMC Genomics. 2013;14(Suppl 3):S6.
- Andersen LL, Terczynska-Dyla E, Mork N, et al. Frequently used bioinformatics tools overestimate the damaging effect of allelic variants. Genes Immun. 2017;20(1):10–22.
- Kumar P, Henikoff S, Ng PC. Predicting the effects of coding non-synonymous variants on protein function using the SIFT algorithm. Nat Protoc. 2009;4(7):1073–1081.
- Itan Y, Shang L, Boisson B, et al. The human gene damage index as a gene-level approach to prioritizing exome variants. Proc Natl Acad Sci U S A. 2015;112(44):13615–13620.
- Komatsu M, Waguri S, Ueno T, et al. Impairment of starvation-induced and constitutive autophagy in Atg7-deficient mice. J Cell Biol. 2005;169(3):425–434.
- Tanida I, Yamasaki M, Komatsu M, et al. The FAP motif within human ATG7, an autophagy-related E1-like enzyme, is essential for the E2-substrate reaction of LC3 lipidation. Autophagy. 2012;8(1):88–97.
- Andersen LL, Mork N, Reinert LS, et al. Functional IRF3 deficiency in a patient with herpes simplex encephalitis. J Exp Med. 2015;212(9):1371–1379.
- Ogunjimi B, Zhang SY, Sorensen KB, et al. Inborn errors in RNA polymerase III underlie severe varicella zoster virus infections. J Clin Invest. 2017;127(9):3543–3556.
- Casanova JL, Conley ME, Seligman SJ, et al. Guidelines for genetic studies in single patients: lessons from primary immunodeficiencies. J Exp Med. 2014;211(11):2137–2149.
- Orvedahl A, Levine B. Autophagy and viral neurovirulence. Cell Microbiol. 2008;10(9):1747–1756.
- Wang ZY, Lin JH, Muharram A, et al. Beclin-1-mediated autophagy protects spinal cord neurons against mechanical injury-induced apoptosis. Apoptosis. 2014;19(6):933–945.
- Boland B, Nixon RA. Neuronal macroautophagy: from development to degeneration. Mol Aspects Med. 2006;27(5–6):503–519.
- Freistadt MS, Fleit HB, Wimmer E. Poliovirus receptor on human blood cells: a possible extraneural site of poliovirus replication. Virology. 1993;195(2):798–803.
- Wahid R, Cannon MJ, Chow M. Dendritic cells and macrophages are productively infected by poliovirus. J Virol. 2005;79(1):401–409.
- Bird SW, Maynard ND, Covert MW, et al. Nonlytic viral spread enhanced by autophagy components. Proc Natl Acad Sci U S A. 2014;111(36):13081–13086.
- Abernathy E, Mateo R, Majzoub K, et al. Differential and convergent utilization of autophagy components by positive-strand RNA viruses. PLoS Biol. 2019;17(1):e2006926.
- Richards AL, Jackson WT. Intracellular vesicle acidification promotes maturation of infectious poliovirus particles. PLoS Pathog. 2012;8(11):e1003046.
- Taylor MP, Burgon TB, Kirkegaard K, et al. Role of microtubules in extracellular release of poliovirus. J Virol. 2009;83(13):6599–6609.
- Jackson WT, Giddings TH Jr., Taylor MP, et al. Subversion of cellular autophagosomal machinery by RNA viruses. PLoS Biol. 2005;3(5):e156.
- Dales S, Eggers HJ, Tamm I, et al. Electron microscopic study of the formation of poliovirus. Virology. 1965;26:379–389.
- Richards AL, Soares-Martins JA, Riddell GT, et al. Generation of unique poliovirus RNA replication organelles. MBio. 2014;5(2):e00833–13.
- Cho MW, Teterina N, Egger D, et al. Membrane rearrangement and vesicle induction by recombinant poliovirus 2C and 2BC in human cells. Virology. 1994;202(1):129–145.
- Egger D, Teterina N, Ehrenfeld E, et al. Formation of the poliovirus replication complex requires coupled viral translation, vesicle production, and viral RNA synthesis. J Virol. 2000;74(14):6570–6580.
- Schlegel A, Giddings TH Jr., Ladinsky MS, et al. Cellular origin and ultrastructure of membranes induced during poliovirus infection. J Virol. 1996;70(10):6576–6588.
- Deretic V, Levine B. Autophagy, immunity, and microbial adaptations. Cell Host Microbe. 2009;5(6):527–549.
- Delorme-Axford E, Donker RB, Mouillet JF, et al. Human placental trophoblasts confer viral resistance to recipient cells. Proc Natl Acad Sci U S A. 2013;110(29):12048–12053.
- Staring J, von Castelmur E, Blomen VA, et al. PLA2G16 represents a switch between entry and clearance of Picornaviridae. Nature. 2017;541(7637):412–416.
- Agol VI, Belov GA, Bienz K, et al. Competing death programs in poliovirus-infected cells: commitment switch in the middle of the infectious cycle. J Virol. 2000;74(12):5534–5541.
- Tolskaya EA, Romanova LI, Kolesnikova MS, et al. Apoptosis-inducing and apoptosis-preventing functions of poliovirus. J Virol. 1995;69(2):1181–1189.
- Nissen SK, Christiansen M, Helleberg M, et al. Whole Exome Sequencing of HIV-1 long-term non-progressors identifies rare variants in genes encoding innate immune sensors and signaling molecules. Sci Rep. 2018;8(1):15253.
- Jorgensen SE, Christiansen M, Ryo LB, et al. Defective RNA sensing by RIG-I in severe influenza virus infection. Clin Exp Immunol. 2018;192(3):366–376.
- Kircher M, Witten DM, Jain P, et al. A general framework for estimating the relative pathogenicity of human genetic variants. Nat Genet. 2014;46(3):310–315.
- Coyne CB, Cherry S. RNAi screening in mammalian cells to identify novel host cell molecules involved in the regulation of viral infections. Methods Mol Biol. 2011;721:397–405.
- van der Sanden SM, Wu W, Dybdahl-Sissoko N, et al. Engineering enhanced vaccine cell lines to eradicate vaccine-preventable diseases: the polio end game. J Virol. 2016;90(4):1694–1704.
- Zhang P, Bigio B, Rapaport F, et al. PopViz: a webserver for visualizing minor allele frequencies and damage prediction scores of human genetic variations. Bioinformatics. 2018;34(24):4307–4309.
- Sievers F, Higgins DG. Clustal Omega for making accurate alignments of many protein sequences. Protein Sci. 2018;27(1):135–145.
- Brinkman EK, Chen T, Amendola M, et al. Easy quantitative assessment of genome editing by sequence trace decomposition. Nucleic Acids Res. 2014;42(22):e168.
- Jakobsen M, Stenderup K, Rosada C, et al. Amelioration of psoriasis by anti-TNF-alpha RNAi in the xenograft transplantation model. Mol Ther. 2009;17(10):1743–1753.
- Schindelin J, Arganda-Carreras I, Frise E, et al. Fiji: an open-source platform for biological-image analysis. Nat Methods. 2012;9(7):676–682.
- Mostafavi S, Yoshida H, Moodley D, et al. Immunological genome project, parsing the interferon transcriptional network and its disease associations. Cell. 2016;164(3):564–578.
- Behrends C, Sowa ME, Gygi SP, et al. Network organization of the human autophagy system. Nature. 2010;466(7302):68–76.