
ABSTRACT
Macroautophagy/autophagy is a highly conserved lysosomal degradative pathway important for maintaining cellular homeostasis. Much of our current knowledge of autophagy is focused on the initiation steps in this process. Recently, an understanding of later steps, particularly lysosomal fusion leading to autolysosome formation and the subsequent role of lysosomal enzymes in degradation and recycling, is becoming evident. Autophagy can function in both cell survival and cell death, however, the mechanisms that distinguish adaptive/survival autophagy from autophagy-dependent cell death remain to be established. Here, using proteomic analysis of Drosophila larval midguts during degradation, we identify a group of proteins with peptidase activity, suggesting a role in autophagy-dependent cell death. We show that Cp1/cathepsin L-deficient larval midgut cells accumulate aberrant autophagic vesicles due to a block in autophagic flux, yet later stages of midgut degradation are not compromised. The accumulation of large aberrant autolysosomes in the absence of Cp1 appears to be the consequence of decreased degradative capacity as they contain undigested cytoplasmic material, rather than a defect in autophagosome-lysosome fusion. Finally, we find that other cathepsins may also contribute to proper autolysosomal degradation in Drosophila larval midgut cells. Our findings provide evidence that cathepsins play an essential role in the autolysosome to maintain basal autophagy flux by balancing autophagosome production and turnover.
Abbreviations: 26-29-p: 26-29kD-proteinase; ADCD: autophagy-dependent cell death; Atg8a: Autophagy-related protein 8a; Cp1/cathepsin L: Cysteine proteinase-1; CtsB: Cathepsin B; cathD: cathepsin D; CtsF: Cathepsin F; GFP: green fluorescent protein; LAMP1: lysosomal-associated membrane protein 1; Mitf: microphthalmia associated transcription factor; PCA: principal component analysis; RNAi: RNA interference; RPF: relative to puparium formation
Introduction
Cell death is essential for ensuring proper animal development and homeostasis, as well as safeguarding against disease [Citation1–3]. The predominant cell death modalities that occur during development include apoptosis, necroptosis and autophagy-dependent cell death (ADCD) [Citation4]. Macroautophagy (hereafter referred to as autophagy) is the evolutionarily conserved process by which cytoplasmic contents are sequestered into double-membrane autophagosomes and transported to the lysosome for degradation. In seemingly contradictory functions, autophagy is well established as a cell survival process, but can also mediate cell death [Citation5]. Although our understanding of ADCD has recently increased, how autophagy promotes cell death and what distinguishes this from its cell survival mode remains poorly understood. An established model system to study ADCD in vivo is the degradation of the Drosophila larval midgut.
Regulated cell death of the Drosophila larval midgut is triggered in response to a developmentally timed release of the steroid hormone ecdysone during the larval-pupal transition [Citation6,Citation7]. Midgut degradation is dependent upon autophagy, but not apoptosis as it occurs normally in the absence of the apoptotic machinery yet is blocked by inhibition of autophagy [Citation8,Citation9]. However, only a subset of the multi-subunit complexes that mediate autophagy during cell survival are essential for ADCD [Citation10]. This suggests that novel yet to be identified components are required for autophagy during cell death. In addition, the mechanisms by which autophagy specifically results in the demise of the cell remains to be elucidated.
Lysosomes are degradative organelles with an acidic pH that contain proteolytic enzymes, including cathepsins. The mammalian cathepsin family consists of aspartic (CTSD [cathepsin D] and CTSE [cathepsin E]), cysteine (including CTSB [cathepsin B], CTSC [cathepsin C], CTSH [cathepsin H], CTSK [cathepsin K], and CTSL [cathepsin L]), and serine (CTSA [cathepsin A] and CTSG [cathepsin G]) proteases [Citation11]. Cathepsins have important functions in the immune response, processing and activation of substrates, apoptosis, autophagy, and other processes [Citation11]. Regulating their activity is important, as dysregulation disrupts cellular homeostasis and contributes to several diseases including cancer and neurodegeneration [Citation12].
The progression and resolution of autophagy are dependent on lysosome function, as autophagic flux requires the fusion of the autophagosome with the lysosome, where the contents are degraded and lysosomes are reformed from the autolysosomes [Citation13]. However, the requirement for lysosomal degradation in ADCD remains to be established. Current evidence suggests that the lysosome may contribute to cell death due to autophagy in apoptotic-deficient bax; bak1 double-knockout mouse embryonic fibroblasts. Starvation-induced autophagic cell death is restored in bax; bak1 double-knockout mouse embryonic fibroblasts by targeting BAX to the lysosome or by increasing lysosomal membrane permeability [Citation14]. In addition, Drosophila larval midgut cells that are deficient for the dpp/BMP/TGF-β (decapentaplegic) signaling components, Mad and tkv, are rapidly degraded with markers of autophagy and lysosomal activity [Citation15]. This suggests that the bulk degradation of cellular components, such as by the lysosomal enzymes, may result in the demise of the cell. A critical outstanding question to be addressed is how the lysosome contributes to ADCD.
To determine the mechanisms of ADCD, we undertook a proteomic analysis to identify changes in protein abundance during midgut degradation as we predicted that protein abundance might be dynamic during developmental cell death. This analysis identified over 3,000 proteins, including proteins known to have roles in larval midgut cell death. From this, we used genetic approaches to analyze the most significantly changed components in the dataset for a role in midgut degradation. Here, we showed that cathepsins, especially Cp1, are required to properly maintain autophagy flux in the midgut yet, surprisingly, are not required for midgut degradation.
Results
Global quantitative analysis of protein expression in dying Drosophila larval midguts
The degradation of the larval midgut during Drosophila development is a dynamic process that is initiated by an increase in the titer of ecdysone at −4 h relative to puparium formation (RPF) [Citation6,Citation7]. This results in a reduction of midgut size over time that requires autophagy but not the apoptosis machinery [Citation8,Citation10,Citation16]. To understand how this tissue dies by ADCD, changes in protein abundance during midgut degradation were profiled by analyzing the midgut proteome. Proteins were isolated from midguts at three time points during degradation corresponding to the onset at −4 h RPF, at 0 h RPF and later at +2 h RPF (). The biological replicates from each of these differentially staged midguts were then subjected to quantitation by label-free liquid chromatography-tandem mass spectrometry (LC-MS/MS). A principal component analysis (PCA) using the log2 intensity values of all peptides detected in the −4, 0 and +2 h RPF midgut samples was performed to examine the variability between the replicates for each sample (; S1A and S1B; as described in Materials and Methods).
Figure 1. Proteins identified in dying Drosophila larval midguts. (A) Experimental design for the identification of proteins present during developmental cell death of Drosophila larval midguts using proteomic analysis. Proteins across three stages of midgut degradation (−4, 0 and +2 h RPF) were prepared for proteomic analyses (lysis, digestion using FASP) before nanoflow liquid chromatography-tandem mass spectrometry (LC-MS/MS) and label-free quantitation using MaxQuant. (B) PCA biplot of protein abundance in PC1 and PC3 from four replicates at −4 and 0 h RPF and three replicates from +2 h RPF midgut samples used for analyses (proportion of variance in brackets). Each dot represents a replicate that is color-coded according to the developmental time point (see legend). (C) Three-way Venn diagram summary of total larval midgut proteins at −4 h 0 and +2 h RPF. (D) Three-way Venn diagram summary of unique and overlapping larval midgut proteins that are differentially expressed between the −4 h versus 0 h RPF, 0 h versus +2 h RPF, and the −4 h versus +2 h RPF. (E) Hierarchical clustering of differentially abundant midgut proteins using the log2-transformed average of the sum of normalized peptide intensities for each protein per sample group per replicate. The blue to red color gradient is representative of low to high intensity. Columns represent the replicates (1–4 or 1–3) of each sample group (−4, 0 and +2 h RPF), and rows represent the proteins. A complete list of proteins in each cluster are shown in Supplemental material, Table S1. (F) Classification of midgut proteome components gene ontology (Biological Process) analysis of proteins identified as differentially abundant in dying midguts
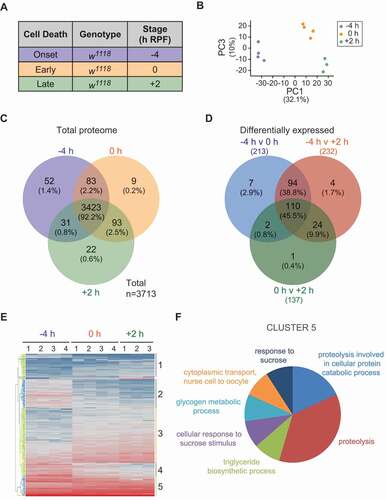
In total, 3,713 proteins from 27,427 unique peptides were identified across the course of midgut degradation, with 3,059 proteins identified from at least two unique peptides. The majority of proteins (3,423, 92.2%) were common to all stages of midgut degradation, whereas other proteins were uniquely identified in two stages of midgut cell death or a single stage (). In −4 and 0 h RPF midguts, 83 (2.2%) proteins were uniquely identified while 93 (2.5%) and 31 (0.8%) proteins were common to midguts at 0 and +2 h RPF, and −4 and +2 h RPF, respectively (). This was consistent with the results of the PCA where the −4 and +2 h RPF samples were more separated than the 0 and +2 samples on PC1 (). Proteins were also uniquely identified in each developmental stage including 52 (1.4%) proteins in −4 h RPF midguts, and 9 (0.2%) and 22 (0.6%) in 0 h RPF and +2 h RPF midguts respectively ().
This quantitative proteomic analysis identified several proteins known to be required for autophagy-dependent midgut cell death (). These proteins included components of the core autophagic machinery, negative upstream regulators of autophagy including the PI3K-Tor pathway, proteins required for ecdysone-mediated signaling, ubiquitination-associated proteins, and single proteins belonging to the dpp, ras and wg/Wnt signaling pathways (). Identification of these known regulators of midgut cell death validates the possibility that other proteins relevant to midgut degradation are contained within this dataset.
Table 1. Proteins identified that are known to be present in the larval midgut
Functional classification of differentially abundant proteins in dying midguts
To identify differentially abundant proteins, pairwise comparisons between the three stages of midgut cell death (−4 vs +2, −4 vs 0 and 0 vs +2 h RPF) were conducted based on the fold-changes between the developmental stages (log2 of −4/+2, −4/0 and 0/+2 h RPF) versus p-values (-log10 of Benjamini–Hochberg corrected p-value) for each comparison (Fig. S1). During the −4 h RPF and +2 h RPF developmental stages examined, 232 proteins were differentially expressed (), where 140 proteins increased in abundance and 92 proteins decreased. The abundance of 213 proteins was significantly altered between −4 h and 0 h (129 increased and 83 decreased), and 137 proteins were significantly altered (84 increased and 53 decreased) between 0 h and +2 h developmental stages ().
Subjecting the total number of differentially abundant proteins to hierarchical clustering analysis segregated the proteins into five main clusters (with a few smaller clusters of proteins that sit on their own). This indicates there are groups of proteins that show similar changes in abundance during midgut cell death (; Table S1). To functionally characterize these clusters, proteins from each cluster were subject to gene ontology (GO) term enrichment analysis using the functional annotation clustering tool from the online bioinformatics resource Database for Annotation, Visualization and Integrated Discovery (DAVID) [Citation17,Citation18]. Although there were no significantly enriched terms associated with proteins in cluster 1 (39), 4 (23), and 5 (32), the remaining protein clusters were significantly enriched for multiple GO terms. The most enriched functional group associated with proteins in cluster 2 was the chitin metabolic process followed by proteolysis, while proteins in cluster 3 were associated with mRNA splicing, via spliceosome, and mitotic nuclear division.
From the analysis of the most differentially changed proteins there was an enrichment in three Kyoto Encyclopedia of Genes and Genomes (KEGG) pathways: lysosome, metabolic pathways and spliceosome components. Of particular interest was a cluster (Cluster 5) that showed Biological Process enrichment for proteolysis and Molecular Function enrichment for proteins that are peptidases, that act on L-amino acid peptides (identifying proteins Cp1, CtsF [Cathepsin F], 26–29-p [26–29kD-proteinase], CG4572, Cndp2 [Cytosolic nonspecific dipeptidase 2], Ppn [Papilin], Jon65Aiv [Jonah 65Aiv]) (; Table S1). Several of these proteins are cathepsins, the lysosomal enzymes that function to break down proteins. Cp1, CtsF and 26–29-p are the Drosophila homologs of CTSL, CTSF and CTSK, respectively [Citation19]. With no clear CTSA homolog in Drosophila, CG4572 is most similar to mammalian CPVL (carboxypeptidase vitellogenic like) and CTSA. Of these, the proteomics analysis identified a 4-fold increase in the abundance of Cp1 in the dying midgut. The upregulation of Cp1 in the larval midgut suggests that developmentally regulated proteolysis may mediate changes that occur during midgut degradation.
Lysosomes are specialized organelles that function to break down and recycle cellular components from vesicular pathways such as secretory, endocytic, autophagic and phagocytic pathways. The lysosome contains hydrolytic enzymes including cathepsin proteases, which are activated by the acidic pH within the lysosome generated by proton-pumping vacuolar-type H+-ATPase (V-ATPase) [Citation20]. An essential final step in autophagy is the fusion between autophagosomes and lysosomes to form autolysosomes. The resulting acidic environment promotes activation of the enzymes required for degradation and recycling of autophagic cargos. Given the importance of the lysosome to autophagy and the identification of several cathepsins or putative cathepsins in the proteomics analysis, we investigated their in vivo function in autophagy-dependent midgut degradation.
Cp1 is abundant in the midgut and increases during degradation
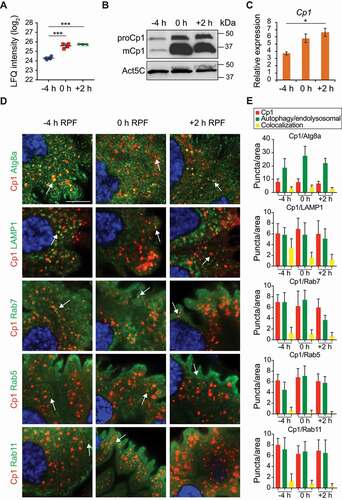
The most abundant differentially expressed protein during midgut degradation was Cp1 (; Table S1). Consistent with the proteomics data, Cp1 protein and transcript levels increased during midgut degradation (). Analysis of wild-type midgut protein extracts by immunoblotting with Cp1 antibody showed an increase in between −4 h RPF and +2 h RPF (). We observed both the pro and mature forms with the mature form predominant at 0 and +2 h RPF [Citation19,Citation21,Citation22]. Similarly, Cp1 transcript was detected in midguts at −4 h RPF with increased levels detected during midgut degradation at 0 and +2 h RPF (). Previously, in situ hybridization has detected expression of Cp1 in embryonic and larval midgut [Citation23]. We examined the protein localization of Cp1 in the midgut and found punctate localization, which increased during midgut degradation (Fig. S2). The punctate localization of Cp1 during midgut degradation colocalized with Atg8a puncta (). Lysosomal enzyme precursors are transported to the lysosome via the endosomal pathway. To determine the subcellular localization of Cp1 during midgut degradation, we examined double labeling of Cp1 with markers of membrane-bound compartments of the endolysosomal pathway. Cp1 colocalized with the late endosomal and lysosomal marker Lamp1 (). Cp1 also partially colocalized with the endosomal marker Rab7, with the early endosomal marker Rab5 and with Rab11 marked recycling endosomes (). This is consistent with Cp1 trafficking to the lysosome in midgut cells at the onset of removal, which then accumulates during midgut degradation.
Figure 2. Cp1 localizes to late endosomes and lysosomes in the midgut. (A) LFQ intensity of Cp1 at −4 h RPF, 0 h RPF and +2 h RPF as measured by mass spectrometry. Biological replicates for −4 and 0 h RPF (n = 4) and 3 for +2 h RPF (n = 3), error bars ± SD. *** p < 0.0001. (B) Immunoblot analysis of Cp1 with protein lysates from midguts during degradation at −4 h RPF, 0 h RPF and +2 h RPF showing increased Cp1 levels in wild-type (w1118) with Act5C (Actin 5 C) as load control. The inactive proform of Cp1 (proCp1) is ~40 kDa and the mature form (mCp1) is ~35 kDa. (C) The level of Cp1 transcripts from wild-type (w1118) larval midguts at −4 h RPF, 0 h RPF and +2 h RPF were measured by qRT-PCR from total RNA extracts. RpL32 mRNA was used as the reference gene. Data are from three independent experiments, each containing 10 midguts per group (means ± SEM). (D) Immunostaining of Cp1 (red) with autophagy marker Atg8a (Mex-GAL4/+; pGFP-Atg8a/+) (green) and endolysosomal markers Rab5, Rab7, Rab11 and LAMP1 (Mex-GAL4/+; UAS-GFP-Rab5/+, Mex-GAL4/+; UAS-GFP-Rab7/+, Mex-GAL4/UAS-Rab11 and Mex-GAL4/UAS-GFP-LAMP1) (green). DNA is stained by Hoechst (blue). Scale bar: 10 μm. (E) Quantification of puncta per area from (D) with Cp1-positive puncta (red), various autophagy/endolysosomal markers (green) and colocalized puncta (yellow) (average puncta/area ± SD)
Cp1 is required to maintain normal autophagy levels
Degradation of the midgut involves a large change in midgut size initially due to the contraction of four anterior appendages known as the gastric caeca and an overall reduction in size [Citation7]. During this size reduction, autophagy progressively increases and is strongly detected at +2 h RPF [Citation8,Citation16]. Having established that Cp1 protein levels increase during midgut cell death, we next examined the effect of Cp1 knockdown using the highly specific midgut driver, Mex-GAL4, on midgut degradation. Both Cp1 mRNA and protein levels were significantly reduced following Cp1 RNAi knockdown (Fig. S3A and S3B). Similarly, the immunostaining of Cp1 was reduced in Cp1 knockdown midguts (Fig. S3C). We found that Cp1 knockdown using the GD RNAi line that showed greater transcript reduction, resulted in increased gastric caeca size at −4 h RFP (), while the KK RNAi line was similar to control (Fig. S3D). This size increase was also observed at +2 h RPF but was not seen at 0 h RPF and did not dramatically alter the progression of midgut contraction as the size at +4 h RPF was similar to the control (Fig. S3F and S3G).
Figure 3. Loss of Cp1 alters autophagy in the midgut. (A) Morphology from control (Mex-GAL4/+; pmCherry-Atg8a/+) and Cp1Ri knockdown (Mex-GAL4/UAS-Cp1 GD RNAi; pmCherry-Atg8a/+) midguts from −4 h RPF shows larger size gastric caeca (arrows). Scale bar: 200 μm. (B) The knockdown of Cp1Ri has increased mCherry-Atg8a-marked autophagic vesicles (red) in the larval midguts at −4 h RPF compared to controls. DNA is stained by Hoechst (blue). Scale bar: 50 μm. (C) The Atg8a immunostaining (red) of midguts at −4 h RPF shows that Cp1Ri has enlarged Atg8a vesicles compared to controls. DNA is stained by Hoechst (blue). Scale bar: 20 μm. (D) Orthogonal Projection of Atg8a staining shows abnormal vesicles in the Cp1Ri. (E) Quantification of gastric caeca size from (A) (average pixels ± SD, **** p < 0.0001). (F) Quantification of Cherry-Atg8a puncta number from (B) (average ± SD, * p = 0.0156). (G) Quantification of Cherry-Atg8a puncta size from (B) (average ± SD, **** p < 0.0001). (H) Immunoblot analysis of protein lysates from control and Cp1 knockdown midguts at −4 h RPF shows increased level of Atg8a in Cp1 knockdown compared to control with Act5C as load control. (I) Morphology from control (Cp1−/+) and Cp1−/Cp1− midguts from −4, 0 and +4 h RPF shows increased size of midgut and gastric caeca in the Cp1−/Cp1− mutants (arrows). Scale bar: 200 μm. (J) Quantification of gastric caeca size from (I) (average pixels ± SD, −4 h RPF ** p = 0.0018, 0 h RPF * p = 0.0202, +4 h RPF *p = 0.0133). (K) LysoTracker Red staining (red) of midguts at −4 h RPF shows that Cp1−/Cp1− has enlarged vesicles compared to controls (Cp1−/+), inset is enlarged section. DNA is stained by Hoechst (blue). Scale bar: 20 μm. (L) The Atg8a immunostaining (red) of midguts at −4 h RPF shows that Cp1−/Cp1− has enlarged Atg8a vesicles compared to controls (Cp1−/+). DNA is stained by Hoechst (blue). Scale bar: 20 μm. (M) Orthogonal Projection of Atg8a staining shows abnormal vesicles in the Cp1−/Cp1− mutant
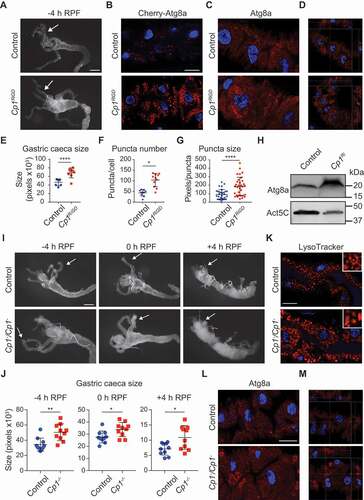
To examine the level of autophagy in whole midguts, we monitored mCherry-Atg8a puncta formation. This revealed that Cp1 knockdown had increased levels of Atg8a puncta at the onset of midgut degradation at −4 h RPF compared to controls ( and S3E). In addition to the increase in puncta number, the size of the Atg8a puncta was larger in Cp1 knockdown compared to the control (). Consistent with the increased Cherry-Atg8a puncta number and size, Atg8a immunostaining revealed the accumulation of abnormal Atg8a-positive structures (). The increased Atg8a levels were also detected in immunoblot of Cp1 knockdown midgut lysates compared to controls (). Interestingly, however, at later stages (0 and +2 h RPF) there was no significant difference in the number of Atg8a puncta (Fig. S3H and S3I). The increase in Atg8a puncta in the Cp1 knockdown midguts at −4 h RPF suggests that Cp1 activity is required to maintain normal basal levels of autophagy prior to degradation. Surprisingly, while the knockdown of Cp1 increased autophagy puncta, this did not result in premature size contraction of the midgut () as is seen with Tor knockdown, where premature induction of autophagy correlates with premature size reduction [Citation10,Citation24].
We confirmed these results by analyzing a Cp1 mutant allele () [Citation25]. The morphology of the larval midgut was examined during degradation. This showed a significant increase in size of Cp1 mutant midgut at −4 h RPF, and while the Cp1− mutant midgut contracted during midgut degradation at 0 h and + 4 h RPF, it remained larger than the control (). The increased midgut size in the Cp1− mutant was greater than that observed following Cp1 knockdown ( and S3). This is likely to be due to the level of knockdown of the RNAi lines compared to the stronger mutant allele. In Drosophila, LysoTracker staining can be used as a marker to detect autophagy-associated lysosomal activity in the midgut [Citation10,Citation26]. There was a dramatic increase in the size of the LysoTracker-positive vesicles at −4 h RPF in the Cp1− mutant midgut cells (). Similarly, Atg8a immunostaining revealed the accumulation of abnormal Atg8a-positive structures similar to those seen in the Cp1 knockdown (). This striking phenotype indicates an essential role for Cp1 in biogenesis of autophagic vesicles in the midgut.
Abnormal autophagic vesicles accumulate following Cp1 knockdown
To further investigate the increased autophagy puncta in Cp1-deficient midgut cells, we generated clones in the midgut that give rise to cells knocked down for Cp1 adjacent to control cells. Interestingly, the Cp1 knockdown clone cells displayed increased Atg8a puncta size at −4 h RPF compared to the neighboring control cells suggesting a cell-autonomous accumulation of enlarged autophagic vesicles (). To further investigate the increase in autophagy puncta size, we undertook ultrastructural analysis, which showed that the Cp1 knockdown midguts contained abnormal autolysosomal structures (). In the Cp1 knockdown midgut cells, there were large vesicles containing undigested cytoplasm that were not observed in the control cells (). The morphology of these vesicles suggests that they may be autolysosomes that are unable to degrade their contents. Thus, the depletion or mutation of Cp1 results in the accumulation of enlarged autophagic vesicles.
Figure 4. Cp1 knockdown increases autophagy puncta size and accumulation of abnormal autophagic vesicles. (A) Clone cells of Cp1 knockdown (hsFLP; pmCherry-Atg8a/+; Act>CD2> GAL4, UAS-nlsGFP/UAS-Cp1Ri) marked by GFP (green) have increased mCherry-Atg8a puncta size (red, outlined) compared to the neighboring control cells at −4 h RPF. DNA is stained by Hoechst (blue). Scale bar: 20 μm. (B) Quantification of puncta number and puncta size from (A) (average pixels/puncta ± SD, *** p < 0.0001). (C) Representative Transmission electron microscopy images from sections of midgut at −4 h RPF. Control cells possess autolysosomal structures (arrows), and Cp1Ri knockdown midgut cells have abnormal autophagic structures. Scale bar: 1 μm. (D) mCherry-Atg8a puncta (red) and LysoTracker green (green) shows that in the knockdown of Cp1Ri there is increased colocalization in the larval midguts at −4 h RPF compared to controls. The right-hand side images show a higher magnification of the indicated region with mCherry-Atg8a (top), LysoTracker (middle) and merge (bottom). Scale bar: 20 μm
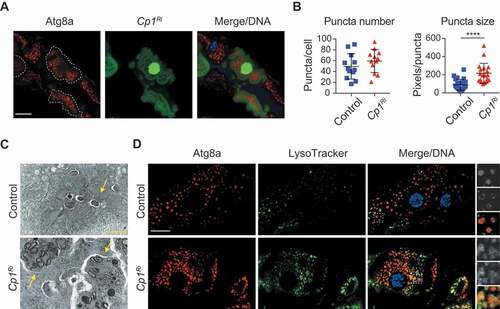
The degradative activity of cathepsins requires the lysosome to maintain an acidic pH. In Drosophila tissues, including fat body and midgut, LysoTracker staining has been used as a marker of autophagy-associated lysosomal activity [Citation10,Citation26]. We assessed acidification of the vesicles using LysoTracker to determine if Cp1 ablation disrupted lysosomal activity. This staining showed that reduction of Cp1 levels increased LysoTracker-positive vesicles suggesting functional lysosomes (). This is somewhat unexpected given that cathepsin ablation was predicted to result in degradation defects and nonfunctional lysosomes. Defective fusion of autophagosomes with lysosomes is likely to lead to an accumulation of autophagosomes and a reduction of autolysosomes. To determine if there is a defect in autophagosomes fusion with lysosomes, the colocalization of Cherry-Atg8a with LysoTracker was examined. Consistent with increased Atg8a puncta, the Cp1 knockdown midgut cells also had increased LysoTracker staining (). There was also colocalization of Cherry-Atg8a with LysoTracker, suggesting that in addition to an increase in autophagosomes, Cp1 knockdown leads to accumulation of autolysosomes.
The identification of LysoTracker-positive vesicles indicates that acidification of autolysosomes and lysosomes can occur in the Cp1-depleted midguts. The accumulation of enlarged autolysosomes indicates that autophagosome-lysosome fusion was not impaired in the absence of Cp1. Thus, the formation of autophagic vesicles is not compromised in Cp1-depleted midguts, and they fuse with lysosomes. However, these abnormal autolysosomes cannot degrade their internal contents despite the fact that their lumen appears to be acidic. The continual fusion of newly formed autophagosomes results in the progressive accumulation of enlarged, dysfunctional autolysosomal structures in Cp1-depleted midguts. Hence, initiation of autophagy is normal and the fusion of autophagosomes with lysosomes is not affected in Cp1 knockdown midguts.
Cathepsin depletion increases autophagy puncta
There are several classes of cathepsins, with the majority being cysteine proteases (CTSB, CTSF, CTSK, CTSL and CTSS). Others include CTSD an aspartic protease and CTSG and CTSA that are serine proteases. Given the identification of additional cathepsins in the proteomics data, we analyzed the cysteine peptidases CtsB (CTSB), 26–29-p (CTSK), CtsF (CTSF); serine-type carboxypeptidase CG4572 (putative CTSA); and aspartic peptidase, cathD (CTSD). These were identified in the proteomics with 26–29-P and CtsF, showing a significant increase in abundance yet did not have an increase in transcript levels (Fig. S4). The additional peptidases identified in the proteomics, Cndp2 and Ppn, showed an increase in protein level with Ppn also showing a corresponding increase in transcript level, whereas Jon65Aiv that was expressed at high levels showed a decrease in protein levels (Fig. S4A and S4B) and were not analyzed any further.
Given that several of these cathepsins (or putative cathepsins) were identified in a cluster with Cp1 we examined if they also had a defect in autophagy. To examine the requirement of these enzymes for ADCD, we systematically knocked down the cathepsin genes in the midgut ( and S5). The knockdown of cathD, CG4572, CtsB, 26–29-p of CtsF did not affect the size contraction of the larval midgut during degradation at −4 h RPF (). Similarly, at all other time points examined from 0 h RPF to the later stage condensed midgut at +4 h RPF, the developmental degradation occurred normally (Fig. S5A and S5B).
Figure 5. Knockdown of cathepsins alters autophagy but not size reduction of the midgut. (A) Morphology from control (Mex-GAL4/+; pmCherry-Atg8a/+) and Cathepsin knockdown (Mex-GAL4/UAS-Cathepsin RNAi; pmCherry-Atg8a/+) midguts from −4 h RPF shows similar size midgut and gastric caeca (arrows). Scale bar: 200 μm. (B) Co-staining of mCherry-Atg8a puncta (red) and LysoTracker green (green) in the larval midguts at −4 h RPF. DNA is stained by Hoechst (blue). Scale bar: 20 μm. (C) Knockdown of cathepsins (hsFLP; pmCherry-Atg8a/+; Act>CD2> GAL4, UAS-nlsGFP) in clones cells marked by GFP (green) with mCherry-Atg8a puncta (red, outlined) compared to the neighboring control cells at −4 h RPF. DNA is stained by Hoechst (blue). Scale bar: 20 μm. (D) Quantification of gastric caeca size from (A) (average pixels ± SD). (E) Quantification of Cherry-Atg8a puncta from (B) (average ± SD) (*p < 0.05, **p = 0.004, ***p < 0.0001). (F) Quantification of puncta number and puncta size from clone and control cells from (C) (average puncta/cell and average pixels/puncta ± SD, * p < 0.05, ***p < 0.001, **** p < 0.0001)
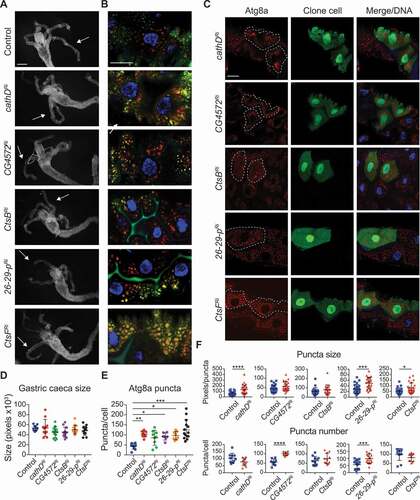
Monitoring of autophagic flux following knockdown of the cathepsins in the midgut revealed that cathD and CtsF ablation led to a significant increase in Atg8a puncta (). The knockdown of CtsB and 26–29-p also had increased levels of Atg8a puncta at −4 h RPF compared to controls, and while not significant due to the variation in samples there was a trend toward increased Atg8a puncta in CG4572 knockdown (). To further investigate the increased Atg8a puncta, we generated clones in the midgut that give rise to cells knocked-down for the cathepsins adjacent to control cells. Interestingly, the cathD, 26–29-p and CtsF knockdown clone cells displayed increased Atg8a puncta size (). The dramatically large puncta observed in cathD knockdown cells was similar to that of Cp1 knockdown (, 5C,5F). The 26–29-p knockdown clone cells also displayed increased number of Atg8a puncta at −4 h RPF as did CG4572 knockdown compared to the neighboring control cells (). While the puncta size and number in the CtsB knockdown clone cells were similar to the control, the CtsB knockdown cells had a small but significant increase in cell size compared to the control cells ( and S5C). While the Atg8a puncta analysis in the whole tissue knockdown showed an increase in Atg8a, the further clonal analysis revealed that this was due to distinct alterations to either puncta size, puncta number (or both) or cell size alterations following the different cathepsin knockdowns. Together, this suggests that the individual cathepsins may have distinct roles in the midgut during ADCD.
Lysosome biogenesis is not altered during midgut degradation
We found that loss of Cp1 leads to a dramatic increase in the number of autophagic vesicles and lysosomes. These compartments are not defective as they acidify properly, based on LysoTracker staining (). To confirm the effect of Cp1 knockdown on lysosome numbers, the localization of GFP-LAMP1 fusion protein was examined. In the midgut, lysosomal markers LysoTracker and GFP-LAMP1, show low levels at −4 h RPF of degradation coincident with the increase in autophagy [Citation26]. In the control midgut basal levels of GFP-LAMP1 were observed, whereas Cp1-depleted midguts showed an increase in GFP-LAMP1 accumulation (). This is consistent with the increase in LysoTracker-positive vesicles ().
Figure 6. Lysosomal biogenesis is not altered in Cp1 knockdown. (A) Lysosomes monitored by GFP-LAMP1 puncta (green) shows that knockdown of Cp1Ri (Mex-GAL4, UAS-GFP-LAMP1/UAS-Cp1 RNAi) has increased LAMP1-marked vesicles in the larval midguts at −4 h RPF compared to controls (Mex-GAL4, UAS-GFP-LAMP1/+). DNA is stained by Hoechst (blue). Scale bar: 20 μm. (B) Quantification of GFP-LAMP1 puncta (average ± SD). (C) Morphology from control (Mex-GAL4/+), MitfRi knockdown (Mex-GAL4/+; UAS-Mitf RNAi/+), Cp1Ri knockdown (Mex-GAL4/+; UAS-Cp1 RNAi/+), and the double MitfRi Cp1Ri knockdown midguts from 0 h RPF shows similar size midgut and gastric caeca (arrows). Scale bar: 200 μm. (D) Quantification of gastric caeca size (average pixels ± SD). (E) LysoTracker staining (green) of midguts at −4 h RPF shows that MitfRi Cp1Ri knockdown has similar puncta Cp1Ri knockdown compared to control and MitfRi knockdown. DNA is stained by Hoechst (blue). Scale bar: 20 μm. (F) The transcript levels of Atg8a, Lamp1, Tor, Mitf, CtsF and Cp1 from control (Mex-GAL4/+) and Cp1Ri (Mex-GAL4/UAS-Cp1 RNAi) larval midguts (at −4 h RPF) was measured by qRT-PCR from total RNA extracts. RpL32 mRNA was used as the reference gene. Data are from three independent experiments, each containing 10 midguts per group (means ± SEM). (G) Model showing the accumulation of abnormal autolysosomes with undegraded material in the absence of Cp1.
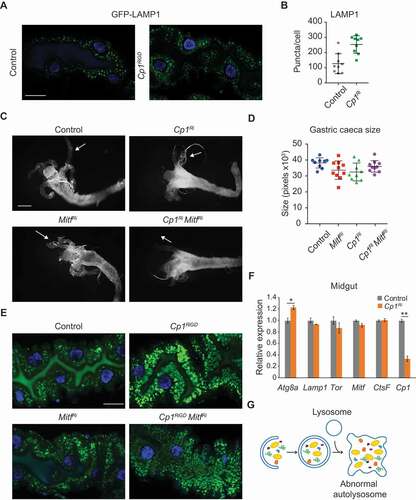
The phenotype resulting from ablation of Cp1 showing an expansion of autolysosomes and lysosomes may be caused by two processes: an increase in biogenesis regulated by transcription of lysosomal and autophagic genes or a defect in lysosomal degradation. The biogenesis and abundance of lysosomes are controlled by a complex transcriptional program that responds to cellular requirements. In mammalian cells, a genetic program coordinated by the TFEB (transcription factor EB) controls lysosomal biogenesis and function [Citation27]. In Drosophila, the single TFEB ortholog, Mitf (microphthalmia associated transcription factor), is involved in lysosomal metabolism and regulation of the lysosomal-autophagic pathway in the brain and fat body [Citation25,Citation28]. In contrast, oxidative stress-induced autophagy regulated by Cnc (Cap-n-collar), the Drosophila homolog of mammalian NFE2L2/NRF2 (nuclear factor, erythroid 2 like 2), occurs independently of Mitf [Citation29]. Interestingly, Mitf reporter expression is not detected in the larval midgut [Citation25]. However, to determine whether the autophagy-lysosomal phenotypes in Cp1-ablated midguts are due to TFEB-mediated biogenesis, we examined the knockdown of Mitf in the midgut. We did not observe an overall change in autophagy induction or midgut degradation following Mitf knockdown (Fig. S6A). Furthermore, the knockdown of Mitf combined with Cp1 knockdown had similar midgut morphology as the Cp1 knockdown alone (). The LysoTracker staining showed that the combined Mitf and Cp1 knockdown has similarly enlarged lysosomes as the Cp1 knockdown alone (). This suggests that Mitf is not required for ADCD, and that the Cp1 ablation phenotype is not dependent on Mitf-induced lysosomal biogenesis.
To further confirm this, the transcription of genes associated with increased lysosomes was examined in Cp1 knockdown midguts (). While Atg8a expression was increased, there was no increased expression detected for Lamp1, Tor or Mitf. In addition, there was no increased expression of CtsF, suggesting that Cp1 ablation does not result in compensatory expression of other cysteine cathepsins.
These results suggest that the observed lysosomal expansion following Cp1 ablation is unlikely to be due to increased lysosomal biogenesis. Therefore, lysosomal expansion may be caused by a degradation defect rather than increased biogenesis and the Cp1 knockdown impairs lysosomal degradation. Thus, the autophagic phenotype of Cp1 knockdown is not likely to be due to failures in the initial steps of autophagy induction, autophagosome formation, autophagosome-lysosome fusion, but due to impairment of degradation of their content resulting in an accumulation of abnormal autolysosomes. Together, these findings provide compelling evidence to indicate that cathepsin loss results in the accumulation of autophagosomes and autolysosomes (autophagic vesicles), without interfering with lysosomal acidification or biogenesis ().
Discussion
Using the label-free proteomics approach, we have generated a comprehensive dataset of proteins present in Drosophila midguts undergoing ADCD. Several proteins known to be required for autophagy-dependent midgut degradation were present in this dataset. This also identified differentially abundant proteins and revealed that midgut degradation is associated with changes in Cp1 abundance. Here, we have demonstrated that Cp1 deficiency leads to an accumulation of aberrant autophagosomes and autolysosomes likely due to impairment of lysosomal degradation.
Autophagic flux can be separated into three main steps: formation of autophagosomes, fusion of autophagosomes with lysosomes, and degradation of autolysosomal contents. Our results indicate that Cp1 is not required for autophagosome-lysosome fusion or lysosomal acidification. Rather, the function of Cp1 is important in degradation of the autophagosomal cytoplasmic contents in the autolysosome. It is intriguing that Cp1 ablation increased autophagosomes under basal conditions. One possible explanation is that the accumulation of aberrant/defective autolysosomes may act as a trigger to induce selective autophagy of the lysosomes in an attempt to remove them, however, this remains to be determined. There was also a large proportion of lysosome and autophagy markers indicating an accumulation of autolysosomes. This raises the question of how lysosome biogenesis/homeostasis is maintained under conditions where the lysosomes are consumed as autolysosomes.
The increase in autophagy puncta observed in −4 h RPF midguts following Cp1 knockdown is distinct to that observed by knocking down Tor, which increases autophagy but also results in premature midgut size contraction [Citation10,Citation24]. This distinction supports that Cp1 knockdown causes a block in autophagy flux and suggests that Cp1 knockdown results in the accumulation of autolysosomes under growth conditions. However, an unexpected finding from this analysis of Cp1 ablation in the midgut was that Atg8a puncta were eventually similar to control at a later time (0 and +2 h RPF) during midgut degradation. This suggests that Cp1 deficiency results in the accumulation of autolysosomes under growth conditions, yet at later growth-independent stages during ADCD autolysosome maturation can still occur. This is similar to the finding that nutrient starvation alone can regulate autolysosome maturation [Citation30]. In mammalian cells, Rab7 depletion results in accumulation of autolysosomes only under nutrient-rich conditions that are rapidly cleared following nutrient starvation [Citation30]. Thus, the importance of autolysosome maturation to autophagy flux appears to be evolutionarily conserved.
Our data shows that Mift knockdown does not affect autophagy or midgut degradation and that Mitf transcript levels are not altered by Cp1 knockdown. This suggests that Mitf is not essential for ADCD. There may also be a novel tissue-specific regulatory mechanism to coordinate the expression of genes that control autophagy and lysosomal biogenesis associated with midgut degradation. Importantly, the Cp1 knockdown phenotype is not altered when combined with Mitf knockdown, suggesting that the phenotype due to Cp1 ablation in the midgut is not dependent on Mitf-induced lysosomal biogenesis.
During Drosophila metamorphosis, the hormonally induced degradation of the larval salivary glands is mediated by autophagy- and apoptotic-dependent cell death [Citation7,Citation31,Citation32]. Proteomics analysis of dying salivary glands also identified Cp1, CathD and CG4572 [Citation33]. In addition, several cathepsins (including CtsB, cathD, CtsF and Cp1) are differentially expressed during salivary gland cell death [Citation34]. It is possible that cathepsins are also important in salivary gland cell death, but this remains to be explored. Similar to the phenotype of Cp1 knockdown in the midgut, the knockdown of V-ATPase subunits, that disrupts lysosomal acidification, also leads to accumulation of enlarged, defective autophagic vesicles in the larval fat body [Citation35]. Thus, cathepsins are likely to have more widespread importance in maintenance of autophagy flux.
Our in vivo findings in the context of Drosophila midguts undergoing autophagy-dependent cell death are consistent with previous studies showing that loss of CTSL prevents autolysosomal protein degradation resulting in enlarged and persisting autolysosomes. Over 20 years ago, the morphological analysis of cultured hippocampal slices from rats treated with CTSB and CTSL inhibitor identified an accumulation of abnormal lysosomes in neurons [Citation36]. More recently, neurons from ctsb (cathepsin B) and ctsl (cathepsin L) double knockout mouse brains have been shown to accumulate abnormal vacuolar structures that display an autophagy marker [Citation37,Citation38]. In ctsl-deficient mouse embryonic fibroblasts, autophagy induction by nutrient deprivation or rapamycin treatment lead to the accumulation of large autolysosomes [Citation39]. In this study, we further establish the essential function of Cp1 in autolysosome biogenesis in vivo, using the powerful genetic techniques available in Drosophila. Our genetic and cellular analyses reveal the importance of Cp1 in the clearance of autolysosomes in vivo. Combined with studies in mammals cited above, our findings support an evolutionarily conserved function of Cp1/CTSL in autolysosomal maturation.
In mammals, other cathepsins are also required to maintain normal vesicle homeostasis. For example, Ctss-deficient macrophages show an accumulation of mitophagic vesicles [Citation40] and Ctsd-deficient neurons accumulate abnormal vesicles resembling autophagosomes [Citation38]. The accumulation of abnormal autophagic vesicles can also result from defects in both transport and maturation. In Ctse-deficient macrophages, autophagic flux is perturbed however this is due to impaired fusion of autophagosome to lysosomes [Citation41]. This suggests a distinct role of CTSE upstream of autophagosomal fusion rather than the accumulation of aberrant autolysosomes revealed from our in vivo finding with Cp1. Together with our studies, this suggests that the specific function of the individual cathepsins is not redundant and may depend on their unique proteolytic targets.
It is well established that autophagy leads to fusion of autophagosomes and lysosomes forming autolysosomes, whereby autophagosome cargo is degraded. However, how this feeds back to autophagy flux, the fate of the autolysosome (maturation) and the effect on lysosome homeostasis is poorly understood. These results indicate that cathepsins play an important role in the regulation of autophagic flux by maintaining a degradative environment inside the lysosome. Given the contribution of cathepsin dysfunction to numerous diseases, a greater understanding of the role of cathepsins and the lysosome to autophagic flux is essential for further development of potential therapeutic compounds that modulate autophagy.
Materials and methods
Fly stocks
The midgut driver Mex-GAL4 was obtained from Richard Burke (Monash University, Vic., Australia), pmCherry-Atg8a is described in [Citation42] and pGFP-Atg8a is described in [Citation8]. The following stocks were from the Bloomington Drosophila Stock Center (Bloomington, IN, USA): w1118, UAS-wIR (28980), Cp1 mutant (w*; Cp1[CC01377]/SM6a) BL 51555, UAS-26-29-p (CG8947) (y1 sc* v1 sev21; P {TRiP.HMS00675}attP2) BL32887, CG4572 (y1 sc* v1 sev21; P {TRiP.HMS01325} attP2) BL34337, Mitf (y1 sc* v1 sev21; P {TRiP.HMS02712} attP2) BL43998, UAS-GFP-Rab5 (w*; P{UAS-GFP-Rab5}3) BL43336, UAS-RFP-Rab7 (w*; P{UAS-Rab7.GFP}3) BL42705, UAS-Rab11-GFP (w*; P{UAS-Rab11-GFP}2) BL8506, UAS-GFP-LAMP1 (w*; P{UAS-GFP-LAMP}2). VDRC RNAi lines: CtsB (CG10992) (KK) v108315, CtsF (CG12163) (KK) v107589, cathD/CyO (CG1548) (KK) v109651, Cp1(KK) v110619, Cp1(GD) v13959. The control was w1118 crossed to Mex-GAL4, or relevant driver line. The verification and knockdown quantification of the RNAi lines was determined by qRT-PCR from late third instar larvae, from a minimum of 3/sample in triplicate. All flies were maintained and crosses performed at 25°C on cornmeal, molasses and yeast medium. Several of the KK RNAi lines may overexpress the tiptop (tio) gene [Citation43], and we have shown that tio overexpression does not alter midgut degradation (data not shown).
Larval staging and midgut morphology analysis
To stage larvae, wandering third instars were raised on standard media supplemented with 0.05% bromophenol blue (Sigma-Aldrich, B6131) and transferred to Petri dish with moist Whatmann paper to monitor for gut clearance as visualized by loss of blue in the gut (−4 h RPF) [Citation44]. For morphological analysis, a minimum of 10 midguts from appropriately staged animals were dissected in 1x phosphate buffered saline (PBS; Sigma-Aldrich, P4417), fixed in 4% formaldehyde (Sigma-Aldrich, 252549) in 1xPBS and imaged using a stereozoom microscope (Olympus, Tokyo, Japan). The size of the gastric caeca was measured from these images using Photoshop (Adobe, San Jose, CA, USA) magnetic lasso tool and the histogram function to determine pixels included in the area as previously described [Citation42].
Live mCherry and LysoTracker imaging
For live imaging of mCherry-Atg8a, a minimum of 10 midguts were dissected from appropriately staged animals in 1xPBS with Hoechst 33342 (2 μg/ml; Invitrogen, H1399) to stain DNA and imaged immediately without fixation using a Zeiss confocal (LSM 700 or 800; Carl Zeiss Microscopy, Jena, Germany). The images were quantitated using ImageJ (Bethesda, MD, USA) to count puncta with a size larger than 2 pixels and represented as the average puncta per cell. For co-staining with LysoTracker, a minimum of 10 midguts were dissected in 1xPBS with 1 µM LysoTracker Red DN99 or LysoTracker Green DND26 (1:1000; Invitrogen Molecular Probes, L7528 and L7526 respectively) and Hoechst 33342. The images were quantified using ImageJ to count puncta with a size larger than 30 pixels and represented as the average puncta per cell.
Puncta size measurement
A randomly selected fixed size area was analyzed using Photoshop magic wand tool with the sample size set as point sample and tolerance set at 50. Individual puncta in each fixed area were selected and the histogram function was used to determine the number of pixels and the average puncta size. Three areas were measured from each image with a total of 10 images examined.
Immunostaining and immunoblotting Drosophila midguts
Midguts of the required stages were dissected in 1xPBS and fixed with 4% w:v paraformaldehyde (Sigma-Aldrich, P6148) in 1xPBS at room temperature for 20 min then washed 3 × 5 min in PBTw (PBS + 0.1% Tween 20 [Sigma-Aldrich, P7949]). Midguts were blocked in PBTx (PBS + 0.1% Triton X-100 [Sigma-Aldrich,T8787]) containing 1% bovine serum albumin heat-shock fraction (Sigma-Aldrich, A7904) at room temperature for 1 h then incubated with rabbit anti-CTSL/MEP (1:200; Abcam, 58991), goat anti-GFP (1:200; Rockford, 600–101-215) or anti-Atg8a (Anti-GABARAP+GABARAPL1+ GABARAPL2; Abcam, 109364) overnight at 4°C. Following 4 × 30 min washes in PBTx, midguts were incubated with anti-rabbit Alexa-FLUOR 555 (1:200; Invitrogen Molecular Probes, A27039) and anti-goat Alexa-FLUOR 488 (1:200; Invitrogen Molecular Probes, A11055), at room temperature for 1 h. Samples were washed 3 × 10 min in blocking buffer, stained with Hoechst 33342 for 1 min, and washed 3 × 10 min in PBTx. Midguts were mounted in 80% glycerol (Sigma-Aldrich, G7893) in 1xPBS and imaged on a Zeiss confocal microscope (LSM 700 or 800).
Protein lysates from appropriately staged dissected midguts were denatured for 5 min at 95°C and separated on Mini-PROTEAN TGX Stain-Free pre-cast gels (Bio-Rad, Hercules, CA, USA) at 110 V for 60 min in SDS-PAGE running buffer (250 mM Tris-base [Sigma-Aldrich, T6066], 192 mM Glycine [Sigma-Aldrich, G7126], 0.06% SDS [Sigma-Aldrich, 74255]) and transferred onto PVDF membrane (Perkin Elmer, NEF1002001PK). The membranes were blocked with 5% w:v skim milk powder (Diploma) in TBS-T (20 mM Tris, 150 mM NaCl pH 7.4 [Sigma-Aldrich, S3014], 0.05% Tween 20) for 1 h at room temperature, before incubation with primary antibody anti-CTSL/MEP (1:500; Abcam, 58991), anti-Atg8a (1:500 Anti-GABARAP+GABARAPL1+ GABARAPL2; Abcam, 109364), or mouse anti-Act5C/ACTB/β-actin (1:1000; Sigma Aldrich, A1978) overnight at 4°C. Membranes were washed in TBS-T for 4 × 15 min before incubation with secondary antibody (anti-rabbit-horse radish peroxidase (HRP)-conjugated; GE healthcare, GENA934 and anti-mouse-Cy5-conjugated; Invitrogen Molecular Probes, A10524) for 1 h at room temperature. Membranes were then washed in TBS-T for 4 × 15 min, followed by development with Enhanced Chemi-Luminescence (ECL) reagent (GE Healthcare, RPN2236) or SuperSignal West Femto Maximum Sensitivity Substrate (Thermo Fisher Scientific, 34096). The luminescence signals were detected using a Fuji LAS4000 System (GE Healthcare, Waukesha, WI, USA) or Chemidoc MP (Bio-Rad, Hercules, CA, USA).
Confocal microscopy
Confocal images were obtained at room temperature using a Carl Zeiss LSM 700 Axio Observer Z1 confocal microscope with 405 nm (5 mW), 488 nm (10 mW) and 555 (10 mW) and 639 nm (5 mW) lasers using Zen 2011 (Black Edition), version 8.1.5.484 (Carl Zeiss Microscopy, Jena, Germany) or a Carl Zeiss LSM 800 Axio Observer 7 confocal microscope with 405 nm (5 mW), 488 nm (10 mW), 561 nm (10 mW) and 640 nm (5 mW) lasers using Zen 2.3 (Blue Edition) (Carl Zeiss Microscopy, Jena, Germany). Drosophila midguts were visualized using the PlanApo 40x/1.0 DIC objective on LSM 700 and PlanApo 40x/1.3 Oil DIC objective on LSM 800. Images captured by Zen software were exported into Photoshop (Adobe, San Jose, CA, USA).
Transmission electron microscopy
Midguts from appropriately staged larvae were dissected in 1xPBS then fixed in 1.25% v:v glutaraldehyde (Electron Microscopy Sciences, 16220), 4% w:v sucrose (Chem Supply, SA030), 4% w:v paraformaldehyde (ProSciTech, C007) in 1xPBS for 30 min at room temperature. Samples were then washed with 4% w/v sucrose in 1xPBS, post-fixed in 1% osmium tetroxide (ProSciTech, EMS19102) for 1 h, dehydrated in ethanol, treated with propylene oxide (ProSciTech, C156-450), and infiltrated for embedding in resin (Procure 812 embedding kit; ProSciTech, C038). Ultrathin sections were cut on grids, stained for 2 min with 4% uranyl acetate (Ajax Chemicals Ltd; 569) in 25% ethanol and 2 min in Reynold’s lead citrate (Lead Nitrate; Chem Supply, LA019 and tri Sodium Citrate Dehydrate; Chem Supply SA034) before examination using FEI Tecnai G2 Spirit transmission electron microscope (Adelaide Microscopy; FEI Hillsboro, OR, USA).
Quantitative Real-Time PCR (qRT-PCR)
The level of gene expression was determined by qRT-PCR. Total RNA was isolated from 20 midguts/sample or 3 whole larvae/sample in triplicate for each sample using TRIzol reagent (Invitrogen, 15596026). cDNA was synthesized using High Capacity cDNA Reverse Transcription Kit with random primers (Applied Biosystems, 4368814) using 1 μg of total RNA. qRT-PCR was performed on a Rotor-Gene Q (Qiagen, Valencia, CA, USA) using KAPA SYBR FAST Universal Kit (Sigma-Aldrich, KK4601) as per the manufacturer’s instructions. Reactions were performed in triplicate using three independent biological samples, and the transcript levels were normalized using RpL32 as the reference gene. Data were analyzed using the Q-Gene software (Qiagen, Valencia, CA, USA) with Standard Curves [Citation45], and samples on the same graph were run simultaneously. Primers used are listed as follows:
RpL32 F 5ʹ-CCAGTCGGATCGATATGCTAA; R 5ʹ-ACGTTGTGCACCAGGAACTT
CG4572 F 5ʹ-CTCCTCGCTCTTCGGTTTGT; R 5ʹ-ATAGCCGGCATCGTTCTCTG
CtsB F 5ʹ-TTTGCTGTGTCAGCGCATTG; R 5ʹ-CATCGAAATTGCGACCCACC
cathD F 5ʹ-AATCAAGATGGATGCCGCCT; R 5ʹ-CCGGCAATTGGGGAATGAGA
CtsF F 5ʹ-GAAGGGAAATGAGACCGCCA; R 5ʹ-ACACCGTGGTCGAGGTTTTT
Cp1 F 5ʹ-CGATTTGCTGCACCACGAAT; R 5ʹ-GTGTCCCTGATCCTTGACGG
Atg8a F 5ʹ-CATCGGTGATTTGGACAAGA; R 5ʹ-TGCCGTAAACATTCTCATCG
Tor F 5ʹ-CGGTTATCCCGCTCAGTACC; R 5ʹ-GGTGATCATAGTCTGGCGCA
Mitf F 5ʹ-AATATGATTGAGCGAAGGCG; R 5ʹ-AAGATTGTCCCCTTGTTTGG
Lamp1 F 5ʹ-TGCTGCCTGAGGATTTTCCA; R 5ʹ-ACTGCTCAGCATCGAGTGTC
Ppn F 5ʹ-CGCTTATTGTGCTGTCCTGC; R 5ʹ-CAGGGAATCTGCTCTGGGAA
Cndp2 F 5ʹ-TGATAAATGGGCCGAGCGAG; R 5ʹ-GAATAGATCCCCCTTCGCGG
Jon65Aiv F 5ʹ-TACCAGGTGGGACTTTCCCT; R 5ʹ-AGTAGACGGTCACGGACTGA
Mass spectrometry analysis
Four biological replicates of 20 midguts each were collected from −4, 0 and +2 h RPF w1118 animals. Samples were resuspended in 6 M urea (Sigma-Aldrich, 33247), 100 mM DTT (DL-Dithiothreitol Sigma-Aldrich, D9163) and 100 mM Tris-HCl pH7.0 and subjected to protein digestion using a filter aided sample preparation (FASP) column [Citation46]. Solvent was removed by lyophilization before peptides were resuspended in 3% acetonitrile (ACN; Fisher Chemical, A955-4) and 0.1% formic acid (FA; Merck, 5.33002.0050). Samples were analyzed by nanoflow LC-MS/MS on a nanoAcquity system (Waters, Milford, MA, USA) coupled to a Maxis quadruple Time Of Flight (qTOF) mass spectrometer (Bruker, Bremen, Germany) through a CaptiveSpray ion source with nitrogen source gas doped with acetonitrile (Bruker). Peptide mixtures were separated by reverse-phase chromatography using a 250 mm column with 75 μm inner diameter (nanoAcquity UPLC 1.7 μm BEH130 C18) on a 90 min linear gradient from 1% to 35% buffer B (A: Milli-Q water, 3% ACN, 0.1% FA; B: 99.9% ACN, 0.1% FA) at a 400 nl/min constant flow rate. The Maxis qTOF was operated in a data-dependent mode with a 1.5 second cycle time, switching automatically between one full-scan (4 Hz) and subsequent MS/MS scans for the remaining time.
The raw files were analyzed using the MaxQuant software (version 1.5.7.4) [Citation47,Citation48]. The database search was performed using Drosophila melanogaster protein sequences obtained from Uniprot including isoforms with strict trypsin specificity allowing up to 2 missed cleavages. The minimum required peptide length was set to 7 amino acids. Carbamidomethylation of cysteine was set as a fixed modification while N-acetylation of protein N-termini and oxidation of methionine were set as variable modifications. During the MaxQuant main search, precursor ion mass error tolerance was set to 0.006 Da and fragment ions were allowed a mass deviation of 40 ppm. PSM and protein identifications were filtered using a target-decoy approach at a false discovery rate (FDR) of 1%.
Further analysis was performed using a custom pipeline developed in R, which utilizes the MaxQuant output files (allPeptides.txt, peptides.txt and evidence.txt.) A feature was defined as the combination of peptide sequence, charge and modification. Features not found in at least half the number of replicates in each group were removed. Proteins identified from hits to the reverse database and proteins with only one unique peptide were also removed. To correct for injection volume variability, feature intensities were normalized by converting to base 2 logarithms and then multiplying each value by the ratio of maximum median intensity of all replicates over median replicate intensity. Features assigned to the same protein differ in the range of intensity due to their chemico-physical properties and charge state. To further correct these differences, each intensity value was multiplied by the ratio of the maximum of the median intensities of all features for a protein over the median intensity of the feature. Missing values where imputed using a random normal distribution of values with the mean set at mean of the real distribution of values minus 1.8 SD, and an SD of 0.3 times the SD of the distribution of the measured intensities. The probability of differential expression between pairwise groups was calculated using a Mann Whitney U-test excluding any non-unique sequences and any features with modifications other than oxidation and carbamidomethylation. Probability values were corrected for multiple testing using Benjamini–Hochberg method.
A principal component analysis (PCA) using the log2 intensity values of all peptides detected in the −4, 0 and +2 h RPF midgut samples was performed to examine the variability between the replicates for each sample. This separated the replicates into distinct groups according to their developmental stage except for one of the +2 h RPF samples (Fig. S1). This replicate was excluded from further analysis, and additional PCA revealed the replicates clustered more closely following the removal of the sample (). Therefore, the proteomes of midguts from different developmental stages were generated using four biological replicates for both −4 and 0 h RPF samples, and three biological replicates for the +2 h RPF sample.
The mass spectrometry proteomics data have been deposited to the ProteomeXchange Consortium via the PRIDE [Citation49] partner repository with the dataset identifier PXD016675.
Bioinformatics
The obtained Universal Protein Knowledgebase (UniProt v2.16; http://www.uniprot.org) [Citation50] accession numbers were processed through Database for Annotation, Visualization & Integrated Discovery (DAVID) bioinformatics resources v.6.7 (https://david.ncifcrf.gov/) [Citation17,Citation18], Kyoto Encyclopedia of Genes and Genomes (KEGG) pathway maps (http://www.genome.jp/kegg) [Citation51,Citation52] and Protein ANalysis THrough Evolutionary Relationships (PANTHER) classification system (http://pantherdb.org) [Citation53,Citation54].
Statistical analysis of data
Student’s t-test, two-tailed equal variance was used for statistical analysis to compare two groups and data are expressed as mean ± standard deviation (SD) or mean ± standard error of the mean (SEM), as appropriate. P < 0.05 was considered significant. For multiple analyses, an ordinary one-way analysis of variance (ANOVA) with Tukey’s multiple comparisons test was performed using Prism (GraphPad Software) and data are expressed as mean ± SD.
Supplemental Material
Download MS Word (9.2 MB)Acknowledgments
This work was supported by the National Health and Medical Research Council (NHMRC) of Australia Project Grant (1124490), and an Australian Research Council (ARC) Discovery Grant (DP170100623). SK was supported by a NHMRC Senior Principal Research Fellowship (1103006). SN was supported by a Research Training Program scholarship. We thank the Australian Drosophila Research Support Facility (Monash University, Vic., Australia), Vienna Drosophila Resource Center, and Bloomington Drosophila Stock Center for Drosophila stocks. We thank the TRiP at Harvard Medical School (NIH/NIGMS R01-GM084947) for providing transgenic RNAi fly stocks. We thank Ruth Williams at Adelaide Microscopy (Frome Rd, The University of Adelaide, SA, Australia) for assistance with transmission electron microscopy sample preparation and microscopy.
Disclosure statement
The authors declare no conflict of interest regarding the publication of this paper.
Supplementary material
Supplemental data for this article can be accessed here.
Additional information
Funding
Related Research Data
References
- Kutscher LM, Shaham S. Non-apoptotic cell death in animal development. Cell Death Differ. 2017;24:1326–1336.
- Fuchs Y, Steller H. Live to die another way: modes of programmed cell death and the signals emanating from dying cells. Nat Rev Mol Cell Biol. 2015;16:329–344.
- Yuan J, Kroemer G. Alternative cell death mechanisms in development and beyond. Genes Dev. 2010;24:2592–2602.
- Galluzzi L, Vitale I, Aaronson SA, et al. Molecular mechanisms of cell death: recommendations of the nomenclature committee on cell death 2018. Cell Death Differ. 2018;25:486–541.
- Denton D, Kumar S. Autophagy-dependent cell death. Cell Death Differ. 2019;26:605–616.
- Lee CY, Cooksey BA, Baehrecke EH. Steroid regulation of midgut cell death during Drosophila development. Dev Biol. 2002;250:101–111.
- Jiang C, Baehrecke EH, Thummel CS. Steroid regulated programmed cell death during Drosophila metamorphosis. Development. 1997;124:4673–4683.
- Denton D, Shravage B, Simin R, et al. Autophagy, not apoptosis, is essential for midgut cell death in Drosophila. Curr Biol. 2009;19:1741–1746.
- Denton D, Shravage B, Simin R, et al. Larval midgut destruction in Drosophila: not dependent on caspases but suppressed by the loss of autophagy. Autophagy. 2010;6:163–165.
- Xu T, Nicolson S, Denton D, et al. Distinct requirements of autophagy-related genes in programmed cell death. Cell Death Differ. 2015;22:1792–1802.
- Stoka V, Turk V, Turk B. Lysosomal cathepsins and their regulation in aging and neurodegeneration. Ageing Res Rev. 2016;32:22–37.
- Patel S, Homaei A, El-Seedi HR, et al. Cathepsins: proteases that are vital for survival but can also be fatal. Biomed Pharmacother. 2018;105:526–532.
- Shen HM, Mizushima N. At the end of the autophagic road: an emerging understanding of lysosomal functions in autophagy. Trends Biochem Sci. 2014;39:61–71.
- Karch J, Schips TG, Maliken BD, et al. Autophagic cell death is dependent on lysosomal membrane permeability through Bax and Bak. Elife. 2017;6:e30543.
- Denton D, Xu T, Dayan S, et al. Dpp regulates autophagy-dependent midgut removal and signals to block ecdysone production. Cell Death Differ. 2019;26:763–778.
- Chang T-K, Shravage BV, Hayes SD, et al. Uba1 functions in Atg7- and Atg3-independent autophagy. Nat Cell Biol. 2013;15:1067–1078.
- Huang da W, Sherman BT, Lempicki RA. Systematic and integrative analysis of large gene lists using DAVID bioinformatics resources. Nat Protoc. 2009;4:44–57.
- Huang da W, Sherman BT, Lempicki RA. Bioinformatics enrichment tools: paths toward the comprehensive functional analysis of large gene lists. Nucleic Acids Res. 2009;37:1–13.
- Kocks C, Maehr R, Overkleeft HS, et al. Functional proteomics of the active cysteine protease content in Drosophila S2 cells. Mol Cell Proteomics. 2003;2:1188–1197.
- Perera RM, Zoncu R. The lysosome as a regulatory hub. Annu Rev Cell Dev Biol. 2016;32:223–253.
- Hasanagic M, van Meel E, Luan S, et al. The lysosomal enzyme receptor protein (LERP) is not essential, but is implicated in lysosomal function in Drosophila melanogaster. Biol Open. 2015;4:1316–1325.
- Kowalewski-Nimmerfall E, Schahs P, Maresch D, et al. Drosophila melanogaster cellular repressor of E1A-stimulated genes is a lysosomal protein essential for fly development. Biochim Biophys Acta. 2014;1843:2900–2912.
- Matsumoto I, Watanabe H, Abe K, et al. A putative digestive cysteine proteinase from Drosophila melanogaster is predominantly expressed in the embryonic and larval midgut. Eur J Biochem. 1995;227:582–587.
- Denton D, Xu T, Dayan S, et al. Crosstalk between Dpp and Tor signaling coordinates autophagy-dependent midgut degradation. Cell Death Dis. 2019;10:111.
- Zhang T, Zhou Q, Ogmundsdottir MH, et al. Mitf is a master regulator of the v-ATPase, forming a control module for cellular homeostasis with v-ATPase and TORC1. J Cell Sci. 2015;128:2938–2950.
- Xu T, Kumar S, Denton D. Characterization of Autophagic Responses in Drosophila melanogaster. Methods Enzymol. 2017;588:445–465.
- Sardiello M, Palmieri M, Di Ronza A, et al. A gene network regulating lysosomal biogenesis and function. Science. 2009;325:473–477.
- Bouche V, Espinosa AP, Leone L, et al. Drosophila Mitf regulates the V-ATPase and the lysosomal-autophagic pathway. Autophagy. 2016;12:484–498.
- Jain A, Rusten TE, Katheder N, et al. p62/sequestosome-1, autophagy-related gene 8, and autophagy in drosophila are regulated by nuclear factor erythroid 2-related factor 2 (NRF2), independent of transcription factor TFEB. J Biol Chem. 2015;290:14945–14962.
- Kuchitsu Y, Homma Y, Fujita N, et al. Rab7 knockout unveils regulated autolysosome maturation induced by glutamine starvation. J Cell Sci. 2018;131:jcs215442 .
- Lee CY, Baehrecke EH. Steroid regulation of autophagic programmed cell death during development. Development. 2001;128:1443–1455.
- Berry DL, Baehrecke EH. Growth arrest and autophagy are required for salivary gland cell degradation in Drosophila. Cell. 2007;131:1137–1148.
- McPhee CK, Balgley BM, Nelson C, et al. Identification of factors that function in Drosophila salivary gland cell death during development using proteomics. Cell Death Differ. 2013;20:218–225.
- Gorski SM, Chittaranjan S, Pleasance ED, et al. A SAGE approach to discovery of genes involved in autophagic cell death. Curr Biol. 2003;13:358–363.
- Mauvezin C, Nagy P, Juhasz G, et al. Autophagosome-lysosome fusion is independent of V-ATPase-mediated acidification. Nat Commun. 2015;6:7007.
- Bednarski E, Ribak CE, Lynch G. Suppression of cathepsins B and L causes a proliferation of lysosomes and the formation of meganeurites in hippocampus. J Neurosci. 1997;17:4006–4021.
- Felbor U, Kessler B, Mothes W, et al. Neuronal loss and brain atrophy in mice lacking cathepsins B and L. Proc Natl Acad Sci U S A. 2002;99:7883–8.
- Koike M, Shibata M, Waguri S, et al. Participation of autophagy in storage of lysosomes in neurons from mouse models of neuronal ceroid-lipofuscinoses (Batten disease). Am J Pathol. 2005;167:1713–1728.
- Dennemarker J, Lohmuller T, Muller S, et al. Impaired turnover of autophagolysosomes in cathepsin L deficiency. Biol Chem. 2010;391:913–922.
- Pan L, Li Y, Jia L, et al. Cathepsin S deficiency results in abnormal accumulation of autophagosomes in macrophages and enhances Ang II-induced cardiac inflammation. PLoS One. 2012;7:e35315.
- Tsukuba T, Yanagawa M, Kadowaki T, et al. Cathepsin E deficiency impairs autophagic proteolysis in macrophages. PLoS One. 2013;8:e82415.
- Denton D, Chang TK, Nicolson S, et al. Relationship between growth arrest and autophagy in midgut programmed cell death in Drosophila. Cell Death Differ. 2012;19:1299–1307.
- Vissers JH, Manning SA, Kulkarni A, et al. A Drosophila RNAi library modulates Hippo pathway-dependent tissue growth. Nat Commun. 2016;7:10368.
- Denton D, Mills K, Kumar S. Methods and protocols for studying cell death in Drosophila. Methods Enzymol. 2008;446:17–37.
- Muller PY, Janovjak H, Miserez AR, et al. Processing of gene expression data generated by quantitative real-time RT-PCR. Biotechniques. 2002;32:1372–1379.
- Wisniewski JR, Zougman A, Nagaraj N, et al. Universal sample preparation method for proteome analysis. Nat Methods. 2009;6:359–362.
- Cox J, Mann M. MaxQuant enables high peptide identification rates, individualized p.p.b.-range mass accuracies and proteome-wide protein quantification. Nat Biotechnol. 2008;26:1367–1372.
- Cox J, Neuhauser N, Michalski A, et al. Andromeda: a peptide search engine integrated into the MaxQuant environment. J Proteome Res. 2011;10:1794–1805.
- Perez-Riverol Y, Csordas A, Bai J, et al. The PRIDE database and related tools and resources in 2019: improving support for quantification data. Nucleic Acids Res. 2019;47:D442–D50.
- UniProt C. UniProt: a hub for protein information. Nucleic Acids Res. 2015;43:D204–12.
- Kanehisa M, Goto S. KEGG: kyoto encyclopedia of genes and genomes. Nucleic Acids Res. 2000;28:27–30.
- Kanehisa M, Goto S, Sato Y, et al. Data, information, knowledge and principle: back to metabolism in KEGG. Nucleic Acids Res. 2014;42:D199–205.
- Mi H, Muruganujan A, Casagrande JT, et al. Large-scale gene function analysis with the PANTHER classification system. Nat Protoc. 2013;8:1551–1566.
- Mi H, Muruganujan A, Thomas PD. PANTHER in 2013: modeling the evolution of gene function, and other gene attributes, in the context of phylogenetic trees. Nucleic Acids Res. 2013;41:D377–86.
- Chittaranjan S, McConechy M, Hou YC, et al. Steroid hormone control of cell death and cell survival: molecular insights using RNAi. PLoS Genet. 2009;5:e1000379.
- Santhanam A, Liang SY, Chen DY, et al. Midgut-enriched receptor protein tyrosine phosphatase PTP52F is required for Drosophila development during larva-pupa transition. Febs J. 2013;280:476–488.
- Anding AL, Wang C, Chang TK, et al. Vps13D encodes a ubiquitin-binding protein that is required for the regulation of mitochondrial size and clearance. Curr Biol. 2018;28:287–95 e6.
- Xu T, Denton D, Kumar S. Hedgehog and Wingless signaling are not essential for autophagy dependent cell death. Biochem Pharmacol. 2019;162:3–13.