
ABSTRACT
The orphan nuclear receptor ESRRA (estrogen related receptor alpha) is critical in mitochondrial biogenesis and macroautophagy/autophagy function; however, the roles of ESRRA in intestinal function remain uncharacterized. Herein we identified that ESRRA acts as a key regulator of intestinal homeostasis by amelioration of colonic inflammation through activation of autophagic flux and control of host gut microbiota. Esrra-deficient mice presented with increased susceptibility to dextran sodium sulfate (DSS)-induced colitis with upregulation of intestinal inflammation. In addition, esrra-null mice had depressed AMP-activated protein kinase phosphorylation (AMPK), lower levels of TFEB (transcription factor EB), and accumulation of SQSTM1/p62 (sequestosome 1) with defective mitochondria in intestinal tissues. Esrra-deficient mice showed distinct gut microbiota composition and significantly higher microbial diversity than wild-type (WT) mice. Cohousing or fecal microbiota transplantation from WT mice to Esrra-deficient mice ameliorated DSS-induced colitis severity. Importantly, patients with ulcerative colitis (UC) had significantly decreased ESRRA expression in intestinal mucosal tissues that correlated with disease activity, suggesting clinical relevance of ESRRA in UC. Taken together, our results show that ESRRA contributes to intestinal homeostasis through autophagy activation and gut microbiota control to protect the host from detrimental inflammation and dysfunctional mitochondria.
Abbreviations: ABX, antibotics; AMPK, AMP-activated protein kinase; ATP5A1, ATP synthase, H+ transporting, mitochondrial F1 complex, alpha subunit 1; BECN1, beclin1, autophagy related, CCL, C-C motif chemokine ligand; CD, Crohn disease; CLDN, claudin; COX4I1, cytochrome c oxidase subunit 4I1; cKO, conditional knockout; cWT, conditional wild-type; CXCL, C-X-C motif chemokine ligand; DAI, disease activity index; DSS, dextran sodium sulfate; EGFP, enhanced green fluorescent protein; ESRR, estrogen related receptor; ESRRA, estrogen related receptor alpha; Esrra+/+, Esrra wild type; esrra–/-, esrra homozygous knockout; FMT, fecal microbiota transplantation; GABARAP, gamma-aminobutyric acid receptor associated protein; GSEA, gene set enrichment analysis; IBD, inflammatory bowel disease; IL, interleukin; KO, knockout; LAMP1, lysosomal-associated membrane protein 1; LCN2, lipocalin 2; LEfSe, linear discriminant analysis (LDA) effect size; LPS, lipopolysachharide; MAP1LC3/LC3, microtubule associated protein 1 light chain 3; NDUFAB1, NADH: ubiquinone oxidoreductase subunit AB1; OCLN, occludin; OUT, operational taxonomic unit; OXPHOS, oxidative phosphorylation; PCoA, principal coordinate analysis; PPARGC1A, PPARG coactiva- tor 1 alpha; PRKAA, 5’-AMP-activated protein kinase catalytic subunit alpha; PTGS2/COX2, prostaglandin-endoperoxide synthase 2; RAB7, member RAS oncogene family; SDHB, succinate dehydrogenase complex, subunit B, iron sulfur (Ip); SQSTM1/p62, sequestosome 1; S100A9, S100 calcium binding protein A9 (calgranulin B); TCA, tricarboxylic acid; TFEB, transcription factor EB; TNF, tumor necrosis factor; UC, ulcerative colitis; UCP2, uncoupling protein 2 (mitochondrial, proton carrier); UQCRC1, ubiquinol-cytochrome c reductase core protein 1; UVRAG, UV radiation resistance associated gene; Vil1, villin; VPS11, VPS11, CORVET/HOPS core sub-unit; WT, wild type.
Introduction
The ESRR (estrogen related receptor) family consists of three subfamilies, including the first identified orphan nuclear receptor ESRRA/NR3B1 (estrogen related receptor alpha), ESRRB/NR3B2, and ESRRG/NR3B3 [Citation1–3]. Among them, ESRRA is the most studied member; this protein is a regulator of energy metabolism [Citation4] and is highly expressed in various human tissues and organs [Citation5]. Due to its critical function in mitochondrial biogenesis and energy metabolism, ESRRA dysregulation can result in metabolic disorders, particularly liver disease and breast cancer [Citation3,Citation6,Citation7]. In addition, ESRRA is crucially involved in the regulation of autophagy in macrophages at transcriptional and post-translational levels [Citation8]. Recent studies have shown that ESRRA has immune controlling action in infection and inflammation [Citation8–11], suggesting a much broader function of ESRRA in maintaining immune homeostasis than early envisioned.
Inflammatory bowel disease (IBD), which mainly includes Crohn disease (CD) and ulcerative colitis (UC), is a complicated polygenic disorder with multiple etiologies that include genetic, environmental, and dysbiosis of gut microbiota factors [Citation12–16]. Recent evidence suggests that autophagy, a cellular catabolic pathway, is strongly associated with intestinal homeostasis, through multiple mechanisms including regulation of inflammation and antimicrobial peptide generation [Citation17,Citation18]. Several studies have also supported the role of mitochondria in prevention of intestinal inflammation, since mitochondrial dysfunction may play important roles in epithelial barrier maintenance and disease pathogenesis in IBD [Citation19]. Both autophagy and mitochondrial function are important in the maintenance of biological homeostasis during stress conditions. Nevertheless, the fine-tuning of these functions remains elusive in the context of intestinal homeostasis, as the central players controlling both pathways have not yet been clarified.
According to recent studies, the gut microbiota is closely linked to intestinal pathology and inflammation through regulation of autophagy. For example, Fusobacterium nucleatum is increased in the gut of colorectal cancer patients and is associated with chemoresistance in response to chemotherapeutics through activation of the autophagy pathway [Citation20]. In addition, human commensal Bacteriodes fragilis secretes outer membrane vesicles to activate autophagy for protection against colitis [Citation21]. However, it remains largely unknown whether a causal relationship exists among gut microbiota, autophagy, and inflammation in terms of intestinal homeostasis.
Because ESRRA is highly expressed in intestinal tissues [Citation22], ESRRA may play a key function in the regulation of intestinal function that so far has been underexplored. In this study, we found that ESRRA is critically required for intestinal homeostasis and mediates its function through amelioration of colonic inflammation by coordinating autophagy and mitochondrial function. Esrra deficiency led to defective phosphorylation of AMP-activated protein kinase (AMPK), decreased expression of TFEB (transcription factor EB), and reduced the upregulation of SQSTM1 levels in intestinal colitic tissues. In addition, ESRRA ablation in intestinal epithelial cells led to defective autophagic flux, reduced expression of genes involved in autophagic flux, and enhanced inflammation. Furthermore, Esrra-deficient mice had higher bacterial diversity and a significant shift in the microbiome composition, which was characterized by an increase in the phyla Firmicutes and a decrease in the phyla Bacteroidetes. Colonization of Esrra-deficient mice with fecal microbiota from wild-type (WT) littermates improved the survival rate and ameliorated colonic inflammation. Furthermore, ESRRA expression levels were significantly diminished in intestinal tissues from patients with UC. Taken together, these results suggest that ESRRA contributes to intestinal homeostasis through autophagy and gut microbiota control to protect the host from detrimental inflammation and mitochondrial dysfunction.
Results
ESRRA is decreased in colonic tissues and is required for controlling host susceptibility during DSS-induced colitis.
To determine whether ESRRA is predominantly expressed in intestinal tissues, we performed immunohistochemical staining for ESRRA in murine colonic tissues. As shown in , abundant ESRRA was primarily observed in the epithelial cells of intestinal mucosal tissue. Next, we studied whether the expression pattern of ESRRA was changed in an experimental colitis mouse model. A dextran sodium sulfate (DSS)-induced colitis model, which mimics UC in humans, was used in this study [Citation23]. To analyze differences in the expression patterns of ESRRA during experimental models of IBD, qPCR and western blot analysis was performed on total extracts of colon tissues from mice challenged with or without DSS. It was noted that mRNA and protein levels of ESRRA were significantly downregulated in colonic tissues after DSS challenge ().
Figure 1. Loss of Esrra aggravates DSS-induced colitis in mice. (A) Immunohistochemical analyses of ESRRA expression in large intestine. Black arrows label intestinal epithelial cells of intestinal mucosal tissues. (B, C) ESRRA expressions in colon of DSS-induced colitis model of mice by qPCR and western blotting. (D) initial weight and percent body weight after 1.5% DSS treatment of Esrra+/+ and esrra−/− mice. (E) Survival of control and mutant mice after 1.5% DSS administration. (F) colon length and representative photographs of colon from control and 1.5% DSS-treated mice of each genotype. (G) representative light microscopy images of H&E stained colon tissue sections from Esrra+/+ and esrra−/− mice before and 5 days after 1.5% DSS administration. Scale bars: 600 μm. Arrowhead denote epithelial cell damage. (H) colon histological score at day 9. (n > 5 per group). (I) Initial weight and percent body weight after 1.5% DSS treatment of EsrraFlox/Flox and esrra cKO. *P < 0.05, **P < 0.01, ***P < 0.001. Mann-Whitney U test (B and H), Two-way ANOVA (D) and log-rank (Mantel-Cox) test (E). Data are the representative of three independent experiments (A, C, F, and G), and values represent means (± SEM) from three or four independent experiments performed in triplicate (B, D, E, and H). Un, untreated. DSS, DSS treated
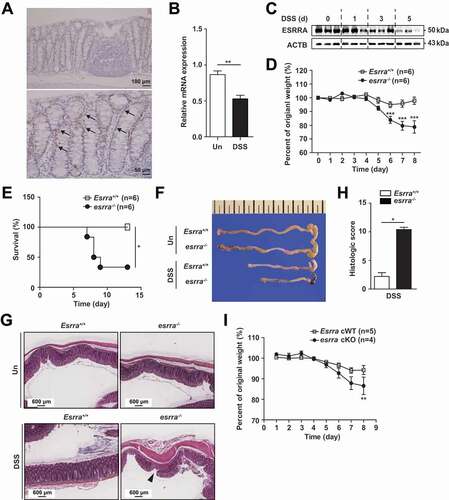
To explore the role of ESRRA in host protective effects against intestinal inflammation, we challenged Esrra-deficient (esrra−/-) mice and their WT littermates (Esrra+/+) with 1.5% and 2% DSS. When age- and sex-matched Esrra+/+ and esrra−/- mice were exposed to 1.5% DSS in drinking water, the body weight and survival rate of esrra−/- mice were notably decreased after 6 days, compared with those of Esrra+/+ mice (). Furthermore, more than half of esrra−/- mice died by day 9 of the study, whereas no Esrra+/+ mice died (). Additionally, an increased ratio of colon weight:length, a marker of tissue edema [Citation24], was prominent in esrra−/- mice at 5 days after onset of DSS-induced colitis, as illustrated in and S1A. Similarly, following challenge with 2% DSS, esrra−/- mice robustly succumbed to death as early as 7 days after DSS exposure; nearly all mice died within 10 days after DSS administration (Fig. S1B). As indicated by disease activity index (DAI) values, DSS caused dramatic pathological responses (i.e., weight loss, rectal bleeding, and loose stool) in esrra−/- mice, in comparison with Esrra+/+ mice, at the indicated days (P < 0.001) (Fig. S1C). Histological evaluation of DSS-treated esrra−/- mice demonstrated remarkable effacement of the brush border, extensive mucosal inflammation, and edematous submucosal tissues, compared with Esrra+/+ mice (); this was consistent with a high overall histological injury score, with increased immune cell infiltration in lamina propria, crypt loss, abscesses and ulcer, in esrra−/- mice (). Epithelial injury and inflammatory lesions were not detected in untreated Esrra+/+ and esrra−/- mice (). Because ESRRA expression was high in the epithelial cells of intestinal mucosal tissue, Esrra cWT (conditional wild-type; Esrraflox/flox) mice were crossed with Vil1 (villin)-Cre mice to generate intestinal epithelial cell-specific esrra conditional knockout (esrra cKO) mice; pups were treated with DSS. Eight days after DSS administration, the body weight of esrra cKO mice was notably decreased compared with the weight of Esrra cWT littermates (). These data suggest that Esrra deficiency, particularly in intestinal epithelial cells, exacerbates experimental chemical colitis in vivo.
Esrra deletion upregulates the severity of mucosal permeability and inflammatory responses in colonic tissues.
To evaluate differences in barrier function between Esrra+/+ and esrra−/- colons, an in vivo intestinal permeability assay was performed using FITC-dextran on day 5 of DSS challenge. As shown in , serum FITC-dextran levels were significantly higher in esrra−/- mice after DSS treatment, indicating decreased intestinal barrier function in these mice, compared with this function in Esrra+/+ mice. Further examination of the colonic mucosa by transmission electron microscopy showed severely disrupted tight junctions in DSS-treated esrra−/- epithelia in colonic tissues (). In contrast, Esrra+/+ epithelia showed relatively intact crypts and tight junctions after DSS treatment (). Consistent with these findings, we found that the expression levels of numerous genes involved in the tight junction complex, including cldn3 (claudin 3), cldn7 and cldn8 as well as ocln (occludin), were remarkably depressed in esrra−/- colonic tissues, compared with those tissues in Esrra+/+ mice (, S2A). Notably, numerous genes involved in the tight junction complex possessed at least two ESRRA consensus motifs (5′-TNAAGGTCA-3′) [Citation25] in their promoter regions (within 5 kb upstream of the transcription start sites) (Fig. S2B), suggesting that ESRRA exhibits functional importance in terms of the transcriptional activation of multiple gene sets associated with the integrity of the intestinal epithelial barrier. These data confirm that ESRRA is required for gut barrier function and maintenance of the integrity of junctional complexes in colonic epithelia of mice with DSS-induced colitis.
Figure 2. Esrra deficiency increases the severity of mucosal permeability and colonic inflammatory responses. (A) intestinal permeability measured by the concentration of FITC-dextran in the blood serum (n > 5; 0 and 5 d of DSS treatment). (B) Representative electron microscope images of intercellular spaces of colon sections from mice treated with DSS for 5 d. Images taken at ×11,000. White arrows label tight junctions and yellow arrows delineate intercellular spaces on the basolateral side. (C and D) Heatmap of RNA-seq data showing the tight junction-related genes (for C) and the inflammation-related genes (for D) at day 0 (untreated) and 5 (DSS-treated), comparing Esrra+/+ and esrra−/− mice. (D) heatmap of RNA-seq data showing the inflammation related genes at day 0 (untreated) and 5 (DSS-treated), comparing Esrra+/+ and esrra−/− mice. (E) qPCR analysis of cytokines and chemokines in whole colon homogenates from Esrra+/+ and esrra−/− mice (0 and 5 d of DSS treatment; n > 5 per group). (F, G) TNF and ADGRE1/F4/80 immunoreactivity in the colon tissues of DSS-treated Esrra+/+ and esrra−/− mice (F, Representative images, Scale bars: 50 μm; G, quantitative analysis of the staining). *P < 0.05, **P < 0.01, ***P < 0.001. Two-way ANOVA (A, E, and G). Data are the representative of three independent experiments (B and F), and values represent means (± SEM) from three or four independent experiments performed in triplicate (A, E, and G). Un, untreated. DSS, DSS treated
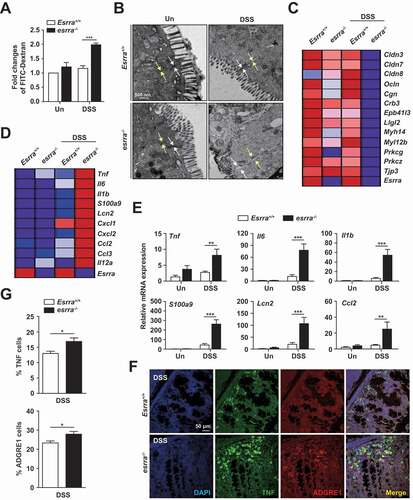
We subsequently investigated whether the synthesis of inflammatory mediators is differentially regulated in the colonic mucosa between Esrra+/+ and esrra−/- mice. Heatmap analysis of global mRNA expression between Esrra+/+ and esrra−/- colons showed that DSS challenge led to increased expression levels of numerous inflammatory cytokines/chemokines in the colons of esrra−/- mice, compared with the colons of Esrra+/+ mice (). In addition, qPCR analysis validated the RNA sequencing analysis data and showed that the mRNA expression levels of several inflammatory cytokines and chemokines (Tnf [tumor necrosis factor], Il6 [interleukin 6], Il1b [interleukin 1 beta], S100a9 [S100 calcium binding protein A9 (calgranulin B)], Lcn2 [lipocalin 2], Ccl2 [C-C motif chemokine ligand 2], Ccl3 [C-C motif chemokine ligand 3], Cxcl1 [C-X-C motif chemokine ligand 1], Cxcl2 [C-X-C motif chemokine ligand 2], and Il12a [interleukin 12A]) were significantly increased in esrra−/- colon tissues, compared with Esrra+/+ colons (, S3A). Furthermore, TNF protein expression and macrophage infiltration levels were significantly increased in DSS-treated esrra−/- colons (). Western blot analysis revealed that the protein levels of various inflammatory mediators (PTGS2/COX-2 [prostaglandin-endoperoxide synthase 2], IL1B/IL-1β, and TNF) and MAPK1/ERK2-MAPK3/ERK1 phosphorylation, which regulates inflammatory mediator PTGS2 [Citation26], were dramatically upregulated in esrra−/- colons, compared with Esrra+/+ colons (Fig. S3B). These results indicated that ESRRA is essentially required for amelioration of excessive intestinal inflammation in the epithelia of colon tissues in DSS-induced colitis.
Esrra deficiency affects autophagic flux in colonic tissues and epithelial cells.
Because autophagy is essential in the maintenance of intestinal homeostasis, dysregulation of autophagy may be linked to the pathogenesis of IBD [Citation27]. In addition, ESRRA functions as a positive regulator of autophagy in macrophages at the transcriptional and post-translational levels [Citation8]. Nevertheless, it remains unclear whether and how ESRRA is involved in autophagy activation in the colon and colonic epithelial cells. To assess whether ESRRA is involved in the autophagy process in colonic tissues, we examined the expression levels of proteins associated with autophagy and autophagic flux in colonic epithelial tissues from Esrra+/+ and esrra−/- mice. The SQSTM1 (sequestosome 1) expression level and intensity was significantly increased in esrra−/- colons (; S4A and S4B), indicating that autophagic flux was significantly inhibited in esrra−/- intestinal epithelia. In addition, the expression level of TFEB and the phosphorylation level of AMPK were significantly decreased in the colons of esrra−/- mice, compared with Esrra+/+ mice (). We further examined the mRNA expression levels of Tfeb and downstream target genes involved in autophagic flux (Vps11 [VPS11, CORVET/HOPS core subunit], Uvrag [UV radiation resistance associated gene], Becn1 (beclin 1, autophagy related), Gabarap [gamma-aminobutyric acid receptor associated protein], Rab7 [RAB7, member RAS oncogene family], and Lamp1 [lysosomal-associated membrane protein 1]) [Citation28], and found that they were significantly decreased in colonic epithelia from DSS-treated esrra−/- mice (; S4C).
Figure 3. Esrra deficiency leads to defective autophagic flux in colonic tissues and epithelial cells. (A) Expression of SQSTM1, phospho-PRKAA/AMPKα, TFEB and ACTB in colon tissue from untreated and DSS-induced Esrra+/+ and esrra−/− mice by western blot analysis (B) The relative mRNA expressions of Tfeb, Vps11 and Uvrag in intestinal epithelial cells (IECs) of mice detected by qPCR at 0 and 5 days of DSS treatment. (C) Representative images and quantitative analysis for ESRRA WT and KO HT-29 cells transduced with retroviruses expressing a tandem-tagged mCherry-EGFP-LC3B. (D, E) qPCR and western blot analysis of TFEB in ESRRA WT and KO HT-29 cells respectively. (HC, High confluent and LC, Low confluent cell). (F) mRNA levels of UVRAG in ESRRA WT and KO HT-29 cells. *P < 0.05, **P < 0.01, ***P < 0.001. Two-way ANOVA (B) or Mann-Whitney U test (C, D, and F). Data are the representative of three independent experiments (A and C left), and values represent means (± SEM) from three or four independent experiments performed in triplicate (B, C right, D, F). Un, Untreated. DSS, DSS treated
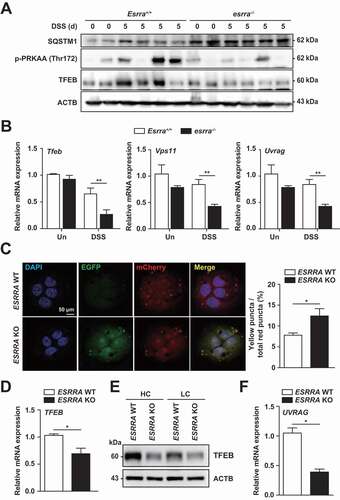
To assess the role of ESRRA in the regulation of autophagic flux in epithelial cells, we generated CRISPR-Cas9 ESRRA knockout (KO) cells derived from HT-29 cells; we confirmed that ESRRA levels were markedly downregulated, whereas SQSTM1 levels were upregulated, in ESRRA KO cells (Fig. S4D). When WT and ESRRA KO HT-29 cells were transduced with mCherry-EGFP-LC3B retrovirus, ESRRA KO cells displayed defective quenching of the GFP signal, while ESRRA WT cells showed red-colored signals (); this supported our findings regarding the blockade of autolysosome acidification. In addition, the mRNA and protein levels of TFEB were decreased in ESRRA KO cells (), compared with those in ESRRA WT cells. Because previous studies found that autophagosome formation was reduced at higher densities of certain cells [Citation29], we compared TFEB expression at both low and high cell densities; the pattern of TFEB expression levels did not differ (). Similar to in vivo results, mRNA expression of UVRAG was lower in unstimulated ESRRA KO cells, compared to ESRRA WT cells (). We additionally assessed whether inhibition of autophagic flux is related to the upregulation of inflammatory responses in ESRRA KO cells. As shown in Fig. S4E, ESRRA deficiency led to a significant increase in the mRNA levels of inflammatory mediators, including IL6, IL1B, CCL2, CXCL2, IL12A and LCN2. These data strongly suggested that ESRRA is a positive regulator of autophagy that controls inflammatory responses, in colonic epithelial cells.
ESRRA is required for the maintenance of mitochondrial function and increases the number of functional mitochondria in colonic tissue and epithelial cells.
ESRRA is a nuclear receptor that regulates numerous genes involved in mitochondrial and metabolic functions, including fatty acid β-oxidation, tricarboxylic acid cycle, and oxidative phosphorylation (OXPHOS) [Citation30] in cooperation with PPARGC1A/PGC1α (PPARG coactivator 1 alpha) [Citation31,Citation32]. In addition, autophagy activity is strongly associated with mitochondrial homeostasis [Citation33]. Thus, we next examined whether ESRRA functions in mitochondrial biogenesis, OXPHOS, and the maintenance of mitochondrial membrane potential. As shown in , percentage of damaged mitochondria were significantly increased in esrra−/- colonic epithelia after DSS challenge (, from Esrra+/+ and esrra−/-mice; , from Esrraflox/flox and esrra cKO mice). A heatmap analysis of the global mRNA expression profiles of Esrra+/+ and esrra−/- colons showed that esrra−/- colons exhibited a remarkable reduction in the number of genes involved in OXPHOS (Fig. S5).
Figure 4. Ablation of Esrra deteriorates mitochondrial functions in the colonic tissues and epithelial cells. (A-D) TEM and quantitative analysis of colon tissue from DSS-treated or untreated Esrra+/+ and esrra−/− mice. Scale bar 500 nm. Arrowheads denoting damaged mitochondria. (4A and 4B, from Esrra+/+ and esrra−/- mice; 4 C and 4D, from EsrraFlox/Flox littermates and esrra cKO mice). (E) qPCR of mitochondrial respiratory chain complexes genes including Ndufab1, Sdhb, Uqcrc1, Cox4i1, Atp5a1 and Ucp2. (F-H) ESRRA WT and KO HT-29 cells subjected to flow cytometry analysis for TMRE (F) and MitoTracker Deep Red and MitoTracker Green (G; contour plots, H; quantitative analysis) *P < 0.05, **P < 0.01, ***P < 0.001, ns: not significant. Two-way ANOVA (B, D, and E) or Mann-Whitney U test (F and H). Data are the representative of three independent experiments (A, C, and F), and values represent means (± SEM) from three or four independent experiments performed in triplicate (B, D, E, F, and H). Un, Untreated. DSS, DSS treated
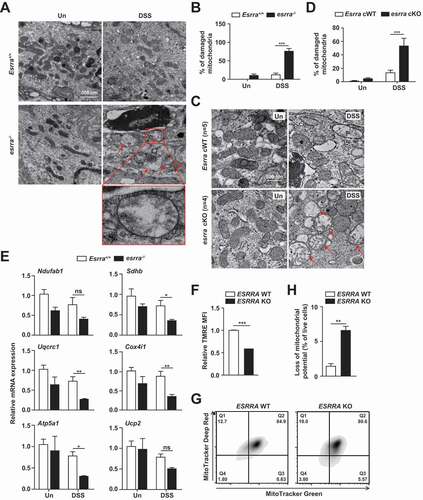
Next, we found that the expression levels of several genes related to mitochondrial respiratory chain complexes genes including Ndufab1 (NADH:ubiquinone oxidoreductase subunit AB1), Sdhb (succinate dehydrogenase complex, iron sulfur (Ip)), Uqcrc1 (ubiquinol-cytochrome c reductase core protein), Cox4i1 (cytochrome c oxidase subunit 4I1), and Atp5a1 (ATP synthase, H+ transporting, mitochondrial F1 complex, alpha), and Ucp2 (uncoupling protein 2 (mitochondrial, proton carrier)) were depressed in esrra−/- colons after colitis induction (). In addition, monitoring of TMRE fluorescence revealed a significant degree of depolarization of the mitochondrial membrane potential (ΔΨm) in ESRRA KO HT-29 cells, when compared with WT cells (). We further compared the number of dysfunctional mitochondria in ESRRA WT and KO cells by dual staining with MitoTracker Red (respiring) and MitoTracker Green (total). The proportions of non-respiring and dysfunctional (MitoTracker Green-positive, MitoTracker Red-negative) mitochondria were significantly increased in ESRRA KO cells (). Together, these data suggested that ESRRA plays an essential function in mitochondrial homeostasis in intestinal cells and tissues.
Alteration of gut microbiota in esrra KO mice and following DSS treatment.
To investigate whether the difference in DSS-induced colitis susceptibility, depending on ESRRA genotype, is associated with alterations in the gut microbiota, we compared the gut microbial compositions of Esrra+/+ and esrra−/- littermate mice before and after DSS treatment. Principal coordinate analysis (PCoA) based on unweighted UniFrac distance revealed marked differences in microbial community structure with clearly separated clusters of untreated esrra−/- and untreated Esrra+/+ mice (PERMANOVA, p = 0.001) (). DSS-induced colitis has been reported to induce a shift in the composition of intestinal microbiota [Citation34–36]. Consistent with these reports, an unweighted PCoA plot showed that the induction of DSS colitis resulted in clear separation of microbiota composition across the groups (PERMANOVA, p = 0.001). Segregation of the four experimental groups was confirmed by PCoA plot based on weighted UniFrac distances (Fig. S6A). The diversity indices of untreated esrra−/- mice were higher than those of Esrra+/+ mice, but statistical significance was achieved only for the Shannon diversity index (). The gut microbial richness and diversity of Esrra+/+ mice were not changed, but those of esrra−/- mice were decreased after DSS-induced colitis; however, no indices exhibited statistical significance.
Figure 5. Changes in gut microbiota depending on the Esrra genotype and induction of colitis. (A) principal coordinate analysis (PCoA) results based on unweighted UniFrac distances of 16S rRNA amplicon sequencing of the feces from Esrra+/+ and esrra−/− mice before and after DSS treatment, respectively. (B) alpha diversity between Esrra+/+ and esrra−/− mice was analyzed by Chao1 and Shannon indices, number of observed OTUs and PD whole tree metrics untreated Esrra+/+ and esrra−/− mice. (C) distinctive gut microbiota composition between Esrra+/+ and esrra−/− mice revealed by LEfSe analysis. Graphs represent the LDA scores (> 3.0) of the differentially abundant OTUs between untreated Esrra+/+ and esrra−/− mice (up) or between DSS-treated Esrra+/+ and esrra−/− mice (bottom). Taxa enriched in the gut of Esrra+/+ mice are represented with positive LDA scores. (D) The relative abundance of the genus Alloprevotella, Barnesiella, Dorea, Bacteroides, Odoribacter, Desulfovibrio, Mucispirillum and Acetatifactor are shown as a box plot. Statistical significance was determined by the PERMANOVA with 999 permutations (A) and Mann-Whitney U test (B and D). *P < 0.05, **P < 0.01. Un, Untreated. DSS, DSS treated
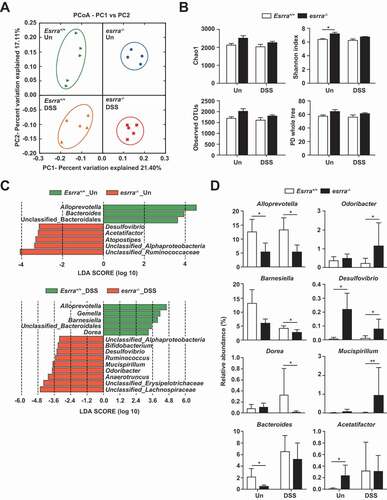
We then compared the relative abundances of major taxa (> 0.5% of the mean abundance) at the family level. We found depletion of Prevotellaceae and Lactobacillaceae, as well as enrichment of Lachnospiraceae, in both DSS-treated and untreated esrra−/- mice. Furthermore, Bacteroidaceae was enriched in untreated Esrra+/+ mice, compared with untreated esrra−/- mice; Erysipelotrichaceae was depleted in DSS-treated Esrra+/+ mice, compared with DSS-treated esrra−/- mice (Fig. S6B). To identify differentially represented bacterial taxa associated with genotype and DSS treatment, we performed linear discriminant analysis (LDA) effect size (LEfSe) analysis (). The LEfSe results revealed that Alloprevotella, Bacteroides and unclassified Bacteroidales were enriched in untreated Esrra+/+ mice, whereas Atopostipes, Acetatifactor, Desulfovibrio, unclassified Ruminococcaceae, and unclassified Alphaproteobacteria were enriched in untreated esrra−/- mice (LDA score > 3.0, p < 0.05). After DSS treatment, Alloprevotella, Gemella, Barnesiella, Dorea, and unclassified Bacteroidales were enriched in Esrra+/+ mice, while Anaerotruncus, Odoribacter, Mucispirillum, Ruminococcus, Desulfovibrio, Bifidobacterium, unclassified Lachnospiraceae, and unclassified Erysipelotrichaceae were enriched in esrra−/- mice (LDA score > 3.0, p < 0.05). To investigate the effect of DSS treatment on gut microbiota, we compared the untreated groups with DSS-treated groups. Notably, the genera Barnesiella, Anaerotruncus and Anaerofustis were enriched in untreated Esrra+/+ mice, while the genera Bacteroides, Vampirovibrio, Acetatifactor, Streptococcus, and unclassified Clostridiales were enriched in colitis-induced Esrra+/+ mice. Furthermore, the genera Barnesiella, Anaerofustis, unclassified Ruminococcaceae, and unclassified TM7 were enriched in the untreated esrra−/- mice, while the genera Bacteroides, Helicobacter and Vampirovibrio were enriched in colitis-induced esrra−/- mice (Supple .). Statistical analysis using t-tests also revealed significant differences in the relative abundance of specific taxa, which were identified by LEfSe based on an LDA score of 3.0 (). Significant differences in specific taxa were observed, comprising marked depletions of the genera Alloprevotella and Bacteroides, as well as enhancements of the genera Desulfovibrio and Acetatifactor in untreated esrra−/- mice. The genus Barnesiella was decreased in untreated esrra−/- mice; however, this genus did not significantly differ between Esrra+/+ and esrra−/- mice. After DSS treatment, Odoribacter and Mucispirillum were significantly increased, whereas Dorea was significantly decreased, in DSS-treated esrra−/- mice. The genus Acetatifactor was increased only in Esrra+/+ mice after DSS treatment; Bacteroides was increased in all DSS-treated groups, but was decreased in esrra−/- mice compared with Esrra+/+ mice, although this difference was not statistically significant. Alloprevotella was not affected by the induction of colitis and Barnesiella was sensitive to DSS treatment. These observations suggested that homeostasis of the gut microbial community is regulated by ESRRA; moreover, altered intestinal microbiota in esrra−/- mice may be associated with the development of DSS-induced colitis and its severity.
The severity of colitis is transmissible by gut microbiota.
To explore the role of the bacterial microbiota in modulating the severity of experimental colitis in Esrra deficiency, we first administered broad-spectrum antibiotics (ABX) for 4 weeks prior to DSS colitis induction. ABX treatment significantly protected esrra−/- mice from DSS-induced colitis and resulted in severity comparable with that of Esrra+/+ mice treated with ABX (). Subsequently, Esrra+/+ and esrra−/- mice were cohoused for 4 weeks and survival differences between the two groups were evaluated. Similar to the findings obtained from ABX-treated groups, there was no difference in mouse survival following DSS challenge between the two groups ().
Figure 6. The severity of colitis is transmissible by the gut microbiota. (A-D) Survival of mice after 1.5% DSS administration. (A) Esrra+/+ (n = 7) and esrra−/− (n = 6) mice were given ABX in the drinking water for 4 weeks before the DSS treatment (control mice without ABX: experimental mice with ABX). The antibiotic mixture was composed of 1 g/L each of ampicillin, neomycin sulfate, and metronidazole and 0.5 g/L of vancomycin hydrochloride. (B) DSS experiments were conducted Esrra+/+ (n = 8), esrra−/− mice (n = 7) and blindly on cohoused Esrra+/+ (n = 6) with esrra−/− (n = 8) mice for 4 weeks. (C) littermate mice (Esrra+/+ litt, n = 6; esrra+/− litt, n = 6; esrra−/− litt, n = 5) were generated from heterozygous crossing and kept in the same cage. DSS experiments were conducted blindly considering mouse genotype at 8 weeks of age. (D) Four weeks before DSS experiments, esrra−/− mice were reconstituted with or without fresh supernatant of fecal content from Esrra+/+ (Esrra+/+ → esrra−/−; n = 4 per group) and survival was monitored for indicated days after DSS treatment. (E) Colons were harvested from cohoused Esrra+/+ and esrra−/− mice before and 5 days after 1.5% DSS administration. qPCR analysis of whole colon homogenates was performed to assess the mRNA expression of indicated cytokines. (F) quantitative representation of confocal microscopy to show the expression levels of LC3 and SQSTM1 in intestinal tissues of cohoused Esrra+/+ and esrra−/- mice (n = 5, per group). (G) qPCR analysis to determine the mRNA expression of Tfeb and Vps11 in intestinal tissues of cohoused Esrra+/+ and esrra−/- mice (n = 5, per group). (H) Expression of SQSTM1, phospho-PRKAA/AMPKα, TFEB and ACTB in colon tissue from DSS-induced Esrra+/+ and esrra−/− mice with FMT or control by western blot analysis. *P < 0.05, ns: not significant. Log-rank (Mantel-Cox) test (A-D) and Two-way ANOVA (E-G). Values are represented as means ± SEM (E-G). Un, Untreated. DSS, DSS treated
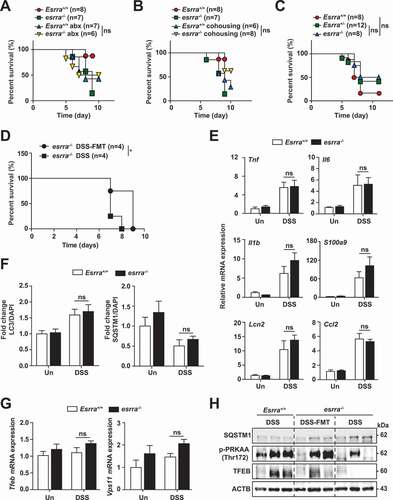
We next validated the ABX and cohousing results by using littermates generated from in-house heterozygous crossing and housing them together from birth to the day of the experiment. Consistent with the ABX and cohousing experiment findings, we found no differences in the survival of esrra−/-, esrra±, and Esrra+/+ littermates cohoused from birth, which implied that the maternal transmission of microbiota is critically involved in ESRRA-induced intestinal homeostasis (). Finally, we evaluated whether fecal microbiota transplantation (FMT) from Esrra+/+ littermates to esrra−/- mice exerts beneficial effects on intestinal pathological conditions in esrra−/- mice. Feces derived from Esrra+/+ littermates were repeatedly transferred into esrra−/- mice by oral gavage prior to DSS treatment. FMT-treated esrra−/- mice showed significantly increased survival (), suggesting that ESRRA affects disease activity by modulation of gut microbiota.
Similarly, the mRNA levels of proinflammatory cytokines and tight junction complex proteins were comparable in the intestinal tissues between cohoused Esrra+/+ and esrra−/- mice ( and S7A). To examine the effect of cohousing on autophagy, the protein levels of SQSTM1 and LC3 were evaluated. Similar LC3 and SQSTM1 expression levels were detected in intestinal tissues from cohoused Esrra+/+ and esrra−/- mice (). In addition, the Tfeb, Vps11, Uvrag, Becn1, Gabarap, Rab7, and Lamp1 mRNA levels were similar in intestinal tissues from cohoused Esrra+/+ and esrra−/- mice, before and after DSS challenge ( and S7B). Furthermore, we performed FMT for esrra−/- mice, by reconstitution with feces from Esrra+/+ mice. As shown in , we found that FMT from Esrra+/+ mice resulted in significantly increased AMPK and TFEB, but decreased SQSTM1 levels, in esrra−/- mice, compared with control condition (with PBS). These data collectively suggested that the gut microbiota modulate ESRRA-mediated intestinal homeostasis by controlling autophagic flux.
Clinical relevance of ESRRA in the disease severity of human UC.
Given the aforementioned results regarding the pathogenesis of DSS-induced colitis, we analyzed ESRRA expression in a public gene dataset (datasets GSE9452 and GSE11223) of UC samples. The results showed that ESRRA expression was reduced in these samples compared with samples from normal colonic tissue (). Immunohistochemistry results also revealed a low level of ESRRA expression in UC tissue samples, compared with normal colonic tissues (). Furthermore, the expression of ESRRA was decreased depending on the disease severity in the GSE11223 dataset (). Together, these data suggested that ESRRA expression is significantly decreased in active UC.
Figure 7. Clinical relevance of ESRRA in IBD patients. (A) boxplot of ESRRA expression levels in healthy controls and UC patients (using dataset GSE9452 and GSE11223) (B) Immunohistochemical examination of ESRRA protein in healthy and UC samples. Representative ESRRA staining results are shown (left). Arrow showing the highly stained area of the tissue. (Scale bars: 50 μm). Bar graph of ESRRA staining (Right). (C) Colonic ESRRA levels in biopsies from healthy subjects, UC patients with active disease (Active) or remission (Rem) (using dataset GSE11223) (D-G) Gene set enrichment analysis (GSEA) reveals correlation between ESRRA expression and genes involved in autophagy, tight junction, mitochondrial biogenesis and inflammation. GSEA probing for enrichment of (D) REACTOME_AUTOPHAGY (E) KEGG_TIGHT_JUNCTION, (F) REACTOME_MITOCHONDRIAL_BIOGENESIS and (G) HALLMARK_ INFLAMMATORY_RESPONSE, HALLMARK_IL6_JAK_STAT3_SIGNALING and HALLMARK_TNFA_ SIGNALING_VIA_NFKB active gene signature in IBD patients (GSE11223; n = 129). *P < 0.05, **P < 0.01, ***P < 0.001, ns: not significant. Mann-Whitney U test (A and B) and one-way ANOVA with Dunn’s multiple comparison test (C). Values are represented as means ± SEM. NES = normalized enrichment score. FDR = false discovery rate
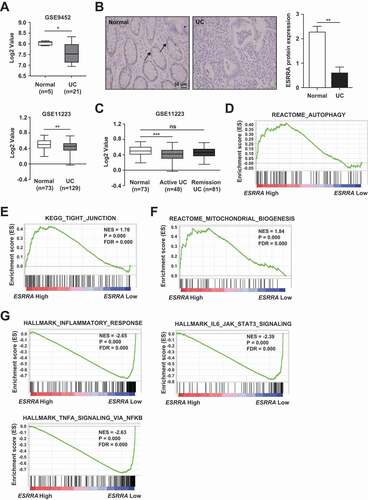
To confirm our experimental results, we assessed the expression of ESRRA and various signaling pathway proteins using Gene Set Enrichment Analysis of the GSE11223 dataset. Similar to the results we obtained by analysis of Esrra+/+ and esrra−/- mice, we found positive associations between ESRRA expression and reactome autophagy, KEGG tight junction, and reactome mitochondrial biogenesis (). Additionally, negative associations between ESRRA and the inflammation-related pathways including hallmark inflammatory response, hallmark IL6-JAK-STAT3 signaling, and hallmark TNF signaling via NFKB/NFκB were identified in UC clinical specimens (). Taken together, these results highlighted that ESRRA is a key regulator of intestinal homeostasis in human UC.
Discussion
Both CD and UC are major types of IBD, for which the etiologies are complicated and affected by multiple factors, including genetic, immunological, microbial, and environmental causes [Citation37]. Among these etiological factors, there is emerging evidence to suggest immune and autophagic dysregulation and intestinal dysbiosis are crucial causes for IBD pathogenesis [Citation38,Citation39]. Microbial-based therapies are thought to be promising strategies for IBD, particularly for UC, through regulation of both intestinal dysbiosis and inflammatory responses [Citation38]. Despite this, the key player(s) that control intestinal homeostasis through coordinated control of immunological, autophagic, and dysbiotic microbiota are largely unknown. Understanding the mechanisms that orchestrate the interplay among gut microbiota, autophagy, and inflammation would provide new knowledge for development and optimization of therapeutic strategies against UC.
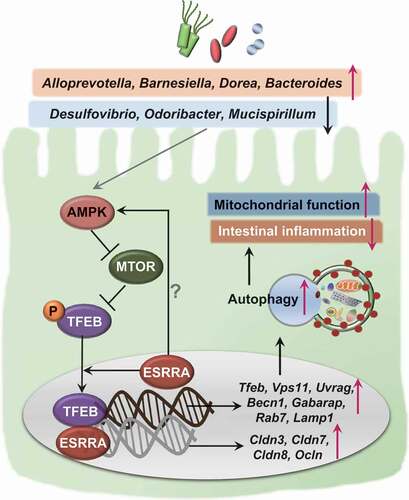
ESRRA is a transcriptional factor, known to be central for the regulation of mitochondrial metabolism and function [Citation4,Citation6]. In addition, ESRRA is important for controlling innate immune and inflammatory responses [Citation6,Citation40]; it is related to the phenotypes and progression of certain cancers [Citation41]. We previously showed that ESRRA functions in the transcriptional and post-translational control of autophagy, thereby promoting host defense against mycobacterial infection [Citation8]. In addition, ESRRA is ubiquitously expressed in various tissues of the human body, including the small and large intestine [Citation22]. However, ESRRA regulation of intestinal inflammation remains undefined. The present study identifies a previously unappreciated role of ESRRA in the regulation of intestinal homeostasis using a combination of bioinformatics, biological, and in vivo studies. We found that ESRRA is critically required for TFEB-induced activation of autophagy, which ameliorates intestinal inflammation and maintains mitochondrial function in intestinal epithelial cells, as well as for shaping of beneficial gut microbiota, during experimental colitis (summarized in ).
Figure 8. A proposed model of ESRRA-mediated intestinal homeostasis through TFEB-induced autophagy activation. In intestinal epithelial cells, ESRRA is essential for the activation of AMP-activated protein kinase, which is known to inhibit MTOR kinase, thereby upregulating the nuclear translocation of TFEB. In addition, ESRRA is required for the gene expression of tight junction composition, Tfeb, and its downstream target genes involved in autophagy activation. The increased autophagy contributes to the maintenance of mitochondrial function and control the intestinal inflammation during DSS challenge. Furthermore, ESRRA is crucial for the shaping of beneficial gut microbiota, which confers the intestinal homeostasis through activation of autophagic flux
The autophagy pathway is fundamental for the regulation of excessive inflammatory responses during a variety of stress conditions. Genetic risk factors associated with host autophagy have been proposed to contribute to IBD pathogenesis [Citation13,Citation14]. In the present study, we identified a crucial role of ESRRA in the activation of autophagic flux; we found that it plays a beneficial role in the regulation of DSS-induced colitis. In addition, we demonstrated that ESRRA is highly expressed in intestinal epithelial cells, and plays a key role in the control of inflammatory colitis. In ESRRA-deficient intestinal tissues, we found that the levels of proinflammatory factors including TNF, IL6, and IL1B were markedly increased, compared with those levels in littermate controls. Combined with results from recent studies that demonstrated autophagy genes involved in IBD risk factors could attenuate inflammation by constraining inflammasome activation [Citation27,Citation42–44], these data provide strong evidence or the contribution of autophagy to the protection of IBD. Furthermore, we showed that TFEB and downstream gene expression were significantly downregulated in ESRRA-null intestinal epithelial cells. These findings are partly consistent with the results of recent studies, which demonstrated that TFEB in the intestinal epithelium was critically involved in the regulation of DSS-induced intestinal injury [Citation45].
Our data showed that Esrra-deficient mice and intestinal cells had defective mitochondria and increased damage and dysfunction, suggesting that ESRRA plays a critical role in the maintenance of mitochondrial quality control. There is increasing evidence to support the function of mitochondria in IBD pathogenesis, because mitochondrial dysfunction is closely associated with intestinal inflammation and colorectal cancer [Citation46,Citation47]. Recently, a UC mucosal transcriptome study reported dramatic suppression of mitochondrial genes and function in active UC cohorts, revealing mitochondriopathy in UC pathogenesis [Citation48]. In addition, mitochondrial DNA, as well as mucosal mitochondrial damage, were increased in IBD patients [Citation49], suggesting a strong role for mitochondrial function in IBD pathology. Indeed, mitochondrial dysfunction is closely related to overwhelming inflammation and disease pathogenesis in a variety of inflammatory and autoimmune diseases [Citation50]. Moreover, given that the autophagy pathway is essential for mitochondrial quality control and function [Citation22], our data strongly suggested that ESRRA-dependent autophagy activation is essential for maintaining mitochondrial quality control and amelioration of inflammatory responses in the intestine. Therefore, ESRRA orchestrates colonic inflammatory signaling, mitochondrial function, and the autophagy network to biologically control intestinal homeostasis.
The gut microbiota is shaped by numerous environmental factors including the host genotype, immune system, and diet [Citation51–54]. Dysbiosis of the gut microbiota is closely associated with the development of IBD or colorectal carcinoma [Citation55–59] and the severity of colitis [Citation60]. The current study is important because it highlights the function of ESRRA in the maintenance of healthy gut microbiota composition for host protection against colitis. We found significant differences in the gut microbiota of the mice, according to Esrra genotype and treatment type ( and S5). LEfSe analysis showed that decreased abundance of the genus Bacteroides was observed in untreated esrra−/- mice; increased abundance of the genus Mucispirillum was detected in DSS-treated esrra−/- mice. Intestinal Bacteroides, one of the most abundant and well-studied taxa, has anti-inflammatory properties and is decreased in IBD patients [Citation61–63]. Among Bacteroides species, Bacteroides thetaiotaomicron was reported to have protective effects against DSS-induced colitis characterized by weight loss, colon shortening, and immune activation [Citation64]. Another Bacteroides species, B. fragilis, has capsular polysaccharide A that can induce anti-inflammatory IL10-secreting regulatory T cells to protect against chemically induced colitis in mice [Citation65]. Notably, Bacteroides vulgatus has a protective role against Escherichia coli-induced colitis in gnotobiotic il2 KO mice [Citation66]. In contrast to Bacteroides, the abundance of Mucispirillum was found to be increased by DSS treatment and was detected in inflamed colonic areas [Citation67–69]. Mucispirillum was also necessary for the development of colitis and exhibited selective accumulation in a colitis mouse model with combined deficiency of NOD2 (nucleotide binding oligomerization domain containing 2) and phagocyte CYBB/NADPH oxidase [Citation70]. Colitogenic commensal bacteria that are increased in Esrra-deficient mice and anti-inflammatory commensal bacteria that are decreased in Esrra-deficient mice may aggravate DSS-induced colitis severity. Importantly, we found that antibiotic treatment and cohousing ameliorated colitis severity and improved the survival rate of esrra−/- mice to Esrra+/+ levels. Additionally, FMT from Esrra+/+ to esrra−/- mice improved the survival rate of WT mice. Our findings strongly suggest that ESRRA can shape the host gut microbiota to regulate autophagy with the immune system to generate anti-inflammatory and protective effects during colitis, although the specific bacterial taxa and associated mechanism involved in amelioration of DSS-induced colitis were not revealed in our study. Further studies are needed to clarify the specific microbes from esrra−/- mice that are involved in the induction and development of intestinal colitis.
In addition to the biological importance of ESRRA, we propose that ESRRA is relevant to the pathogenesis of UC. By means of bioinformatics analysis, we found that the ESRRA level was strongly associated with UC. In addition, histopathological analysis showed that ESRRA expression was significantly decreased in tissue samples from UC patients, compared with unaffected individuals. Thus far, genetic approaches for IBD have revealed more than 200 risk loci; however, few gene loci and/or genetic markers are shared between CD and UC [Citation71,Citation72]. Recent bioinformatics approaches identified several candidate molecules that are differentially expressed in intestinal mucosal tissues from UC patients, compared to normal tissues, using the GEO datasets [Citation73–75]. Several previous studies have reported differential expression profiles of candidate molecules (including proinflammatory mediators) between inflamed UC tissues and healthy tissues [Citation73–75]. For example, epithelial cells from the colonic mucosa of UC patients have a deregulated transcriptional signature with epithelial cell dysfunction [Citation76]. In another report, local inflammatory responses, characterized by increased bioactive IL1B and neutrophil extracellular traps, were significantly increased in the colons of UC patients, but not CD patients [Citation77]. Combined with current findings, these data strongly suggested that targeted approaches to the control of intestinal pathological inflammation are crucial for the development of novel therapeutics for UC.
Importantly, ESRRA expression was downregulated in active UC biopsy samples and was also strongly associated with reactome autophagy and hallmark inflammatory response in a GSEA analysis. Although the mRNA expression levels of BRG1, a regulator of ATG16L1, AMBRA1, ATG7, and WIPI2, are reduced in both UC and CD patients [Citation74], it remains unknown whether autophagy regulators are specifically associated with UC disease activity. Given the strong link between ESRRA and autophagy genes in UC biopsy samples, our data strongly suggest that therapeutic targeting of ESRRA may upregulate autophagy responses, thus limiting the pathological inflammatory response in UC pathogenesis. Together, these data suggest that ESRRA activation or ESRRA-regulated regulation of the microbiota have therapeutic potential for intestinal inflammatory diseases, particularly UC.
Materials and Methods
Animals
Esrra+/+ and esrra−/− mice aged 8 to 10 weeks and sex-matched were used. All mice were maintained under specific pathogen-free conditions. All experiments were performed using littermate animals from heterozygous breeding pairs; at weaning, the mice were separated by sex and genotype (single cage). In some experiments, at weaning, mice were separated by sex (co-housing of Esrra+/+ and esrra−/− littermates). For cohousing experiments, age- and gender-matched Esrra+/+ and esrra−/− mice were transferred at a 50/50 ratio into an isolator cage for 4 weeks before the DSS experiment. For ablation of the intestinal bacteria, an antibiotic mixture of 1 g/L each of ampicillin (sodium salt), neomycin sulfate, and metronidazole and 0.5 g/L of vancomycin hydrochloride (all antibiotics from Sigma-Aldrich) was added to the drinking water for at least 4 weeks starting at 3 weeks of age and was changed once in three days.
Fecal microbiota transplantation was conducted as previously described with a few modifications [Citation78]. Briefly, fresh feces from Esrra+/+ donors were homogenized in 10 ml of sterile PBS and filtered through a disposable needle filter, and then collected. For the fecal transplantation, esrra−/− mice were administered with 200 μL of collected fresh supernatants prepared from feces of WT littermates, via oral gavage once a week for 3 weeks. For control mice, 200 μL of PBS were treated via oral gavage once a week for 3 weeks. The DSS experiment was performed 1 week after fecal transplantation or treatment with PBS.
For experiments of heterozygous parents and littermates, Esrra+/+, esrra+/−, and esrra−/− mice were generated from heterozygous crossing, and the age- and gender-matched mice were kept in the same cage. DSS experiments were conducted blindly considering genotype at 8 weeks of age. All animal-related procedures were reviewed and approved by the Institutional Animal Care and Use Committee, Chungnam National University School of Medicine (CNUH-014-A0006; Daejeon, Korea).
Generation of Esrra floxed mice by CRISPR genome editing
For generation of the targeting fragment for Esrra floxed allele, the Esrra gene was isolated from genomic DNA extracted from C57BL/6 MEF by PCR using KOD FX NEO (Toyobo, KFX-201). The targeting fragment was constructed by a 0.5-kb fragment of Esrra genomic DNA containing exon 2 and loxP site-containing 0.5-kb subfragments using restriction enzymes in pBluescript. The templates of Esrraflox1 and Esrraflox2 for gRNA in vitro transcription were generated using primers; Esrraflox1: TTA ATA CGA CTC ACT ATA GGc tgt cag tta ctg gcc tca gGT TTT AGA GCT AGA AAT AGC AAG TTA AAA T, or Esrraflox2: TTA ATA CGA CTC ACT ATA GGa gaa tgc ttg cct agt tta cGT TTT AGA GCT AGA AAT AGC AAG TTA AAA T gRNA PCR product was gel purified and used as the subsequent generation of gRNA. MEGAshortscript T7 (Life Technologies, AM1354) was used for the generation of the gRNA. Cas9 mRNA was generated by in vitro transcription (IVT) using mMESSAGE mMACHINE T7 ULTRA kit (Life Technologies, AMB13455) and the template that was amplified by PCR and gel-purified. The synthesized gRNA and Cas9 mRNA were purified using MEGAclear kit (Life Technologies, AM1908) and eluted in RNase-free water (Nacalai tesque, 36420–61). C57BL/6 female mice (6-week-old) were superovulated and mated to C57BL/6 males. The targeting vector was co-injected into the embryos with Cas9 mRNA and Esrraflox1/Esrraflox2_gRNA to obtain Esrraflox/flox pups. Fertilized one-cell stage embryos were collected from oviducts and injected into the cytoplasm with the Cas9 mRNA (100 ng/μl) and the gRNA (50 ng/μl). The injected live embryos were transferred into oviducts of pseudopregnant ICR females at 0.5 dpc. Male pups harboring the desired mutation were mated to C57BL/6 female mice and tested for the germline transmission. Heterozygotic mice were intercrossed to generate homozygotic Esrraflox/flox mice to be used for in vitro and in vivo assays. To generate Esrra cKO mice, Esrraflox/flox mice were crossed with Vil1 (villin)-Cre mice with IEC-specific Cre recombinase expression.
Colitis induction
To induce experimental colitis, Esrra+/+ and esrra−/− mice were treated with 1.5% and 2% (wt:vol) dextran sodium sulfate (DSS, 36,000 to 50,000 Mw; MP Biomedical, 0216011001) in drinking water ad libitum for 5 d, followed by normal water for 5 d. Control animals were given water only. Weight was monitored daily and rectal bleeding and stool consistency were measured and scored as previously reported [Citation79]. Disease activity index (DAI) scores were determined based on body weight loss, occult blood, and stool consistency. A score of 1–4 was given for each parameter with a maximal total score of 12. After treatment, mice were sacrificed by CO2 inhalation. The colon was removed and its length and weight were measured.
Histology
The animals were sacrificed and tissues from Esrra+/+ and esrra−/− mice were fixed in 10% neutral buffered formalin, routinely processed, sectioned at 6 mm, and stained with hematoxylin and eosin (H&E) for light microscopic examination. Colon tissue sections were analyzed for epithelial damage, inflammatory infiltration, crypt loss and ulcerations as described previously [Citation80].
Immunohistochemistry
Patients with UC and non-UC control subjects for this study were recruited from Chungnam National University Hospital. The diagnosis of UC was based on a standard combination of clinical endoscopic, histological, and radiological criteria. The use of pathological specimens as well as the review of all pertinent patient records were approved by the IRB (2020–03-105).
The expression of ESRRA was analyzed by immunohistochemistry on paraffin-embedded tissue sections from human and mouse colon tissues. Sections from paraffin blocks with a thickness of 3 µm were used for immunohistochemistry. A monoclonal rabbit antibody directed against ESRRA (Cell Signaling Technology [CST], 13826S) was diluted 1:800 with a background-reducing diluent (Dako, Code S3002), and tissue sections were incubated for 30 min at room temperature. Two experienced pathologists without any access to clinical information of the study, examined slides and assigned scores for blind comparison of the samples. The immunostaining of the tumor was divided into four grades based on the staining intensity and scored: score 0, no staining; score 1, weak; score 2, intermediate; and score 3, strong. In the cases of heterogeneous staining within samples, the higher score was chosen if >50% of the cells showed a higher staining intensity. Cases with no staining and a score of 1 were categorized into a low-expression group (LEG), whereas those with a score of 2 and 3 were categorized into a high-expression group (HEG).
Immunofluorescence
Sections (3-µm thick) from mouse colon tissue were prepared for immunofluorescence staining. Briefly, staining was achieved with use of primary anti-bodies against TNF/TNF-α (1:50, mouse monoclonal; Santa Cruz Biotechnology [SCBT], sc-52746), ADGRE1/F4/80 (1:50, rat monoclonal; SCBT, sc-52664), LC3B (1:100, mouse monoclonal; CST, 83506S) and SQSTM1/p62 (1:100, rabbit polyclonal; Sigma-Aldrich, P0067. And following appropriate secondary antibodies purchased from Life Technologies were used: Alexa Fluor 488 conjugated-goat anti-mouse IgG (H + L) (1:1,000; A28175), Alexa Fluor 594 conjugated-donkey anti-rat IgG (H + L) (1:100; A21209) or Alexa Fluor 594 conjugated-goat anti-rabbit IgG (H + L) (1:1,000; A-11037). Nuclei were stained with 4′,6-diamidino-2-phenylindole (DAPI, Sigma-Aldrich, D9542) for 1 min. Immunofluorescence images were acquired using a confocal laser-scanning microscope (Zeiss, Germany).
RNA extraction and quantitative real time PCR (qPCR) analysis
Whole colon tissue, IEC and cell RNA extraction were performed using the TRIzol reagent (Invitrogen, 15596026) and cDNA was synthesized using Superscript II Reverse Transcriptase (Invitrogen, 18064) according to the manufacturer’s protocol. qPCRs were carried out using SYBR Green PCR Kits (Qiagen, 204074) in the Real-time PCR cycler Rotor-Gene Q 2plex system (Qiagen, 9001620). The samples were amplified for 40 cycles as follows: 95°C for 10 s and 60°C for 30 s. To analyze qPCR data, we performed relative quantification using the 2ΔΔCt method with mouse or human ACTB/β-actin as an internal control gene; data were expressed as relative fold changes. The sequences of primers used in qPCR are shown in Table S1.
Western blot
Western blot analysis was performed as described previously [Citation81]. Cells or tissues were lysed in radioimmunoprecipitation assay (RIPA) buffer (50 mM Tris-HCl, pH 7.5, 2 mM EDTA, 150 mM NaCl, 0.1% sodium dodecyl sulfate [SDS; Sigma-Aldrich, R0278], 1% sodium deoxycholate [Life Technologies, 89904], 1% Triton X-100 [Sigma, T8787]) supplemented with protease inhibitor cocktail (Roche, 11836153001) and phosphatase inhibitor cocktail (Sigma-Aldrich, P5726). Protein extracts were boiled in 1× SDS sample buffer and subjected to immunoblotting analysis. Proteins were separated by 10, 12 or 15% SDS-polyacrylamide gel electrophoresis and transferred to a polyvinylidene difluoride membrane (Millipore). Membranes were blocked in 5% nonfat milk in PBST (3.2 mM Na2HPO4, 0.5 mM KH2PO4, 1.3 mM KCl, 135 mM NaCl, 0.05% Tween 20 [Sigma-Aldrich, P1379], pH 7.4) for 1 h and incubated with the primary antibodies. Following antibodies purchased from indicated sources were diluted in 5% nonfat milk in PBST: Anti-ESRRA (13826S), anti-IL1B/IL-1β (2022s), anti-phospho-MAPK/ERK (9101s) anti-phospho-PRKAA/AMPKα (2535s) from CST; anti-ACTB/β-actin (sc-47778) and anti-TNF/TNF-α (sc-52746) from SCBT; anti-PTGS2/COX-2 (ab15191) from Abcam; anti-SQSTM1/p62 (P0067) from Sigma-Aldrich, and anti-TFEB (A303-673A) from Bethyl laboratories. After incubation with the appropriate secondary antibodies, immunoreactive bands were visualized using an ECL reagent (Millipore, WBKLS0500) in a UVitec Alliance mini-chemiluminescence device (UVitec, UK).
Intestinal permeability and intestinal epithelial cell (IEC) isolation
Intestinal permeability was assessed by luminal enteral administration of FITC-dextran 4000 (Sigma-Aldrich, 46944), a non-metabolizable macromolecule as described previously [Citation82]. Briefly, all mice were fed with FITC-dextran (40 mg/100 g body weight) via oral gavage, 4 h before sacrificing. Whole blood was obtained by cardiac puncture at the time of killing, and FITC-dextran measurements were performed in duplicate by fluorometry. Dilutions of FITC-dextran in PBS were used for a standard curve preparation, and 100 μL of serum or standard was used to determine the concentration using a fluorometer at an excitation wavelength of 485 nm and emission of 528 nm.
For RNA-extraction, IECs from mice treated with DSS for 5 d were isolated using isolation buffer (30 mM EDTA and 1 mM DTT).
RNA-seq analysis
Total RNA of colon from control and DSS-treated Esrra+/+ and esrra−/− mice was isolated using TRIzol reagent following the manufacturer’s instructions. Purity of samples and efficiency of extractions were verified by spectrophotometry (NanoDrop) and using an Agilent 2100 Bioanalyzer.
The first step in the workflow involved purifying the poly-A containing mRNA molecules using poly-T oligo-attached magnetic beads. Following purification, the mRNA was fragmented into small pieces using divalent cations under elevated temperature. The cleaved RNA fragments were copied into first strand cDNA using reverse transcriptase and random primers. This was followed by second strand cDNA synthesis using DNA Polymerase I and RNase H. These cDNA fragments then have the addition of a single “A” base and subsequent ligation of the adapter. The products were then purified and enriched with PCR amplification. We then quantified the PCR yield by Qubit and pooled the samples together to make a single strand DNA circle (ssDNA circle), which gave the final library. DNA nanoballs (DNBs) were generated with the ssDNA circle by rolling circle replication (RCR) to enlarge the fluorescent signals at the sequencing process. The DNBs were loaded into the patterned nanoarrays and pair-end reads of 100 bp were read through on the BGISEQ-500 platform for the following data analysis study. For this step, the BGISEQ-500 platform combines the DNA nanoball-based nanoarrays and stepwise sequencing using Combinational Probe-Anchor Synthesis Sequencing Method.
We mapped clean reads to reference using Bowtie2, and then calculated the gene expression level with RSEM. RSEM is a software package for estimating gene and isoform expression levels from RNA-Seq data. Then, we calculated Pearson correlation between all samples using cor, performed hierarchical clustering between all samples using Hclust, and drew the diagrams with ggplot2 with functions of R.
Electron microscopy and morphology
After DSS treatment for indicated time, mice were euthanized and colon tissues from control and DSS-treated Esrra+/+ and esrra−/− mice were removed, washed with PBS and fixed with 3% glutaraldehyde in 0.1 M sodium cacodylate buffer (pH 7.2) containing 0.1% CaCl2 for 3 h. Then they were post-fixed with 1% osmium tetroxide in 0.1 M sodium cacodylate buffer containing 0.1% CaCl2 for 2 h. Then the samples were rinsed with cold distilled water, dehydrated slowly with series of ethanol concentrations and propylene oxide at 4°C. The tissues were embedded in Embed-812 (EMS; 14120), and cured at 60°C for 36 h. The ultrathin sections (70–80 nm) were cut with a diamond knife and ULTRACUT UC7 ultramicrotome (Leica, Germany), and mounted on formvar-coated slot grids. Sections were stained with 4% uranyl acetate for 10 min and lead citrate for 7 min. Stained sections were scanned using a Bio-High Voltage EM system (JEM-1400 Plus and JEM-1000 BEF; JEOL Ltd., Tokyo, Japan).
CRISPR-Cas-9 mediatedESRRAknock out HT-29 cell generation
For the depletion of ESRRA in HT-29 cells, oligos were synthesized and inserted into the px330-puro vector (kind gift from Dr. Todd Macfarlan, NICHD, NIH, USA) through standard protocol to generate gRNA with hCas9 protein. gRNA sequences were designed using the open access software provided at http://crispr.mit.edu/. gRNA sequences were as follows: ESRRA – seq GCAACTAGTGCGGCGGCTGC and transfected into HT-29 cells using Lipofectamine 2000 reagent according to the manufacturer’s instructions (Invitrogen). After 24 h cells were exposed with 1 μg/ml puromycin for two days, and clones propagated from single cells were picked out. The depletion of target genes was confirmed by western analysis.
Generation of retroviruses encoding tandem-tagged mCherry-EGFP-LC3B for autophgic flux analysis
The production of a tandem LC3B retroviral vector (mCherry-EGFP-LC3B) for the measurement of autophagic flux was performed as described previously [Citation83]. Human Phoenix AMPHO cells were seeded at 70% confluence into a 6-well plate and transfected with 1 μg of pBABE-puro mCherry-EGFP-LC3B (Addgene, 22418; deposited by Jayanta Debnath), 0.75 μg of pCL-Eco (Addgene, 12371; deposited by Inder Verma), and 0.25 μg of pDM2.G (Addgene, 12259; deposited by Didier Trono) using Lipofectamine 2000 for 18 h. The transfected cell culture medium was removed and replaced with fresh medium. Retrovirus-containing medium was harvested at 60 h post-transfection and filtered through a 0.45 μm syringe filter. WT and ESRRA KO HT-29 cells were transduced with mCherry-EGFP-LC3B retrovirus for 24 h. The transduced cells on coverslips were washed twice with PBS and fixed with 4% paraformaldehyde for 15 min. After mounting, fluorescence images were acquired using a confocal laser-scanning microscope. To analyze endogenous autophgic flux, the ImageJ software was used. Slides were assayed in triplicate, and at least 200 cells per well were counted.
Flow cytometry
WT and ESRRA KO HT-29 cells were incubated with 25 nM MitoTracker Green FM (Invitrogen, M7514) and 25 nM MitoTracker Deep Red FM (Invitrogen, M22426) at 37°C. After 20 min, cells were washed with PBS and measured using FACSCanto II flow cytometer and analyzed using the FlowJo software. The percentage and mean fluorescence intensity level of the mitochondrial mass were calculated for each sample. WT and ESRRA KO HT-29 cells were incubated with 100 nM tetramethylrhodamine,ethyl ester, perchlorate (TMRE; Invitrogen, T669) at 37°C in the dark. After 20 min, the dye intensity was measured by flow cytometry using the FL2 channel (582 nm). Data were analyzed using the Flow Jo software.
16S rRNA gene-based community analysis
Fecal samples were collected before and after 4 days of DSS treatment from Esrra+/+ and esrra−/- mice. Bacterial genomic DNA was extracted from a fecal sample using the QIAamp DNA Stool Mini Kit (Qiagen, 51604) [Citation21]. The V3-V4 hyper variable regions of 16S rRNA gene were amplified by polymerase chain reaction (PCR) using forward 5ʹ-TCG-TCG-GCA-GCG-TCA-GAT-GTG-TAT-AAG-AGA-CAG-CCT-ACG-GGN-GGC-WGC-AG-3ʹ and the reverse primer 5ʹ- GTC-TCG-TGG-GCT-CGG-AGA-TGT-GTA-TAA-GAG-ACA-GGA-CTA-CHV-GGG-TAT-CTA-ATC-C-3ʹ. The PCR was performed in a C1000 thermal cycler (Bio-Rad) and PCR conditions were as follows: initial denaturation at 95°C for 3 min; followed by repeated 24 cycles of denaturation at 95°C for 30 s, annealing at 55°C for 30 s and extension at 72°C for 30 s; and a final extension step at 72°C for 5 min. Three PCR reactions with the same template were pooled and purified using the QIAquick PCR purification kit (Qiagen, 28106). Purified amplicons were calculated to equimolar amounts and sequencing libraries were prepared and sequenced by Macrogen (Seoul, Korea).
Sequence processing and analysis
Paired-end reads were joined and quality-filtered using the QIIME 1.9.1 software. Chimeric sequences were excluded from the quality-filtered sequence sets using USEARCH v6.1.544 software. Operational taxonomic units (OTUs) were clustered using the UCLUST ref within QIIME 1.9.1 software at 97% sequence similarity. The OTUs identified as a singleton, found in only single sample or unassigned into a specific bacterial phylum were excluded from further analyses. Taxonomic assignment was performed in the Ribosomal Database Project (RDP) [Citation84] v11.5 via RDP classifier [Citation85] with a minimum confidence at 70%. The alpha diversity of each sample was calculated with Chao1 index, an estimator of richness; the Shannon diversity index, which integrates OTU richness and abundance into a single evenness value; the number of observed OTUs; and the phylogenetic diversity whole tree, which is based on a phylogenetic tree and adds up all the branch lengths as a measure of diversity through QIIME 1.9.1 software. The beta diversity was determined based on unweighted UniFrac distance and weighted UniFrac distance by principal coordinate analysis (PCoA). The linear discriminant analysis (LDA) effect size (LEfSe) was used to identify genus level bacterial taxa discriminating the Esrra+/+ and esrra−/- mice.
Bioinformatic analysis in patients
Analysis in human IBD datasets was carried out essentially as previously described [Citation86]. The raw data can be downloaded as GSE9452 and GSE11223. The ESRRA expression was derived from GSE9452 and GSE11223 in order to compare UC patient group with healthy group.
To compare univariate differential expression in each data set, we analyzed RNA data using the Wilcoxon-Mann-Whitney test with Benjamini-Hochberg FDR correction (P < 0.05, q < 0.25). Pathway analysis was performed on the IBD datasets (GSE11223) using GSEA. GSEA was performed with weighted log2 ratio ranking and 1000 gene set permutations using the REACTOME_AUTOPHAGY, KEGG_TIGHT_JUNCTION, REACTOME_ MITOCHONDRIAL_BIOGENESIS, HALLMARK_INFLAMMATORY_RESPONSE, HALLMARK_IL6_JAK_STAT3_SIGNALING and HALLMARK_TNFA_SIGNALING_VIA_
NFKB from MSigDB.
Statistical analysis
Statistical analysis was performed in Prism (GraphPad Software, v8.0). Data with a p-value less than 0.05 were considered significant. Data are presented as means ± SEM (standard error of the mean). Normality was assessed using D’Agostino and Pearson omnibus normality test, and data were analyzed using two-tailed Student’s t test or non-parametric tests were used. In non-parametric tests, two conditions were compared using Mann-Whitney U-Test and three or more conditions using one-way ANOVA with Dunn’s multiple comparison test when appropriate. Two-way ANOVA with Bonferroni’s test was used to compare the data from each esrra−/− condition with the corresponding Esrra+/+. Elimination of outliners for the relative abundance comparison of bacterial genera, the method of ROUT (robust regression and outlier removal) [Citation87] was used with Q coefficient value set at 1% (GraphPad Prism v8.0). The log-rank (Mantel-Cox) test was used for survival studies.
Supplemental Material
Download Zip (3.3 MB)Acknowledgments
We thank to Dr. V. Giguère (McGill University; Montréal, Canada) for kind support of esrra−/− mice and valuable discussions; Dr. C.-H. Lee (KRIBB, Korea) for kind support of Vil1/villin-Cre mice; Dr. H.-W. Suhr, C.-R. Park, S.-M. Jeon (Chungnam National University) for excellent technical assistance; Dr. T. Macfarlan (NIH, USA) and Dr. S. J. Moon (Yonsei University College of Medicine) for kind support of materials; Dr. H.-S. Lee (Chungnam National University Hospital) for helpful discussions; and E.-K. Jo’s lab members for their helpful discussions.
Disclosure statement
The authors declare no competing interests.
Supplementary material
Supplemental data for this article can be accessed here.
Additional information
Funding
Related Research Data
References
- Giguere V, Yang N, Segui P, et al. Identification of a new class of steroid hormone receptors. Nature. 1988;331(6151):91–94.
- To GV. ERR in the estrogen pathway. Trends Endocrinol Metab. 2002;13(5):220–225.
- Horard B, Vanacker JM. Estrogen receptor-related receptors: orphan receptors desperately seeking a ligand. J Mol Endocrinol. 2003;31(3):349–357.
- Giguere V. Transcriptional control of energy homeostasis by the estrogen-related receptors. Endocr Rev. 2008;29(6):677–696.
- Bardet PL, Laudet V, Vanacker JM. Studying non-mammalian models? Not a fool’s ERRand! Trends Endocrinol Metab. 2006;17(4):166–171.
- Xia H, Dufour CR, Giguere V. ERRalpha as a Bridge Between Transcription and Function: role in Liver Metabolism and Disease. Front Endocrinol. (Lausanne) 2019;10:206.
- Huss JM, Garbacz WG, Xie W. Constitutive activities of estrogen-related receptors: transcriptional regulation of metabolism by the ERR pathways in health and disease. Biochim Biophys Acta. 2015;1852(9):1912–1927.
- Kim SY, Yang CS, Lee HM, et al. ESRRA (estrogen-related receptor alpha) is a key coordinator of transcriptional and post-translational activation of autophagy to promote innate host defense. Autophagy. 2018;14(1):152–168.
- Kim DS, Kwon JE, Lee SH, et al. Attenuation of Rheumatoid Inflammation by Sodium Butyrate Through Reciprocal Targeting of HDAC2 in Osteoclasts and HDAC8 in T Cells. Front Immunol. 2018;9:1525.
- He X, Ma S, Tian Y, et al. ERRalpha negatively regulates type I interferon induction by inhibiting TBK1-IRF3 interaction. PLoS Pathog. 2017;13(6):e1006347.
- Sonoda J, Laganiere J, Mehl IR, et al. Nuclear receptor ERR alpha and coactivator PGC-1 beta are effectors of IFN-gamma-induced host defense. Genes Dev. 2007;21(15):1909–1920.
- Ke PSB, Xu ZQ1, Chen XW1, et al. Intestinal Autophagy and Its Pharmacological Control in Inflammatory Bowel Disease. Front Immunol. 2017;7:695.
- G Tz M, Sipos F. Interplay of autophagy and innate immunity in Crohn’s disease: a key immunobiologic feature. World J Gastroenterol. 2013;19(28):4447–4454.
- T Nl F, Adolph T, Blumberg RS, et al. Crohn’s disease: NOD2, autophagy and ER stress converge. Gut. 2011;60(11):1580–1588.
- Williams MA, O’Callaghan A, Corr SCIL. 33 and IL-18 in Inflammatory Bowel Disease Etiology and Microbial Interactions. Front Immunol. 2019;10:1091.
- Richard ML, Sokol H. The gut mycobiota: insights into analysis, environmental interactions and role in gastrointestinal diseases. Nat Rev Gastroenterol Hepatol. 2019;16(6):331–345.
- Suh HW, Kim JK, Kim TS, et al. New Insights into Vitamin D and Autophagy in Inflammatory Bowel Diseases. Curr Med Chem. 2017;24(9):898–910.
- Iida T, Onodera K, Nakase H. Role of autophagy in the pathogenesis of inflammatory bowel disease. World J Gastroenterol. 2017;23(11):1944–1953.
- Novak EA, Mollen KP. Mitochondrial dysfunction in inflammatory bowel disease. Front Cell Dev Biol. 2015;3:62.
- Yu T, Guo F, Yu Y, et al. Fusobacterium nucleatum Promotes Chemoresistance to Colorectal Cancer by Modulating Autophagy. Cell. 2017;170(3):548–563 e16.
- Chu H, Khosravi A, Kusumawardhani IP, et al. Gene-microbiota interactions contribute to the pathogenesis of inflammatory bowel disease. Science. 2016;352(6289):1116–1120.
- Modica S, Gofflot F, Murzilli S, et al. The intestinal nuclear receptor signature with epithelial localization patterns and expression modulation in tumors. Gastroenterology. 2010;138(2):636–648. 648 e1–12
- Boismenu R, Chen Y. Insights from mouse models of colitis. J Leukoc Biol. 2000;67(3):267–278.
- Deguchi Y, Andoh A, Yagi Y, et al. The S1P receptor modulator FTY720 prevents the development of experimental colitis in mice. Oncol Rep. 2006;16(4):699–703.
- Sladek R, Beatty B, Squire J, et al. Chromosomal mapping of the human and murine orphan receptors ERRalpha (ESRRA) and ERRbeta (ESRRB) and identification of a novel human ERRalpha-related pseudogene. Genomics. 1997;45(2):320–326.
- Li F, Zhu YT. HGF-activated colonic fibroblasts mediates carcinogenesis of colonic epithelial cancer cells via PKC-cMET-ERK1/2-COX-2 signaling. Cell Signal. 2015;27(4):860–866.
- Kim S, Eun HS, Jo EK. Roles of Autophagy-Related Genes in the Pathogenesis of Inflammatory Bowel Disease. Cells. 2019;8(1):1.
- Palmieri M, Impey S, Kang H, et al. Characterization of the CLEAR network reveals an integrated control of cellular clearance pathways. Hum Mol Genet. 2011;20(19):3852–3866.
- Pavel M, Renna M, Park SJ, et al. Contact inhibition controls cell survival and proliferation via YAP/TAZ-autophagy axis. Nat Commun. 2018;9(1):2961.
- Scarpulla RC, Vega RB, Kelly DP. Transcriptional integration of mitochondrial biogenesis. Trends Endocrinol Metab. 2012;23(9):459–466.
- Salatino S, Kupr B, Baresic M, et al. The Genomic Context and Corecruitment of SP1 Affect ERRalpha Coactivation by PGC-1alpha in Muscle Cells. Mol Endocrinol. 2016;30(7):809–825.
- Willy PJ, Murray IR, Qian J, et al. Regulation of PPARgamma coactivator 1alpha (PGC-1alpha) signaling by an estrogen-related receptor alpha (ERRalpha) ligand. Proc Natl Acad Sci U S A. 2004;101(24):8912–8917.
- Sun X, Sun L, Zhao Y, et al. MAVS maintains mitochondrial homeostasis via autophagy. Cell Discov. 2016;2:16024.
- Eichele DD, Kharbanda KK. Dextran sodium sulfate colitis murine model: an indispensable tool for advancing our understanding of inflammatory bowel diseases pathogenesis. World J Gastroenterol. 2017;23(33):6016.
- De Fazio L, Cavazza E, Spisni E, et al. Longitudinal analysis of inflammation and microbiota dynamics in a model of mild chronic dextran sulfate sodium-induced colitis in mice. World J Gastroenterol. 2014;20(8):2051.
- Schwab C, Berry D, Rauch I, et al. Longitudinal study of murine microbiota activity and interactions with the host during acute inflammation and recovery. Isme J. 2014;8(5):1101–1114.
- Parada Venegas D, De la Fuente MK, Landskron G, et al. Short Chain Fatty Acids (SCFAs)-Mediated Gut Epithelial and Immune Regulation and Its Relevance for Inflammatory Bowel Diseases. Front Immunol. 2019;10:277.
- Basso PJ, Camara NOS, Microbial-Based S-CH. Therapies in the Treatment of Inflammatory Bowel Disease - An Overview of Human Studies. Front Pharmacol. 2018;9:1571.
- Fritz T, Niederreiter L, Adolph T, et al. Crohn’s disease: NOD2, autophagy and ER stress converge. Gut. 2011;60(11):1580–1588.
- Yuk JM, Kim TS, Kim SY, et al. Orphan Nuclear Receptor ERRalpha Controls Macrophage Metabolic Signaling and A20 Expression to Negatively Regulate TLR-Induced Inflammation. Immunity. 2015;43(1):80–91.
- Casaburi I, Chimento A, De Luca A, et al. Cholesterol as an Endogenous ERRalpha Agonist: A New Perspective to Cancer Treatment. Front Endocrinol. (Lausanne). 2018;9:525.
- Mehto S, Jena KK, Nath P, et al. The Crohn’s Disease Risk Factor IRGM Limits NLRP3 Inflammasome Activation by Impeding Its Assembly and by Mediating Its Selective Autophagy. Mol Cell. 2019;73(3):429–445 e7.
- Xia Y, Liu N, Xie X, et al. The macrophage-specific V-ATPase subunit ATP6V0D2 restricts inflammasome activation and bacterial infection by facilitating autophagosome-lysosome fusion. Autophagy. 2019;15(6):960–975.
- Lee HY, Kim J, Quan W, et al. Autophagy deficiency in myeloid cells increases susceptibility to obesity-induced diabetes and experimental colitis. Autophagy. 2016;12(8):1390–1403.
- Murano T, Najibi M, Paulus GLC, et al. Transcription factor TFEB cell-autonomously modulates susceptibility to intestinal epithelial cell injury in vivo. Sci Rep. 2017;7(1):13938.
- Han J, Theiss AL. Stat3: friend or foe in colitis and colitis-associated cancer? Inflamm Bowel Dis. 2014;20(12):2405–2411.
- Xu Y, Shen J, Ran Z. Emerging views of mitophagy in immunity and autoimmune diseases. Autophagy. 2020;16(1):3–17.
- Haberman Y, Karns R, Dexheimer PJ, et al. Ulcerative colitis mucosal transcriptomes reveal mitochondriopathy and personalized mechanisms underlying disease severity and treatment response. Nat Commun. 2019;10(1):38.
- Boyapati RK, Dorward DA, Tamborska A, et al. Mitochondrial DNA Is a Pro-Inflammatory Damage-Associated Molecular Pattern Released During Active IBD. Inflamm Bowel Dis. 2018;24(10):2113–2122.
- Woo CY, Jang JE, Lee SE, et al. Mitochondrial Dysfunction in Adipocytes as a Primary Cause of Adipose Tissue Inflammation. Diabetes Metab J. 2019;43(3):247–256.
- Li Y, Tinoco R, Elmén L, et al. Gut microbiota dependent anti-tumor immunity restricts melanoma growth in Rnf5−/− mice. Nat Commun. 2019;10(1):1492.
- EJC G, Iljazovic A, Gronow A, et al. Shaping of Intestinal Microbiota in Nlrp6- and Rag2-Deficient Mice Depends on Community Structure. Cell Rep. 2017;21(13):3914–3926.
- Nunberg M, Werbner N, Neuman H, et al. Interleukin 1α-Deficient Mice Have an Altered Gut Microbiota Leading to Protection from Dextran Sodium Sulfate-Induced Colitis. mSystems. 2018;3(3):e00213–17.
- Contijoch EJ, Britton GJ, Yang C, et al. Gut microbiota density influences host physiology and is shaped by host and microbial factors. Elife. 2019;8:e40553.
- Kostic AD, Xavier RJ, Gevers D. The microbiome in inflammatory bowel disease: current status and the future ahead. Gastroenterology. 2014;146(6):1489–1499.
- Arthur JC, Perez-Chanona E, Muhlbauer M, et al. Intestinal inflammation targets cancer-inducing activity of the microbiota. Science. 2012;338(6103):120–123.
- Yang Y, Weng W, Peng J, et al. Fusobacterium nucleatum Increases Proliferation of Colorectal Cancer Cells and Tumor Development in Mice by Activating Toll-Like Receptor 4 Signaling to Nuclear Factor-kappaB, and Up-regulating Expression of MicroRNA-21. Gastroenterology. 2017;152(4):851–866 e24.
- Wu M, Wu Y, Li J, et al. The Dynamic Changes of Gut Microbiota in Muc2 Deficient Mice. Int J Mol Sci. 2018;19:9.
- Tang C, Kakuta S, Shimizu K, et al. Suppression of IL-17F, but not of IL-17A, provides protection against colitis by inducing Treg cells through modification of the intestinal microbiota. Nat Immunol. 2018;19(7):755–765.
- Roy U, EJC G, Iljazovic A, et al. Distinct Microbial Communities Trigger Colitis Development upon Intestinal Barrier Damage via Innate or Adaptive Immune Cells. Cell Rep. 2017;21(4):994–1008.
- Yoshida N, Emoto T, Yamashita T, et al. Bacteroides vulgatus and Bacteroides dorei Reduce Gut Microbial Lipopolysaccharide Production and Inhibit Atherosclerosis. Circulation. 2018;138(22):2486–2498.
- Santoru ML, Piras C, Murgia A, et al. Cross sectional evaluation of the gut-microbiome metabolome axis in an Italian cohort of IBD patients. Sci Rep. 2017;7(1):9523.
- Khan I, Ullah N, Zha L, et al. Alteration of Gut Microbiota in Inflammatory Bowel Disease (IBD): cause or Consequence? IBD Treatment Targeting the Gut Microbiome. Pathogens. 2019;8(3):126.
- Delday M, Mulder I, Logan ET, et al. Bacteroides thetaiotaomicron Ameliorates Colon Inflammation in Preclinical Models of Crohn’s Disease. Inflamm Bowel Dis. 2018;25(1):85–96.
- Neff CP, Rhodes Matthew E, Arnolds Kathleen L, et al. Diverse Intestinal Bacteria Contain Putative Zwitterionic Capsular Polysaccharides with Anti-inflammatory Properties. Cell Host Microbe. 2016;20(4):535–547.
- Waidmann M, Bechtold O, Frick J-S, et al. Bacteroides vulgatus protects against escherichia coli-induced colitis in gnotobiotic interleukin-2-deficient mice. Gastroenterology. 2003;125(1):162–177.
- Aidy SE, Derrien M, Aardema R, et al. Transient inflammatory-like state and microbial dysbiosis are pivotal in establishment of mucosal homeostasis during colonisation of germ-free mice. Benef Microbes. 2014;5(1):67–77.
- Bordon Y. A microbial trigger for colitis. Nat Rev Immunol. 2019;19(6):350–351.
- Berry D, Schwab C, Milinovich G, et al. Phylotype-level 16S rRNA analysis reveals new bacterial indicators of health state in acute murine colitis. Isme J. 2012;6(11):2091–2106.
- Caruso R, Mathes T, Martens EC, et al. A specific gene-microbe interaction drives the development of Crohn’s disease–like colitis in mice. Sci Immunol. 2019;4(34):eaaw 4341.
- Zhang Y, Tian L, Sleiman P, et al. Bayesian analysis of genome-wide inflammatory bowel disease data sets reveals new risk loci. Eur J Hum Genet. 2018;26(2):265–274.
- Anderson CA, Boucher G, Lees CW, et al. Meta-analysis identifies 29 additional ulcerative colitis risk loci, increasing the number of confirmed associations to 47. Nat Genet. 2011;43(3):246–252.
- Zhang Y, Li X, Luo Z, et al. ECM1 is an essential factor for the determination of M1 macrophage polarization in IBD in response to LPS stimulation. Proc Natl Acad Sci U S A. 2020;117(6):3083–3092.
- Liu M, Sun T, Li N, et al. BRG1 attenuates colonic inflammation and tumorigenesis through autophagy-dependent oxidative stress sequestration. Nat Commun. 2019;10(1):4614.
- West NR, Hegazy AN, Owens BMJ, et al. Oncostatin M drives intestinal inflammation and predicts response to tumor necrosis factor-neutralizing therapy in patients with inflammatory bowel disease. Nat Med. 2017;23(5):579–589.
- Planell N, Lozano JJ, Mora-Buch R, et al. Transcriptional analysis of the intestinal mucosa of patients with ulcerative colitis in remission reveals lasting epithelial cell alterations. Gut. 2013;62(7):967–976.
- Angelidou I, Chrysanthopoulou A, Mitsios A, et al. REDD1/Autophagy Pathway Is Associated with Neutrophil-Driven IL-1beta Inflammatory Response in Active Ulcerative Colitis. J Immunol. 2018;200(12):3950–3961.
- Toubai T, Fujiwara H, Rossi C, et al. Host NLRP6 exacerbates graft-versus-host disease independent of gut microbial composition. Nat Microbiol. 2019;4(5):800–812.
- Danese S, Sans M, Spencer DM, et al. Angiogenesis blockade as a new therapeutic approach to experimental colitis. Gut. 2007;56(6):855–862.
- Berg DJ, Davidson N, Kuhn R, et al. Enterocolitis and colon cancer in interleukin-10-deficient mice are associated with aberrant cytokine production and CD4(+) TH1-like responses. J Clin Invest. 1996;98(4):1010–1020.
- Kim JK, Lee HM, Park KS, et al. MIR144* inhibits antimicrobial responses against Mycobacterium tuberculosis in human monocytes and macrophages by targeting the autophagy protein DRAM2. Autophagy. 2017;13(2):423–441.
- Gupta J, Nebreda AR. Analysis of intestinal permeability in mice. Bio-protocol. 2014;4(22):e1289.
- Kim JK, Kim YS, Lee HM, et al. GABAergic signaling linked to autophagy enhances host protection against intracellular bacterial infections. Nat Commun. 2018;9(1):4184.
- Cole JR, Wang Q, Fish JA, et al. Ribosomal Database Project: data and tools for high throughput rRNA analysis. Nucleic Acids Res. 2013;42(D1):D633–D642.
- Wang Q, Garrity GM, Tiedje JM, et al. Naïve Bayesian Classifier for Rapid Assignment of rRNA Sequences into the New Bacterial Taxonomy. Appl Environ Microbiol. 2007;73(16):5261–5267.
- Ma X, Sun Q, Sun X, et al. Activation of GABAA Receptors in Colon Epithelium Exacerbates Acute Colitis. Front Immunol. 2018;9:987.
- Motulsky HJ, Brown RE. Detecting outliers when fitting data with nonlinear regression – a new method based on robust nonlinear regression and the false discovery rate. BMC Bioinformatics. 2006;7(1):123.