
ABSTRACT
Stroke is a major public health problem leading to high rates of death and disability worldwide, but no effective pharmacological therapy is currently available except for the use of PLAT (plasminogen activator, tissue). Here we show that PARP14 (poly (ADP-ribose) polymerase family, member 14) level was significantly increased in the peri-infarct zone of photothrombotic stroke (PT) mice. Genetic knockdown and pharmacological inhibition of PARP14 aggravated functional impairment and increased infarct volume in PT mice, while overexpression of PARP14 displayed the opposite effects. Furthermore, PARP14 was abundant in microglia, and downregulation of PARP14 increased post-stroke microglial activation, whereas overexpression of PARP14 alleviated microglial activation, possibly through microglial macroautophagy/autophagy modulation. Mechanistically, overexpression of PARP14 suppressed Lpar5 (lysophosphatidic acid receptor 5) gene transcription to inhibit microglial activation post stroke. Taken together, PARP14 is a stroke-induced signal that restricts microglial activation and promotes functional recovery, and can serve as a novel target to develop new therapeutic agents for stroke. Moreover, these findings may be conducive to proper use of various PARP inhibitors.
Abbreviations: 3-MA: 3-methyladenine; AIF1/Iba-1: allograft inflammatory factor 1; CNS: central nervous system; CQ: chloroquine; DAPI: 4ʹ,6-diamidino-2-phenylindole; DMEM: Dulbecco’s modified Eagle’s medium; DMSO: dimethyl sulfoxide; ELISA: enzyme-linked immunosorbent assay; FBS: fetal bovine serum; GFAP: glial fibrillary acidic protein; IL1B/IL-1β: interleukin 1 beta; IL6/IL-6: interleukin 6; LPAR5: lysophosphatidic acid receptor 5; MAP1LC3B: microtubule-associated protein 1 light chain 3 beta; NOS2/iNOS: nitric oxide synthase 2, inducible; OGD: oxygen glucose deprivation; PAR: polymer of poly (ADP ribose); PARP: poly (ADP-ribose) polymerase family; PBS: phosphate-buffered saline; PLAT/tPA: plasminogen activator, tissue; PT: photothrombotic stroke; qPCR: quantitative polymerase chain reaction; Rap: rapamycin; RBFOX3/NeuN: RNA binding protein, fox-1 homolog (C. elegans) 3; SQSTM1: sequestosome 1; TNF/TNF-α: tumor necrosis factor
Introduction
Stroke can cause death and disability and is a global burden to patients and society. Currently, thrombolysis with PLAT (plasminogen activator, tissue) remains the only Food and Drug Administration-approved medication for acute ischemic stroke treatment [Citation1]. Unfortunately, due to its narrow therapeutic time window and side effects, PLAT is applied on <5% of acute ischemic stroke patients [Citation2]. In the past few decades, researchers have focused on studying neuroprotection to rescue post-stroke neuronal damage, but all of the derived candidate agents failed to show significant benefits in clinical trials despite providing efficacy in experimental animal models. Rather than targeting mechanisms that prevent only neurons, we need to engage other types of cells, such as astrocytes, microglia, and endothelial cells, for therapeutic intervention [Citation3].
Microglia function as the primary regulators of inflammatory responses in the central nervous system (CNS) and interact with numerous other cell types [Citation4]. Microglia are essential to maintaining homeostasis in the CNS and work during brain development and disease [Citation5]. After cerebral ischemia, microglia are activated, migrate toward the ischemic area, remove debris and secrete neurotrophic factors to protect neurons [Citation6]. On the other hand, microglia also produce inflammatory cytokines as well as cytotoxic substances to exacerbate ischemic injury [Citation7]. A better understanding of the mechanisms of microglial function post stroke may facilitate the development of therapies to promote recovery.
PARPs (Poly (ADP-ribose) polymerases) modify target proteins with ADP-ribose by using nicotinamide adenine dinucleotide as a substrate [Citation8], and contribute to various signaling pathways linked to DNA repair [Citation9], transcriptional regulation [Citation10], RNA and protein abundance [Citation11], cell differentiation [Citation12], and inflammation [Citation13]. A variety of PARP inhibitors have been developed for cancer therapy over the past decades, and several of them have been approved by the Food and Drug Administration [Citation14]. Some PARP inhibitors may also benefit stroke outcome [Citation13]. However, the PARP superfamily comprises 17 members with different structures and functions in the cell [Citation15]. While extensive structural and functional studies have been undertaken on PARP1 and PARP2, which are the major targets of PARP inhibitors, the biology of other members is less understood.
In this study, we aim to investigate which member of the PARP superfamily functions after stroke. Our results point to PARP14 as the likely candidate. PARP14 conducts mono-ADP-ribosylation on target proteins and is the largest member in the PARP superfamily [Citation11]. The present study revealed that PARP14 was upregulated in the peri-infarct zone of the ischemic cortex and that genetic knockdown and pharmacological inhibition of PARP14 unexpectedly worsened functional impairment post stroke, while overexpression of PARP14 did the opposite. Because PARP14 was widely expressed in microglia and pharmacological inhibition of PARP14 promoted post-stroke inflammatory activation, we explored whether PARP14 is implicated in the pathological process of ischemia-induced microglial activation and found that PARP14 suppressed microglial activation by inducing microglial autophagy. RNA sequencing revealed increased expression of Lpar5 (lysophosphatidic acid receptor 5) mRNA in microglia after oxygen glucose deprivation (OGD) treatment, which could be reversed by PARP14 overexpression. Knockdown of Lpar5 mRNA alleviated OGD-induced microglial activation. These findings advanced our understanding of the potential of PARP14 as a therapeutic target following stroke.
Results
PARP14 is upregulated in the peri-infarct zone after stroke
ADP-ribosylation is a universal post-translational modification and controls multiple cellular processes such as DNA repair, chromatin plasticity, transcriptional regulation, and cell differentiation [Citation11,Citation16]. To investigate the change of ADP-ribosylation after stroke, we produced a PT mice model and measured the levels of polymers of poly (ADP ribose) (PAR) at day 1, 3, 7, and 14 after surgery in the peri-infarct cortex. Ischemia caused a significant increase in protein ADP-ribosylation ().
Figure 1. PARP14 is upregulated in the peri-infarct area after PT. (A-B) Representative immunoblots (A) and bar graph (B) showing western blot analysis of PAR levels in the peri-infarct cortex at day 1, 3, 7, and 14 after stroke. n = 4 animals/group. **P < 0.01 and ***P < 0.001 versus the Sham group using one-way ANOVA followed by the Holm-Sidak test. (C) qPCR analysis showing mRNA expression of each member of the PARP superfamily in the peri-infarct cortex at day 1, 3, 7, and 14 after stroke. n = 4 animals for the Sham group and n = 5 for the other groups. (D) Representative immunoblots and bar graph showing western blot analysis of PARP14 levels in the peri-infarct cortex at day 1, 3, 7, and 14 after stroke. n = 6 animals/group. *P < 0.05 and **P < 0.01 versus the Sham group using Welch ANOVA followed by Tamhane’s T2 post hoc test. (E) Confocal images showing immunostaining of PARP14 in the peri-infarct cortex at day 3 after stroke
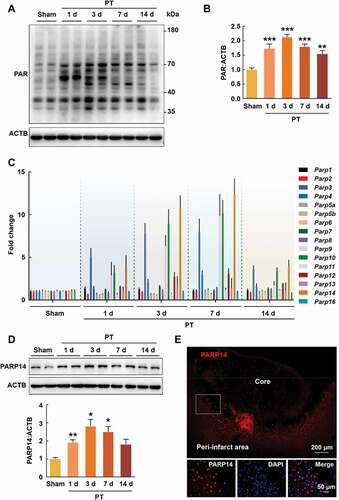
The enzymes capable of synthesizing PAR are PARPs, a superfamily with 17 members [Citation8]. Next, we examined the relative expression of Parps mRNA (excluding Parp15, as no mouse primer for Parp15 mRNA was identified) in the peri-infarct cortex by real-time quantitative polymerase chain reaction (qPCR) at day 1, 3, 7, and 14 after PT and found that the expression of several members significantly increased, among which Parp14 mRNA increased most obviously (). This finding was confirmed by western blot analysis for PARP14 in the peri-infarct cortex at day 1, 3, 7, and 14 after PT (). Immunostaining was performed at day 3 after PT, and an accumulation of PARP14 in the peri-infarct cortex was also observed (). These findings suggest that PARP14 in the peri-infarct zone may be involved in the pathological process after stroke.
Genetic knockdown and pharmacological inhibition of PARP14 exacerbate post-stoke functional impairment
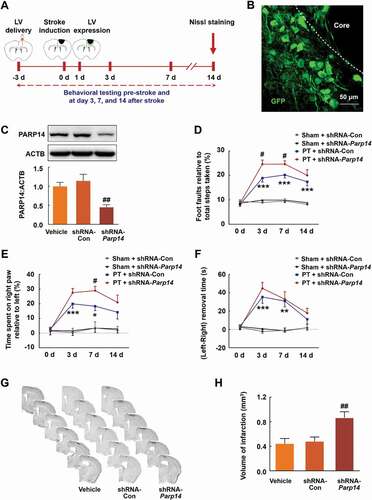
To investigate the role of PARP14 after stroke, we generated lentiviral vectors containing Parp14 shRNA (shRNA-Parp14) or control shRNA (shRNA-Con). Animals were injected with shRNA-Parp14 or shRNA-Con into the prospective stroke site 3 days prior to stroke (). This timing of viral injection allows lentiviruses to express from day 1 after stroke (). The efficacy of lentivirus transduction was examined by western blot (). Sensorimotor functions were tested pre-stroke and at day 3, 7, and 14 after stroke (). Ischemia significantly increased foot faults in the grid-walking task, forelimb asymmetry scores in the cylinder task, and removal time in the adhesive removal test, compared with sham, suggesting impaired sensorimotor functions. Unexpectedly, treatment with shRNA-Parp14 significantly aggravated the ischemic functional impairment (). Moreover, knockdown of PARP14 significantly increased brain infarct volume measured 14 days after stroke ().
Figure 2. Knockdown of PARP14 after PT aggravates functional deficiency. (A) Schematic of experimental timeline. Lentivirus (LV; shRNA-Parp14 or shRNA-Con) was injected into the prospective stroke site in the cortex at day 3 prior to stroke. Behavioral performances were examined at baseline and day 3, 7, and 14 after stroke. (B) The expression of shRNA-Parp14 (GFP) at day 1 after stroke. Scale bar: 50 μm. (C) PARP14 level in the peri-infarct cortex at day 4 after shRNA-Con or shRNA-Parp14 infection. n = 6 animals/group. ##P < 0.01 versus the shRNA-Con group using one-way ANOVA followed by the Holm-Sidak test. (D-F) Functional recovery in mice was assessed via foot faults of the left forelimb in the grid-walking task (D), forelimb symmetry in the cylinder task (E), and (Left-Right) removal time in the adhesive removal test (F) at baseline and day 3, 7, and 14 after stroke. n = 10 animals for the Sham + shRNA-Con and Sham + shRNA-Parp14 groups, and n = 14 animals for the PT + shRNA-Con and PT + shRNA-Parp14 groups. *P < 0.05, **P < 0.01, and ***P < 0.001 versus the Sham + shRNA-Con group, and #P < 0.05 versus the PT + shRNA-Con group, using two-way repeated measures ANOVA followed by the Holm-Sidak post hoc multiple comparison test. (G) Representative Nissl-stained brain sections at day 14 after stroke from Vehicle, PT + shRNA-Con, and PT + shRNA-Parp14 groups, respectively. (H) Bar graph showing infarct volume from Vehicle, PT + shRNA-Con, and PT + shRNA-Parp14 groups, respectively. n = 8 animals/group. ##P < 0.01 versus the shRNA-Con group using one-way ANOVA followed by the Holm-Sidak test
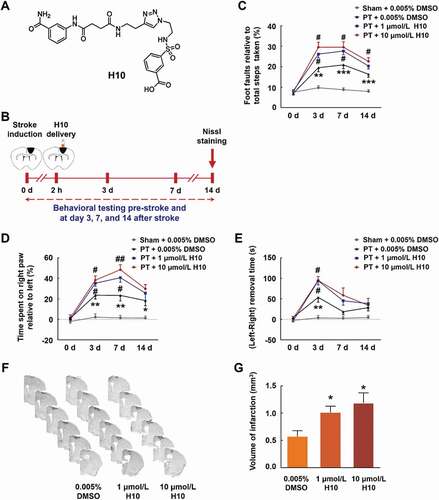
H10 is a potent PARP14 inhibitor (IC50 = 490 nmol/L) with greater than 20-fold selectivity for PARP14 over PARP1 () [Citation17]. We infused H10 (1 μmol/L or 10 μmol/L) into the peri-infarct cortex of mice 2 h after PT, tested sensorimotor functions pre-stroke and at day 3, 7, and 14 after stroke, and measured the infarct volume at day 14 after stroke (). Administration of both 1 μmol/L H10 and 10 μmol/L H10 significantly worsened stroke-induced functional impairment () and increased brain infarct volume (). Therefore, the 1 μmol/L dose was applied in all the following experiments.
Figure 3. Inhibiting PARP14 after PT worsens functional impairment. (A) Structure of the PARP14 inhibitor H10. (B) Schematic of experimental timeline. H10 was injected into the peri-infarct cortex 2 h after stroke. Behavioral performances were examined at baseline and day 3, 7, and 14 after stroke. (C-E) Functional recovery in mice was assessed via foot faults of the left forelimb in the grid-walking task (C), forelimb symmetry in the cylinder task (D), and (Left-Right) removal time in the adhesive removal test (E) at baseline and day 3, 7, and 14 after stroke. n = 10, 11, 12, and 12 animals for the Sham + 0.005% dimethyl sulfoxide (DMSO), PT + 0.005% DMSO, PT + 1 μmol/L H10, and PT + 10 μmol/L H10 groups, respectively. *P < 0.05, **P < 0.01, and ***P < 0.001 versus the Sham + 0.005% DMSO group, and #P < 0.05 and ##P < 0.01 versus the PT + 0.005% DMSO group, using two-way repeated measures ANOVA followed by the Holm-Sidak post hoc multiple comparison test. (F) Representative Nissl-stained brain sections at day 14 after stroke from PT + 0.005% DMSO, PT + 1 μmol/L H10, and PT + 10 μmol/L H10 groups, respectively. (G) Bar graph showing infarct volume from PT + 0.005% DMSO, PT + 1 μmol/L H10, and PT + 10 μmol/L H10 groups, respectively. n = 6 animals/group. *P < 0.05 versus the PT + 0.005% DMSO group using one-way ANOVA followed by the Holm-Sidak test
Overexpression of PARP14 ameliorates post-stoke functional impairment
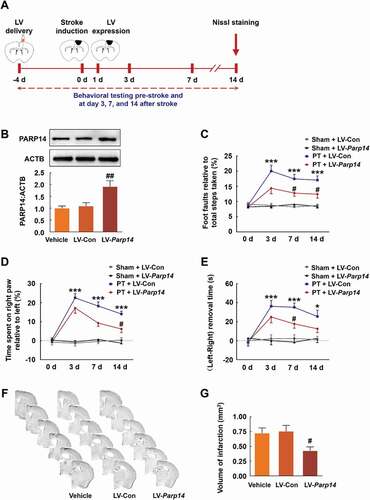
To further confirm the role of PARP14 on stroke recovery, we generated a lentiviral vector selectively expressing PARP14 (LV-Parp14) and its control (LV-Con). Mice were injected with LV-Parp14 or LV-Con into the prospective stroke site 4 days prior to stroke (), which allows lentiviruses to express from day 1 after stroke (Figure S1). The efficacy of lentivirus transduction was examined by western blot (). Sensorimotor functions were tested pre-stroke and at day 3, 7, and 14 after stroke, and infarct volume was measured at day 14 after stroke (). Administration of LV-Parp14 significantly ameliorated stroke-induced functional impairment () and reduced brain infarct volume ().
Figure 4. Overexpression of PARP14 after PT ameliorates functional deficiency. (A) Schematic of experimental timeline. Lentivirus (LV; LV-Parp14 or LV-Con) was injected into the prospective stroke site in the cortex 4 days prior to stroke. Behavioral performances were examined at baseline and day 3, 7, and 14 after stroke. (B) PARP14 level in the peri-infarct cortex at day 5 after LV-Con or LV-Parp14 infection. n = 6 animals/group. ##P < 0.01 versus the LV-Con group using one-way ANOVA followed by the Holm-Sidak test. (C-E) Functional recovery in mice was assessed via foot faults of the left forelimb in the grid-walking task (C), forelimb symmetry in the cylinder task (D), and (Left-Right) removal time in the adhesive removal test (E) at baseline and day 3, 7, and 14 after stroke. n = 10 animals for the Sham + LV-Con and Sham + LV-Parp14 groups, and n = 13 animals for the PT + LV-Con and PT + LV-Parp14 groups. *P < 0.05 and ***P < 0.001 versus the Sham + LV-Con group, and #P < 0.05 versus the PT + LV-Con group, using two-way repeated measures ANOVA followed by the Holm-Sidak post hoc multiple comparison test. (F) Representative Nissl-stained brain sections at day 14 after stroke from Vehicle, PT + LV-Con and PT + LV-Parp14 groups, respectively. (G) Bar graph showing infarct volume from Vehicle, PT + LV-Con and PT + LV-Parp14 groups, respectively. n = 8 animals/group. #P < 0.05 versus the LV-Con group using one-way ANOVA followed by the Holm-Sidak test
Taken together, our data suggest that both genetic knockdown and pharmacological inhibition of PARP14 worsen stroke-induced functional impairment, whereas overexpression of PARP14 benefits stroke recovery.
Pharmacological inhibition of PARP14 facilitates post-stroke inflammatory activation in the peri-infarct cortex
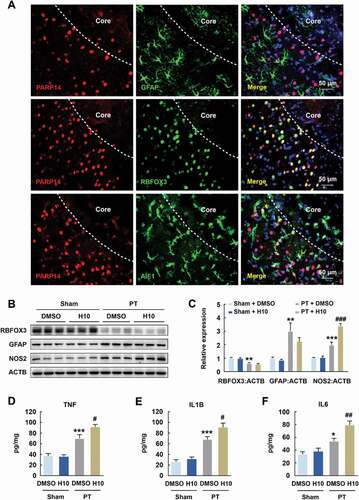
Since PARP14 modulates functional outcome after stroke, we sought to explore the underlying mechanisms. First, we examined the distribution of PARP14 in different types of CNS cell including astrocytes, neurons, and microglia, through immunofluorescence analyses in the peri-infarct cortex after PT. PARP14 was undetectable in astrocytes but was abundant in neurons and microglia (). Next, to determine which cell type is altered after PARP14 inhibition, we conducted H10 treatment after PT. Peri-infarct tissues surrounding the infarct core were rapidly dissected at day 3 after PT surgery for western blot and enzyme-linked immunosorbent assay (ELISA). Western blot revealed no significant change in RBFOX3/NeuN (RNA binding protein, fox-1 homolog (C. elegans) 3; neuron marker) and GFAP (glial fibrillary acidic protein; astrocyte marker) expression but significantly increased NOS2/iNOS (nitric oxide synthase 2, inducible) expression by H10 treatment (), indicating increased inflammatory activation (most probably microglial activation) after PARP14 inhibition post stroke. Further evidences that H10 treatment elevated the levels of cytokines, namely TNF/TNF-α (tumor necrosis factor), IL1B/IL-1β (interleukin 1 beta), and IL6/IL-6 (interleukin 6), in the peri-infarct area of PT mice () confirmed that inhibition of PARP14 exacerbated neuroinflammation. All these data demonstrate that inhibition of PARP14 facilitates post-stroke inflammatory activation in the peri-infarct cortex.
Figure 5. Inhibition of PARP14 after PT increases inflammatory response in the peri-infarct area. (A) Colocalization of GFAP, RBFOX3, or AIF1 (green) with PARP14 (red) in the peri-infarct cortex of mice. Scale bar: 50 μm. (B-C) Representative immunoblots (B) and bar graph (C) showing western blot analyses of RBFOX3, GFAP, and NOS2 expression in the peri-infarct cortex of mice at day 3 after PT under 1 μmol/L H10 treatment. n = 6 animals/group. **P < 0.01 and ***P < 0.001 versus the Sham + DMSO group, and ###P < 0.001 versus the PT + DMSO group, using two-way ANOVA followed by the Holm-Sidak test. (D-F) ELISA of the expression of TNF (D), IL1B (E), and IL6 (F) in the peri-infarct cortex of mice at day 3 after PT under 1 μmol/L H10 treatment. n = 7 animals/group. *P < 0.05 and ***P < 0.001 versus the Sham + DMSO group, and #P < 0.05 and ##P < 0.01 versus the PT + DMSO group, using two-way ANOVA followed by the Holm-Sidak test
PARP14 modulates post-stroke microglial activation
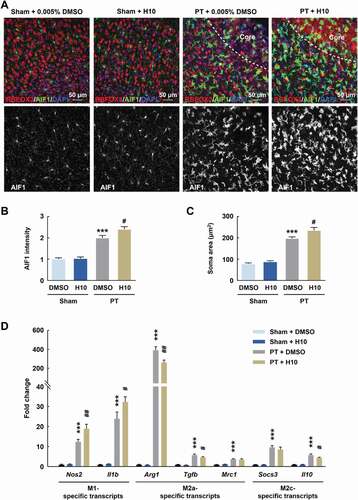
Because microglia are the primary regulators of inflammatory responses in the CNS [Citation4], we examined post-stroke microglial activation after H10 treatment in the peri-infarct zone. Immunostaining revealed enhanced microglial activation by showing significant increases in intensity and soma size of AIF1/Iba-1+ (allograft inflammatory factor 1) cells after H10 treatment post stroke (). Since different phenotypes of microglia are associated with either cytotoxic or neuroprotective effects [Citation18], we next examined the effects of H10 on stage-specific switching of microglia. H10 treatment resulted in significant upregulation of M1 microglia-specific transcripts (Nos2 and Il1b) and downregulation of M2a and M2c microglia-specific transcripts (i.e., downregulation of Arg1, Tgfb, and Il10) in the peri-infarct zone of PT mice ().
Figure 6. Inhibition of PARP14 after PT aggravates microglial activation in the peri-infarct area. (A-C) Representative images (A) and quantitative analyses (B and C) of immunostaining for AIF1 in the peri-infarct cortex of mice at day 3 after PT under 1 μmol/L H10 treatment. n = 6 animals/group. ***P < 0.001 versus the Sham + DMSO group, and #P < 0.05 versus the PT + DMSO group, using two-way ANOVA followed by the Holm-Sidak test. Scale bar: 50 μm. (D) M1-specific transcripts, M2a-specific transcripts, and M2c-specific transcripts in the peri-infarct cortex at day 3 after PT under 1 μmol/L H10 treatment. n = 8 animals for the Sham + DMSO and Sham + H10 groups, and n = 11 animals for the PT + DMSO and PT + H10 groups. ***P < 0.001 versus the Sham + DMSO group, and #P < 0.05 and ##P < 0.01 versus the PT + DMSO group, using two-way ANOVA followed by the Holm-Sidak test
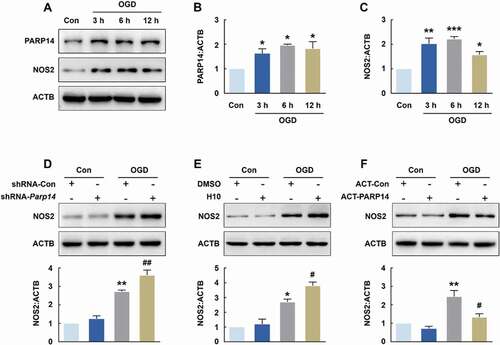
Next, we explored the role of PARP14 in microglial activation in vitro. The expression of PARP14 was significantly increased in both BV-2 cells (Figure S2A and S2B) and primary mouse microglia () treated with OGD, and so was NOS2 expression (Figure S2A and S2C, ). Transduction of cells with shRNA-Parp14 significantly aggravated OGD-induced microglial activation, as determined by the levels of NOS2 in both BV-2 cells (Figure S2D) and primary mouse microglia (). H10 application also significantly increased microglial activation after OGD treatment in both BV-2 cells (Figure S2E) and primary mouse microglia (). In addition, transfecting cells with the PARP14 CRISPR Activation Plasmid (ACT-PARP14, Figure S3) significantly inhibited the increase of NOS2 induced by OGD in both BV-2 cells (Figure S2F) and primary mouse microglia (). Taken together, these data indicate that PARP14 suppresses microglial activation after OGD treatment.
Figure 7. PARP14 modulates microglial activation after OGD. (A-C) Representative immunoblots (A) and bar graphs (B-C) showing western blot analyses of PARP14 (B) and NOS2 (C) levels in primary mouse microglia after OGD treatment for 3, 6, and 12 h. All data were obtained from 3 independent experiments. *P < 0.05, **P < 0.01, and ***P < 0.001 versus the Control group using one-way ANOVA followed by the Holm-Sidak test. (D) Transduction with shRNA-Parp14 increased NOS2 expression induced by OGD in primary mouse microglia. Cells were transduced with shRNA-Con or shRNA-Parp14 for 48 h and then treated with OGD for 6 h. All data were obtained from 3 independent experiments. **P < 0.01 versus the Con + shRNA-Con group, and ##P < 0.01 versus the OGD + shRNA-Con group, using two-way ANOVA followed by the Holm-Sidak test. (E) Treatment with H10 increased NOS2 expression induced by OGD in primary mouse microglia. Cells were treated with H10 or 0.005% DMSO and then subjected to OGD exposure for 6 h. All data were obtained from 3 independent experiments. *P < 0.05 versus the Con + DMSO group, and #P < 0.05 versus the OGD + DMSO group, using two-way ANOVA followed by the Holm-Sidak test. (F) Transfection with ACT-PARP14 attenuated the increased expression of NOS2 induced by OGD in primary mouse microglia. Cells were transfected with ACT-Con or ACT-PARP14 for 24 h and then treated with OGD for 6 h. All data were obtained from 3 independent experiments. **P < 0.01 versus the Con + ACT-Con group, and #P < 0.05 versus the OGD + ACT-Con group, using two-way ANOVA followed by the Holm-Sidak test
PARP14 drives autophagy to inhibit microglial activation post stroke
Autophagy plays an essential role in regulating cellular homeostasis. Recently, it is reported that autophagy might influence microglial activation [Citation19] and participate in the pathogenesis of ischemic stroke [Citation20,Citation21]. Given these and our finding that PARP14 is involved in microglial activation after stroke, we suspected that PARP14 might mediate microglial activation via autophagy. We found that OGD treatment led to an increase in the expression of MAP1LC3B (microtubule-associated protein 1 light chain 3 beta)-II, a general autophagosomal marker, in both BV-2 cells (Figure S4A and S4B) and primary mouse microglia (), suggesting that stroke could promote autophagosome formation. Results obtained from SQSTM1 (sequestosome 1; a receptor protein that links MAP1LC3B with ubiquitin [Citation22]) immunoblots of both BV-2 cells (Figure S4A and S4C) and primary mouse microglia () after OGD treatment supported this conclusion.
Figure 8. PARP14 induces autophagy to inhibit microglial activation after OGD. (A-C) Representative immunoblots (A) and bar graphs (B-C) showing western blot analyses of MAP1LC3B-II (B) and SQSTM1 (C) levels in primary mouse microglia after OGD treatment for 3, 6, and 12 h. All data were obtained from 3 independent experiments. *P < 0.05 and **P < 0.01 versus the Control group using one-way ANOVA followed by the Holm-Sidak test. (D) Transduction with shRNA-Parp14 attenuated the increased expression of MAP1LC3B-II induced by OGD in primary mouse microglia. Cells were transduced with shRNA-Con or shRNA-Parp14 for 48 h and then treated with OGD for 6 h. All data were obtained from 3 independent experiments. **P < 0.01 versus the Con + shRNA-Con group, and #P < 0.05 versus the OGD + shRNA-Con group, using two-way ANOVA followed by the Holm-Sidak test. (E) Transfection with ACT-PARP14 increased the expression of MAP1LC3B-II induced by OGD in primary mouse microglia. Cells were transfected with ACT-Con or ACT-PARP14 for 24 h and then treated with OGD for 6 h. All data were obtained from 3 independent experiments. ***P < 0.001 versus the Con + ACT-Con group, and ##P < 0.01 versus the OGD + ACT-Con group, using two-way ANOVA followed by the Holm-Sidak test. (F-G) PARP14 enhances autophagic flux after OGD. Primary mouse microglia were infected with mRFP-GFP-MAP1LC3B adenovirus and treated with OGD for 6 h. The numbers of yellow puncta and red puncta per cell were counted. All data were obtained from 4 independent experiments. ***P < 0.001 versus the Control group (autolysosome), #P < 0.05 and ###P < 0.001 versus the OGD group (autolysosome), †P < 0.05 versus the OGD group (autophagosome), and $P < 0.05 and $$P < 0.01 versus the OGD + CQ group (autophagosome), using one-way ANOVA followed by the Holm-Sidak test. Scale bar: 5 μm. (H) Pretreatment with Rap (1 μmol/L) for 1 h significantly decreased the expression of NOS2 induced by OGD in primary mouse microglia. All data were obtained from 3 independent experiments. **P < 0.01 versus the Control group, and ##P < 0.01 versus the OGD group, using two-way ANOVA followed by the Holm-Sidak test. (I) Pretreatment with 3-MA (1 mmol/L) for 1 h significantly increased the expression of NOS2 induced by OGD in primary mouse microglia. All data were obtained from 3 independent experiments. **P < 0.01 versus the Control group, and ##P < 0.01 versus the OGD group, using two-way ANOVA followed by the Holm-Sidak test
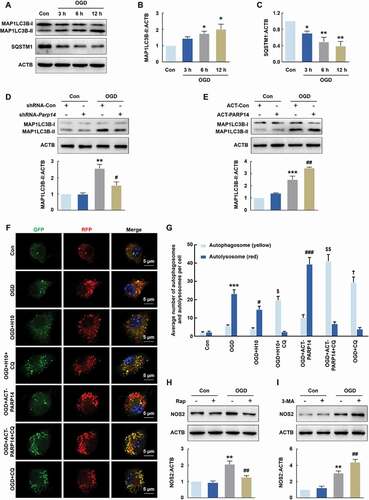
Next, we investigated the effect of shRNA-Parp144 on microglial autophagy. Transducting cells with shRNA-Parp14 significantly inhibited OGD-induced microglial autophagy in both BV-2 cells (Figure S4D) and primary mouse microglia () as determined by western blot analysis of MAP1LC3B-II. Moreover, transfecting cells with ACT-PARP14 increased the levels of MAP1LC3B-II after OGD in both BV-2 cells (Figure S4E) and primary mouse microglia (). Consistent with these findings, the MAP1LC3B immunostaining assay showed that H10 administration reversed the increased number of MAP1LC3B puncta induced by OGD treatment in primary mouse microglia (Figure S5). Similar to the in vitro findings, PT caused a significant increase in the expression of MAP1LC3B-II, which was reversed by shRNA-Parp14 treatment and further increased by LV-Parp14 treatment (Figure S6).
However, increased levels of autophagosomes can signify either an increase of autophagy or a block in downstream lysosomal processing of these autophagosomes. Thus, primary mouse microglia were transduced with tandem fluorescent-mRFP-GFP-MAP1LC3B-adenovirus to assess the effect of PARP14 on autophagic flux in the presence of chloroquine (CQ), a lysosomal inhibitor. GFP fluorescence is quenched by the acidic environment of the lysosome, while RFP fluorescence is relatively stable under acidic condition. Therefore, yellow puncta, reflective of combined GFP and RFP fluorescence, indicates the autophagosomes that have not fused with lysosomes, whereas red puncta (RFP only) stains the autolysosomes. As shown in , OGD treatment significantly increased the number of yellow puncta per cell with a concomitant greater increase in RFP-only puncta in primary mouse microglia. Transfecting cells with ACT-PARP14 significantly increased autophagy flux after OGD, yielding elevated numbers of red puncta, while in contrast, H10 treated cells displayed decreased autophagy flux after OGD with fewer red puncta. CQ inhibited the maturation of autophagy, resulting in predominant autophagosomes (yellow puncta) after OGD in primary mouse microglia. Co-incubation of cells with H10 and CQ led to decreased number of yellow puncta after OGD compared with CQ treatment alone, and transfecting cells with ACT-PARP14 combined with CQ treatment displayed the opposite effects (). We ruled out the possibility that the administration of DMSO or ACT-Con affected autophagy because they did not lead to significant changes in the number of yellow or red puncta (Figure S7). Taken together, PARP14 increased MAP1LC3B-II levels primarily through enhancing autophagic flux rather than blocking lysosomal processing of the autophagosomes.
To further elucidate the role of autophagy in OGD-induced microglial activation, we treated primary mouse microglia with rapamycin (Rap, 1 μmol/L) to induce autophagy: Rap significantly reversed OGD-induced increase in NOS2 level (). Conversely, pretreatment of cells with the autophagy inhibitor 3-methyladenine (3-MA, 1 mmol/L) significantly increased OGD-induced microglial activation (). Together, these findings suggest that PARP14 inhibits microglial activation by promoting autophagy after stroke.
Furthermore, PARP14 inhibition-mediated dysregulated autophagy may happen not only in resident microglia but also neurons as PARP14 expresses in both microglia and neurons post stroke (). H10 application did not significantly change OGD-induced autophagy in primary mouse neurons, ruling out the effect of PARP14 inhibition on neuronal autophagy (Figure S8).
PARP14 inhibits microglial activation by downregulating LPAR5
To explore the mechanism through which PARP14 suppresses microglial activation, we performed RNA sequencing of cell extracts from PARP14-overexpressing primary mouse microglia and controlled primary mouse microglia, treated with or without 6 h OGD, to seek candidate target genes (GEO accession number: GSE152000). At an expression fold change cutoff of 2.0 and P < 0.05, we identified 20 differentially expressed genes not only between the OGD + ACT-Con and Con + ACT-Con groups, but also between the OGD + ACT-PARP14 and OGD + ACT-Con groups (). We then designed primers to empirically confirm the trends of these genes using qPCR analysis and validated 5 of them: Fbxo34, Ing2, Lpar5, Rragd, and Slfn9 (Figure S9, ). Among these genes, Lpar5 is an important mediator of inflammatory responses [Citation23,Citation24] and became the focus of our study, although we cannot rule out the potential function of the other 4 genes.
Figure 9. PARP14 suppresses microglial activation by downregulating LPAR5. (A) Heatmap of transcriptomes depicting differentially expressed genes determined by RNA sequencing in primary mouse microglia among different groups. Expression fold change > 2.0 and P < 0.05 for the OGD + ACT-Con group versus the Con + ACT-Con group and the OGD + ACT-PARP14 group versus the OGD + ACT-Con group. Orange color scale: higher expression. Blue color scale: lower expression. Each column represents one sample. All data were obtained from 2 independent experiments. (B-C) Transfection with ACT-PARP14 reversed the increased levels of Lpar5 mRNA (B) and LPAR5 (C) induced by OGD in primary mouse microglia. Cells were transfected with ACT-Con or ACT-PARP14 for 24 h and then treated with OGD for 6 h. All data were obtained from 4 (B) or 3 (C) independent experiments. **P < 0.01 and ***P < 0.001 versus the Con + ACT-Con group, and ##P < 0.01 and ###P < 0.001 versus the OGD + ACT-Con group, using two-way ANOVA followed by the Holm-Sidak test. (D) Representative immunoblots and bar graph showing western blot analysis of LPAR5 expression in the peri-infarct cortex of mice at day 3 after PT under 1 μmol/L H10 treatment. n = 6 animals/group. ***P < 0.001 versus the Sham + DMSO group, and ###P < 0.001 versus the PT + DMSO group, using two-way ANOVA followed by the Holm-Sidak test. (E) Level of Lpar5 mRNA after siRNA-Lpar5 transduction as measured by qPCR in primary mouse microglia. Cells were transduced with siRNA-Lpar5 for 48 h. All data were obtained from 3 independent experiments. ***P < 0.001 versus the siRNA-Con group. (F) Transduction with siRNA-Lpar5 attenuated the increased expression of NOS2 induced by OGD in primary mouse microglia. Cells were transduced with siRNA-Lpar5 for 48 h and then treated with OGD for 6 h. All data were obtained from 3 independent experiments. **P < 0.01 versus the Con + siRNA-Con group, and #P < 0.05 versus the OGD + siRNA-Con group, using two-way ANOVA followed by the Holm-Sidak test
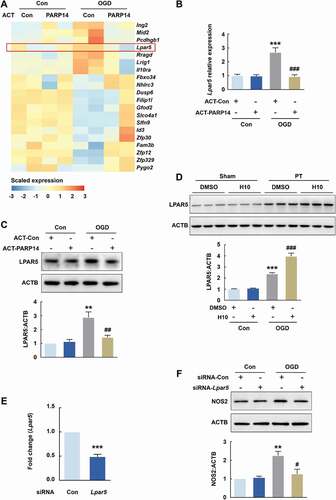
OGD increased the protein level of LPAR5, which was reversed by PARP14 overexpression (), verifying the RNA sequencing results. Consistently, H10 administration further elevated the increased expression of LPAR5 after PT (). To confirm that LPAR5 modulates the expression of NOS2, we transduced primary mouse microglia with Lpar5 siRNA (siRNA-Lpar5). Knockdown of Lpar5 efficiently decreased Lpar5 expression () and significantly reversed OGD-induced increase of NOS2 (). Together, these data demonstrate that overexpression of PARP14 could suppress microglial activation by downregulating LPAR5.
Discussion
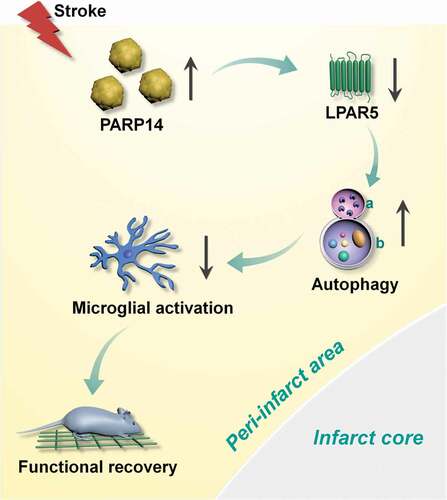
The therapeutic effects of PARP inhibitors have been studied in multiple diseases, including cancer [Citation14], steatohepatitis [Citation25], and stroke [Citation13]. However, there is comparatively less research on the potential benefits of PARPs upon these diseases. Our data show that PARP14 was induced after stroke in mice and drove autophagy to inhibit microglial activation. Downregulation of PARP14 facilitated microglial activation and impaird functional outcome following stroke, whereas overexpression of PARP14 promoted stroke recovery, suggesting that PARP14 is a post-stroke signal that aids functional recovery. Our research further revealed that Lpar5 may be the downstream target gene through which PARP14 suppresses microglial activation ().
Figure 10. Schematic summary. Increased expression of PARP14 post stroke reduces the level of LPAR5 to aid autophagy and inhibit microglial activation, thereby promoting functional recovery. a: lysosome; b: autophagosome
Stroke induces microglial activation, the first step in post-stroke inflammatory responses, followed by infiltration of multiple immune cells including macrophages/monocytes, neutrophils, natural killer cells, and T cells [Citation26]. Activated microglia can evoke the production of a variety of mediators, including NOS2, nitric oxide, and TNF, to exacerbate brain damage [Citation27,Citation28]. Researchers had paid attention to the molecules that elicit microglial activation, such as TNF, but the factor(s) that are triggered by stroke to suppress microglial activation remained largely unknown. The present study successfully demonstrated that stroke-induced increase of PARP14 participates in suppressing microglial activation post stroke.
PARP14, the largest member of PARP family, comprises five domains: macro1, macro2, macro3, WWE (that is, Trp-Trp-Glu), and a catalytic domain [Citation11,Citation29]. We showed that PARP14 modulated microglial activation in vivo. Future studies that target one or more domain(s) of PARP14 are needed to reveal its benefits in post-stroke interventions. Genetic tools, such as cell-type-specific Cre-expressing lentiviruses, are also needed to further dissect the effect of PARP14 in stroke.
Our study demonstrates that PARP14 mediates microglial activation through LPAR5. Lysophosphatidic acid is a small phospholipid that induces downstream signaling by binding to one of the five G protein-coupled receptors (LPAR1-5) [Citation30]. LPAR5 is a 41 kDa protein consisting of 372 amino acids; it is broadly expressed in tissues, including the brain, small intestine, lung, heart, and liver [Citation31,Citation32]. LPAR5 signaling drives MAPK and AKT activation, facilitates pro-inflammatory factor phosphorylation, induces the expression of M1 markers, and enhances microglia’s production of reactive oxygen species and nitric oxide [Citation23]. Moreover, two LPAR5 antagonists reversed lysophosphatidic acid-induced production of pro-inflammatory mediators, namely TNF, IL1B, IL6, CXCL5 (chemokine (C-X-C motif) ligand 5), CXCL10, and CXCL2 [Citation24]. These studies indicate that LPAR5 may play a role in the inflammatory process after stroke. Since PARP14 can acts as a switch that controls STAT6 (signal transducer and activator of transcription 6)-mediated gene transcription [Citation33,Citation34], and can associate with tissue factor mRNA 3ʹ-UTR and decrease tissue factor mRNA stability [Citation35], it may also influence Lpar5 mRNA via a transcriptional or posttranscriptional mechanism, the details of which require further study.
The current study suggests PARP14 may influence stroke-related inflammatory responses by regulating autophagy. Autophagy is an essential homeostatic process that leads to the degradation of cytoplasmic materials including misfolded proteins and defective organelles to adapt to exogenous disruption [Citation36]. Autophagy blocks microglial activation, as established by the finding that BECN1/Beclin1 reduction-mediated impairment of autophagy facilitates microglia’s inflammatory cytokine production [Citation19]. Other studies indicate that autophagy negatively regulates the inflammatory response of microglia post stroke. By driving autophagy, a GSK-3β inhibitor suppresses production of inflammatory cytokines induced by permanent middle cerebral artery occlusion and inhibits the activation of cultured primary microglia [Citation20]. Furthermore, blocking the autophagic flux of BV-2 cells after OGD/R induced M1 microglial phenotype by activating the NFKB/NF-κB pathway and decreasing the activity of the cAMP-response element binding protein [Citation21]. In contrast, a few studies indicate that autophagy facilitates the stroke-induced microglial death or M1 polarization [Citation37,Citation38], indicating that autophagy may have distinct functions dependent on the intensity and duration of different models. In our study, Rap significantly decreased microglial activation, while 3-MA displayed inductive effects, suggesting that OGD-induced autophagy inhibits microglial activation.
The photothrombotic stroke model, which damages and occludes vascular endothelium, leading to focal cortical stroke [Citation39], has the advantages that it can induce a circumscribed cortical lesion at the desired area by using stereotactic coordinates, and is highly reproducible combined with very low mortality [Citation40,Citation41]. This study induced photothrombotic stroke in the fore- and hindlimb somatosensory cortex, and re-mapping of functions in the peri-infarct tissue of this model alters motor and sensory recovery, which makes it a predestined model to study long-term functional outcome [Citation39,Citation42]. Our data from this stroke model supports our initial reasoning and tentative conclusions about the effects of PARP14 on neuroinflammation and functional recovery although only a little ischemic penumbra and small cortical infarction occur in this model. Several modifications of the photothrombotic stroke model have been developed, for example, using a ring flter to imitate the penumbra in the human situation [Citation43], but the correspondence to the human situation is under discussion.
Materials and methods
Animals
All animal procedures were conducted according to protocols approved by the Institutional Animal Care and Use Committee of the Medical School, Southeast University. Adult male (6 to 8-weeks old), C57BL/6 J mice (GemPharmatech, N000013) housed under a constant temperature and 12:12 h light:dark cycles were used. Food and water were provided ad libitum. An experimenter labeled all the animals before allocation. Investigators who were blind to group allocation performed the experiments.
Photothrombotic stroke (PT)
Focal stroke was induced by photothrombosis of cortical microvessels in mice as previously described [Citation39,Citation44]. Briefly, mice under anesthesia with 2% isoflurane were placed in a stereotaxic frame (Stoelting, Wood Dale, Illinois, USA). The skull was exposed by a midline incision of the skin. A fiber optic bundle with a 2-mm-diameter aperture from a cold light source (12,000 lux; World Precision Instruments, Sarasota, Florida, USA) was centered 1.5 mm lateral from the bregma. Rose Bengal (30 mg/kg, i.v.; Sigma Aldrich, 330000), dissolved in saline, was administered. After 5 min, the brain was illuminated for 5 min. Through illumination, Rose Bengal generated singlet oxygen, which damaged and occluded vascular endothelium, leading to focal cortical stroke. Animals were then returned to their cages and monitored until they woke up. Sham mice were administrated with the same dose of Rose Bengal without illumination.
Reagents
H10, a small molecular inhibitor of PARP14, was synthesized in Jiangsu Key Laboratory of Drug Design and Optimization, China Pharmaceutical University. Rapamycin (R0395) and 3-methyladenine (M9281) were purchased from Sigma Aldrich. An adenoviral vector carrying mRFP-GFP-MAP1LC3B was purchased from HanBio (HB-AP2100001).
Lentiviral vector construction and stereotaxic injection
The recombinant lentiviruses, shRNA-Parp14 and shRNA-Con, were constructed and synthesized by GeneChem Co, Ltd (Shanghai, China). The target sequence against mouse Parp14 is as follows: 5ʹ-AGCTCTTGTGCAACCATTATA-3ʹ. The recombinant lentiviruses, LV-Parp14 and LV-Con, were constructed and synthesized by BrainVTA (Wuhan, China). The stereotaxic injection site (from bregma) was as follows: anteroposterior, 0 mm; mediolateral, 1.5 mm; dorsovental, 1.3 mm. After injection, the needle was left in place for 10 min to ensure well distribution of the lentivirus.
Grid-walking task
The grid-walking task was performed using previously described methods [Citation39]. Briefly, a 32 cm × 20 cm elevated grid manufactured with 1.2-cm square wire mesh was used. A camera was placed beneath the grid in order to record the animals’ foot faults. Each mouse was given 4 min to walk freely atop the wire surface. The numbers of foot faults and non-fault steps for each forelimb were counted. The ratio of foot faults to total steps taken (number of foot faults + number of non-faults) for left forelimb was calculated. A step was defined as a foot fault if it did not get support and the foot dropped through the hole of the grid. If a mouse rested with its wrist at the level of the grid, it was also considered as a foot fault.
Cylinder task
The cylinder task encourages mice to use forelimbs to explore the vertical wall in a cylinder [Citation39]. When placed in a plastic cylinder (15-cm tall with a diameter of 10 cm), mice spontaneously rear up by pressing the wall of the cylinder with both or one of its forelimbs. Each mouse was kept in the cylinder for 5 min and videotaped. The number of times each mouse used the left forelimb, the right forelimb, or both forelimbs was calculated by analyzing the video footage. An asymmetry index was derived as follows: percent use of right forelimb – percent use of left forelimb.
Adhesive removal test
The adhesive removal test was performed using previously reported methods [Citation45,Citation46]. Two small pieces (25 mm2) of adhesive-backed paper dots were used as bilateral tactile stimuli and put on the distal-radial area of the wrist of each forelimb. The time that the mouse took to remove each dot from the limb was recorded. Mice were trained for three days before surgery and once they could remove the dots within 10 s, the surgery was performed. (Time of left forelimb – time of right forelimb) was considered as a result.
Immunostaining and analysis
Mice were transcardially perfused with phosphate-buffered saline (PBS; Gibco, 10010001) followed by 4% paraformaldehyde (in PBS). Brain tissues were sectioned into 30-μm coronal slices with a Vibratome (Leica, Wetzlar, Hesse, Germany). Slices were incubated with 0.3% Triton X-100 (Aladdin, T109027; in PBS) for 15 min and then blocked in 10% goat serum (ZSGB-BIO, ZLI-0956 in 0.3% Triton X-100) for 60 min at room temperature, followed by incubation with primary antibodies at 4°C overnight. The primary antibodies were rabbit anti-PARP14 (1:100; Sigma Aldrich, HPA012063), mouse anti-GFAP (1:500; Sigma Aldrich, G3893), mouse anti-RBFOX3 (1:250; Abcam, AB104224), rabbit anti-AIF1 (1:250; Wako, 019–19741), and rabbit anti-MAP1LC3B (1:200; Sigma Aldrich, L7543). Next day, slices were washed with PBS and incubated with secondary antibodies for 2 h. Secondary antibodies used were Alexa Fluor 594 goat anti-rabbit IgG (1:400; Invitrogen, A-11037), Alexa Fluor 488 goat anti-rabbit IgG (1:400; Invitrogen, A-11034), Alexa Fluor 594 goat anti-mouse IgG (1:400; Invitrogen, A-11005), and Alexa Fluor 488 goat anti-mouse IgG (1:400; Invitrogen, A-11029). Then slices were washed again with PBS. Images were captured via a confocal microscope (Zeiss, Oberkochen, Baden wuertenburg, Germany).
A protocol for double staining using two primary antibodies from the same species was followed [Citation47]. Briefly, slices were incubated with the primary antibody rabbit anti-AIF1 (1:250; Wako, 019–19741), followed by secondary antibody Alexa Fluor 488-conjugated affinipure fab fragment goat anti-rabbit IgG (H + L) (1:400; Jackson ImmunoResearch Laboratories, 111–547-003). After rinsing, slices were next incubated with primary antibody rabbit anti-PARP14 (1:100; Sigma Aldrich, HPA012063), followed by secondary antibody Alexa Fluor 594 goat anti-rabbit IgG (1:400; Invitrogen, A-11037).
Infarct volume measurement
Mouse brains were cut into 30-μm coronal slices using a sliding freezing stage microtome (Leica, Wetzlar, Hesse, Germany) at day 14 after stroke. Infarct volume was measured by histological assessment using Nissl staining according to the manufacturer’s instructions (Biyotime, C0117). Infarct volume was determined using ImageJ by an investigator blind to group allocation and based on measurements of every 6 section throughout the entire infarct as follows: infarct volume (mm3) = infarct area (mm2) × slice thickness × slice interval.
Cell cultures
As previously described [Citation22], primary mouse microglia were obtained from postnatal C57BL/6 J mice (postnatal 1–2 d). The brain tissue was digested using trypsin-EDTA (Gibco, 25200056) after the membranes and blood vessels were removed. Cells were plated in poly-D-lysine-precoated cell culture flasks (25 cm2) containing Dulbecco’s modified Eagle’s medium (DMEM) supplemented with fetal bovine serum (FBS, 10% v:v) and penicillin-streptomycin (1% v:v). Seven days later, CSF2/GM-CSF (colony-stimulating factor 2 (granulocyte-macrophage); 0.25 ng/ml) was added to the medium to aid microglial proliferation. The flasks were shaken to detach microglia, and the cell medium was centrifugated at 1500 rpm for 5 min to collect microglia. BV-2 cells were purchased from the China Center for Type Culture Collection and cultured in DMEM supplemented with 10% FBS and 1% penicillin-streptomycin. All cells were kept in a humidified incubator (5% CO2, 37°C).
Primary neurons were isolated from C57BL/6 J mouse (embryos, E15-E16) cortex, dissected, and incubated with trypsin EDTA (Gibco, 25200056) for 10 min, and plated at 1 × 10⁵ cells/cm2 in neurobasal medium (Gibco, 21103049) containing 0.5% GlutaMAX Supplement (Gibco, 35050061) and 2% B27 supplement (Gibco, 17504044) [Citation46]. All cells were kept in a humidified incubator (5% CO2, 37°C).
OGD treatment
OGD treatment was performed as previously reported [Citation48]. In brief, cells were rinsed with glucose-free deoxygenated DMEM (Gibco, 11966025) and incubated with the same medium in a hypoxia chamber (Thermo Fisher Scientific, Waltham, Massachusetts, USA) maintained at 37°C. The chamber was filled with premixed gas (5% CO2 and 95% N2). Control groups were incubated with DMEM and 10% FBS for the same time.
qPCR
qPCR was performed with an Applied Biosystems qPCR System according to our previous methods [Citation22]. Briefly, total RNA was extracted using TRIzol reagent (Invitrogen, 15596026), reverse transcribed with a HiScript Q Select RT SuperMix Kit (Vazyme, R123-01), and then quantified with AceQ qPCR SYBR Green Master Mix (Vazyme, R141-02). Primers were purchased from Invitrogen. Primer sequences used are listed in Table S1.
ELISA
Levels of cytokines (TNF, IL1B, and IL6) in the peri-infarct cortex extracts were analyzed using commercial ELISA kits according to the manufacturer’s instructions. The ELISA Kit of Mouse TNF (JEB-12474), Mouse IL1B (JEB-12787), and Mouse IL6 (JEB-12267) were obtained from Nanjing Jin Yibai Biological Technology Co. Ltd.
RNA sequencing analysis
Whole RNA sequencing experiments were performed and analyzed by LC-Bio (Hangzhou, China). Primary mouse microglia from the Con + ACT-Con group, Con + ACT-PARP14 group, OGD + ACT-Con group, and OGD + ACT-Con group were collected in TRIzol. Total RNAs were extracted from TRIzol. UMI technology was used to label each sequence fragment with sequence tags, which minimized the interference of duplication caused by PCR amplification on the quantitative accuracy of the transcriptome. RNA sequencing reads were aligned to the mouse genome (GRCh37/hg19) using the software Hisat2 (2.0.4). Transcript abundance was evaluated by calculating fragments per kilo base of exon per million fragments mapped (FPKM). The threshold of significantly differential expression was set at P < 0.05 and |log2(fold change)| ≥ 1.
Western blot analysis
Western blot analysis was performed with previously described methods [Citation44]. Peri-infarct tissue around the infarct core was rapidly dissected and the equivalent region was taken from sham mice. The primary antibodies used in addition to those listed above were rabbit anti- NOS2 (1:1000; Proteintech group, 18985-1-AP), mouse anti-PAR (1:500; Santa Cruz Biotechnology, sc-56198), rabbit anti-SQSTM1 (1:2000; Proteintech group, 18420-1-AP), rabbit anti-LPAR5 (1:400; Bioss, bs-15366 R), mouse anti-Flag (1:500; Sigma Aldrich, F3165), and mouse anti-ACTB/β-actin (1:3000; Proteintech group, 60008-1-Ig). Horseradish peroxidase-linked goat anti-rabbit/mouse IgG secondary antibodies (1:2000; Cell Signaling Technology, 7074P2 or 7076P2) were used and the resultant signals were detected on a chemiluminescence detection system. Individual protein bands were quantified by densitometry using ImageJ software.
Statistical analysis
All data are presented as mean ± SEM. Comparisons between 2 groups were assessed with a 2-tailed Student’s t-test. Brown-Forsythe test was firstly used to evaluate the homogeneity of variance. Comparisons among multiple groups (3 or more) were assessed with One/Two-way ANOVA followed by the Holm-Sidak post hoc test. Behavioral data collected at repeating time points (i.e., for a single animal at 4 time points) were analyzed using 2-way repeated measures ANOVA, followed by the Holm-Sidak post hoc test. The statistical analysis used for different experiments is indicated in the figure legends respectively, and statistical significance was set at P < 0.05.
Supplemental Material
Download MS Word (6.2 MB)Disclosure statement
The authors have no potential conflict of interests to declare.
Supplementary material
Supplemental data for this article can be accessed here.
Additional information
Funding
References
- Pu H, Shi Y, Zhang L, et al. Protease-independent action of tissue plasminogen activator in brain plasticity and neurological recovery after ischemic stroke. Proc Natl Acad Sci USA. 2019;116(18):9115–9124.
- Colasuonno M, Palange AL, Aid R, et al. Erythrocyte-inspired discoidal polymeric nanoconstructs carrying tissue plasminogen activator for the enhanced lysis of blood clots. ACS Nano. 2018;12(12):12224–12237.
- Neuhaus AA, Couch Y, Hadley G, et al. Neuroprotection in stroke: the importance of collaboration and reproducibility. Brain. 2017;140(8):2079–2092.
- Prinz M, Jung S, Priller J. Microglia biology: one century of evolving concepts. Cell. 2019;179(2):292–311.
- Li Q, Barres BA. Microglia and macrophages in brain homeostasis and disease. Nat Rev Immunol. 2018;18(4):225–242.
- Shi C, Pamer EG. Monocyte recruitment during infection and inflammation. Nat Rev Immunol. 2011;11(11):762–774.
- Ma Y, Wang J, Wang Y, et al. The biphasic function of microglia in ischemic stroke. Prog Neurobiol. 2017;157:247–272.
- Schreiber V, Dantzer F, Ame JC, et al. Poly(ADP-ribose): novel functions for an old molecule. Nat Rev Mol Cell Biol. 2006;7(7):517–528.
- Evans T, Matulonis U. PARP inhibitors in ovarian cancer: evidence, experience and clinical potential. Ther Adv Med Oncol. 2017;9(4):253–267.
- Posavec Marjanović M, Crawford K, Ahel I. PARP, transcription and chromatin modeling. Semin Cell Dev Biol. 2017;63:102–113.
- Gibson BA, Kraus WL. New insights into the molecular and cellular functions of poly(ADP-ribose) and PARPs. Nat Rev Mol Cell Biol. 2012;13(7):411–424.
- Baldassarro VA, Marchesini A, Giardino L, et al. PARP activity and inhibition in fetal and adult oligodendrocyte precursor cells: effect on cell survival and differentiation. Stem Cell Res. 2017;22:54–60.
- Curtin NJ, Szabo C. Therapeutic applications of PARP inhibitors: anticancer therapy and beyond. Mol Aspects Med. 2013;34(6):1217–1256.
- LaFargue CJ, Dal Molin GZ, Sood AK, et al. Exploring and comparing adverse events between PARP inhibitors. Lancet Oncol. 2019;20(1):e15–e28.
- Riffell JL, Lord CJ, Ashworth A. Tankyrase-targeted therapeutics: expanding opportunities in the PARP family. Nat Rev Drug Discov. 2012;11(12):923–936.
- Hottiger MO. Nuclear ADP-Ribosylation and its role in chromatin plasticity, cell differentiation, and epigenetics. Annu Rev Biochem. 2015;84:227–263.
- Peng B, Thorsell AG, Karlberg T, et al. Small molecule microarray based discovery of PARP14 inhibitors. Angew Chem Int Ed Engl. 2017;56(1):248–253.
- Du L, Zhang Y, Chen Y, et al. Role of microglia in neurological disorders and their potentials as a therapeutic target. Mol Neurobiol. 2017;54(10):7567–7584.
- Houtman J, Freitag K, Gimber N, et al. Beclin1-driven autophagy modulates the inflammatory response of microglia via NLRP3. Embo J. 2019;38(4):e99430.
- Zhou X, Zhou J, Li X, et al. GSK-3β inhibitors suppressed neuroinflammation in rat cortex by activating autophagy in ischemic brain injury. Biochem Biophys Res Commun. 2011;411(2):271–275.
- Xia CY, Zhang S, Chu SF, et al. Autophagic flux regulates microglial phenotype according to the time of oxygen-glucose deprivation/reperfusion. Int Immunopharmacol. 2016;39:140–148.
- Zhang Y, Shen K, Bai Y, et al. Mir143-BBC3 cascade reduces microglial survival via interplay between apoptosis and autophagy: implications for methamphetamine-mediated neurotoxicity. Autophagy. 2016;12(9):1538–1559.
- Plastira I, Bernhart E, Goeritzer M, et al. Lysophosphatidic acid via LPA-receptor 5/protein kinase D-dependent pathways induces a motile and pro-inflammatory microglial phenotype. J Neuroinflammation. 2017;14(1):253.
- Plastira I, Joshi L, Bernhart E, et al. Small-molecule lysophosphatidic acid receptor 5 (LPAR5) antagonists: versatile pharmacological tools to regulate inflammatory signaling in BV-2 microglia cells. Front Cell Neurosci. 2019;13:531.
- Mukhopadhyay P, Horváth B, Rajesh M, et al. PARP inhibition protects against alcoholic and non-alcoholic steatohepatitis. J Hepatol. 2017;66(3):589–600.
- Jin R, Yang G, Li G. Inflammatory mechanisms in ischemic stroke: role of inflammatory cells. J Leukoc Biol. 2010;87(5):779–789.
- Gibson CL, Coughlan TC, Murphy SP. Glial nitric oxide and ischemia. Glia. 2005;50(4):417–426.
- Chen AQ, Fang Z, Chen XL, et al. Microglia-derived TNF-α mediates endothelial necroptosis aggravating blood brain–barrier disruption after ischemic stroke. Cell Death Dis. 2019;10(7):487.
- Qin W, Wu HJ, Cao LQ, et al. Research progress on PARP14 as a drug target. Front Pharmacol. 2019;10:172.
- Choi JW, Herr DR, Noguchi K, et al. LPA receptors: subtypes and biological actions. Annu Rev Pharmacol Toxicol. 2010;50:157–186.
- Kotarsky K, Boketoft A, Bristulf J, et al. Lysophosphatidic acid binds to and activates GPR92, a G protein-coupled receptor highly expressed in gastrointestinal lymphocytes. J Pharmacol Exp Ther. 2006;318(2):619–628.
- Lee CW, Rivera R, Gardell S, et al. GPR92 as a new G12/13- and Gq-coupled lysophosphatidic acid receptor that increases cAMP, LPA5. J Biol Chem. 2006;281(33):23589–23597.
- Goenka S, Cho SH, Boothby M. Collaborator of Stat6 (CoaSt6)-associated poly(ADP-ribose) polymerase activity modulates Stat6-dependent gene transcription. J Biol Chem. 2007;282(26):18732–18739.
- Mehrotra P, Riley JP, Patel R, et al. PARP14 functions as a transcriptional switch for Stat6-dependent gene activation. J Biol Chem. 2011;286(3):1767–1776.
- Iqbal MB, Johns M, Cao J, et al. PARP-14 combines with tristetraprolin in the selective posttranscriptional control of macrophage tissue factor expression. Blood. 2014;124(24):3646–3655.
- Han B, Zhang Y, Zhang Y, et al. Novel insight into circular RNA HECTD1 in astrocyte activation via autophagy by targeting MIR142-TIPARP: implications for cerebral ischemic stroke. Autophagy. 2018;14(7):1164–1184.
- Chen CM, Wu CT, Yang TH, et al. Green tea catechin prevents hypoxia/reperfusion-evoked oxidative stress-regulated autophagy-activated apoptosis and cell death in microglial cells. J Agric Food Chem. 2016;64(20):4078–4085.
- Jiang M, Wang H, Jin M, et al. Exosomes from miR-30d-5p-ADSCs reverse acute ischemic stroke-induced, autophagy-mediated brain injury by promoting M2 microglial/macrophage polarization. Cell Physiol Biochem. 2018;47(2):864–878.
- Clarkson AN, Huang BS, Macisaac SE, et al. Reducing excessive GABA-mediated tonic inhibition promotes functional recovery after stroke. Nature. 2010;468(7321):305–309.
- Fluri F, Schuhmann MK, Kleinschnitz C. Animal models of ischemic stroke and their application in clinical research. Drug Des Devel Ther. 2015;9:3445–3454.
- Sommer CJ. Ischemic stroke: experimental models and reality. Acta Neuropathol. 2017;133(2):245–261.
- Yang L, Han B, Zhang Z, et al. Extracellular vesicle-mediated delivery of circular RNA SCMH1 promotes functional recovery in rodent and nonhuman primate ischemic stroke models. Circulation. 2020;142(6):556–574.
- Carmichael ST. Rodent models of focal stroke: size, mechanism, and purpose. NeuroRx. 2005;2(3):396–409.
- Tang Y, Lin YH, Ni HY, et al. Inhibiting HDAC2 promotes functional recovery from stroke. J Am Heart Assoc. 2017;6(10):e007236.
- Hines DJ, Haydon PG. Inhibition of a SNARE-sensitive pathway in astrocytes attenuates damage following stroke. J Neurosci. 2013;33(10):4234–4240.
- Wu F, Han B, Wu S, et al. Circular RNA TLK1 aggravates neuronal injury and neurological deficits after ischemic stroke via miR-335-3p/TIPARP. J Neurosci. 2019;39(37):7369–7393.
- Tozzi A, de Iure A, Di Filippo M, et al. The distinct role of medium spiny neurons and cholinergic interneurons in the D₂/A₂A receptor interaction in the striatum: implications for Parkinson’s disease. J Neurosci. 2011;31(5):1850–1862.
- Luo CX, Lin YH, Qian XD, et al. Interaction of nNOS with PSD-95 negatively controls regenerative repair after stroke. J Neurosci. 2014;34(40):13535–13548.