
ABSTRACT
As a highly dynamic organelle, mitochondria undergo constant fission and fusion to change their morphology and function, coping with various stress conditions. Loss of the balance between fission and fusion leads to impaired mitochondria function, which plays a critical role in the pathogenesis of Parkinson disease (PD). Yet the mechanisms behind mitochondria dynamics regulation remain to be fully illustrated. Chaperone-mediated autophagy (CMA) is a lysosome-dependent process that selectively degrades proteins to maintain cellular proteostasis. In this study, we demonstrated that MARCHF5, an E3 ubiquitin ligase required for mitochondria fission, is a CMA substrate. MARCHF5 interacted with key CMA regulators and was degraded by lysosomes. Severe oxidative stress compromised CMA activity and stabilized MARCHF5, which facilitated DNM1L translocation and led to excessive fission. Increase of CMA activity promoted MARCHF5 turnover, attenuated DNM1L translocation, and reduced mitochondria fragmentation, which alleviated mitochondrial dysfunction under oxidative stress. Furthermore, we showed that conditional expression of LAMP2A, the key CMA regulator, in dopaminergic (DA) neurons helped maintain mitochondria morphology and protected DA neuronal viability in a rodent PD model. Our work uncovers a critical role of CMA in maintaining proper mitochondria dynamics, and loss of this regulatory control may occur in PD and underlie its pathogenic process.
Abbreviations: CMA: chaperone-mediated autophagy; DA: dopaminergic; DNM1L: dynamin 1 like; FCCP: carbonyl cyanide 4-(trifluoromethoxy) phenylhydrazone; HSPA8: heat shock protein family A (Hsp70) member 8; LAMP2A: lysosomal associated membrane protein 2A; MARCHF5: membrane-associated ring-CH-type finger 5; MMP: mitochondria membrane potential; OCR: oxygen consumption rate; 6-OHDA: 6-hydroxydopamine; PD: Parkinson disease; SNc: substantia nigra pars compacta; TEM: transmission electron microscopy; TH: tyrosine hydroxylase; TMRE: tetramethylrhodamine ethyl ester perchlorate; WT: wild type.
Introduction
Mitochondria provide cellular energy, participate in metabolism regulation, and involve in calcium storage and cell death signaling, etc [Citation1–3]. Mitochondrial dysfunction has emerged as a key and driving feature in the pathogenic process of neurodegenerative diseases [Citation4]. For example, several environmental and genetic factors associated with Parkinson disease (PD), which is characterized by the gradual loss of dopaminergic (DA) neurons in substantia nigra pars compacta (SNc), are known to converge their pathogenic effect primarily on mitochondria [Citation5–8]. An important manner of mitochondria quality control is the dynamic change of their morphology. This is maintained by constant fusion and fission, which continuously shapes the cellular mitochondria network and allows the efficient adaptation of mitochondria to the changing demands of cell [Citation9]. The basic molecular machinery governing this important aspect of mitochondrial quality control is known. Fusion is controlled by the dynamin-related GTPase MFN1 (mitofusin 1) and MFN2 (mitofusin 2) located at the outer mitochondria membrane, and OPA1 (OPA1 mitochondrial dynamin like GTPase) at the inner mitochondria membrane [Citation10,Citation11]. While fission is regulated by the cytosolic DNM1L (dynamin 1 like) that translocates to mitochondria under stress conditions [Citation12]. Fusion is essential for material exchange within mitochondria network and fission promotes segregation of damaged mitochondria [Citation13,Citation14]. However, excessive fission has been clearly shown to significantly impair mitochondrial function and reduce neuron viability [Citation15–17]. Previous studies have shown that proteins of familial PD-related genes such as PINK1, LRRK2 and VPS35, all induce excessive fission by increasing the mitochondrial translocation of DNM1L, causing detrimental effects to DA neurons [Citation18–20]. Thus, a proper balance between fusion and fission is vital to maintain mitochondria function and DA neuron survival. However, the detailed mechanisms regulating mitochondria dynamics remain to be fully deciphered.
Chaperone-mediated autophagy (CMA) is a process that selectively targets individual proteins to the lysosomes for degradation. CMA involves the recognition and binding of substrates containing a KFERQ motif by HSPA8 (heat shock protein family A (Hsp70) member 8). The protein substrate is delivered to lysosomes by the substrate-chaperone complex, interacts with LAMP2A (lysosomal associated membrane protein 2A), and translocated into the lysosome lumen for degradation [Citation21]. A series of studies have indicated that CMA plays an important role in maintaining cellular proteostasis [Citation22–26]. Notably, evidence from postmortem examination, animal model and in vitro cell study all reveal that CMA activity may be impaired in PD and contributes to the disease pathogenesis [Citation27–29]. There is some evidence for the involvement of CMA in modulating mitochondrial function. For example, we have previously demonstrated that CMA maintains mitochondrial function by modulating PARK7 degradation, suggesting that CMA may participate in mitochondria quality control [Citation30]. This prompts us to explore whether CMA may specifically regulate mitochondrial dynamics.
In this study, we demonstrated that CMA degrades MARCHF5 (membrane-associated ring-CH-type finger 5), an E3 ubiquitin ligase required for DNM1L-dependent mitochondria fission. Severe oxidative stress impairs CMA activity, resulting in an accumulation of MARCHF5, which in turn promotes DNM1L translocation to mitochondria and subsequent mitochondria fragmentation in DA neurons. Enhancing CMA significantly inhibits mitochondria fission and alleviates mitochondrial dysfunction following stress. This protective effect requires MARCHF5. Thus, CMA controls MARCHF5 to regulate mitochondrial dynamics.
Results
MARCHF5 is degraded by lysosomes
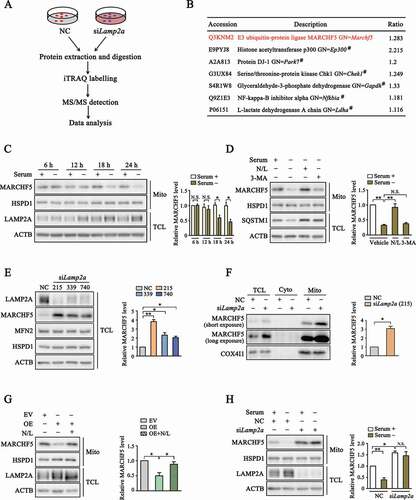
To identify putative CMA substrates, we conducted an iTRAQ-labelling MS\MS screening after knocking down the expression of LAMP2A, the known rate-limiting factor for CMA, by small interfering RNAs (siRNA) (). Data analysis revealed that a considerable number of mitochondria-related proteins were up-regulated after LAMP2A knockdown. Among them was the E3 ubiquitin ligase MARCHF5, a protein known to have a key role in mitochondria dynamics [Citation31] (). To correlate CMA activity with MARCHF5 level, we treated SN4741 cells, a mouse midbrain dopaminergic neuronal progenitor cell line, with prolonged serum deprivation. As MARCHF5 is mainly localized at mitochondria outer membrane, we isolated mitochondria following serum starvation. Immunoblot analysis showed that prolonged serum starvation increased the level of LAMP2A and clearly reduced the level of mitochondria-associated MARCHF5 (). Whereas inhibition of lysosome hydrolases attenuated the loss of MARCHF5 (), indicating that the degradation of MARCHF5 is lysosome-dependent. Since serum withdrawal also activates macroautophagy (MA), we treated serum starved cells with a MA inhibitor 3-MA. The results showed that compared with SQSTM1, a classical MA substrate, 3-MA failed to prevent the decrease of MARCHF5, suggesting that degradation of MARCHF5 is MA-independent under this condition (). Next, we used three different Lamp2a siRNAs to knockdown endogenous LAMP2A. Analysis of whole cell lysates revealed that knockdown of LAMP2A was accompanied with an increase in the level of MARCHF5 while other mitochondrial proteins such as MFN2 and HSPD1 (heat shock protein family D (Hsp60) member 1) remained unchanged, indicating that the increase of MARCHF5 was a specific effect of LAMP2A knockdown (). Consistently, the level of mitochondria-associated MARCHF5 was also higher after LAMP2A knockdown (). On the contrary, LAMP2A overexpression significantly reduced the level of MARCHF5 and this reduction was completely reversed by lysosome hydrolase inhibitors, suggesting that MARCHF5 is degraded directly by CMA (). In line with above findings, knocking down LAMP2A also abolished serum withdrawal-induced down-regulation of MARCHF5 (). Collectively, these data support MARCHF5 as a CMA target.
Figure 1. MARCHF5 level is regulated by LAMP2A. (A) Scheme of screening for proteins modulated by LAMP2A. SN4741 cells were transfected with small interfering RNA (siRNA) for Lamp2a or non-specific control siRNA (NC) for 48 h and collected for MS/MS analysis. (B) Identification of MARCHF5 as a candidate CMA substrate. Partial list shows proteins whose levels were upregulated following LAMP2A knockdown. #denotes known CMA substrates identified previously. (C) Change of MARCHF5 protein level after prolonged serum starvation. Enriched mitochondria (Mito) and total cell lysate (TCL) derived from SN4741 cells following serum starvation for the indicated periods of time were blotted. Right panel shows the relative MARCHF5 level normalized to HSPD1. (D) Lysosome-dependent degradation of MARCHF5 after serum starvation. SN4741 cells were serum-starved for 24 h with concurrent treatment as indicated (N/L: a combination of 20 mM NH4Cl and 100 μM leupeptin; 3-MA: 10 mM 3-methyladenine). Right panel shows the relative MARCHF5 level normalized to HSPD1. (E) The effect of LAMP2A knockdown on MARCHF5 level. SN4741 cells were transfected with three different Lamp2a siRNAs for 48 h. TCL were blotted for the indicated proteins. Right panel shows the quantification of MARCHF5 levels normalized to ACTB. (F) Change of MARCHF5 in different subcellular compartments. MARCHF5 level was blotted in TCL, cytoplasm (Cyto) and Mito fractions derived from SN4741 cells with LAMP2A knocked down (siRNA-215 was used here). Right panel shows the relative mitochondria-associated MARCHF5 level normalized to COX4I1. (G) The effect of LAMP2A overexpression on MARCHF5. SN4741 cells were transfected with the empty vector (EV) or MYC-LAMP2A plasmids for 24 h with or without lysosome inhibitors. The Mito and TCL extractions were blotted for the indicated proteins. Right panel shows the quantification of MARCHF5 level normalized to HSPD1. OE refers to MYC-LAMP2A overexpression. (H) The effect of LAMP2A knockdown on serum starvation-induced change of MARCHF5. Mito and TCL extractions from serum-starved SN4741 cells transfected with NC or Lamp2a siRNAs were blotted. Right panel shows the relative MARCHF5 level normalized to HSPD1. Data are expressed as mean ± S.E.M. (n = 3 independent experiments. Two-tailed Student’s t-test for C and F, one-way ANOVA followed by Dunn’s post test for E, two-way ANOVA followed by Tukey’s post test for D, G and H, *P < 0.05, **P < 0.01)
MARCHF5 interacts with key CMA regulators
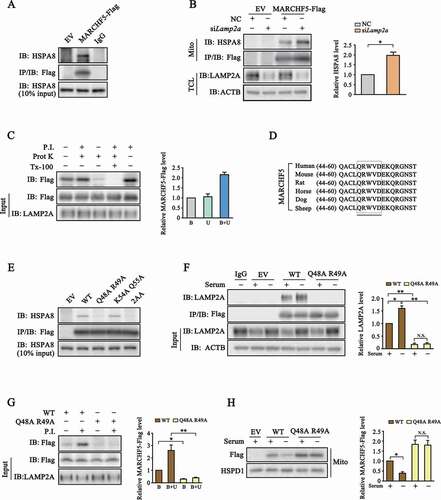
We next investigated the biochemical mechanism underlying lysosome-dependent degradation of MARCHF5. We first tested whether there exists a physical interaction between MARCHF5 and HSPA8 or LAMP2A, the two main regulators of CMA machinery. We transfected SN4741 cells with MARCHF5-Flag construct and showed its interaction with endogenous HSPA8 and LAMP2A by co-immunoprecipitation (). Moreover, LAMP2A knockdown markedly elevated the level of HSPA8 associated with MARCHF5, which is a typical feature shared by CMA substrates (). To further validate our findings, we carried out lysosomal binding and uptake assays as previously reported [Citation30,Citation32]. This study showed that MARCHF5 could directly bind to and be taken up by lysosomes (, S1A and S1B). We searched the KFERQ motifs in MARCHF5 manually based on the KFERQ-like consensus as well as via the KFERQ finder, a useful tool to screen KFERQ motifs in proteins [Citation33]. This led to the identification of four putative KFERQ motifs in MARCHF5 and a closely related element, QRWVD48-52, which has one amino acid (tryptophan, W) mismatch to the classic consensus and is termed +1 mismatch motif hereafter ( and S1C). All the motifs are either identical or highly conserved among the several species searched. We mutated the Q or its equivalent K (upon acetylation) together with one adjacent amino acid to alanine in five motifs and tested their binding with HSPA8. This analysis showed that all MARCHF5 mutants except for Q48A R49A still bound with HSPA8 at a level similar to wild-type (WT) MARCHF5, indicating that QRWVD48-52 is involved in mediating this interaction ( and S1D). The VDEKQ51-55 with similar composition to KFERQ motif albeit with two negative charged amino acids was also mutated as a negative control and shown not to affect MARCHF5 and HSPA8 binding (). Furthermore, Q48A R49A mutated MARCHF5 lost its binding with LAMP2A under both basal and serum-deprived conditions (). Binding and association assays showed that the Q48A R49A mutant largely lost its ability to bind and associate with lysosome (). Moreover, the Q48A R49A mutant was much more resistant to serum withdrawal-induced degradation ( and S1E). Together, these findings support that QRWVD48-52 is required for MARCHF5 to interact with CMA elements and its targeting to lysosome for degradation.
Figure 2. MARCHF5 interacts with key CMA regulators and is a CMA substrate. (A) Interaction between MARCHF5 and HSPA8. Lysates derived from SN4741 cells transfected as indicated were immunoprecipitated with IgG or anti-Flag antibodies and blotted with HSPA8 (top panel). The middle panel was blotted with anti-Flag antibody and bottom panel shows HSPA8 input. (B) The effect of LAMP2A knockdown on MARCHF5 and HSPA8 interaction. SN4741 cells were transfected as indicated and co-immunoprecipitation was carried out as in (A). Relative level of immunoprecipited HSPA8 is normalized to MARCHF5-Flag. (C) In vitro association of MARCHF5 with lysosome. Lysosomes purified from rat liver were co-incubated with purified GST-HSPA8 and HEK293T cell lysates with MARCHF5-Flag overexpressed. Protease inhibitors (P.I.), protease K (Prot K) and the TritonX-100 (Tx-100) were added as indicated. After reaction, the level of MARCHF5-Flag in recovered lysosomes was determined. Top band: lane 1, level of MARCHF5-Flag bound with lysosome, lane 2, level of MARCHF5-Flag uptaken by lysosome; lane 3, level of MARCHF5-Flag after Prot K and with active intra-lysosome proteases; lane 4, level of MARCHF5-Flag after TX-100 treatment; and lane 5, level of MARCHF5-Flag associated with lysosomes after protease inhibition. Right panel shows the relative level of MARCHF5-Flag normalized to input. B: binding, U: uptake. (D) A schematic presentation of the +1 mismatch motif in the amino acids sequence of MARCHF5. (E) Requirement of the +1 mismatch motif for MARCHF5 and HSPA8 interaction. Co-immunoprecipitation was carried out with lysates prepared from SN4741 cells transfected with EV or different MARCHF5-Flag constructs (WT, wild type; 2AA, Q48 R49 and K54 Q55 are mutated to alanines simultaneously). (F) The effect of Q48A R49A mutation on interaction between MARCHF5 with L2A. SN4741 cells transfected as indicated were serum-starved for 24 h and were assessed by co-immunoprecipitation. Right panel shows the relative level of LAMP2A normalized to MARCHF5-Flag. (G) The effect of Q48A R49A mutation on association between MARCHF5 and lysosomes. Lysates from HEK293T cells transfected as indicated were incubated with purified lysosomes as described in (C). Right panel shows the relative level of MARCHF5-Flag normalized to input. (H) The effect of Q48A R49A mutation on serum deprivation-induced degradation of MARCHF5. SN4741 cells transfected with WT or Q48A R49A MARCHF5-Flag for 12 h were serum-starved for another 24 h. Mito preparations were blotted as indicated. Data are expressed as mean ± S.E.M. (n = 3 independent experiments. Two-tailed Student’s t-test for B, G and H, two-way ANOVA followed by Tukey’s post test for F, *P < 0.05, **P < 0.01)
CMA inhibits translocation of DNM1L to mitochondria by degrading MARCHF5
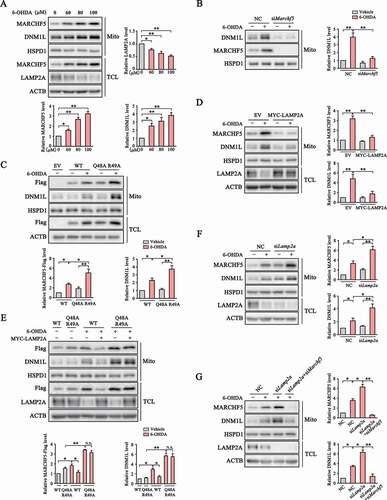
Since MARCHF5 was previously reported to modulate mitochondria fission by influencing DNM1L translocation to mitochondria [Citation31,Citation34–36], we tested whether CMA could regulate mitochondria dynamics by controlling MARCHF5 turnover. Severe and prolonged oxidative stress causes profound mitochondria dysfunction and DA neuron death in various models of PD. We treated SN4741 cells with different doses of 6-hydroxydopamine (6-OHDA), a commonly used neurotoxin to induce oxidative damage specifically in DA neuron [Citation37]. Our analysis showed that 6-OHDA reduced the level of LAMP2A in a dose-dependent manner. Moreover, the levels of MARCHF5 and DNM1L in enriched mitochondria also gradually increased as 6-OHDA dose increased (). MARCHF5 knockdown nearly completely abolished DNM1L mitochondrial localization under 6-OHDA treatment (). In contrast, overexpression of CMA-resistant Q48A R49A MARCHF5 further enhanced 6-OHDA-induced DNM1L accumulation on mitochondria compared with the WT MARCHF5 (). The Q48A R49A mutation does not affect the E3 ubiquitin ligase activity of MARCHF5 (Fig. S2D). Overexpression of LAMP2A also led to a sharp decrease of MARCHF5 and DNM1L in mitochondria (). However, overexpression of CMA-resistant MARCHF5 largely abrogated this LAMP2A-induced inhibition of DNM1L mitochondrial translocation (), suggesting that LAMP2A decreases the level of mitochondrial DNM1L mainly through effective removal of MARCHF5. In contrast with the effects of LAMP2A overexpression, knockdown of LAMP2A further increased the levels of MARCHF5 and the mitochondrial DNM1L under basal and 6-OHDA conditions (), mainly due to a residual activity of CMA in 6-OHDA condition, and concurrent MARCHF5 knockdown could abolish the effect of LAMP2A knockdown on DNM1L translocation ( and S2E). Thus, these data support the function of CMA in modulating MARCHF5 and mitochondrial DNM1L levels under oxidative stress condition.
Figure 3. CMA negatively regulates mitochondrial translocation of DNM1L via degradation of MARCHF5. (A) Stress-induced change of mitochondrial MARCHF5 and DNM1L. Mito and TCL preparations from SN4741 cells treated with different doses of 6-OHDA for 24 h were blotted as indicated. Quantification of total LAMP2A and mitochondrial MARCHF5 and DNM1L levels are shown. (B) The effect of MARCHF5 knockdown on 6-OHDA induced change of mitochondrial DNM1L. SN4741 cells transfected with NC or Marchf5 siRNAs were treated with 6-OHDA (80 μM) for 24 h and enriched mitochondria were blotted. Right panels show the quantification of mitochondrial DNM1L normalized to HSPD1. (C) Further increase of mitochondrial DNM1L by the Q48A R49A mutant. SN4741 cells transfected as indicated for 24 h were treated with 6-OHDA (80 μM) for another 24 h. Mito and TCL preparations were blotted as indicated. Right panels show the quantification of mitochondrial MARCHF5-Flag and DNM1L normalized to HSPD1. (D) The effect of LAMP2A overexpression on 6-OHDA-induced change of mitochondrial DNM1L level. SN4741 cells were transfected as indicated for 24 h and then treated with 80 μM 6-OHDA for an additional 24 h. Mito and TCL preparations were blotted. Right panels show the quantification of mitochondrial MARCHF5 and DNM1L normalized to HSPD1. (E) The effect of Q48A R49A mutation on mitochondrial DNM1L level. SN4741 cells transfected with WT or Q48A R49A MARCHF5-Flag with or without co-transfection of MYC-LAMP2A were treated with 80 μM 6-OHDA for 24 h and blotted as indicated. Right panels show the quantification of mitochondrial MARCHF5-Flag and DNM1L normalized to HSPD1. (F) Further increase of mitochondrial MARCHF5 and DNM1L by LAMP2A knockdown. SN4741 cells pre-transfected with NC or Lamp2a siRNAs were treated with 6-OHDA. Mito and TCL preparations were blotted. Right panels show the quantification of mitochondrial DNM1L and MARCHF5 normalized to HSPD1. (G) The effect of MARCHF5 and LAMP2A knockdown on DNM1L. SN4741 cells pre-transfected with NC, Lamp2a siRNA alone or Lamp2a siRNA and Marchf5 siRNA were treated with 6-OHDA and blotted as described in (E). Right panels show the quantification of mitochondrial MARCHF5 and DNM1L normalized to HSPD1. Data are expressed as mean ± S.E.M. (n = 3 independent experiments. One-way ANOVA followed by Dunn’s post test for A, two-way ANOVA followed by Tukey’s post test for B-G, *P < 0.05, **P < 0.01)
CMA regulates 6-OHDA-induced mitochondrial fission through its substrate protein MARCHF5
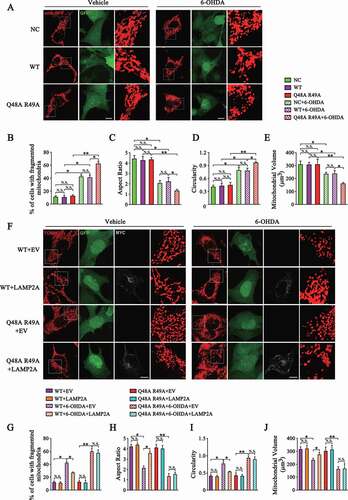
As DNM1L is the main regulator of mitochondrial fission, we examined the effects of CMA on mitochondrial dynamics. We established a SN4741 stable cell line with MARCHF5 knocked down. Then the sh-resistant WT MARCHF5 or Q48A R49A mutant was re-introduced to this cell line via lentivirus delivery. The protein level of MARCHF5 was determined in these cell lines (Fig. S3). SN4741 cells transfected with mito-RFP plasmids were imaged by confocal microscopy upon 6-OHDA treatment (). The results showed that 6-OHDA led to a significant increase in the number of cells with fragmented mitochondria (). To gain additional morphological details, we quantified circularity, aspect ratio and volume of individual mitochondria and compared the mean values of these parameters per cell. This analysis revealed that 6-OHDA caused considerable shortening of mitochondrial length as measured by the decrease in aspect ratio and higher circularity compared with the vehicle group ( and D). Cells treated with 6-OHDA also showed a reduced mitochondrial volume (). Furthermore, evidenced by the above morphological parameters, SN4741 cells expressing the Q48A R49A mutant exhibited a more fragmented mitochondria phenotype than cells expressing WT MARCHF5, indicating that blocking degradation of MARCHF5 by CMA aggravates mitochondria fission under stress conditions (). Interestingly, we did not find any significant difference for these morphological parameters between cells expressing WT MARCHF5 and the Q48A R49A mutant under basal conditions (). To further verify the effect of CMA on mitochondrial dynamics, we over-expressed LAMP2A in SN4741 cells and then conducted mitochondrial morphology analysis. LAMP2A overexpression significantly attenuated 6-OHDA-induced mitochondrial fragmentation in SN4741 cells stably expressing WT MARCHF5 but not the Q48A R49A mutant (). These findings indicate that CMA-mediated turnover of MARCHF5 plays a role in modulating mitochondria fission upon stress.
Figure 4. Degradation of MARCHF5 by CMA inhibits mitochondrial fission. (A) Images of mitochondrial architecture labeled by mito-RFP. NC and MARCHF5 knocked-down SN4741 cells re-expressing sh-resistant MARCHF5 (WT or Q48A R49A mutant) were transfected with mito-RFP construct and treated with 6-OHDA (80 μM) for 24 h. Cells were then fixed and imaged via confocal microscopy. Representative images are shown and the areas of interest are enlarged. The NC cells were infected with the control pLVX-IRES-ZsGreen1 virus and thus all three cell lines displayed ZsGreen1/GFP fluorescence. Scale bar: 10 μm. (B-E) Statistical analysis of the percentage of SN4741 cells with fragmented mitochondria (B); aspect ratio (C), circularity (D), volume (E) of mitochondria of SN4741 cells as treated in (A). (F) Analysis of the effect of LAMP2A overexpression on mitochondrial morphology. SN4741 cells stably express WT MARCHF5 or the Q48A R49A mutant were transfected with MYC-LAMP2A or EV and then treated with 6-OHDA. Cells were underwent immunofluorescence assays. TOMM20 and MYC were stained as red (Alexa Fluor 568) and grey (Alexa Fluor 647), respectively. Representative images are shown and the areas of interest are enlarged. Scale bar: 10 μm. (G-J) Statistical analysis of the mitochondrial morphology parameters as treated in (F). For the LAMP2A overexpression groups, only the cells with a positive Alexa Fluor 647 fluorescence were analyzed). Data are expressed as mean ± S.E.M. (n = 30 cells from 2 independent experiments for B-E and G-J. Two-way ANOVA followed by Tukey’s post test, *P < 0.05, **P < 0.01)
Degradation of MARCHF5 by CMA protects mitochondrial function under 6-OHDA treatment
Since excessive fission leads to mitochondrial dysfunction, we next assessed the role of CMA-mediated MARCHF5 degradation in protecting mitochondrial function. 6-OHDA treatment caused mitochondrial dysfunction in SN4741 cells manifested by decreased mitochondria membrane potential (MMP) and level of cellular ATP (). In addition, measurement of oxygen consumption rates (OCR) by the Seahorse XF24 analyzer revealed that 6-OHDA reduced basal OCR, respiratory capacity and ATP production-coupled OCR (). We examined the above mitochondrial functional parameters in SN4741 cells stably expressing WT MARCHF5 or the Q48A R49A mutant. The results showed that SN4741 cells displayed a more severe mitochondrial dysfunction when expressing the Q48A R49A mutant compared to WT MARCHF5 (), supporting that preventing degradation of MARCHF5 by CMA worsens mitochondrial dysfunction under stress. Notably, boosting cellular CMA activity by ectopic LAMP2A expression significantly attenuated the loss of MMP and ATP, and restored all the measures of mitochondria bioenergetics following 6-OHDA treatment in SN4741 cells stably expressing WT MARCHF5 (). In contrast, this LAMP2A-mediated recovery of mitochondrial function was largely lost in SN4741 cells expressing the Q48A R49A mutant (), validating that degradation of MARCHF5 is a key step for CMA to protect mitochondrial function. Similar to the effect of CMA on mitochondria morphology, under basal condition, expressing either the Q48A R49A mutant or LAMP2A did not significantly affect these mitochondria functional parameters compared with their corresponding control group ().
Figure 5. Degradation of MARCHF5 by CMA protects mitochondrial function. (A) Analysis of the effect of blockage degradation of MARCHF5 by CMA on mitochondrial membrane potential (MMP). SN4741 cells stably expressing WT MARCHF5 or the Q48A R49A mutant were treated with 6-OHDA. Living cells were then stained with the TMRE dye and detected by the flow cytometry (PE-A channel). Right panels show the percentage of SN4741 cells with decreased MMP. (B) Analysis of the effect of blockage degradation of MARCHF5 by CMA on cellular total ATP level. SN4741 cells stably expressing WT MARCHF5 or the Q48A R49A mutant were treated as indicated. The ATP level was determined by an ATP Assay Kit. (C) Analysis of the effect of blockage degradation of MARCHF5 by CMA on oxygen consumption rate (OCR). SN4741 cells stably expressing WT MARCHF5 or the Q48A R49A mutant were seeded on a 24-well microplate, treated as indicated, and then analyzed by the seahorse XF24 analyzer. Oligomycin (1 μM), FCCP (1.5 μM), antimycin A and rotenone (2 μM) were added at indicated time points. Right panels show different mitochondria bioenergetics parameters (Basal OCR refers to the gap between OCR value measured before oligomycin injection and after antimycin A and rotenone injection; Maximal OCR refers to the gap between OCR value measured after FCCP injection and after antimycin A and rotenone injection; Spare Respiratory Capacity refers to the ratio between Maximal and Basal OCR; ATP production-coupled OCR refers to the gap between OCR value measured before and after oligomycin injection). (D-F) Analysis of the effect of LAMP2A overexpression on MMP (D), ATP level (E) and OCR (F) in WT SN4741 cells. SN4741 cells stably expressing WT MARCHF5 were transfected with the MYC-LAMP2A or EV for 24 h and then treated with 6-OHDA. MMP, ATP level and OCR was determined. (G-I) MARCHF5 Q48A R49A abrogated the effects of LAMP2A overexpression on MMP (G), ATP level (H) and OCR (I). SN4741 cells stably expressing Q48A R49A mutant were transfected with the MYC-LAMP2A or EV and treated with 6-OHDA. MMP, ATP level and OCR was determined. Data are expressed as mean ± S.E.M. (n = 3 independent experiments for A, B, D, E, G and H; n = 6 from 2 independent experiments [3 replicates for each group per experiment] for C, F and I. Two-way ANOVA followed by Tukey’s post test, *P < 0.05, **P < 0.01)
![Figure 5. Degradation of MARCHF5 by CMA protects mitochondrial function. (A) Analysis of the effect of blockage degradation of MARCHF5 by CMA on mitochondrial membrane potential (MMP). SN4741 cells stably expressing WT MARCHF5 or the Q48A R49A mutant were treated with 6-OHDA. Living cells were then stained with the TMRE dye and detected by the flow cytometry (PE-A channel). Right panels show the percentage of SN4741 cells with decreased MMP. (B) Analysis of the effect of blockage degradation of MARCHF5 by CMA on cellular total ATP level. SN4741 cells stably expressing WT MARCHF5 or the Q48A R49A mutant were treated as indicated. The ATP level was determined by an ATP Assay Kit. (C) Analysis of the effect of blockage degradation of MARCHF5 by CMA on oxygen consumption rate (OCR). SN4741 cells stably expressing WT MARCHF5 or the Q48A R49A mutant were seeded on a 24-well microplate, treated as indicated, and then analyzed by the seahorse XF24 analyzer. Oligomycin (1 μM), FCCP (1.5 μM), antimycin A and rotenone (2 μM) were added at indicated time points. Right panels show different mitochondria bioenergetics parameters (Basal OCR refers to the gap between OCR value measured before oligomycin injection and after antimycin A and rotenone injection; Maximal OCR refers to the gap between OCR value measured after FCCP injection and after antimycin A and rotenone injection; Spare Respiratory Capacity refers to the ratio between Maximal and Basal OCR; ATP production-coupled OCR refers to the gap between OCR value measured before and after oligomycin injection). (D-F) Analysis of the effect of LAMP2A overexpression on MMP (D), ATP level (E) and OCR (F) in WT SN4741 cells. SN4741 cells stably expressing WT MARCHF5 were transfected with the MYC-LAMP2A or EV for 24 h and then treated with 6-OHDA. MMP, ATP level and OCR was determined. (G-I) MARCHF5 Q48A R49A abrogated the effects of LAMP2A overexpression on MMP (G), ATP level (H) and OCR (I). SN4741 cells stably expressing Q48A R49A mutant were transfected with the MYC-LAMP2A or EV and treated with 6-OHDA. MMP, ATP level and OCR was determined. Data are expressed as mean ± S.E.M. (n = 3 independent experiments for A, B, D, E, G and H; n = 6 from 2 independent experiments [3 replicates for each group per experiment] for C, F and I. Two-way ANOVA followed by Tukey’s post test, *P < 0.05, **P < 0.01)](/cms/asset/e96c4a4f-0ad0-453e-9940-236758861080/kaup_a_1848128_f0005_oc.jpg)
CMA regulates MARCHF5 turnover, mitochondria dynamics and DA neuron viability in vivo
To corroborate the above in vitro findings, we generated a conditional LAMP2A-overexpressing mouse line. A mouse Lamp2a gene was cloned into the Gt(ROSA)26Sor gene with an exogenous CAG promoter. A short sequence expressing tandem stop codons with loxP on both ends were placed between the Lamp2a gene and CAG promoter. The Stopf-Lamp2a mice were then cross-fertilized with the TH (tyrosine hydroxylase)-Cre mice, which express the Cre recombinase specifically in tyrosine hydroxylase positive neurons, to generate a mouse line with LAMP2A overexpressed in the DA neuron (). Compared to Stopf-Lamp2a control mouse line, the TH-Cre:: Stopf-Lamp2a mouse line showed an increase of LAMP2A level in the SNc TH-positive neurons (). Consistently, lysosome binding and uptake assays demonstrated enhanced CMA activity in the SNc region of the TH-Cre::Stopf-Lamp2a mouse (Fig. S4).
Figure 6. Validation of CMA-MARCHF5-DNM1L axis in the SNc DA neurons expressing LAMP2A transgene. (A) A schematic presentation of the process of generating the TH-Cre::Stopf-Lamp2a transgenic mouse line. (B) 6-OHDA-induced changes in Stopf-Lamp2a and TH-Cre::Stopf-Lamp2a mouse brains. 6-OHDA (3 μg) or same volume of saline was stereotactically injected into the SNc region of Stopf-Lamp2a or TH-Cre:: Stopf-Lamp2a mouse. After 7 days, the SNc regions were harvested. Whole tissue lysates (WTL) or purified mitochondrial preparations were blotted. Quantifications of the indicated proteins are shown. (n = 3 animals per group). (C) Image analysis of the DA neurons of SNc. Representative immune-fluorescent images show the levels of TH (purple, Alexa Fluor 647) and LAMP2A (green, Alexa Fluor 488) in the Stopf-Lamp2a and TH-Cre::Stopf-Lamp2a mouse brains. Scale bar: 200 μm. The bottom two rows show the enlarged areas. (D) Imaging analysis of the effects of 6-OHDA in the SNc region of Stopf-Lamp2a or TH-Cre::Stopf-Lamp2a mouse brains. 6-OHDA was stereotactically injected in the SNc region of Stopf-Lamp2a or TH-Cre::Stopf-Lamp2a mouse. Immunofluorescence analysis was performed and representative images are shown. Scale bar: 200 μm. Right panel shows the quantification of TH-positive neurons in the SNc region. (n = 3 animals per group). (E) Transmission electron microscope (TEM) analysis of mitochondria in the SNc regions of from Stopf-Lamp2a or TH-Cre::Stopf-Lamp2a. The experiments were carried out as in (D). The SNc regions were analyzed by TEM and representative images are shown. (F) Quantification of mitochondrial morphological parameters and number. The boundaries of 25th and 75th percentiles are plotted in graphs for mitochondria aspect ratio, circularity (n = 200 mitochondria per group) and number per micrograph (n = 13 per group). Mitochondria are classified into three different groups according to their length (<0.5 μm, 0.5–1.0 μm and >1.0 μm) and their relative quantities were calculated (n = 200 mitochondria per group). Data are expressed as mean ± S.E.M. (Two-way ANOVA followed by Tukey’s post test for B, D and F [%Mitochondria]. Kruskal–Wallis tests followed by Dunn’s test for F [aspect ratio, circularity and mitochondrial number], *P < 0.05, **P < 0.01)
![Figure 6. Validation of CMA-MARCHF5-DNM1L axis in the SNc DA neurons expressing LAMP2A transgene. (A) A schematic presentation of the process of generating the TH-Cre::Stopf-Lamp2a transgenic mouse line. (B) 6-OHDA-induced changes in Stopf-Lamp2a and TH-Cre::Stopf-Lamp2a mouse brains. 6-OHDA (3 μg) or same volume of saline was stereotactically injected into the SNc region of Stopf-Lamp2a or TH-Cre:: Stopf-Lamp2a mouse. After 7 days, the SNc regions were harvested. Whole tissue lysates (WTL) or purified mitochondrial preparations were blotted. Quantifications of the indicated proteins are shown. (n = 3 animals per group). (C) Image analysis of the DA neurons of SNc. Representative immune-fluorescent images show the levels of TH (purple, Alexa Fluor 647) and LAMP2A (green, Alexa Fluor 488) in the Stopf-Lamp2a and TH-Cre::Stopf-Lamp2a mouse brains. Scale bar: 200 μm. The bottom two rows show the enlarged areas. (D) Imaging analysis of the effects of 6-OHDA in the SNc region of Stopf-Lamp2a or TH-Cre::Stopf-Lamp2a mouse brains. 6-OHDA was stereotactically injected in the SNc region of Stopf-Lamp2a or TH-Cre::Stopf-Lamp2a mouse. Immunofluorescence analysis was performed and representative images are shown. Scale bar: 200 μm. Right panel shows the quantification of TH-positive neurons in the SNc region. (n = 3 animals per group). (E) Transmission electron microscope (TEM) analysis of mitochondria in the SNc regions of from Stopf-Lamp2a or TH-Cre::Stopf-Lamp2a. The experiments were carried out as in (D). The SNc regions were analyzed by TEM and representative images are shown. (F) Quantification of mitochondrial morphological parameters and number. The boundaries of 25th and 75th percentiles are plotted in graphs for mitochondria aspect ratio, circularity (n = 200 mitochondria per group) and number per micrograph (n = 13 per group). Mitochondria are classified into three different groups according to their length (<0.5 μm, 0.5–1.0 μm and >1.0 μm) and their relative quantities were calculated (n = 200 mitochondria per group). Data are expressed as mean ± S.E.M. (Two-way ANOVA followed by Tukey’s post test for B, D and F [%Mitochondria]. Kruskal–Wallis tests followed by Dunn’s test for F [aspect ratio, circularity and mitochondrial number], *P < 0.05, **P < 0.01)](/cms/asset/58ba880d-f596-4230-96a5-6a9211669ba3/kaup_a_1848128_f0006_oc.jpg)
We stereotactically injected 6-OHDA into the SNc brain region, a common neurotoxic model of PD [Citation38]. Analyses showed that 6-OHDA induced a substantial loss of the TH dopaminergic neurons in the SNc compared with the saline group in the Stopf-Lamp2a control mouse, confirming the validity of this model (). Analysis of the SNc regions isolated from treated mice showed that 6-OHDA treatment caused an increase in the levels of MARCHF5 and DNM1L in purified mitochondria (), consistent with our in vitro findings. Mitochondria morphology was analyzed through transmission electron microscope (TEM) (). The results showed that mitochondria in the SNc neurons treated with 6-OHDA displayed a fragmented morphology compared with the saline-only group, as evidenced by a decrease in aspect ratio, higher circularity and a significant shift towards shortened length (<0.5 μm) (). The total number of mitochondrial dropped greatly upon 6-OHDA insults, indicating a reduction of mitochondrial biomass (). Compared with the Stopf-Lamp2a mouse, in the TH-Cre::Stopf-Lamp2a mouse line, LAMP2A overexpression significantly reduced the levels of mitochondrial MARCHF5 and DNM1L under 6-OHDA treatment (), restored mitochondrial dynamics () and reduced the loss of TH signal in the SNc neurons (). These data support that 6-OHDA engages the CMA–MARCHF5-DNM1L regulatory pathway in the SNc DA neurons. Enhanced CMA by LAMP2A overexpression inhibits excessive fission and neuron death in the PD mouse model.
Discussion
Our studies establish a role for CMA in regulating mitochondrial fission. This involves mitochondrial E3 ubiquitin ligase MARCHF5. CMA directly controls the turnover of MARCHF5 to tightly modulate the level of DNM1L associated with mitochondria and thereby the degree of mitochondria fission. We provide both in vitro and in vivo evidence demonstrating that neuronal stress conditions such as oxidative stress and neurotoxin associated with PD engage this pathway to cause excessive fission and subsequent mitochondrial damages. Importantly, enhancing CMA by expressing LAMP2A in the SNc DA neurons offers these neurons significant protection against mitochondrial damage and enhances their viability in a model of PD. The autophagy-lysosome pathway is known to play an important role in mitochondrial quality control by eliminating damaged mitochondria via mitophagy [Citation23,Citation39,Citation40]. Our finding that lysosome-dependent CMA process also actively participates in regulating mitochondria dynamics broadens the role of lysosomes in mitochondrial quality control and homeostasis.
Recently, several studies have linked MARCHF5 to the detrimental effects to neurons upon insults. The damaging role played by MARCHF5 appears to be associated with its downstream effector DNM1L and excessive mitochondria fission. In support of this, ectopically expressed of dominant negative MARCHF5 or DNM1L has been shown to inhibit fission as well as neuronal death under neurotoxin treatment [Citation41,Citation42]. However, there are also other studies indicating that MARCHF5 may exert protective effects under stress [Citation40,Citation43,Citation44]. For example, MARCHF5 may be involved in the recruitment of Parkin to impaired mitochondria, facilitating mitophagy [Citation43]. MARCHF5 can promote FUNDC1 degradation to modulate hypoxia-induced mitophagy [Citation45]. Thus, these findings highlight the need for better understanding of the critical regulatory mechanisms involved in modulating MARCHF5 protein level and activity under various stress conditions. Previous studies have found that MARCHF5 can dimerize at the outer mitochondria membrane and acts as an E3 ubiquitin ligase for itself to promote its own turnover through the proteasome pathway [Citation46].
Here we show that MARCHF5 level is also controlled by CMA, another key process in protein homeostasis. It is well accepted that CMA activity is deceased under various pathogenic stress, particularly conditions associated with PD [Citation27–29]. In particular, several mutated proteins known to be involved in familial forms of PD have all been shown to block CMA as part of their pathogenic mechanism [Citation25,Citation28,Citation47,Citation48]. Our previous studies have shown that severe or sustained stress by 6-OHDA compromise CMA, which contributes to increased vulnerability of DA neurons to toxic insults [Citation37]. Our current study reveals that one clear consequence of loss of CMA under stress is a significant reduction of MARCHF5 turnover and subsequent accumulation of DNM1L in mitochondria. This causes excessive mitochondria fission and contributes to mitochondrial dysfunction. One interesting observation from our study is that in contrast to stress, blocking CMA-mediated MARCHF5 degradation under basal condition does not change mitochondrial morphology and compromise mitochondrial function. The mechanisms underlying the different response to dysfunctional CMA-MARCHF5 axis between basal and stress conditions remain to be uncovered. One possibility is that 6-OHDA may also promote the synthesis of MARCHF5, based on the protein level of MARCHF5 in total cell lysates ( A, C and E). Since LAMP2A overexpression is sufficient to reduce the increase of MARCHF5 after 6-OHDA, this suggests that at least a significant part of the accumulation of MARCHF5 upon 6-OHDA is due to impaired CMA. Given that fission is essential for segregating and eliminating damaged mitochondria [Citation14], it is possible that cells may increase the synthesis of MARCHF5 under oxidative stress to induce mitochondria fission in an attempt to maintain a healthy mitochondria network. In mild oxidative stress, during which CMA is also activated, these newly synthesized MARCHF5 could be timely removed to restrain excessive fission, while severe and prolonged oxidative stress relating to PD leads to a largely compromised CMA that is not sufficient to remove MARCHF5, resulting in persistent and uncontrolled mitochondria fission. In this view, the CMA-MARCHF5 pathway may be more important to keep the balance of the fission process under stress conditions than the steady-state.
Since the discovery of KFERQ-like motif, the progress of the field has been guided by the identification of CMA substrates based on the presence of this motif in their sequence. The motif search identified several classic KFERQ-like sequences and a + 1 mismatch motif QRWVD48-52 in MARCHF5. Mutation analysis shows clearly that QRWVD serves to mediate the binding of MARCHF5 with HSPA8 and its entry into lysosome. This may be partly due to a distal effect, as HSPA8 could also bind to KFERQ-like sequences that are not in the primary sequence of certain proteins but are created by folding [Citation49]. One potential caveat is that the degree of exposure or accessibility under a particular condition influences the choice of motifs. KFERQ motifs that are buried inside the protein under normal conformation may become exposed upon protein unfolding and be recognized by CMA machinery [Citation50,Citation51]. Therefore, considering condition-dependent choice of motif, it would be interesting to test if other KFERQ motifs in MARCHF5 may contribute to its degradation by CMA upon receiving different signals.
An intriguing phenomenon here is that MARCHF5 is usually a non-cytosolic protein (locate at outer mitochondrial membrane) while CMA is known to mainly degrade cytosolic proteins. Similarly, Kaushik et al previously reported that PLIN2 (perilipin 2) and PLIN3 (perilipin 3), which are usually lipid droplets (LD)-anchored proteins could also be degraded by CMA through recruiting HSPA8 to the surface of LDs and dynamic lysosome-LD interaction [Citation24]. Based on our data that MARCHF5-HSPA8 binding could be detected in mitochondria and a recent report showing frequent lysosome-mitochondria interactions in living cells [Citation52], it is possible that MARCHF5 may be degraded by CMA in a manner similar to PLIN2/3. Degradation of non-cytosolic proteins by CMA could also occur once these proteins reach the cytosol [Citation33]. A study published recently showed that MARCHF5 could be released from mitochondrial outer membrane and relocates to cytosol or other organelles upon stress conditions [Citation53]. Therefore, degradation of MARCHF5 by CMA could occur after its release from mitochondrial outer membrane. Alternatively, CMA could also be involved in the degradation of the newly synthesized and soluble MARCHF5 in cytosol to keep the balance of the fission process upon stress conditions as aforementioned.
A balance between fission and fusion is essential for maintaining an efficient and functional network of mitochondria. Excessive fission leads to dysfunctional mitochondria and cell apoptosis due to decreased membrane potential and CYCS (cytochrome c) release [Citation1–4]. Fragmented and dysfunctional mitochondria are an important pathological feature of neurodegenerative diseases including PD. Given that CMA activity is decreased in both familial and sporadic PD [Citation25,Citation27,Citation54], it is reasonable to postulate that impaired CMA activity may be an important factor driving the mitochondrial abnormality in the disease. Several studies have confirmed that inhibition of fission promotes neuronal survival in various models of neurodegenerative diseases [Citation55–57]. In this study, our data show that enhancement of CMA by LAMP2A overexpression could offer significant protection against 6-OHDA-induced mitochondrial fragmentation and damage. Thus, approaches that can effectively augment CMA activity may be explored as therapeutics.
A feasible method to boost CMA activity in vivo is the overexpression of LAMP2A, the rate-limiting factor of CMA process [Citation26,Citation58]. The protein level of LAMP2A decreases in ageing and neurodegenerative diseases. Raising LAMP2A level has been considered as a promising strategy to combat against ageing and neurodegenerative diseases [Citation21,Citation22]. The findings with the DA neuron-specific LAMP2A expression mouse line fully support this. This mouse line offers a useful model to exam the efficacy of activating CMA against pathogenic stressors associated with PD and other neurodegenerative diseases. It is likely that CMA may also modulate the response of astrocyte and microglia to pathogenic stressors. There are reports that CMA is involved in inflammation [Citation59–61]. Given the recognition of neuroinflammation in neurodegenerative diseases, new models are needed to delineate the role of CMA-MARCHF5 in glia cells.
Materials and methods
Cell culture and treatments
SN4741 cells were grown in Dulbecco’s modified Eagle’s medium (DMEM; Corning, 10–013-CV) supplemented with 10% fetal bovine serum (AusGeneX, FBS500-S), 0.6% glucose (Sigma, G7021), 2 mM L-glutamine (Gibco, 56–85-9) and 100 U/ml penicillin-streptomycin (Hyclone, SV30010) at 33°C with 5% CO2. HEK293T cells were cultured in DMEM supplemented with 10% fetal bovine serum and 100 U/ml penicillin-streptomycin at 37°C with 5% CO2. To remove the serum, cells at about 60% confluence were washed twice with HBSS (Gibco, 14,025,076) and then cultured at serum-free DMEM for indicated time. 6-OHDA (Sigma-Aldrich, H4381) were diluted with PBS (Corning, 21–040-CM) containing 0.2% ascorbic acid (MP Biomedicals, 100,769).
Antibodies and chemicals
The antibodies used for immunoblot, immunoprecipitation, immunofluorescence or in vitro uptake assays were listed as following: anti-LAMP2A (125,068), anti-MARCHF5 (185,054), anti-HSPD1 (13,532), anti-SQSTM1 (109,012), anti-MFN1 (57,602), anti-MFN2 (56,889), anti-HSPA8 (51,052), anti-DNM1L (184,247), anti-RNASE/RNaseA (94,417) were purchased from Abcam; anti-ACTB (AC037) from ABclonal; anti-COX4I1 (11,242-1-AP), anti-Flag (20,543-1-AP), anti-MYC (60,003-2-Ig), anti-MIEF2 (16,413-1-AP) from Proteintech; anti-TH (T1299) from Sigma-Aldrich; anti-VDAC1 (4661) from Cell Signaling Technology; HRP-labeled goat anti-mouse IgG (AS003) and goat anti-rabbit IgG (AS014) from ABclonal; Alexa Fluor 488-adsorbed goat anti-rabbit IgG (A11034), Alexa Fluor 568-adsorbed goat anti-rabbit IgG (A11036) and Alexa Fluor 647-adsorbed goat anti-mouse IgG (A21236) from Invitrogen. The chemicals used were listed as following: ammonium chloride (Sigma-Aldrich, A9434), leupeptin (MP Biomedicals, 03476–89-7), 3-methyladenine (Selleck, S2767).
Plasmids and siRNAs
The MYC-LAMP2A construct was a gift kindly provided by Dr. Zixu Mao (Departments of Pharmacology and Neurology, School of Medicine, Emory University). The cDNA of mouse WT MARCHF5 was synthesized according to its mRNA sequence (NM_027314.3) and cloned into the pIRES2-EGFP-3× Flag vector (OBiO Technology Inc, H340). The cDNA encoding the MARCHF5Q48A,R49A mutant was also synthesized with indicated nucleic acids adjustment (CAGCGC142-147 replaced by GCTGCT142-147) and cloned into the pIRES2-EGFP-3× Flag vector. H43W, K54A Q55A, S94A K95A, Q236A R237A, K253A V254A and K257A Q258A mutated MARCHF5 were generated from wild-type MARCHF5 and the 2AA mutation from synthesized Q48A R49A MARCHF5 with a site-directed mutagenesis kit (Beyotime, D0206). The primers used were listed as following: H43W F: 5ʹ- TGGAGACAAGCCTGCCAAACCCACTTAGTAGATCCTCTGC ACCR-3ʹ and R: 5ʹ-GGTGCAGAGGATCTACTAAGTGGGTTTGGCAGGCTTGTCTCCA −3ʹ; K54A Q55A F: 5ʹ-CTGTGCTGTTTCCTCTTGCCGCTTCATCTACCCAGCGCTGGAGA CA-3ʹ and R: 5ʹ-TGTCTCCAGCGCTGGGTAGATGAAGCGGCAAGAGGAAACAGCAC AG-3ʹ; S94A K95A F 5ʹ-CTGCAGCAAAAGGGCAAGCTGCTGCGATCAGTCTATCTGCA AGAT-3ʹ and R 5ʹ-ATCTTGCAGATAGACTGATCGCAGCAGCTTGCCCTTTTGCTGCAG −3; Q236A R237A F 5ʹ-AGCAATTCCACCCAAGATTGTCGCTGCTAAATTTGAGTTAACACTACTGAACATCAGTTTAC-3ʹ and R 5ʹ-GTAAACTGATGTTCAGTAGTGTTAACTCA AATTTAGCAGCGACAATCTTGGGTGGAATTGCT-3ʹ; K253A V254A F 5ʹ-GTAAATATTG CTGCTGTTTGAAGTAAGCCGCAAATGCTCCTTTTATGGCAACAAAAGC-3ʹ and R 5ʹ-GCTTTTGTTGCCATAAAAGGAGCATTTGCGGCTTACTTCAAACAGCAGCAATATTTAC-3ʹ; K257A Q258A F 5ʹ-GTGTGCCTGACGTAAATATTGCTGCGCTGCGAAGTAAACC TTAAATGCTCCTTTTATGG-3ʹ and R 5ʹ-CCATAAAAGGAGCATTTAAGGTTTACTTCG CAGCGCAGCAATATTTACGTCAGGCACAC-3ʹ; 2AA F: 5ʹ-GCTGTGCTGTTTCCTCTT GCCGCTTCATCTACCCAAGCAGCGAGACAAG-3ʹ and R: 5ʹ-CTTGTCTCGCTGCTTG GGTAGATGAAGCGGCAAGAGGAAACAGCACAGC-3ʹ. The siRNAs used were listed as following: siLamp2a-215 5ʹ-GCCGUUCAGUCCAAUGCAUTT-3ʹ; siLamp2a-339 5ʹ-CC AUUGCAGUACCUGACAATT-3ʹ; siLamp2a-740 5ʹ-GCACCCAUCAUUCACACCATT-3ʹ; siMarchf5 5ʹ-GGUUGUAGGCCAUAAAGAATT-3ʹ.
SN4741 cells expressing control shRNA (pLKO.1-puro) or shRNA targeting Marchf5 mRNA (Sigma-Aldrich, TRCN0000257541) were generated via lentivirus delivery and puromycin (5 µg/ml) selection. The resulting stable cell line was used to generate stable sh-resistant WT Marchf5 or Q48A R49A mutation-reconstituted cell lines using lentiviral expression vector pLVX-IRES-ZsGreen1 (Clontech, 632,187) and subsequent ZsGreen1 fluorescence sorting. The WT or Q48A R49A mutated Marchf5 genes were synthesized with synonymous mutation (609-CGT CTCTGCTACCAGAATT changed to 609-TGTTTCAGCAACTCGTATC) that confer them resistance to shRNA.
Mass spectrum analysis
SN4741 cells transfected with siRNA targeting Lamp2a (siLamp2a-215) or non-specific control (NC) siRNAs for 48 h were harvested and lysed in RIPA lysis buffer. The samples were centrifuged at 13,000 g for 15 min and the supernatants were collected to determine concentration of protein via BCA assay. iTRAQ labels 113 and 114 were used to label the NC group and siLamp2a group, respectively. Mass spectrometric analysis was performed using a QStarXL mass spectrometer (Applied Biosystems, CA, USA) as previously described [Citation62]. Protein identification was accomplished by searching the spectrums against Uniprot database and ratio of 114:113 was calculated to analyze the relative expression levels of proteins upon LAMP2A knockdown.
Mitochondria isolation
Mitochondria were extracted from SN4741 cells by using a mitochondria isolation kit (Sangon Biotech, C500051) according to the manufacturer’s instructions. Isolation of mitochondria from mouse brain was carried out as previously reported [Citation63]. Briefly, SNc region was quickly excised from brain of sacrificed mouse and washed twice with ice-cold PBS. Homogenize the tissue in 1 ml MSEB buffer (225 mM mannitol [Sigma-Aldrich, M4125], 75 mM sucrose [Sigma-Aldrich, V900116], 1 mM EGTA [MP Biomedicals, 195,174], 0.2 mg/ml BSA [Sangon Biotech, A600332], 5 mM HEPES [Sigma-Aldrich, PHR1428], pH 7.4). The lysates were centrifuged at 500 g for 5 min to remove nucleus fractions. The supernatant was transferred into a new tube and centrifuged at 14,000 g for 10 min to get the crude mitochondria. The crude mitochondria pellet was resuspended in 0.2 ml 12% Percoll-MSE (225 mM mannitol, 75 mM sucrose, 1 mM EGTA, 12% Percoll [v:v; GE healthcare, 17,089,102], 5 mM HEPES, pH 7.4) and carefully layered onto 1 ml 24% Percoll-MSE buffer in a new tube to centrifuge at 18,000 g for 15 min. After that, the sample is separated into three portions from top to bottom. Remove the top portion and add 1.2 ml MSE buffer (225 mM mannitol, 75 mM sucrose, 1 mM EGTA, 5 mM HEPES, pH 7.4). Mix the sample and centrifuge at 18,000 g for 5 min. Then aspirate 1.5 ml of the supernatant and suspend the pellet in the remaining 0.2 ml buffer, add 1.5 ml MSE buffer and centrifuge at 14,000 g for 5 min to get the purified mitochondria fraction.
Immunoblot and Co-immunoprecipitation
Cells, isolated mitochondria or brain tissues were lysed with the ice-cold RIPA lysis buffer (Millipore, 20–188) supplemented with the protease inhibitor cocktail (Millipore, 539,134) for 30 min. The samples were centrifuged at 16,000 g for 15 min and the supernatant was collected for BCA assay to determine the concentration of protein extract. For immunoblot analysis, to keep the band intensity locates within the linear dynamic range, 20–40 μg of proteins were resolved by 12%-15% SDS-PAGE gel, then transferred to the PVDF membrane (Roche, 03010040001) and incubated with the indicated antibodies. Secondary HRP-coupled antibodies were incubated for 2 h at room temperature. The blots were then visualized with the chemiluminescent detection system (Bio-Rad, CA, USA) and band intensities were quantified using ImageJ software (version 1.51 n, National Institutes of Health, Bethesda, MD, USA). For co-immunoprecipitation, collected cells were re-suspended with a lysis buffer (150 mM NaCl [MP Biomedicals, 152,575], 1 mM EGTA, 1 mM EDTA [MP Biomedicals, 101,676], 1% Triton X-100 [MP Biomedicals, 194,854], 2 mM DTT [Sigma-Aldrich, D0632], 100 μM PMSF [Sigma-Aldrich, P7626], 50 mM Tris-HCl [MP Biomedicals, 103,132], pH 7.5) supplemented with the protease inhibitor cocktail (Millipore, 539,134). The supernatant was incubated with an anti-Flag antibody at 4°C for overnight, followed by protein A/G-plus agarose beads (Santa Cruz Biotechnology, sc-2003,) at 4°C for 4 h. The immunoprecipitates were collected by centrifuging samples at 1000 g for 3 min and washed 5 times with the lysis buffer.
Quantitative PCR
Total RNA was extracted from cells using TRIzol reagent according to the manufacturer’s instructions (Roche, 11,667,165,001). Equal amounts of RNA samples were used for cDNA synthesis with a Transcriptor First Strand cDNA Synthesis Kit (Roche, 04896866001). Quantitative PCR analysis was carried out using the iQTM5 PCR system (Bio-Rad, CA, USA) with a SYBR qPCR Master Mix (Vazyme, Q311-02). The following primers were used for quantitative PCR: Lamp2a, 5′-AGGTGCTTTCTGTGTCTAGAGCGT-3′ and 5′-AGAATAAGTACTCCTCCCAGAGCTGC-3′; Actb, 5′-TCCTTCTTGGGTATGGAA-3′ and 5′-AGGAGGAGCAATGATCTTGAT CTT-3′.
In vitro binding and uptake assay
Lysosome isolation
Lysosomes isolation was carried out using a lysosome enrichment kit (Thermo Fisher Scientific, 89,839). Briefly, the male Sprague-Dawley rats (250 g) were fasted for 24 h and then were sacrificed via anesthetic overdose (CO2). Livers were quickly removed and homogenized in the extraction buffer (0.25 M sucrose, 1 mM EDTA, 20 mM HEPES, pH 7.4). Centrifuge the homogenate at 800–1000 g for 10 min and transfer the supernatant into a clean tube. Then centrifuge the collected supernatant at 20,000 g for 10 min. Remove the supernatant and resuspend the pellet with 9% OptiPrep (Sigma-Aldrich, D1556) solution. In a new ultracentrifuge tube, prepare a discontinuous density gradient by overlapping the OptiPrep gradients in descending concentrations (18%, 16%, 14%, 12%, 10%). Then carefully layer the re-suspended pellet onto the top of density gradients. Centrifuge the sample at 145,000 g for 2 h. The lysosome band is close to the top of the gradient. Lysosome integrity was assessed by measuring the activity of HEX/β-hexosaminidase. Preparations with more than 10% of broken lysosomes were discarded. All procedures were carried out at 4℃ or on ice.
Purification of GST-HSPA8
The BL21 engineered bacteria transformed with GST-HSPA8 construct were cultured in 100 ml LB medium (NaCl 12.5 g/L, tryptone [OXOID, LP0042] 12.5 g/L and yeast extract [OXOID, LP0021] 7.5 g/L) at 37℃ in an orbital shaker for 12 h. Then the medium was added with 1 mM/L IPTG (Millipore, 420,322) for another 6 h to induce the expression of GST-HSPA8. The bacteria were collected, lysed with a lysis buffer (Millipore, 70,584–3) and the GST-HSPA8 was purified with glutathione agarose beads (Molecular Cloning Laboratories, GAB-200).
Binding and uptake assay
The assay was carried out as we and others have previously described [Citation30,Citation32]. Briefly, cells lysates derived from MARCHF5-Flag overexpressed HEK293T cells, purified MARCHF5-Flag or RNASE (Sigma-Aldrich, R5500) were incubated with freshly enriched lysosomes and purified GST-HSPA8 in a reaction buffer (10 mM 3-[N-morpholino] propane sulfonic acid (Sigma-Aldrich, M1254), 0.3 M sucrose, pH 7.4) for 20 min at 37°C. After that, the lysosomes were recovered by centrifuging the sample at 16,000 g for 5 min and washed 4 times with the reaction buffer. The lysosomes were resolved with SDS loading buffer for immunoblot analysis.
Image capture and analysis
Confocal microscopy
SN4741 cells transfected with mito-RFP or MYC-LAMP2A plasmids and treated as indicated were fixed with 2% PFA at room temperature (RT) for 15 min, and then stained with indicated antibodies and detected with the A1 confocal microscopy (Nikon, Tokyo, Japan) using a 60× oil immersion objective. Z-stack covering the whole depth of cells was acquired with an interval of 0.4 μM and maximum projections are shown in the indicated figures. Mitochondrial shape descriptors and size measurements were calculated as previously reported using the ImageJ software [Citation64]. At least 30 cells from 2 independent experiments were analyzed in each group.
Transmission electron microscopy
Mouse brain tissues containing SNc region were fixed with 2.5% glutaraldehyde (SPI supplies, 02607-BA) at RT for 2 h and washed 3 times with the 0.1 M phosphate buffer (KH2PO4 [Sigma-Aldrich, P0662], Na2HPO4 [Sigma-Aldrich, S9763], pH 7.4). Then the tissues were post-fixed in 1% osmium tetroxide (SPI supplies, 02595-BA) at RT for another 2 h and washed with the phosphate buffer again. Brain tissues were dehydrated in 50%, 70% and 90% ethanol successively, followed by a 45% ethanol and 45% acetone mixture and then 90% acetone (for 20 min in each solution at 4°C). After that, the brain tissues were dehydrated in 100% acetone for another 20 min at RT. Then the tissues were embedded in epoxy resin (SPI supplies, 02659-AB) and solidified sequentially. Serial ultrathin sections (70 nm in depth) of SNc regions were collected and stained in a solution containing 3% uranyl acetate and lead citrate. The mitochondria of SNc neurons were observed with JEM-1230 transmission electron microscopy (Japan Electron Optics Laboratory, Tokyo, Japan) and images were captured via a CCD camera (Olympus, Tokyo, Japan). Mitochondrial morphology parameters were obtained using the ImageJ software.
Mitochondrial membrane potential (MMP) detection
The MMP was detected via tetramethylrhodamine ethyl ester perchlorate (TMRE) staining as previously reported [Citation65]. The TMRE dye (Invitrogen, T669) was diluted with DMSO (MP Biomedicals, 196,055) to a final concentration of 150 μM. Remove the medium of SN4741 cells and washed the cells gently with HBSS. Harvest and resuspend cells at 5 × 10⁵ cells/ml in culture medium containing 150 nM TMRE, incubating for 5 min at room temperature. Washed the cells with PBS and then analyzed cells with a BD FACSCalibur flow cytometer (BD Biosciences, CA, USA). Cells with no TMRE dye or treated with carbonyl cyanide 4-(trifluoromethoxy) phenylhydrazone (FCCP; Sigma-Aldrich, C2920) (2 μM) were also included as negative controls. The results from 3 independent experiments were analyzed using the Flowjo 7.6.1 software.
Cell mito-stress analysis
SN4741 cells were seeded on a a 24-well XF microplate (Agilent Technologies Inc, CA, USA) and treated as indicated. The oxygen consumption rate (OCR) of cells was then detected with the Seahorse XF24 analyzer (Agilent Technologies Inc, CA, USA) according to the manufacture’s protocol. During the process, oligomycin (1 μM), FCCP (1.5 μM), antimycin A and rotenone (2 μM) (Seahorse XF Cell Mito-stress Test Kit; Agilent Technologies Inc, 103,015–100) were added at indicated time points. OCR was recorded as pMoles per minute and analyzed using the Wave Desktop Software and Mito stress test reporter generator (Agilent Technologies Inc, CA, USA).
ATP detection
Cellular ATP level was measured using the ATP detection kit (Beyotime, S0026) according to the manufacture’s protocol with a Luminescence Single-Mode Microplate Readers (Molecular Devices, CA, USA).
Stereotaxic injection
All in vivo studies were conducted according to the Guidelines for Animal Care and Use of the Fourth Military Medical University (Xi’an, People’s Republic of China). Efforts were made to minimize animal suffering. 8-week-old male Stopf-Lamp2a or TH-Cre::Stopf-Lamp2a C57BL/6 mice were assigned to the vehicle or 6-OHDA lesion groups. 6-OHDA-induced mouse PD model was created as we have described previously [Citation37]. The mice were anesthetized with 1.5% isoflurane (RWD Life Science, R510-22-4). 6-OHDA (3 μg) or equal volumes of saline were then injected into the left substantia nigra pars compacta (SNc, AP: −1.2 mm, ML: −1.1 mm, and DV: −5 mm relative to Bregma) at a rate of 0.1 μl/min. The mice were killed after 7 days following injection. Brains were removed for mitochondria enrichment, immunoblot, confocal microscopy and electron microscopy analysis as indicated in this study.
Statistical analysis
All data are shown as mean ± standard error of mean (S.E.M). Two-tailed Student’s t test, and one-way or two-way ANOVA followed by Dunn’s or Turkey’s multiple comparison tests were employed to compare values among different experimental groups as indicated in . Kruskal–Wallis tests followed by Dunn’s test were used to compare mitochondrial aspect ratio, circularity and number between groups in . Statistical comparison and graphs generation were performed with the GraphPad Prism 6 software, and P < 0.05 was considered statistically significant. The P values were assigned as P < 0.05*, < 0.01**.
Supplemental Material
Download Zip (9 MB)Acknowledgments
The authors thank Dr. Yuqiang Ding (State Key Laboratory of Medical Neurobiology and MOE Frontiers Center for Brain Science, Institutes of Brain Science, Fudan University, Shanghai, China) for providing the TH-Cre transgenic mouse and Dr. Quan Chen (State Key Laboratory of Membrane Biology, Institute of Zoology, Chinese Academy of Sciences, Beijing, China) for providing MARCHF5 constructs.
Disclosure statement
The authors declare no potential conflict of interests.
Supplemental material
Supplemental data for this article can be accessed here
Additional information
Funding
Related Research Data
References
- Chan DC. Mitochondria: dynamic organelles in disease, aging, and development. Cell. 2006;125(7):1241–1252.
- Martinou JC, Youle RJ. Mitochondria in apoptosis: Bcl-2 family members and mitochondrial dynamics. Dev Cell. 2011;21(1):92–101.
- Rizzuto R, De Stefani D, Raffaello A, et al. Mitochondria as sensors and regulators of calcium signalling. Nat Rev Mol Cell Biol. 2012;13(9):566–578. DOI:https://doi.org/10.1038/nrm3412
- Burte F, Carelli V, Chinnery PF, et al. Disturbed mitochondrial dynamics and neurodegenerative disorders. Nat Rev Neurol. 2015;11(1):11–24.
- Gomez-Lazaro M, Bonekamp NA, Galindo MF, et al. 6-Hydroxydopamine (6-OHDA) induces Drp1-dependent mitochondrial fragmentation in SH-SY5Y cells. Free Radic Biol Med. 2008;44(11):1960–1969. DOI:https://doi.org/10.1016/j.freeradbiomed.2008.03.009
- Martin LJ, Pan Y, Price AC, et al. Parkinson’s disease alpha-synuclein transgenic mice develop neuronal mitochondrial degeneration and cell death. J Neurosci. 2006;26(1):41–50. DOI:https://doi.org/10.1523/JNEUROSCI.4308-05.2006
- Matsuda N, Sato S, Shiba K, et al. PINK1 stabilized by mitochondrial depolarization recruits Parkin to damaged mitochondria and activates latent Parkin for mitophagy. J Cell Biol. 2010;189(2):211–221. DOI:https://doi.org/10.1083/jcb.200910140
- Solesio ME, Prime TA, Logan A, et al. The mitochondria-targeted anti-oxidant MitoQ reduces aspects of mitochondrial fission in the 6-OHDA cell model of Parkinson’s disease. Biochim Biophys Acta. 2013;1832(1):174–182. DOI:https://doi.org/10.1016/j.bbadis.2012.07.009
- Youle RJ, van der Bliek AM. Mitochondrial fission, fusion, and stress. Science. 2012;337(6098):1062–1065.
- Koshiba T, Detmer SA, Kaiser JT, et al. Structural basis of mitochondrial tethering by mitofusin complexes. Science. 2004;305(5685):858–862. DOI:https://doi.org/10.1126/science.1099793
- Olichon A, Baricault L, Gas N, et al. Loss of OPA1 perturbates the mitochondrial inner membrane structure and integrity, leading to cytochrome c release and apoptosis. J Biol Chem. 2003;278(10):7743–7746. DOI:https://doi.org/10.1074/jbc.C200677200
- Cereghetti GM, Stangherlin A, de Brito OM, et al. Dephosphorylation by calcineurin regulates translocation of Drp1 to mitochondria. Proc Natl Acad Sci U S A. 2008;105(41):15803–15808. DOI:https://doi.org/10.1073/pnas.0808249105
- Chen H, Chomyn A, Chan DC. Disruption of fusion results in mitochondrial heterogeneity and dysfunction. J Biol Chem. 2005;280(28):26185–26192.
- Twig G, Elorza A, Molina AJA, et al. Fission and selective fusion govern mitochondrial segregation and elimination by autophagy. EMBO J. 2008;27(2):433–446. DOI:https://doi.org/10.1038/sj.emboj.7601963
- Altanbyek V, Cha S-J, Kang G-U, et al. Imbalance of mitochondrial dynamics in Drosophila models of amyotrophic lateral sclerosis. Biochem Biophys Res Commun. 2016;481(3–4):259–264. DOI:https://doi.org/10.1016/j.bbrc.2016.10.134
- Grohm J, Kim S-W, Mamrak U, et al. Inhibition of Drp1 provides neuroprotection in vitro and in vivo. Cell Death Differ. 2012;19(9):1446–1458. DOI:https://doi.org/10.1038/cdd.2012.18
- Wang X, Su B, Lee H-G, et al. Impaired balance of mitochondrial fission and fusion in Alzheimer’s disease. J Neurosci. 2009;29(28):9090–9103. DOI:https://doi.org/10.1523/JNEUROSCI.1357-09.2009
- Wang W, Wang X, Fujioka H, et al. Parkinson’s disease-associated mutant VPS35 causes mitochondrial dysfunction by recycling DLP1 complexes. Nat Med. 2016;22(1):54–63.
- Wang X, Yan MH, Fujioka H, et al. LRRK2 regulates mitochondrial dynamics and function through direct interaction with DLP1. Hum Mol Genet. 2012;21(9):1931–1944.
- Yang Y, Ouyang Y, Yang L, et al. Pink1 regulates mitochondrial dynamics through interaction with the fission/fusion machinery. Proc Natl Acad Sci U S A. 2008;105(19):7070–7075. DOI:https://doi.org/10.1073/pnas.0711845105
- Kaushik S, Cuervo AM. The coming of age of chaperone-mediated autophagy. Nat Rev Mol Cell Biol. 2018;19(6):365–381.
- Cuervo AM, Wong E. Chaperone-mediated autophagy: roles in disease and aging. Cell Res. 2014;24(1):92–104.
- Jiang P, Mizushima N. Autophagy and human diseases. Cell Res. 2014;24(1):69–79.
- Kaushik S, Cuervo AM. Degradation of lipid droplet-associated proteins by chaperone-mediated autophagy facilitates lipolysis. Nat Cell Biol. 2015;17(6):759–770.
- Orenstein SJ, Kuo S-H, Tasset I, et al. Interplay of LRRK2 with chaperone-mediated autophagy. Nat Neurosci. 2013;16(4):394–406. DOI:https://doi.org/10.1038/nn.3350
- Zhang C, Cuervo AM. Restoration of chaperone-mediated autophagy in aging liver improves cellular maintenance and hepatic function. Nat Med. 2008;14(9):959–965.
- Alvarez-Erviti L, Rodriguez-Oroz MC, Cooper JM, et al. Chaperone-mediated autophagy markers in Parkinson disease brains. Arch Neurol. 2010;67(12):1464–1472. DOI:https://doi.org/10.1001/archneurol.2010.198
- Cuervo AM, Stefanis L, Fredenburg R, et al. Impaired degradation of mutant alpha-synuclein by chaperone-mediated autophagy. Science. 2004;305(5688):1292–1295. DOI:https://doi.org/10.1126/science.1101738
- Yang Q, She H, Gearing M, et al. Regulation of neuronal survival factor MEF2D by chaperone-mediated autophagy. Science. 2009;323(5910):124–127. DOI:https://doi.org/10.1126/science.1166088
- Wang B, Cai Z, Tao K, et al. Essential control of mitochondrial morphology and function by chaperone-mediated autophagy through degradation of PARK7. Autophagy. 2016;12(8):1215–1228. DOI:https://doi.org/10.1080/15548627.2016.1179401
- Yonashiro R, Ishido S, Kyo S, et al. A novel mitochondrial ubiquitin ligase plays a critical role in mitochondrial dynamics. EMBO J. 2006;25(15):3618–3626. DOI:https://doi.org/10.1038/sj.emboj.7601249
- Li W, Zhu J, Dou J, et al. Phosphorylation of LAMP2A by p38 MAPK couples ER stress to chaperone-mediated autophagy. Nat Commun. 2017;8(1):1763. DOI:https://doi.org/10.1038/s41467-017-01609-x
- Kirchner P, Bourdenx M, Madrigal-Matute J, et al. Proteome-wide analysis of chaperone-mediated autophagy targeting motifs. PLoS Biol. 2019;17(5):e3000301. DOI:https://doi.org/10.1371/journal.pbio.3000301
- Cherok E, Xu S, Li S, et al. Novel regulatory roles of Mff and Drp1 in E3 ubiquitin ligase MARCH5-dependent degradation of MiD49 and Mcl1 and control of mitochondrial dynamics. Mol Biol Cell. 2017;28(3):396–410. DOI:https://doi.org/10.1091/mbc.e16-04-0208
- Karbowski M, Neutzner A, Youle RJ. The mitochondrial E3 ubiquitin ligase MARCH5 is required for Drp1 dependent mitochondrial division. J Cell Biol. 2007;178(1):71–84.
- Nakamura N, Kimura Y, Tokuda M, et al. MARCH-V is a novel mitofusin 2- and Drp1-binding protein able to change mitochondrial morphology. EMBO Rep. 2006;7(10):1019–1022. DOI:https://doi.org/10.1038/sj.embor.7400790
- Gao L, She H, Li W, et al. Oxidation of survival factor MEF2D in neuronal death and Parkinson’s disease. Antioxid Redox Signal. 2014;20(18):2936–2948. DOI:https://doi.org/10.1089/ars.2013.5399
- Blandini F, Armentero MT. Animal models of Parkinson’s disease. FEBS J. 2012;279(7):1156–1166.
- Geisler S, Holmström KM, Skujat D, et al. PINK1/Parkin-mediated mitophagy is dependent on VDAC1 and p62/SQSTM1. Nat Cell Biol. 2010;12(2):119–131. DOI:https://doi.org/10.1038/ncb2012
- Liu L, Feng D, Chen G, et al. Mitochondrial outer-membrane protein FUNDC1 mediates hypoxia-induced mitophagy in mammalian cells. Nat Cell Biol. 2012;14(2):177–185. DOI:https://doi.org/10.1038/ncb2422
- Fang L, Hemion C, Goldblum D, et al. Inactivation of MARCH5 prevents mitochondrial fragmentation and interferes with cell death in a neuronal cell model. PLoS One. 2012;7(12):e52637. DOI:https://doi.org/10.1371/journal.pone.0052637
- Fang L, Li J, Flammer J, et al. MARCH5 inactivation supports mitochondrial function during neurodegenerative stress. Front Cell Neurosci. 2013;7:176.
- Koyano F, Yamano K, Kosako H, et al. Parkin recruitment to impaired mitochondria for nonselective ubiquitylation is facilitated by MITOL. J Biol Chem. 2019;294(26):10300–10314. DOI:https://doi.org/10.1074/jbc.RA118.006302
- Xu S, Cherok E, Das S, et al. Mitochondrial E3 ubiquitin ligase MARCH5 controls mitochondrial fission and cell sensitivity to stress-induced apoptosis through regulation of MiD49 protein. Mol Biol Cell. 2016;27(2):349–359. DOI:https://doi.org/10.1091/mbc.e15-09-0678
- Chen Z, Liu L, Cheng Q, et al. Mitochondrial E3 ligase MARCH 5 regulates FUNDC 1 to fine-tune hypoxic mitophagy. EMBO Rep. 2017;18(3):495–509. DOI:https://doi.org/10.15252/embr.201643309
- Kim S-H, Park -Y-Y, Yoo Y-S, et al. Self-clearance mechanism of mitochondrial E3 ligase MARCH5 contributes to mitochondria quality control. FEBS J. 2016;283(2):294–304. DOI:https://doi.org/10.1111/febs.13568
- Tang FL, Erion JR, Tian Y, et al. VPS35 in dopamine neurons is required for endosome-to-golgi retrieval of Lamp2a, a receptor of chaperone-mediated autophagy that is critical for alpha-synuclein degradation and prevention of pathogenesis of Parkinson’s disease. J Neurosci. 2015;35(29):10613–10628. DOI:https://doi.org/10.1523/JNEUROSCI.0042-15.2015
- Kabuta T, Furuta A, Aoki S, et al. Aberrant interaction between Parkinson disease-associated mutant UCH-L1 and the lysosomal receptor for chaperone-mediated autophagy. J Biol Chem. 2008;283(35):23731–23738. DOI:https://doi.org/10.1074/jbc.M801918200
- Terlecky SR, Chiang HL, Olson TS, et al. Protein and peptide binding and stimulation of in vitro lysosomal proteolysis by the 73-kDa heat shock cognate protein. J Biol Chem. 1992;267(13):9202–9209.
- Ferreira JV, Rosa Soares A, Silva Ramalho J, et al. K63 linked ubiquitin chain formation is a signal for HIF1A degradation by Chaperone-Mediated Autophagy. Sci Rep. 2015;5:10210.
- Kaushik S, Cuervo AM. Chaperone-mediated autophagy: a unique way to enter the lysosome world. Trends Cell Biol. 2012;22(8):407–417.
- Wong YC, Ysselstein D, Krainc D. Mitochondria-lysosome contacts regulate mitochondrial fission via RAB7 GTP hydrolysis. Nature. 2018;554(7692):382–386.
- Koyano F, Yamano K, Kosako H, et al. Parkin-mediated ubiquitylation redistributes MITOL/March5 from mitochondria to peroxisomes. EMBO Rep. 2019;20(12):e47728. DOI:https://doi.org/10.15252/embr.201947728
- Campbell P, Morris H, Schapira A. Chaperone-mediated autophagy as a therapeutic target for Parkinson disease. Expert Opin Ther Targets. 2018;22(10):823–832.
- Manczak M, Kandimalla R, Fry D, et al. Protective effects of reduced dynamin-related protein 1 against amyloid beta-induced mitochondrial dysfunction and synaptic damage in Alzheimer’s disease. Hum Mol Genet. 2016;25(23):5148–5166.
- Song W, Chen J, Petrilli A, et al. Mutant huntingtin binds the mitochondrial fission GTPase dynamin-related protein-1 and increases its enzymatic activity. Nat Med. 2011;17(3):377–382. DOI:https://doi.org/10.1038/nm.2313
- Luo G, Yi J, Ma C, et al. Defective mitochondrial dynamics is an early event in skeletal muscle of an amyotrophic lateral sclerosis mouse model. PLoS One. 2013;8(12):e82112. DOI:https://doi.org/10.1371/journal.pone.0082112
- Xilouri M, Brekk OR, Landeck N, et al. Boosting chaperone-mediated autophagy in vivo mitigates alpha-synuclein-induced neurodegeneration. Brain. 2013;136(Pt 7):2130–2146. DOI:https://doi.org/10.1093/brain/awt131
- Cuervo AM, Hu W, Lim B, et al. IkappaB is a substrate for a selective pathway of lysosomal proteolysis. Mol Biol Cell. 1998;9(8):1995–2010.
- Hu MM, Yang Q, Xie X-Q, et al. Sumoylation promotes the stability of the DNA sensor cGAS and the adaptor STING to regulate the kinetics of response to DNA virus. Immunity. 2016;45(3):555–569. DOI:https://doi.org/10.1016/j.immuni.2016.08.014
- Valdor R, Mocholi E, Botbol Y, et al. Chaperone-mediated autophagy regulates T cell responses through targeted degradation of negative regulators of T cell activation. Nat Immunol. 2014;15(11):1046–1054. DOI:https://doi.org/10.1038/ni.3003
- Wang X, Li Y, Xu G, et al. Mechanism study of peptide GMBP1 and its receptor GRP78 in modulating gastric cancer MDR by iTRAQ-based proteomic analysis. BMC Cancer. 2015;15:358.
- Chinopoulos C, Zhang SF, Thomas B, et al. Isolation and functional assessment of mitochondria from small amounts of mouse brain tissue. Methods Mol Biol. 2011;793:311–324.
- Picard M, White K, Turnbull DM. Mitochondrial morphology, topology, and membrane interactions in skeletal muscle: a quantitative three-dimensional electron microscopy study. J Appl Physiol (1985). 2013;114(2):161–171.
- Crowley LC, Christensen ME, Waterhouse NJ. Measuring mitochondrial transmembrane potential by TMRE staining. Cold Spring Harb Protoc. 2016;2016(12):pdb.prot087361.