
ABSTRACT
Mitochondrial quality control, which is crucial for maintaining cellular homeostasis, has been considered to be achieved exclusively through mitophagy. Here we report an alternative mitochondrial quality control pathway mediated by extracellular mitochondria release. By performing time-lapse confocal imaging on a stable cell line with fluorescent-labeled mitochondria, we observed release of mitochondria from cells into the extracellular space. Correlative light-electron microscopy revealed that majority of the extracellular mitochondria are in free form and, on rare occasions, some are enclosed in membrane-surrounded vesicles. Rotenone- and carbonyl cyanide m-chlorophenylhydrazone-induced mitochondrial quality impairment promotes the extracellular release of depolarized mitochondria. Overexpression of PRKN (parkin RBR E3 ubiquitin protein ligase), which has a pivotal role in mitophagy regulation, suppresses the extracellular mitochondria release under basal and stress condition, whereas its knockdown exacerbates it. Correspondingly, overexpression of PRKN-independent mitophagy regulators, BNIP3 (BCL2 interacting protein 3) and BNIP3L/NIX (BCL2 interacting protein 3 like), suppress extracellular mitochondria release. Autophagy-deficient cell lines show elevated extracellular mitochondria release. These results imply that perturbation of mitophagy pathway prompts mitochondria expulsion. Presence of mitochondrial protein can also be detected in mouse sera. Sera of PRKN-deficient mice contain higher level of mitochondrial protein compared to that of wild-type mice. More importantly, fibroblasts and cerebrospinal fluid samples from Parkinson disease patients carrying loss-of-function PRKN mutations show increased extracellular mitochondria compared to control subjects, providing evidence in a clinical context. Taken together, our findings suggest that extracellular mitochondria release is a comparable yet distinct quality control pathway from conventional mitophagy.
Abbreviations: ACTB: actin beta; ANXA5: annexin A5; ATP5F1A/ATP5A: ATP synthase F1 subunit alpha; ATG: autophagy related; BNIP3: BCL2 interacting protein 3; BNIP3L/NIX: BCL2 interacting protein 3 like; CCCP: carbonyl cyanide m-chlorophenylhydrazone; CM: conditioned media; CSF: cerebrospinal fluid; DMSO: dimethyl sulfoxide; EM: electron microscopy; HSPD1/Hsp60: heat shock protein family D (Hsp60) member 1; KD: knockdown; KO: knockout; MAP1LC3A/LC3: microtubule associated protein 1 light chain 3 alpha; MT-CO1: mitochondrially encoded cytochrome c oxidase I; NDUFB8: NADH:ubiquinone oxidoreductase subunit B8; OE: overexpression; OPA1: OPA1 mitochondrial dynamin like GTPase; OXPHOS: oxidative phosphorylation; PBS: phosphate-buffered saline; PB: phosphate buffer; PD: Parkinson disease; PINK1: PTEN induced kinase 1; PRKN: parkin RBR E3 ubiquitin protein ligase; RB1CC1/FIP200: RB1 inducible coiled-coil 1; SDHB: succinate dehydrogenase complex iron sulfur subunit B; TOMM20: translocase of outer mitochondrial membrane 20; TOMM40: translocase of outer mitochondrial membrane 40; UQCRC2: ubiquinol-cytochrome c reductase core protein 2; WT: wild-type
Introduction
Mitochondria comprise the intracellular core due to their involvement in ATP production by oxidative phosphorylation, lipid metabolism assembly, regulation of homeostasis and programmed cell death [Citation1–3]. Mitochondrial quality control system is essential for the maintenance of mitochondrial function and cell health. It is widely recognized that cells degrade their damaged mitochondria through a process called mitophagy. The canonical pathway of mitophagy involves Parkinson disease (PD)-related proteins, PINK1 (PTEN induced kinase 1) and PRKN (parkin RBR E3 ubiquitin protein ligase). PINK1 recruits the E3 ubiquitin ligase PRKN to depolarized mitochondria, where it ubiquitinates several target proteins on the outer mitochondrial membrane and, subsequently, promotes their autophagic degradation [Citation4–6].
Recent studies have shown mitochondria can be transferred out of cells into the extracellular space and can cross cell boundaries, challenging the existing concept [Citation7–14]. While the phenomenon has been reported, the precise initiation factors remain unclear. Interestingly, a study reported that large numbers of mitochondria are shed from neurons to be degraded by the lysosomes of adjoining glial cells [Citation7]. Likewise, mesenchymal stem cells secrete mitochondria to outsource mitophagy to macrophages [Citation12]. These findings bring into the question if the transmitophagy process takes place when cells fail to effectively degrade their own organelles.
In this study, we asked if the ability of cells to release mitochondria represents an alternate pathway to clear mitochondria out of cells under mitochondrial stress. We also explored how extracellular mitochondria release cooperatively works with mitophagy to keep mitochondrial homeostasis. Using mitochondrial toxin treatment and genetic manipulation approaches targeting several mitophagy- and autophagy-related genes, we found that mitochondrial stress and perturbation of mitophagy pathway induced greater extracellular mitochondria release, which represents an alternative option for mitochondrial quality control as depolarized mitochondria are predominantly released. Importantly, sera of PRKN-deficient mice contained greater amount of mitochondrial proteins compared to that of wild-type (WT) mice. In clinical context, fibroblasts and cerebrospinal fluid (CSF) samples from PD patients carrying PRKN mutation showed increased extracellular mitochondria release compared to control subjects, suggesting that impairment of mitochondrial quality control pathways may underlie the pathogenesis of PD.
Results
Extracellular release of mitochondria
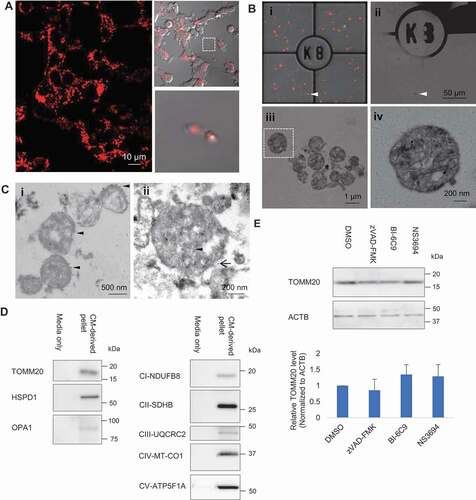
To corroborate the phenomenon of mitochondria release from cells, we performed time-lapse confocal imaging that enables the capture of dynamic events on a stable cell line PC12DsRed2mito with fluorescent-labeled mitochondria. We observed release of mitochondria from cells into the extracellular space ( and Video S1). For fine structural analysis by correlative light-electron microscopy (CLEM), we used a hanging cell culture insert system, which allows the separation of released extracellular particles from the cell monolayer cultured on the insert membrane and the large debris from dead cells (Fig. S1A,B). Extracellular particles in the lower compartment of well were attached to a coated gridded coverslip. Light microscopy images of particles of interest were acquired and the coverslip coordinates were recorded using phase contrast, aiding location of target particles during the later stages of analysis (,ii). CLEM revealed that the majority of the extracellular mitochondria were in free naked form and contained subcellular mitochondrial structures, including the typical cristae and small matrix granules (iii,iv). Immuno-EM performed on the conditioned media (CM)-derived pellet showed positive labeling of some particles with the mitochondrial outer membrane marker, TOMM20 (translocase of outer mitochondrial membrane 20), as indicated by the 10-nm gold particles (). Double-label immuno-EM showed colocalization of TOMM20 and mRFP (). Importantly, western blot analysis revealed that CM-derived pellet contained detectable level of TOMM20. In addition to TOMM20, inner mitochondrial membrane markers complex I NDUFB8 (NADH:ubiquinone oxidoreductase subunit B8), complex II SDHB (succinate dehydrogenase complex iron sulfur subunit B), complex III UQCRC2 (ubiquinol-cytochrome c reductase core protein 2), complex IV MT-CO1 (mitochondrially encoded cytochrome c oxidase I), complex V ATP5F1A/ATP5A (ATP synthase F1 subunit alpha), mitochondrial matrix marker HSPD1/Hsp60 (heat shock protein family D (Hsp60) member 1) and mitochondrial intermembrane space marker OPA1 (OPA1 mitochondrial dynamin like GTPase) were detected in the CM-derived pellet (). To rule out the possible effects of apoptosis on extracellular mitochondria release, cells were incubated with apoptosis inhibitors including pan caspase inhibitor zVAD-FMK, tbid inhibitor BI-6C9, and apoptosome inhibitor NS3694. These inhibitors did not significantly affect the level of TOMM20 in CM-derived pellet, indicating that apoptosis does not contribute to the release of mitochondria in basal state (). In rare cases, by CLEM, we also observed extracellular mitochondrion enclosed by membrane as in vesicle (Fig. S1C). Relatedly, detailed scrutiny at cellular level revealed mitochondria were incorporated into surface bleb, which could bud directly from the plasma membrane into extracellular environment (Fig. S1D). Overall, free mitochondria constituted 97.4% of the total extracellular mitochondria (Fig. S1E). To further confirm the presence of mitochondria in the CM-derived pellet, we performed shotgun proteomics analysis comparing the CM-derived pellet with mitochondria fraction isolated from cells and found 56.4% and 84.1% similarities of overall proteins and mitochondrial related proteins, respectively, between the samples (Fig. S1F-H). Gene ontology by cell component analysis indicated that the identified proteins were more highly enriched in mitochondria but several non-mitochondrial proteins including endoplasmic reticulum, ribosomes, Golgi apparatus and endosomes were also detected (Fig. S1I,J).
Figure 1. Extracellular release of mitochondria. (A) Time-lapse confocal imaging on PC12DsRed2mito showed release of extracellular mitochondria from cells. (B) Extracellular mitochondria studied by CLEM. (i–ii) Merged image of fluorescence and brightfield was acquired to visualize the grid and locate the DsRed2mito-labeled particle (arrowhead) at EM level. (ii) Scanned area (arrowhead) became dark. (iii) Zoomed-in view of the scanned area showing most extracellular DsRed2mito-labeled particles are free mitochondria. (iv) Magnified view showing typical cristae and small matrix granules in a morphological intact mitochondrion (boxed area in Biii). (C)(I) Immuno EM showing some particles are TOMM20-positive (arrowhead) as indicated by 10 nm colloidal gold particles. (ii) Immuno-gold detection of mRFP (arrowhead, 6 nm colloidal gold) and TOMM20 (black arrow, 12 nm colloidal gold) showing double-positive labeling. (D) Western blot analysis confirming presence of TOMM20, HSPD1, OPA1, CI-NDUFB8, CII-SDHB, CIII-UQCRC2, CIV-MT-CO1, CV-ATP5F1A in CM-derived pellet. (E) Effect of apoptosis inhibitors on the TOMM20 level in CM-derived pellet. One-way ANOVA, Dunnett’s test, n = 3 for each group
Rotenone- and CCCP-induced mitochondrial quality impairment promotes extracellular release of mitochondria
We next examined how the induction of mitochondrial damage affects the extent of extracellular release of mitochondria. Rotenone, a mitochondrial electron transport chain complex I inhibitor, and carbonyl cyanide m-chlorophenylhydrazone (CCCP), a mitochondrial uncoupler, were used to induce mitochondrial quality impairment. Treatment of rotenone and CCCP was conducted for a short duration (4 h) at a concentration not causing evident cell death, as confirmed by LDH assay (Fig. S2A). Automated microscopic-based quantification of overall extracellular contents showed higher number of particles being released by rotenone- and CCCP-treated cells, compared to control. The number of DsRed2-labeled mitochondria was around one-tenth of the total number of extracellular particles (Fig. S2B,C). Upon rotenone and CCCP treatment, the number of extracellular mitochondria released by PC12DsRed2mito was significantly elevated (DMSO vs Rotenone p = 0.022, DMSO vs CCCP p = 0.004) (). Additionally, western blot analysis of CM-derived pellet showed a significant increase of TOMM20, ATP5F1A and HSPD1 relative to ACTB (actin beta) in the rotenone- and CCCP-treated samples compared to control (TOMM20: p = 0.025, 0.017, for DMSO vs rotenone, and DMSO vs CCCP, respectively; ATP5F1A: p = 0.019, 0.016, for DMSO vs rotenone, and DMSO vs CCCP, respectively; HSPD1: p = 0.035, 0.011, for DMSO vs rotenone, DMSO vs CCCP, respectively) (, Fig. S2D,E). To eliminate the possibility that apoptosis as a cause of the increase of extracellular mitochondria, we compared the level of ANXA5 (annexin A5), a marker of apoptotic body, and found no differences among groups ( and S2E). Furthermore, there was no significant change in intracellular TOMM20, ATP5F1A, HSPD1 levels following rotenone and CCCP treatment, but a trend of slight decrease was observed ( and S2E).
Figure 2. Rotenone- and CCCP-induced mitochondrial quality impairment promotes extracellular release of mitochondria. (A) Microscopy analysis of number of extracellular mitochondria upon DMSO, rotenone and CCCP treatment. (B) Western blotting analysis showing mitochondrial proteins TOMM20, CV-ATP5F1A and HSPD1 relative to ACTB and ANXA5 level in pelleted samples and cell lysates. (C) Confocal images of JC10 fluorescence in control, rotenone- and CCCP-treated cells. (D) Images were processed for determination of aggregate:monomer (red:green) fluorescent intensity ratio, reflective of Ψm. Rotenone and CCCP caused mitochondrial depolarization. (E) JC10 fluorescence of extracellular mitochondria released upon DMSO, rotenone and CCCP treatment. (F) Quantification of total number of healthy and depolarized mitochondria released by DMSO-, rotenone- and CCCP-treated cells. Rotenone and CCCP increased release of depolarized mitochondria in a selective manner. One-way ANOVA, Dunnett’s test, n ≥ 3 for each group, * p < 0.05. (G) Electron micrographs revealing rotenone and CCCP samples contained more damaged mitochondria with disorganization or disappearance of cristae compared to control
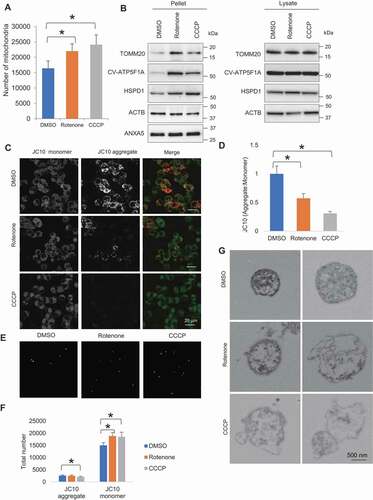
To study the quality state of released mitochondria, we performed mitochondrial membrane potential assay using JC10, a cationic dye capable of selectively entering mitochondria, and reversibly changes its color from green to orange as membrane potentials increase. At low concentrations due to low mitochondrial membrane potential, JC10 exists in monomeric form and yields green fluorescence. While at high concentrations due to high mitochondrial membrane potential, the dye aggregates yielding a red-colored emission. The change of mitochondrial membrane potential was measured as the ratio between aggregate and monomeric forms of JC10. We found both rotenone and CCCP induced a decline of intracellular aggregate fluorescent intensity, indicative of mitochondrial depolarization (DMSO vs rotenone p < 0.001; DMSO vs CCCP p < 0.001) (). Intriguingly, the extracellular mitochondria comprised predominantly depolarized mitochondria rather than healthy ones. Upon rotenone- and CCCP-induced mitochondrial stress, cells increased release of depolarized mitochondria in a selective manner with only CCCP-treated cells showing a decrease in the release of healthy mitochondria (JC10 monomer: p = 0.017, 0.049, for DMSO vs rotenone and DMSO vs CCCP, respectively; JC10 aggregate: p = 0.007 for DMSO vs CCCP) (). CLEM analysis of the released mitochondria further revealed rotenone and CCCP samples contained more mitochondria with swollen appearance, destroyed internal structures with cristae deranged or absent, compared to control (). These results suggest that rotenone- and CCCP-induced mitochondrial stress selectively augments release of depolarized mitochondria.
Mitophagy regulators modulate extracellular mitochondria release
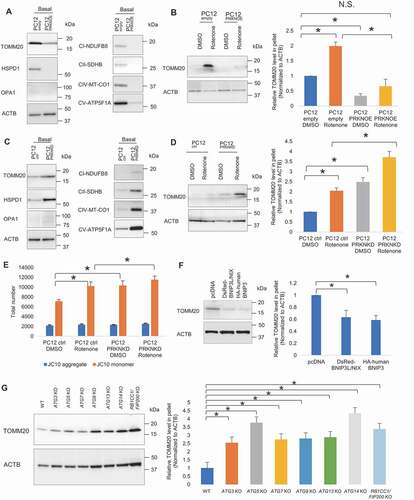
To address how extracellular release of damaged mitochondria cooperatively works with intracellular mitophagy system, we examined the effect of upregulation and downregulation of PRKN, a key regulator of mitophagy, on extracellular release of mitochondria. First, we established stable PC12 cell lines with PRKN overexpression (hereinafter referred to as PC12PRKNOE) and PRKN knockdown (hereinafter referred to as PC12PRKNKD) along with their respective controls, PC12empty and PC12ctrl (Fig. S3A-C). Cells were subjected to 24 h of extended non-treated condition and 4 h of brief DMSO and rotenone treatment for respective assessment at basal and stress states. Western blot analysis showed pellet derived from CM of PC12PRKNOE contained reduced TOMM20, HSPD1, OPA1, NDUFB8, SDHB, MT-CO1 and ATP5F1A, indicative of lower extracellular mitochondria content, under extended non-treated condition, compared to control (TOMM20 p = 0.003; HSPD1, OPA1, NDUFB8, MT-CO1 and ATP5F1A p < 0.001; SDHB p = 0.003) ( and S3D). Brief rotenone treatment increased extracellular mitochondria level, but PRKN overexpression canceled such effect of rotenone (p = 0.006, 0.037 and 0.005, for PC12empty DMSO vs PC12empty rotenone, PC12empty DMSO vs PC12PRKNOE DMSO, PC12empty rotenone vs PC12PRKNOE rotenone, respectively) (). Conversely, there was an elevation of TOMM20, HSPD1, OPA1, NDUFB8, SDHB, MT-CO1 and ATP5F1A level in the CM-derived pellet of PC12PRKNKD under extended non-treated condition (TOMM20 p = 0.017; HSPD1 p = 0.030; OPA1 p = 0.032; NDUFB8 p = 0.031; SDHB p = 0.020; MT-CO1 p = 0.016; ATP5F1A p = 0.018) ( and S3E). Moreover, PRKN knockdown heightened rotenone-induced increase of TOMM20 level, indicating PRKN knockdown renders cells to greater extracellular mitochondria release relative to control (p = 0.020, 0.003, and 0.001, for PC12ctrl DMSO vs PC12ctrl rotenone, PC12ctrl DMSO vs PC12PRKNKD DMSO, and PC12ctrl rotenone vs PC12PRKNKD rotenone, respectively) ().
Figure 3. Mitophagy regulators modulate extracellular mitochondria release. (A) Representative western blot of TOMM20, HSPD1, OPA1, CI-NDUFB8, CII-SDHB, CIV-MT-CO1 and CV-ATP5F1A relative to ACTB in CM-derived pellet collected following extended non-treated condition (24 h). (B) Representative western blot of TOMM20 in CM-derived pellet collected following brief DMSO and rotenone-treated condition (4 h). PRKN overexpression suppresses extracellular mitochondria release under extended non-treated condition (24 h) and brief DMSO and rotenone-treated condition (4 h). (C) PRKN knockdown elevates extracellular mitochondria release under extended non-treated condition (24 h) and (D) brief DMSO and rotenone-treated condition (4 h). (E) Quantification of total number of healthy and depolarized mitochondria released by DMSO and rotenone-treated control and PRKN knockdown cells. One-way ANOVA, Tukey’s test, n = 3 for each group, * p < 0.05. (F) Representative western blot and densitometry showing TOMM20 relative to ACTB in CM-derived pellet of control, BNIP3L/NIX and BNIP3 overexpressing PC12 cells following extended non-treated condition. (G) Representative western blot and densitometry showing TOMM20 relative to ACTB in CM-derived pellet of HeLa WT, ATG3 KO, ATG5 KO, ATG7 KO, ATG9 KO, ATG13 KO, ATG14 KO, RB1CC1/FIP200 KO cells following extended non-treated condition. One-way ANOVA, Dunnett’s test, n ≥ 3 for each group, * p < 0.05
For further validation, we transiently transfected PC12 cells with control siRNAs and siRNA directed against rat Prkn mRNA. Efficient downregulation of mRNA and protein were confirmed (Fig. S3F,G). Increased extracellular mitochondrial content can be observed in PC12 cells with PRKN downregulation (Fig. S3H,I). Furthermore, siRNA-mediated knockdown of PRKN was performed in two other cell models expressing endogenous PRKN: human dopaminergic neuronal SH-SY5Y cells (Fig. S3J) and human embryonic kidney cells 293 (HEK293) (Fig. S3L). Consistent with the knockdown data in PC12 cells, PRKN downregulation in SH-SY5Y and HEK293 cells resulted in an increase of extracellular mitochondria release, as reflected by the increased TOMM20 level in CM-derived pellet (Fig. S3J-M).
Mitophagy can be measured using fluorescent protein sensors targeted to mitochondria, that are sensitive to low pH and resistant to degradation by lysosomal hydrolases. To demonstrate that the alteration of PRKN level indeed influences mitophagy, mitochondria-targeted mKeima-Red, which has an emission spectrum that peaks at 620 nm and a bimodal excitation spectrum peaking at 440 and 586 nm, respectively corresponding to the neutral pH in the cytosol and low pH upon entry into acidic autolysosomes, was used [Citation15,Citation16]. Mito-mKeima-Red was expressed in cells prior to treatment with rotenone and CCCP. With this mitophagy reporter, we observed a significant increase of mitophagy puncta in PC12PRKNOE following rotenone and CCCP treatment (Fig. S4A,C). In contrast, downregulation of PRKN abolished the cell ability to induce mitophagy upon rotenone and CCCP-induced mitochondrial stress (Fig. S4B,D). Immunoblot of mitochondrial inner membrane proteins, oxidative phosphorylation (OXPHOS) complex subunits, performed on total protein lysate showed no distinct changes of the expression pattern in PC12PRKNOE cells but accumulation of MT-CO1 and NDUFB8 in PC12PRKNKD cells, indicating reduced mitophagy activation (Fig. S4E,F).
Having shown that selective release of depolarized mitochondria from cells takes place in response to mitochondrial stress, we sought to determine how disruption of PRKN-mediated mitophagy pathway impacted the quality of released mitochondria. As assessed by JC10 assay, PRKN downregulation markedly elicited release of depolarized mitochondria but had no effect on healthy mitochondria under basal and stress conditions (p = 0.010, 0.030, and 0.045, for PC12ctrl DMSO vs PC12ctrl rotenone, PC12ctrl DMSO vs PC12PRKNKD DMSO, and PC12ctrl rotenone vs PC12PRKNKD rotenone, respectively) ().
Although PRKN has received considerable attention as a key regulator of mitophagy in mammals, it is important to recognize that PRKN-independent pathways exist for the selective clearance of mitochondria. There are mitophagy receptors like BNIP3 (BCL2 interacting protein 3) and BNIP3L/NIX (BCL2 interacting protein 3 like) locating at the outer mitochondrial membrane which are able to directly bind MAP1LC3A/LC3 (microtubule associated protein 1 light chain 3 alpha)/GABARAP and trigger mitophagy without requiring protein ubiquitination or additional adaptors [Citation17–21].To examine the effect of PRKN-independent mitophagy on extracellular mitochondria release, we overexpressed BNIP3 and BNIP3L/NIX in PC12 cells (Fig. S3N) and found that the overexpression of BNIP3 and BNIP3L/NIX suppressed the release of extracellular mitochondria, as in the case of PRKN overexpression (pcDNA vs BNIP3 p = 0.004; pcDNA vs BNIP3L/NIX p = 0.008) (). Furthermore, as mitophagy utilizes the same core autophagy machinery [Citation22], we examined several autophagy-related gene deficient HeLa cell lines including ATG3, ATG5, ATG7, ATG9, ATG13, ATG14 and RB1CC1/FIP200 (RB1 inducible coiled-coil 1) knockout (KO) cells with confirmed loss of target protein (Fig. S3O) [Citation23] and found that ablation of these autophagy-related proteins markedly increased the level of mitochondria release (WT vs ATG3 KO p = 0.020; WT vs ATG5 KO p < 0.001; WT vs ATG7 KO p = 0.006; WT vs ATG9 KO p = 0.005; WT vs ATG13 KO p = 0.003; WT vs ATG14 KO p < 0.001; WT vs RB1CC1/FIP200 KO p < 0.001). These results suggest that the phenomenon of extracellular mitochondria release is not specific to PRKN-mediated mitophagy but rather a general reflection of the mitochondrial content in cells corresponding to mitophagy level ().
Collectively, these data indicate that extracellular release of mitochondria functions in parallel to mitophagy to maintain mitochondria homeostasis and, when mitophagy system appears to be impeded, it compensates for the inadequate mitophagy capacity.
Increased extracellular mitochondria release in patient-derived PRKN mutant fibroblasts
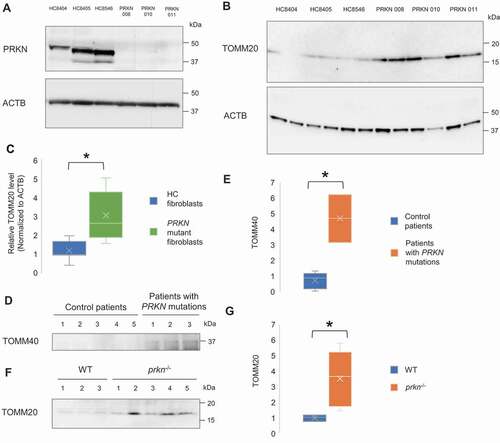
To probe clinical relevance of extracellular mitochondria release, human fibroblasts cultured from skin biopsies obtained from age-matched healthy control and PD patients carrying PRKN loss-of-function mutations were used. In order to determine how genetic mutations alters PRKN protein levels, we analyzed PRKN protein abundance in the skin fibroblasts of control subjects and PD patients with PRKN mutations by western blot and observed a near-complete loss of PRKN protein in patients-derived PRKN mutant fibroblasts, compared to controls (). Analogous to PRKN knockdown cells, patient-derived PRKN mutant fibroblasts showed greater extracellular mitochondria release compared to controls (p = 0.022) (). To further evaluate the association of extracellular mitochondria release in the central nervous system, CSF samples obtained from control patients and PD patients with PRKN mutations were assessed. Western blot analysis revealed a higher level of mitochondrial protein, TOMM40 (translocase of outer mitochondrial membrane 40), in the CSF samples of PD patients with PRKN mutations compared with control patients (p = 0.036) (). We also attempted detection of mitochondria using serum samples of control patients and PD patients with PRKN mutations. Serum TOMM20 level was slightly higher in the patients with PRKN mutations but the difference between groups was not significant (Fig. S4G). Interestingly, evaluation of the serum samples of age-matched WT and prkn−/- mice revealed a significant increase of TOMM20 in the samples of prkn−/- mice (p = 0.036) (). These results show that extracellular mitochondria are detectable in human and mouse samples, and cells derived from PD patients with PRKN mutations release more mitochondria, likely in compensation to the perturbation of PRKN-mediated mitophagy pathway.
Figure 4. Increased extracellular mitochondrial protein in the fibroblasts and CSF derived from PD patient with PRKN mutations and the sera from PRKN-deficient mice. (A) Representative western blot image of PRKN protein expression in primary skin fibroblasts of healthy control subjects (HC8404, HC8405, HC8546) and PD patients with PRKN mutations (PRKN 008, 010, 011). PRKN levels were undetectable in patient-derived PRKN mutant fibroblasts. (B and C) Western blotting and densitometry analysis showing increased level of extracellular mitochondrial protein TOMM20 relative to ACTB in patient-derived PRKN mutant fibroblasts. Mann Whitney Test, n = 3 for each group, * p < 0.05. (D and E) Western blotting and densitometry analysis showing increased level of mitochondrial protein TOMM40 in the CSF of patients with PRKN mutations. Mann Whitney Test, n = 5 for control group and n = 3 for patients with PRKN mutations group, * p < 0.05. (F and G) Western blotting and densitometry analysis showing increased level of mitochondrial protein TOMM20 in the sera of prkn−/- mice. Mann Whitney Test, n = 3 for WT group and n = 5 for prkn−/- group, * p < 0.05
Discussion
In the present work, we provide corroborating evidence for the phenomenon of mitochondria release by performing real time tracking of fluorescence-labeled mitochondria in cultured cells. Fine structural analysis showed that the mitochondria released into extracellular space, are largely in free naked form and occasionally in membrane-surrounded vesicles. Mitochondrial stress augments extracellular release of mitochondria, which also occurs at basal level. Notably, extracellular mitochondria release acts as an alternative pathway to PRKN-dependent and independent mitophagy to help with the clearance of damaged mitochondria.
It is an established theory that mitochondrion is an organelle of endosymbiotic origin, as reflected by its self-replication and fusion/fission processes within eukaryotic cells. Following the first observation of organellar movement between cells in culture via membrane nanotubes by Rustom et al. [Citation24], several reports of intercellular mitochondrial transfer have been documented [Citation7–14]. Most studies placed emphasis on the biological significance of released mitochondria. Transcellular degradation of mitochondria has been observed [Citation7]. On the other hand, mitochondria transfer has been shown to rescue mitochondrial defects in recipient cells, representing an exogenous replacement of damaged mitochondria [Citation8,Citation10].
In the present study, we focused on the causative factors that initiates mitochondria to leave cells in the first place. Our results showed extracellular release of mitochondria takes place under basal and non-stimulus condition and escalates following mitochondrial stress induction, implying a physiological significance, which may correspond to a preserved but underrated pathway to clear mitochondria out of cells for mitochondrial quality control when a certain threshold is crossed. We found that this threshold is determined by the capacity of mitophagy, implying a crosstalk between the two pathways. Our findings are in good agreement with a few previous studies; one reported mesenchymal stem cells manage intracellular oxidative stress by transferring mitochondria to macrophage through microvesicles to outsource mitophagy [Citation11], while the other discovered adult neurons of Caenorhabditis elegans extrude large membrane-surrounded vesicles called exophers containing protein aggregates and mitochondria under neurotoxic stress and further showed genetic manipulations of the mitophagy mediators increase exophergenesis [Citation12].
The link between PRKN and mitophagy has long been known. Overexpression of PRKN induces complete removal of mitochondria from cells by mitophagy when mitochondria lose their membrane potential [Citation25]. Knocking down PRKN reduces mitophagy leading to impaired clearance of damaged mitochondria and intracellular accumulation of mitochondrial fragments [Citation26]. Interestingly, rotenone, the mitochondrial toxin used in this study, has been reported to induce alterations in PRKN solubility and result in its intracellular aggregation and function being compromised [Citation27]. Our results showed that overexpression of PRKN as well as BNIP3 and BNIP3L/NIX, which can mediate mitophagy independently of PRKN, suppressed extracellular release of mitochondria while partial knockdown of PRKN and complete KO of autophagy related genes elicited mitochondria release from cells. Our results are consistent with the prior study by Melentijevix et al. [Citation12] which reported genetic manipulation of the mitophagy mediator dct-1 (homologue of mammalian BNIP3), pdr-1 (PRKN) and atg-7 increased exopher incidence in Caenorhabditis elegans model. Overall, our findings imply that when mitophagy pathway functions properly, mitochondrial integrity is maintained, resulting in less release of extracellular mitochondria even in the presence of mitochondrial stress. On the contrary, when mitophagy is compromised, mitochondria tend to leave cells into extracellular space.
Notably, mutations in the PRKN gene encoding PRKN are reported to be a major cause of autosomal recessive juvenile PD [Citation28,Citation29]. Here we show a near-complete loss of PRKN protein in the fibroblasts derived from PD patients with PRKN mutations compared to controls, in line with two previous studies [Citation30,Citation31]. Patient-derived PRKN mutant fibroblasts released more extracellular mitochondria than that of healthy control, validating the data obtained using PRKN knockdown cells. Likewise, CSF samples of patients with PRKN mutations contained greater amount of mitochondrial protein. We further confirmed that sera of prkn KO mice contained higher level of mitochondrial protein. Previous studies reported that in prkn KO mice, mitochondrial dysfunction is not coupled with alterations in mitochondrial morphology as electron microscopic analysis revealed no gross morphological abnormalities in striatal mitochondria [Citation32,Citation33]. Similarly, abnormal mitochondria were not observed in PRKN mutant fibroblasts [Citation31,Citation34]. Our finding showing release of mitochondria into extracellular space may explain the lack of intracellular accumulation of abnormal mitochondria under condition of PRKN deficiency. Further studies involving characterization of extracellular space components by immunohistochemical staining are required for confirmation. Moreover, based on the fact that mitochondrial quality control highly depends on a balance between biogenesis and mitophagy [Citation35], one would expect PRKN deficiency to increase mitochondrial number through impaired clearance of mitochondria. However, Stevens et al. [Citation36] reported that loss of PRKN instead leads to reduced mitochondrial number. We speculate that consequent to a larger number of mitochondria being secreted out of cells and a decrement in intracellular mitochondrial abundance, PRKN-deficient cells may not be able to cope with the mitochondria turnover required for cell homeostasis and hence the susceptibility to cell damage.
Here we found that extracellular mitochondria are largely in free form with only a small minority being in membrane-surrounded vesicles, and in general, their sizes range from 500 nm to 1.5 µm. These results are consistent with earlier research. Hayakawa et al. [Citation8] detected mitoparticles and free mitochondria which spanned a range of sizes from 300 to 1,100 nm within the extracellular astrocyte-derived particles while Puhm et al. [Citation13] reported lipopolysaccharide-stimulated monocytic cells release proinflammatory microvesicles enriched in mitochondrial content and free mitochondria. We also analyzed the quality state of released mitochondria and found that depolarized mitochondria were more preferentially released from cells than healthy ones at physiological as well as stress conditions. Perhaps extracellular release is not merely an auxiliary pathway but shares equal importance with mitophagy in the intracellular quality control process of selectively clearing unwanted mitochondria.
In summary, mitochondrial quality control is critical for cell homeostasis and function and this study brings us a step closer to a better understanding of the new mitochondrial quality control machinery and, more importantly, its biological relevance.
Materials and methods
Cell lines
PC12 (ATCC® CRL-1721), noradrenergic clonal line of rat adrenal pheochromocytoma cells, were cultured in RPMI (Sigma-Aldrich, R8758) supplemented with 5% heat-inactivated fetal bovine serum (FBS; Gibco, 10270–106), 10% heat-inactivated horse serum (Sigma-Aldrich, H1138) and 100 U/mL penicillin and 100 μg/mL streptomycin (Gibco, 15140–122) on collagen type IV (Nitta Gelatin Inc., 170110)-coated dishes (Corning Incorporated, 430167) at 37°C in a 95% air, 5% CO2 humidified incubator.
Human neuroblastoma cell line SH-SY5Y (ATCC® CRL-2266), human embryonic kidney cells 293 (HEK293; ATCC® CRL-1573), human cervix adenocarcinoma cell line HeLa (ATCC® CCL-2), ATG3 KO, ATG5 KO, ATG7 KO, ATG9 KO, ATG13 KO, ATG14 KO and RB1CC1/FIP200 KO cells (kindly provided by Prof. Tamotsu Yoshimori, Osaka University, Japan) [Citation23] were cultured in Dulbecco’s Modified Eagle’s Medium (DMEM; Sigma-Aldrich, D5796) supplemented with 10% FBS, 100 U/mL penicillin and 100 μg/mL streptomycin at 37°C in a 95% air, 5% CO2 humidified incubator.
Primary skin fibroblasts from three unrelated patients (PRKN 008, 010, 011) affected by an early-onset PD with PRKN mutations, were obtained by explants from skin punch biopsy, after informed consent. Adult normal human skin fibroblasts (Sf8404, Sf8405, Sf8546), purchased from Riken Cell Bank (Ibaraki, Japan) were used as controls. Cells were grown in DMEM supplemented with 10% FBS, 100 U/mL penicillin and 100 μg/mL streptomycin, at 37°C in a 95% air, 5% CO2 humidified incubator.
Plasmids
pDsRed2-mito vector (632421), which encodes a fusion of Discosoma sp. red fluorescent protein (DsRed2) and a mitochondrial targeting sequence of human cytochrome c oxidase subunit VIII (mito), was purchased from Clontech Laboratories, Inc. pcDNA™3.1(+), a mammalian expression vector with the CMV promoter and pcDNA™3.1(+)-6MYC-human PRKN were kindly provided by Dr. Toru Yasuda, National Center for Child Health and Development, Tokyo, Japan. Control shRNA plasmid (Santa Cruz Biotechnology, sc-108060), which encodes a scrambled shRNA sequence that will not lead to the specific degradation of any known cellular mRNA, and Prkn shRNA plasmid (r) (Santa Cruz Biotechnology, sc-270243-SH), which consists of a pool of 3 target-specific lentiviral vector plasmids each encoding 19–25 nt (plus hairpin) shRNAs (hairpin sequence 1: GATCCGAGTATCGTTCACATAGTATTCAAGAGATACTATGTGAACGATACTCTTTTT; hairpin sequence 2: GATCCGTCTTGGTCTTCCAATGTATTCAAGAGATACATTGGAAGACCAAGACTTTTT; hairpin sequence 3: GATCCCCAACTCCCTGATTAAAGATTCAAGAGATCTTTAATCAGGGAGTTGGTTTTT) designed to knock down Prkn gene expression in rat cells, were purchased from Santa Cruz Biotechnology, Inc. pcDNA™3.1(+)-DsRed-NIX and pcDNA™3.1(+)-HA-human-BNIP3 plasmids (100763, 100781; deposited by Dr. Joseph Gordon of University of Manitoba, Canada) were purchased from Addgene.
Stable transfection and characterization
To generate a stable cell line expressing fluorescently labeled mitochondria, PC12 cells were transfected with pDsRed2-mito (Clontech Laboratories, Inc., 632421) using transfection reagent Fugene HD (Promega Corporation, E2311), according to manufacturer’s protocol. For stable PRKN overexpression, cells were transfected with pcDNA3.1(+)-6MYC-human PRKN. An empty vector, pcDNA3.1(+), was used as control. For stable PRKN knockdown, cells were transfected with Prkn shRNA plasmid (Santa Cruz Biotechnology, sc-270243-SH) [Citation37]. Control shRNA plasmid (Santa Cruz Biotechnology, sc-108060) was used as control. Forty-eight hours after transfection, cells were cultured with selection-medium containing 500 µg/ml G418 (Wako Pure Chemical Industries, Ltd., 071–06431) or 1 µg/ml puromycin (Sigma-Aldrich, P8833). Selection process was carried out for a series of passaging by introducing fresh medium and antibiotic to the cells. Following 10–14 days, single colonies of stably transfected cells formed were picked up and expanded in culture medium containing 250 µg/ml G418 or 0.5 µg/ml puromycin. DsRed2-labeled mitochondria were confirmed by immunofluorescence microscopy. PRKN overexpression was determined by western blot analysis. To monitor Prkn gene expression knockdown, quantitative polymerase chain reaction (qPCR) and western blot analysis were performed.
RNA extraction, cDNA synthesis and qPCR
Total RNA was extracted from the cells using RNeasy Mini kit (QIAGEN, 74104). RNA was reverse transcribed to complementary DNA (cDNA) using the Superscript III First Strand cDNA system (Life Technologies, 18080051) according to the manufacturer’s protocol and cDNA was used as the template for qPCR. qPCR was performed using TB Green® Premix Ex Taq™ (Tli RNaseH Plus) (Takara Bio Inc., RR820A) on an ABI PRISM 7900HT Sequence Detection System (Life Technologies, Carlsbad, CA, USA). Actb was amplified as an internal control. The following primers were used: rat Prkn forward 5ʹ-GACAAGCAACCCTCACCTTG-3ʹ; rat Prkn reverse; 5ʹ-CTCTCCACTCATCCGGTTTG-3ʹ; rat Actb forward 5ʹ-CTCTCTTCCAGCCTTCCTTC-3ʹ; rat Actb reverse 5ʹ-CTCTCTTCCAGCCTTCCTTC-3ʹ. The threshold crossing value was noted for each transcript and normalized to the internal control. The relative quantitation of mRNA was performed using the comparative Ct method.
siRNA transfection by electroporation
For targeting human PRKN, siRNA duplexes were generated for the following sequences: PRKN siRNA #1, UUUACAGAGAAACACCUUGUCAAUG; PRKN siRNA #2, CCGACUCUCUCCAUCAGAAGGGUUU (Sigma-Aldrich) [Citation38]. For targeting rat PRKN, Prkn siRNA (Santa Cruz Biotechnology, sc-270243) containing a pool of 3 target-specific 19–25 nt siRNA duplexes (GAGUAUCGUUCACAUAGUA, GUCUUGGUCUUCCAAUGUA, CCAACUCCCUGAUUAAAGA) designed to knock down rat Prkn gene expression was used. As negative controls for siRNA transfection, MISSION® siRNA Universal Negative Control #1 (SIC001) and #2 (SIC002) purchased from Sigma-Aldrich were used. Before performing electroporation, 2 ml culture media was divided in aliquots into each well in a 6-well plate and equilibrated to 37°C in the incubator. For each electroporation reaction of PC12, SH-SY5Y, HEK293 cells, 5 × 10⁵ cells/100 μL optiMEM (Gibco, 31–985-062) were used. Two microliters of 50 μM siRNA duplex were added to the cell suspension and then cells/siRNA duplex oligo suspensions were transferred into 2-mm gap cuvettes (Nepa Gene Co., Ltd, EC-002S) and electroporated using NEPA21 Super Electroporator (Nepa Gene Co., Ltd, Chiba, Japan). Immediately after electroporation, 500 μL of the pre-equilibrated culture media were added to the cuvette and cell suspension were transferred to a 6-well plate. Twenty-four hours posttransfection, media were replaced with fresh media; cells were harvested 24 h and 72 h post-transfection for RNA isolation and protein immunoblot analysis, respectively. For collection of conditioned media, cell suspension was transferred to 6-well hanging culture inserts (Merck Millipore, MCSP06H48) immediately after electroporation and media were changed at 24 h and 72 h post-transfection. Conditioned media were collected at 96 h post transfection.
Treatment and sample collection
Cells were cultured on the 6-well hanging culture insert membrane (Merck Millipore, MCSP06H48) which was kept off the well bottom. After 4 h of treatment with DMSO (Sigma-Aldrich, D2438) (vehicle control), 5 µM rotenone (ICN biomedicals, Inc., 150154) or 10 µM CCCP (Merck Millipore, 215911), inserts containing cell monolayers were removed from the well compartment and conditioned media were collected and ultracentrifuged at 60,000 x g for 1 h. Supernatant was removed and pellet was resuspended in adequate amount of phosphate buffered saline (PBS) (NaCl, KCl, Na2HPO4 and KH2PO4 in phosphate buffered salts tablets, pH 7.4; Takara Bio, T900) for subsequent analysis. For the assay using apoptosis inhibitors, cells were treated with pan-caspase inhibitor zVAD-FMK (Selleck Chemicals, S7023) 50 µM, tBid inhibitor BI-6C9 (Sigma-Aldrich, B0186) 10 µM and apoptosome inhibitor NS3694 (Sigma-Aldrich, N7787) 50 µM for 4 h before conditioned media were collected.
Correlative light-electron microscopy (CLEM)
For CLEM analysis, extracellular mitochondria labeled with DsRed2 were attached on poly-L-lysine (Sigma-Aldrich, P8920)-coated gridded coverslips (Matsunami Glass Ind., Ltd., GC1310). The gridded coverslips were fixed in 2% glutaraldehyde (FUJIFILM Wako Pure Chemical Corporation, 072–02262) and 50 mM sucrose (Nacalai Tesque, Inc., 30404–45) in 0.1 M phosphate buffer (PB; Na2HPO4, NaH2PO4 in distilled water, pH 7.2; Wako Pure Chemical Corporation, 190–02835, 192–02815) and brightfield and fluorescent images were taken using fluorescence microscope (Keyence, Olympus, Tokyo, Japan). The coverslips were then post-fixed with 1% OsO4 (Heraeus South Africa (Pty) Ltd., 5027800) and embedded in Epon 812 (Oken Shoji, 02–1002) after dehydration. Ultrathin sections were cut with an ultramicrotome (UC6, Leica Microsystems, Vienna, Austria) and mounted on glass coverslips. Sections were stained with uranyl acetate (Polysciences, Inc., 21447–25) and lead citrate (TAAB Laboratories Equipment Ltd, L018), and then these coverslips were coated with carbon using a carbon coater CADE-4 T (Meiwa Fosis, Osaka, Japan). Specimens were examined with a scanning electron microscope Helios NanoLab 660 (Thermo Fisher Scientific, Waltham, MA, USA).
Electron microscopy
Cells were fixed in 2% glutaraldehyde (FUJIFILM Wako Pure Chemical Corporation, 072–02262), 2% paraformaldehyde (Nacalai Tesque, Inc., 30525–89-4) buffered with 0.1 M PB, pH 7.2. Cells were then post-fixed with 1% OsO4 and embedded in Epon 812 (Oken Shoji, 02–1002) after dehydration. Ultrathin sections, 60 nm, were cut with an ultramicrotome (UC6, Leica Microsystems, Vienna Austria), stained with uranium acetate and lead citrate and examined with a Hitachi HT7700 electron microscope (Hitachi, Tokyo, Japan).
Immunoelectron microscopy
Immunoelectron microscopy using ultrathin cryosections was performed as previously described [Citation39]. Briefly, conditioned media-derived pellets containing DsRed2-mitochondria fixed in 4% paraformaldehyde (Nacalai Tesque, Inc., 30525–89-4) in 0.1 M PB (pH7.2) overnight at 4°C were washed with PBS, embedded in 12% gelatin (Rousselot) in 0.1 M PB, immersed in 2.3 M sucrose in 0.1 M PB overnight and plunged into liquid nitrogen. Sections approximately 60 nm thick were cut with a cryo-ultramicrotome (UC7/FC7, Leica Microsystems, Vienna, Austria) and reacted overnight at 4°C with mouse anti-TOMM20 antibody (1:50) (Santa Cruz Biotechnology, sc-17764) and 1 µg/ml rabbit anti-mRFP antibody (kindly gifted by Dr. Hiroyuki Hioki, Juntendo University, Japan) [Citation40], followed by donkey anti-mouse IgG conjugated with 12 nm colloidal gold particles (1:40; Jackson ImmunoResearch Laboratories, Inc., 115–205-146) and donkey anti-rabbit IgG conjugated with 6 nm colloidal gold particles (1:40; Jackson ImmunoResearch Laboratories, Inc., 711–195-152). The grids with sections were embedded in a thin layer of 2% methylcellulose (Sigma-Aldrich, M-6385) with 0.4% uranyl acetate (pH 4.0), air-dried, and observed with a Hitachi HT7700 electron microscope (Hitachi, Tokyo, Japan).
Time-lapse confocal imaging
PC12DsRed2mito cells were seeded onto a 35 mm glass bottom dish (Iwaki, 11–0604). Time-lapse imaging was performed on Olympus FV1000D confocal microscope (Olympus, Tokyo, Japan) equipped with a 37°C climate chamber with an Olympus 40× Plan Apo 1.4 oil immersion objective. Images were obtained with DsRed excitation (563 nm) and emission (582 nm) filters. The time interval of imaging was 30 s for a total duration of 2 h.
Purification of mitochondria
Mitochondria were purified from cells using mitochondria isolation kit for cultured cells (Thermo Scientific, 89874) as described in the user’s manual.
Shotgun LC-MS/MS analysis
Conditioned media-derived pellet and isolated mitochondria fraction resuspended in PBS were subjected to reduction and alkylation with tris (2-carboxyethyl) phosphine (Sigma-Aldrich, 75259) and iodoacetamide (Sigma-Aldrich, I1149), followed by trypsin digestion into peptides. After removal of sodium deoxycholate by phase-transfer surfactants method, desalination and concentration by column, the peptide mixture was injected onto Liquid Chromatography/Mass Spectrometry (LC-MS/MS) system (UltiMate 3000 Nano LC systems, Q-Exactive; Thermo Fisher Scientific, Waltham, MA, USA). Peptide ions were selected by an instrument algorithm and these ions underwent fragmentation. The resulting fragment ion spectrum was recorded, providing a peptide signature which can be identified by sequence database search algorithm, MASCOT.
Microscopic quantification of extracellular mitochondria
PC12DsRed2mito cells were seeded onto the membrane of 24-well hanging culture inserts (Merck Millipore, MCSP24H48) with lower compartment well coated with poly-L-lysine. On the following day, cells were subjected to DMSO, rotenone or CCCP treatment for 4 h. Inserts containing cell monolayers were removed from the well compartment and the extracellular particles were allowed to sediment by mild centrifugation at 2000 × g for 10 min before microscopic observation using IN Cell Analyzer 6000 (GE healthcare, Chicago, IL, USA). Sixty-four images covering the entire area of culture well were taken at 20× magnification. Automated quantification of fluorescently labeled mitochondria was performed using the software IN Cell Developer Toolbox.
Western blotting
Samples were loaded onto 10–20% SDS-polyacrylamide gel (ATTO Corporation, 2331840) and transferred to polyvinylidene difluoride membranes (Bio-Rad Laboratories, Inc., 1620177). The membranes were incubated with blocking buffer and probed with primary antibodies, anti-TOMM20 FL145 (diluted 1:500) (Santa Cruz Biotechnology, sc-11415), anti-TOMM20 F10 (diluted 1:200) (Santa Cruz Biotechnology, sc-17764), anti-TOMM40 (H7) (diluted 1:100) (Santa Cruz Biotechnology, sc-365466), total OXPHOS rodent WB Ab cocktail (diluted 1:250) (Abcam, ab110413), anti-HSPD1/Hsp60 (diluted 1:1000) (Abcam, ab46798), anti-OPA1 (diluted 1:400) (Abcam, ab42364), anti-ANXA5 (diluted 1:1000) (Abcam, ab14196), anti-GLG1 (diluted 1:500) (Abcam, ab262704), anti-RAB7 (diluted 1:1000) (Abcam, ab137029,), anti-BNIP3 (D7U1T) (diluted 1:1000) (Cell Signaling Technology, 44060), anti-BNIP3L (D4R4B) (diluted 1:1000) (Cell Signaling Technology, 12396), PRKN (Prk8) antibody (diluted 1:500) (Cell Signaling Technology, 4211), ATG3 antibody (diluted 1:1000) (Cell Signaling Technology, 3415), ATG5 (D5F5U) antibody (diluted 1:1000) (Cell Signaling Technology, 12994), ATG7 (D12B11) antibody (diluted 1:1000) (Cell Signaling Technology, 8558), Anti-ATG9A (diluted 1:500) (Medical & Biological Laboaratories Co., Ltd., PD042), Anti-ATG14 (diluted 1:1000) (Medical & Biological Laboaratories Co., Ltd., M184-3), Anti-LC3 (diluted 1:1000) (Medical & Biological Laboaratories Co., Ltd., PM036), Anti-ATG13 (diluted 1:1000) (Sigma-Aldrich, SAB4200100), RB1CC1/FIP200 antibody (diluted 1:1000) (Proteintech, 10043-2-AP) and ACTB/β-actin antibody, clone C4 (diluted 1:10000) (Merck Millipore, MAB1501). Following incubation with Amersham ECL horseradish peroxidase-conjugated anti-rabbit or anti-mouse secondary antibody (diluted 1:20000) (GE healthcare, NA934, NA931), the bound antibody was visualized with Amersham ECL prime western blotting detection reagents (GE Healthcare, RPN2236) using a ChemiDoc Touch Imaging System (BioRad, Berkeley, CA, USA).
Mitochondrial membrane potential assay
Mitochondrial membrane potential assay was performed using the cationic dye JC10, and an assay kit (Abcam, ab112134), following the manufacturer’s protocol. Confocal images of JC10 stained cells were acquired on same settings using Olympus FV1000D microscope (Olympus, Tokyo, Japan). Following image acquisition, fluorescence intensity of JC10 aggregates and monomers were analyzed using ImageJ software. For the assessment of JC10 staining of extracellular mitochondria, cells were seeded onto the membrane of 24-well hanging culture inserts (Merck Millipore, MCSP24H48) with lower compartment well coated with poly-L-lysine. On the following day, cells were subjected to DMSO or rotenone treatment for 4 h. Inserts containing cell monolayers were removed from the well compartment and the extracellular particles were allowed to sediment by mild centrifugation at 2000 × g for 10 min before JC10 staining and microscopic observation using IN Cell Analyzer 6000 (GE healthcare, Chicago, IL, USA). Sixty-four images covering the entire area of culture well were taken at 20× magnification. Automated quantification of red and green fluorescently labeled mitochondria was performed using the software IN Cell Developer Toolbox.
Mitophagy assay
Stable PRKN overexpressing and knockdown cells along with respective controls were transfected with CoralHue® Mitochondria-targeted mKeima-Red (Medical & Biological Laboaratories Co., Ltd., AM-V0251M). Cells were treated with DMSO, rotenone 5 µM, or CCCP 10 µM 72 h after transfection. Cells were observed under a confocal laser scanning microscope, Olympus FV1000D (Olympus, Tokyo, Japan), 4 h later. The excitation spectrum of Keima shifts from 440 to 586 nm when mitochondria are delivered to acidic lysosomes, which enables quantification of mitophagy. Images were acquired using a laser scanning confocal microscope using the laser lines 458 nm (green, mitochondria at neutral pH) and 561 nm (red, mitochondria under acidic pH), and fluorescence intensities were quantified using ImageJ to obtain mitophagy ratio.
CSF and serum samples from patients
CSF and blood serum samples from three unrelated PD patients with PRKN mutations and five control patients with normal pressure hydrocephalus were collected based on the following standardized protocol. CSF was collected by lumbar puncture in the morning after fasting overnight. The collected CSF samples were centrifuged at 400 × g for 10 min at 4 °C while the collected blood sera were centrifuged at 1400 × g for 10 min at room temperature and aliquots were stored at −80 °C until analysis. For western blot analysis, 500 µL of CSF and serum samples were ultracentrifuged at 60,000 × g for 1 h and the pellets obtained were used for western blot analysis.
Mouse strain
prkn KO mice (B6.129S4-Park2tm1Shn/J), which model the exon 3 deletion mutation most common in human autosomal recessive juvenile parkinsonism patients, were purchased from Jackson Laboratories [Citation41]. The nuclear background of the mice was C57BL/6 J (backcrossed at least ten generations). Heterozygous mice were then interbred to obtain homozygous KO and WT control mice. Mice were genotyped by PCR using primers (5ʹ-CCTACACAGAACTGTGACCTGG; 5ʹ-GCAGAATTACAGCAGTTACCTGG; 5′-ATGTTGCCGTCCTCCTTGAAGTCG) specific for the WT or the targeted allele.
Serum collection from mice
Mice were kept 3 per cage under 12-h light/dark cycle and standard housing condition with ad libitum access to food and water. Age-matched (15 weeks old) WT mice (n = 3) and homozygous prkn KO mice (n = 5) were used. Prior to sample collection procedures, mice were deeply anesthetized with an intraperitoneal injection of cocktails comprising medetomidine (Domitor®; Nippon Zenyaku Kogyo Co., Ltd., 210040) (2 mg/kg), midazolam (Dormicum®; Maruishi Pharmaceutical, 891311) (10 mg/kg), butorphanol (Vetorphale®; Meiji Seika Pharma Co., Ltd., VETL15) (1 mg/kg). Blood collection was performed by intracardiac puncture using 5 ml syringe (Terumo Corporation, SS-05SZ) and 23-gauge needle (Terumo Corporation, NN-2325 R). Collected blood was allowed to clot by leaving it undisturbed at room temperature for 30 min and at 4°C for 16 h. Clot was then removed by centrifuging at 1,000 × g for 20 min at 4°C. Following centrifugation, the supernatant designated as serum was immediately transferred to a clean Eppendorf tube (Eppendorf Japan, 3810X). Serum samples were stored at −80°C until further analysis. For western blot analysis, 250 µL of serum samples were ultracentrifuged at 60,000 × g for 1 h and the pellets obtained were used for western blot analysis. All animal experiments have been conducted according to the Osaka University Medical School Guideline for the Care and Use of Laboratory Animals. Animal surgeries and experimental procedure were approved by the Osaka University Medical School Animal Care and Use Committee.
Statistical analysis
To compute p values, two-tailed student’s t-test, one-way ANOVA and Mann–Whitney tests were used. For multiple comparisons, the following post-hoc tests were used: Tukey’s and Dunnett’s multiple comparison test (for comparisons between multiple conditions, following one-way ANOVA test). Statistics data are presented as the mean ± SEM with at least 3 independent experiments. p values are represented as *p < 0.05. All statistical tests were performed with GraphPad Prism 7.0 software unless stated otherwise.
Ethics statement
We conducted this study in accordance with the Declaration of Helsinki and the Ethical Guidelines for Medical and Health Research Involving Human Subjects endorsed by the Japanese government. All subjects were enrolled after informed consent and in accordance with institutional review board approved protocols.
Supplemental Material
Download Zip (33.3 MB)Acknowledgments
This work was supported by JST CREST Grant Number JPMJCR17H6, and JPMJCR18H4, Japan, Grant-in-Aid for JSPS fellows (17F17413) from the Ministry of Education, Culture, Sports, Science and Technology (MEXT) of Japan, the Brain Mapping by Integrated Neurotechnologies for Disease Studies (Brain/MINDS) from Japan Agency for Medical Research and development (AMED) (Grant Number JP19dm0207070 and JP18km0405206) and Practical Research Project for Rare/Intractable Diseases of AMED and JSPS KAKENHI Grant Number JP16H06280, Grant-in-Aid for Scientific Research on Innovative Areas- Resource and technical support platforms for promoting research ‘Advanced Bioimaging Support’. We also thank the Laboratory of Morphology and Image Analysis, Research Support Center, Juntendo University Graduate School of Medicine for technical assistance.
Disclosure statement
The authors declare no competing financial and non-financial interests.
Supplementary material
Supplemental data for this article can be accessed here.
Additional information
Funding
Related Research Data
References
- McBride HM, Neuspiel M, Wasiak S. Mitochondria: more than just a powerhouse. Curr Biol. 2006;16:R551–60.
- Green DR. Apoptotic pathways: the roads to ruin. Cell. 1998;94:695–698.
- Zamzami N, Susin SA, Marchetti P, et al. Mitochondrial control of nuclear apoptosis. J Exp Med. 1996;183:1533–1544.
- Geisler S, Holmström KM, Skujat D, et al. PINK1/Parkin-mediated mitophagy is dependent on VDAC1 and p62/SQSTM1. Nat Cell Biol. 2010;12:119–131.
- Vives-Bauza C, Zhou C, Huang Y, et al. PINK1-dependent recruitment of Parkin to mitochondria in mitophagy. Proc Natl Acad Sci USA. 2010;107:378–383.
- Narendra DP, Jin SM, Tanaka A, et al. PINK1 is selectively stabilized on impaired mitochondria to activate Parkin. PLoS Biol. 2010;8:e1000298.
- Davis CO, Kim K-Y, Bushong EA, et al. Transcellular degradation of axonal mitochondria. Proc Natl Acad Sci USA. 2014;111:9633–9638.
- Hayakawa K, Esposito E, Wang X, et al. Transfer of mitochondria from astrocytes to neurons after stroke. Nature. 2016;535:551–555.
- Chou SHY, Lan J, Esposito E, et al. Extracellular mitochondria in cerebrospinal fluid and neurological recovery after subarachnoid hemorrhage. Stroke. 2017;48:2231–2237.
- Islam MN, Das SR, Emin MT, et al. Mitochondrial transfer from bone-marrow–derived stromal cells to pulmonary alveoli protects against acute lung injury. Nat Med. 2012;18:759–765.
- Phinney DG, Di Giuseppe M, Njah J, et al. Mesenchymal stem cells use extracellular vesicles to outsource mitophagy and shuttle microRNAs. Nat Commun. 2015;6:1–15.
- Melentijevic I, Toth ML, Arnold ML, et al. C. elegans neurons jettison protein aggregates and mitochondria under neurotoxic stress. Nature. 2017;542:367–371.
- Puhm F, Afonyushkin T, Resch U, et al. Mitochondria are a subset of extracellular vesicles released by activated monocytes and induce type I IFN and TNF responses in endothelial cells. Circ Res. 2019;125:43–52.
- Miliotis S, Nicolalde B, Ortega M, et al. Forms of extracellular mitochondria and their impact in health. Mitochondrion. 2019;48:16–30.
- Katayama H, Kogure T, Mizushima N, et al. A sensitive and quantitative technique for detecting autophagic events based on lysosomal delivery. Chem Biol. 2011;18:1042–1052.
- Violot S, Carpentier P, Blanchoin L, et al. Reverse pH-dependence of chromophore protonation explains the large Stokes shift of the red fluorescent protein mKeima. J Am Chem Soc. 2009;131:10356–10357.
- Hanna RA, Quinsay MN, Orogo AM, et al. Microtubule-associated protein 1 light chain 3 (LC3) interacts with Bnip3 protein to selectively remove endoplasmic reticulum and mitochondria via autophagy. J Biol Chem. 2012;287:19094–19104.
- Schweers RL, Zhang J, Randall MS, et al. NIX is required for programmed mitochondrial clearance during reticulocyte maturation. Proc Natl Acad Sci USA. 2007;104:19500–19505.
- Novak I, Kirkin V, McEwan DG, et al. Nix is a selective autophagy receptor for mitochondrial clearance. EMBO Rep. 2010;11:45–51.
- Zhang J, Loyd MR, Randall MS, et al. A short linear motif in BNIP3L (NIX) mediates mitochondrial clearance in reticulocytes. Autophagy. 2012;8:1325–1332.
- Koentjoro B, Park JS, Sue CM. Nix restores mitophagy and mitochondrial function to protect against PINK1/Parkin-related Parkinson’s disease. Sci Rep. 2017;7:1–11.
- Yoshii SR, Mizushima N. Autophagy machinery in the context of mammalian mitophagy. Biochim Biophys Acta Mol Cell Res. 2015;1853:2797–2801.
- Nakamura S, Shigeyama S, Minami S, et al. LC3 lipidation is essential for TFEB activation during the lysosomal damage response to kidney injury. Nat Cell Biol. 2020;22:1252–1263.
- Rustom A, Saffrich R, Markovic I, et al. Nanotubular highways for intercellular organelle transport. Science. 2004;303:1007–1010.
- Narendra D, Tanaka A, Suen D-F, et al. Parkin is recruited selectively to impaired mitochondria and promotes their autophagy. J Cell Biol. 2008;183:795–803.
- Wu W, Xu H, Wang Z, et al. PINK1-Parkin-mediated mitophagy protects mitochondrial integrity and prevents metabolic stress-induced endothelial injury. PLoS One. 2015;10:e0132499.
- Wang C, Ko HS, Thomas B, et al. Stress-induced alterations in parkin solubility promote parkin aggregation and compromise parkin’s protective function. Hum Mol Genet. 2005;14:3885–3897.
- Kitada T, Asakawa S, Hattori N, et al. Mutations in the parkin gene cause autosomal recessive juvenile parkinsonism. Nature. 1998;392:605–608.
- Lücking CB, Dürr A, Bonifati V, et al. Association between early-nnset Parkinson’s disease and mutations in the Parkin gene. N Engl J Med. 2000;342:1560–1567.
- Zilocchi M, Colugnat I, Lualdi M, et al. Exploring the Impact of PARK2 Mutations on the total and mitochondrial proteome of human skin fibroblasts. Front Cell Dev Biol. 2020;8:423.
- Zanellati MC, Monti V, Barzaghi C, et al. Mitochondrial dysfunction in Parkinson disease: evidence in mutant PARK2 fibroblasts. Front Genet. 2015;6:78.
- Palacino JJ, Sagi D, Goldberg MS, et al. Mitochondrial dysfunction and oxidative damage in parkin-deficient mice. J Biol Chem. 2004;279:18614–18622.
- Damiano M, Gautier CA, Bulteau A-L, et al. Tissue- and cell-specific mitochondrial defect in Parkin-deficient mice. PLoS One. 2014;9:e99898.
- Imaizumi Y, Okada Y, Akamatsu W, et al. Mitochondrial dysfunction associated with increased oxidative stress and α-synuclein accumulation in PARK2 iPSC-derived neurons and postmortem brain tissue. Mol Brain. 2012;5:35.
- Gottlieb RA, Gustafsson AB. Mitochondrial turnover in the heart. Biochim Biophys Acta. 2011;1813:1295–1301.
- Stevens DA, Lee Y, Kang HC, et al. Parkin loss leads to PARIS-dependent declines in mitochondrial mass and respiration. Proc Natl Acad Sci USA. 2015;112:11696–11701.
- Corsetti V, Florenzano F, Atlante A, et al. NH2-truncated human tau induces deregulated mitophagy in neurons by aberrant recruitment of Parkin and UCHL-1: implications in Alzheimer’s disease. Hum Mol Genet. 2015;24:3058–3081.
- Grenier K, Kontogiannea M, Fon EA. Short mitochondrial ARF triggers Parkin/PINK1-dependent mitophagy. J Biol Chem. 2014;289:29519–29530.
- Koike M, Shibata M, Sunabori T, et al. Purkinje cells are more vulnerable to the specific depletion of Cathepsin D than to that of Atg7. Am J Pathol. 2017;187:1586–1600.
- Hioki H, Nakamura H, Ma YF, et al. Vesicular glutamate transporter 3-expressing nonserotonergic projection neurons constitute a subregion in the rat midbrain raphe nuclei. J Comp Neurol. 2010;518:668–686.
- Goldberg MS, Fleming SM, Palacino JJ, et al. Parkin-deficient mice exhibit nigrostriatal deficits but not loss of dopaminergic neurons. J Biol Chem. 2003;278:43628–43635.