
ABSTRACT
Mesenchymal stromal cells (MSCs) have received attention as promising therapeutic agents for the treatment of various diseases. However, poor post-transplantation viability is a major hurdle in MSC-based therapy, despite encouraging results in many inflammatory disorders. Recently, three dimensional (3D)-cultured MSCs (MSC3D) were shown to have higher cell survival and enhanced anti-inflammatory effects, although the underlying mechanisms have not yet been elucidated. In this study, we investigated the molecular mechanisms by which MSC3D gain the potential for enhanced cell viability. Herein, we found that macroautophagy/autophagy was highly induced and ROS production was suppressed in MSC3D as compared to 2D-cultured MSCs (MSC2D). Interestingly, inhibition of autophagy induction caused decreased cell viability and increased apoptotic activity in MSC3D. Furthermore, modulation of ROS production was closely related to the survival and apoptosis of MSC3D. We also observed that HMOX1 (heme oxygenase 1) was significantly up-regulated in MSC3D. In addition, gene silencing of HMOX1 caused upregulation of ROS production and suppression of the genes related to autophagy. Moreover, inhibition of HIF1A (hypoxia inducible factor 1 subunit alpha) caused suppression of HMOX1 expression in MSC3D, indicating that the HIF1A-HMOX1 axis plays a crucial role in the modulation of ROS production and autophagy induction in MSC3D. Finally, the critical role of autophagy induction on improved therapeutic effects of MSC3D was further verified in dextran sulfate sodium (DSS)-induced murine colitis. Taken together, these results indicated that autophagy activation and modulation of ROS production mediated via the HIF1A-HMOX1 axis play pivotal roles in enhancing the viability of MSC3D.
Abbreviations: 3D: three dimensional; 3MA: 3 methlyadenine; AMPK: AMP-activated protein kinase; Baf A1: bafilomycin A1; CFSE: carboxyfluorescein succinimidyl ester; CoCl2: cobalt chloride; CoPP: cobalt protoporphyrin; DSS: dextran sulfate sodium; ECM: extracellular matrix; FOXO3/FOXO3A: forkhead box O3; HIF1A: hypoxia inducible factor 1 subunit alpha; HMOX1/HO-1: heme oxygenase 1; HSCs: hematopoietic stem cells; IL1A/IL-1α: interleukin 1 alpha; IL1B/IL-1β: interleukin 1 beta; IL8: interleukin 8; KEAP1: kelch like ECH associated protein 1; LAMP1: lysosomal associated membrane protein 1; LAMP2: lysosomal associated membrane protein 2; MSC2D: 2D-cultured MSCs; MSC3D: 3D-cultured MSCs; MSCs: mesenchymal stromal cells; NFE2L2/NRF2: nuclear factor, erythroid 2 like 2; PGE2: prostaglandin E2; PIK3C3/VPS34: phosphatidylinositol 3-kinase catalytic subunit type 3; PINK1: PTEN induced kinase 1; ROS: reactive oxygen species; siRNA: small interfering RNA; SIRT1: sirtuin 1; SOD2: superoxide dismutase 2; SQSTM1/p62: sequestosome 1; TGFB/TGF-β: transforming growth factor beta.
Introduction
Mesenchymal stromal cells (MSCs) have received increasing attention in regenerative medicine due to their tissue regeneration and repair potential [Citation1]. However, there is a loss of extracellular matrix (ECM) during enzymatic digestion before in vivo transplantation, which subsequently causes anoikis and apoptosis of the cells [Citation2]. Further, limited cell viability following transplantation compromises the clinical benefits of MSCs, despite their high therapeutic potential. Moreover, transplanted cells encounter a highly oxidative, inflammatory, and hypoxic microenvironment that substantially impairs cell engraftment and survival [Citation3].
A variety of techniques for three-dimensional (3D) culture of MSCs have been developed to mimic the cell-ECM and cell-cell interaction present in the in vivo stem cell niche [Citation4]. Among these, the gravity-assisted hanging drop technique has been used in many studies wherein the 3D-cultured MSCs (MSC3D) showed an improved angiogenic potential and therapeutic effects [Citation5,Citation6]. Furthermore, 3D culture of MSCs increases intracellular pro-inflammatory cytokines such as IL1A/IL-1α, IL1B/IL-1β, and IL8, creating an early inflammatory microenvironment within the MSC3D. This priming supports the MSC activation and accelerates the secretion of immunomodulatory factors (TNFAIP6 [TNF alpha induced protein 6], PGE2) to control inflammation and to facilitate tissue repair [Citation7].
Among various factors limiting cell viability of MSCs after in vivo transplantation, reactive oxygen species (ROS) negatively modulate engraftment and adhesion of the transplanted MSCs [Citation8]. Furthermore, elevated ROS trigger cell death signaling pathways, such as endoplasmic reticulum stress, damaged mitochondrial membrane potential, and activation of MAPK/p38 or MAPK/JNK pathways [Citation9], resulting in apoptosis of MSCs [Citation10]. These reports suggest that intracellular ROS levels are critical for determining the fate of MSCs. While it is well known that ROS modulate viability of transplanted MSCs, the effects of ROS on viability of MSC3D and the underlying mechanisms are not yet clearly understood.
Availability of bioenergy, one of the critical factors governing cell survival in a nutrient-deficient microenvironment, is an another challenge encountered by transplanted MSCs [Citation11]. In the absence of exogenous nutrient supply, inadequate intracellular glucose, and rapid exhaustion of energy reserves, MSCs are liable to undergo apoptosis after transplantation. Under these circumstances, survival of MSCs solely depends on anaerobic glycolysis or activation of macroautophagy/autophagy to reutilize micronutrients. Autophagy, a dynamic intracellular recycling process, contributes to the maintenance of cellular homeostasis through reuse of cellular wastages, damaged organelles, misfolded proteins, and turnover of other long-lived proteins [Citation12]. Although autophagy was originally reported as a distinct type of cell death, accumulating evidences suggest that it has a cytoprotective role under stressful conditions, such as hypoxia, starvation, infection, and oxidative stress [Citation13]. Stem cell quiescence is required to be maintained for longevity, stemness, and proper functioning. However, inefficient turnover of long-lived proteins and subsequent lack of elimination of unwanted wastages cause stem cells to lose their stemness and tissue repairment potential. Under such conditions, autophagy becomes crucial for the maintenance of stem cell quiescence, stemness, survival, differentiation, and longevity [Citation14]. Additionally, autophagy induction is required for MSCs to survive against oxidative stress [Citation15], serum-deprivation and hypoxia [Citation16,Citation17], thus suggesting a protective role of autophagy activation in stem cell biology. In contrast, other studies support the opposite notion that autophagy induction could favor the cell death in MSCs. For example, BECN1/Beclin 1 dependent autophagy induction leads to apoptosis of MSCs through ROS-MAPK/ERK signaling [Citation18]. Taken together, autophagy modulates the viability and function of stem cells in a context-dependent manner. While previous studies have clearly demonstrated that autophagy regulates various functions of MSCs, its role in modulating MSC3D viability and functions has not been explored.
Recently, 3D culture has become a fascinating area of research since it represents the actual microenvironment of cells in the tissues more accurately. Although previous studies have shown higher cell viability in MSC3D, the underlying mechanisms are largely unknown. In this study, we investigated the mechanisms by which 3D culture promotes higher survival rate and therapeutic efficacy. Herein, we demonstrated that higher cell viability in 3D culture is mediated via modulation of ROS production and autophagy induction. Furthermore, HMOX1 (heme oxygenase 1)-HIF1A (hypoxia inducible factor 1 subunit alpha) axis critically contributes to both suppression of ROS production and autophagy activation in MSC3D.
Results
3D culture of MSCs enhances in vivo cell engraftment at the transplantation site and suppression of apoptosis in vitro
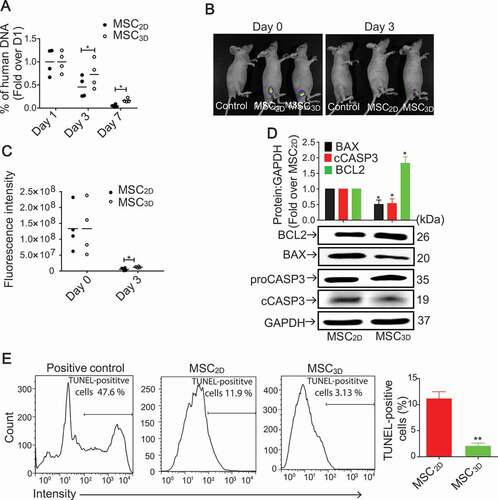
The in vivo engraftment of MSCs following transplantation of human MSC2D or MSC3D in mice was evaluated by measuring the amounts of human DNA present at the transplanted site. While there was no significant difference in the amount of human DNA on day 1, it was markedly higher in MSC3D-transplanted group as compared to the MSC2D on day 3 and 7 (). In vivo imaging of carboxyfluorescein succinimidyl ester (CFSE)-labeled MSCs also showed higher intensity in MSC3D transplanted tissues (). Moreover, we evaluated expression of the genes related with apoptosis and population of dead cells in MSC3D. MSC3D exhibited downregulation of the pro-apoptotic protein BAX (BCL2 associated X, apoptosis regulator), suppression of CASP3/caspase 3 activity, and upregulation of anti-apoptotic protein BCL2 (BCL2 apoptosis regulator) as compared to MSC2D (). Furthermore, TUNEL assay also showed that apoptotic TUNEL-positive cells were significantly decreased in MSC3D compared to MSC2D (). Collectively, these results indicate that the cell engraftment is higher following transplantation of MSC3D as compared to MSC2D.
Figure 1. Enhanced in vivo cell viability after transplantation of MSC3D. (A) The percentage of human DNA content engrafted after subcutaneous transplantation of MSC2D and MSC3D at different time points. Data are represented as mean ± SEM (n = 4). * indicates p < 0.05 as compared with MSC2D. (B) A representative image for in vivo fluorescence imaging of CFSE-labeled transplanted MSC2D and MSC3D. (C) The quantitative estimation of fluorescence intensity that corresponds to the number of transplanted viable cells was determined by the FOBI software. Data are represented as mean ± SEM (n = 4). * indicates p < 0.05 as compared with MSC2D. (D) Basal protein expression levels of BCL2, BAX and cCASP3 in MSC2D and MSC3D were determined by western blot analysis. GAPDH was used as a loading control. Expression levels of target genes were quantified by densitometric analysis and shown in the upper panel of the image. Values are presented as mean ± SEM (n = 3 independent experiments). * represents p < 0.05 compared with MSC2D (E) Apoptotic cell death in MSCs was evaluated by TUNEL as described in materials and methods section. TUNEL-positive cells were analyzed with flow cytometer and calculated using Flowjo software. Data are presented as percentage of apoptotic cells represented by TUNEL-positive cells and expressed as mean ± SEM (n = 3 independent experiments). ** represents p < 0.01 compared with MSC2D.
Enhanced cell viability of MSC3D is mediated via suppression of ROS production
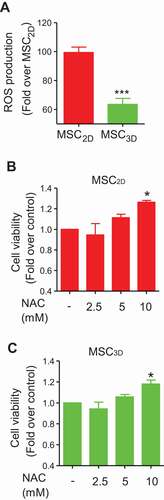
To elucidate the mechanisms underlying enhanced cell viability of MSC3D, we examined whether 3D culture affected ROS production. As shown in , intracellular ROS level was significantly decreased in MSC3D as compared to MSC2D. In addition, treatment with N-acetylcysteine (NAC), a ROS scavenger, caused a significant increase in cell viability of both MSC2D and MSC3D in a dose-dependent manner (), suggesting that ROS production negatively regulates viability of MSCs.
Figure 2. Decreased cell viability by ROS production in MSCs. (A) Intracellular ROS level was determined in MSC2D and MSC3D. Cells were incubated with 5-chloromethyl-2,7-dichlorodihydrofluorescein diacetate (CM-H2DCFDA) for 1 h and ROS level was evaluated by measuring the fluorescence of DCF, which is converted from CM-H2DCFDA upon oxidation. Values indicate the fold change relative to MSC2D and are expressed as mean ± SEM (n = 7). *** represents p < 0.001 compared with MSC2D. (B and C) Effects of NAC on cell viability of MSC2D and MSC3D were determined by MTS assay. MSCs were treated with different concentrations of NAC, a ROS scavenger, for 48 h and the cell viability was determined as described in methods section. Data are presented as the fold change compared to control group and expressed as mean ± SEM (n = 3 independent experiments). * represents p < 0.05 compared to the control group
HMOX1 induction contributes to suppression of ROS production in MSC3D
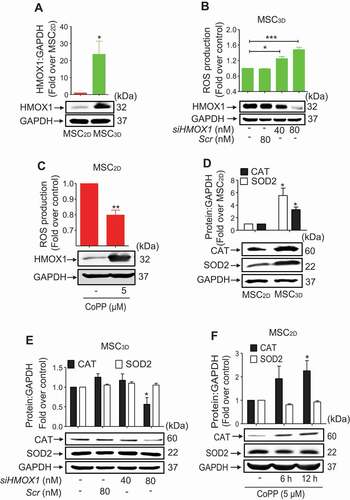
To further elucidate the mechanisms involved in the reduction of intracellular ROS production in MSC3D, we examined the involvement of HMOX1 signaling. As indicated in , HMOX1 expression was markedly up-regulated in MSC3D. Moreover, silencing of HMOX1 gene in MSC3D resulted in a significant increase in ROS production (), whereas treatment with cobalt protoporphyrin (CoPP), a HMOX1 inducer, caused significant reduction of ROS production in MSC2D (), verifying the functional role of HMOX1 induction in the regulation of ROS production. ROS production is modulated by various oxidant and anti-oxidant systems. To identify the anti-oxidant genes involved in the suppression of ROS production, we examined the expression levels of various anti-oxidant genes in MSC2D and MSC3D, and found that protein expression of CAT (catalase) and SOD2 (superoxide dismutase 2) were prominently increased in MSC3D (). Interestingly, genetic ablation of HMOX1 drastically attenuated the expression of CAT in MSC3D, while no significant effect on SOD2 was observed (). Additionally, CoPP stimulation increased the CAT protein expression without significant effect on SOD2 expression () in MSC2D. Taken together, these results suggest that HMOX1 induction contributes to the inhibition of ROS production in MSC3D, at least in part, via the modulation of CAT expression.
Figure 3. Role of HMOX1 induction in the suppression of ROS production in MSC3D. (A) Basal HMOX1 protein expression levels in MSC2D and MSC3D were measured by western blot analysis. (B) (Upper panel) MSC3D were transfected with siRNA targeting HMOX1 or control scrambled siRNA and total intracellular ROS production level was measured as described previously. (Lower panel) Gene silencing efficiency of HMOX1 was determined by western blot analysis. Data indicate fold change relative to the control and are represented as mean ± SEM (n = 3 independent experiments). * and *** represent p < 0.05 and p < 0.001 compared with the control group, respectively. (C) (Upper panel) MSC2D were stimulated with CoPP, a HMOX1 inducer, for 12 h and intracellular ROS production was determined. (Lower panel) HMOX1 induction by CoPP stimulation was confirmed by western blot analysis. Values are presented as mean ± SEM (n = 3 independent experiments). * and ** represent p < 0.05 and p < 0.01 compared with the control, respectively. (D) Basal protein expression levels of CAT and SOD2 in MSC2D and MSC3D were determined by western blot analysis. (E and F) Expression levels of CAT and SOD2 were evaluated by western blot analysis after transfection with siRNA targeting HMOX1 (E) or treatment with CoPP for the indicated time duration (F). For all western blot analysis (A, D, E, and F), GAPDH was used as a loading control. Expression levels of target proteins were quantified by densitometric analysis and shown in the upper panel of the image. Values are presented as the fold change compared to MSC2D (A and D) or control group cells (E and F) and expressed as mean ± SEM (n = 3 independent experiments). * indicates p < 0.05 compared to MSC2D (A and D) or control group cells (E and F)
Autophagy induction contributes to enhanced cell survival in MSC3D
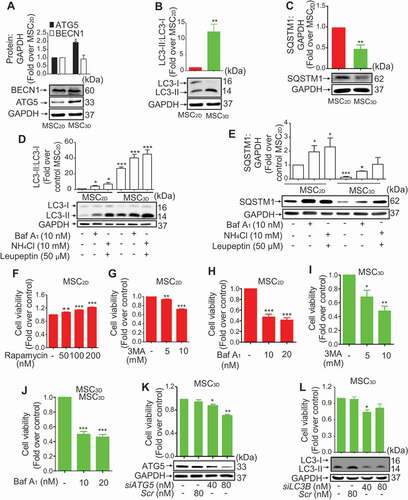
To explore the role of autophagy on increased cell viability of MSC3D, we checked expression levels of the proteins related with autophagy and found that ATG5 expression and conversion of LC3-I to LC3-II were significantly increased in MSC3D without a significant change in BECN1 expression (). We also measured expression level of SQSTM1/p62, a well-known substrate of autophagy, and observed that SQSTM1 expression was significantly suppressed in MSC3D (). Collectively, these results suggest the enhanced autophagy in MSC3D probably through BECN1-independent manner. To further discriminate that higher LC3-II formation is due to increased autophagy influx or decreased clearance by autolysosomes, we performed LC3 flux and SQSTM1 degradation assay using bafilomycin A1 (Baf A1; autophagic flux inhibitor), or NH4Cl plus leupeptin (lysosomal protease inhibitors). Treatment of MSC2D and MSC3D with autophagy flux inhibitor Baf A1 or lysosomal protease inhibitors (NH4Cl and leupeptin) markedly increased the levels of LC3-II (). The increasing effect on LC3-II formation was more prominent in MSC3D, demonstrating the higher autophagy induction in MSC3D. Moreover, SQSTM1 level was also significantly increased by treatment with Baf A1 or NH4Cl plus leupeptin (). In following experiments to investigate the functional role of autophagy in modulating cell viability, treatment with rapamycin, an autophagy inducer, dose-dependently increased cell viability in MSC2D (). In addition, both 3-methyladenine (3MA), a class III phosphatidylinositol 3-kinase inhibitor used as an autophagy inhibitor, and Baf A1, an inhibitor of late stage autophagy, markedly suppressed the cell viability of MSC2D and MSC3D (). The pharmacological effects of rapamycin and 3MA on the regulation of autophagy were confirmed by measurement of SQSTM1 expression and LC3-II formation (Fig. S1). Gene silencing of ATG5 and LC3B also significantly suppressed cell viability in MSC3D (). Collectively, these results suggest that autophagy induction contributes to the enhanced cell viability of MSC3D.
Figure 4. Role of autophagy induction in higher survival rate of MSCs. (A, B, and C) Basal protein expression levels of the genes related to autophagy in MSC2D and MSC3D were measured by western blot analysis. Expression levels of the target genes were quantified by densitometric analysis and shown in the upper panel of the image. Values are presented as the fold change compared to MSC2D and expressed as mean ± SEM (n = 3 independent experiments). * and ** represent p < 0.05 and p < 0.01, respectively compared to MSC2D. (D and E) MSC2D and MSC3D were treated with Baf A1, or NH4Cl plus leupeptin for 24 h. Protein expression levels of LC3-II:LC3-I (D) and SQSTM1 (E) were determined by western blot analysis and quantified by densitometric analysis (shown in the upper panel of the images). Expression levels of the target genes were quantified by densitometric analysis and shown in the upper panel of the image. Values are presented as the fold change compared to control of MSC2D and expressed as mean ± SEM (n = 3 independent experiments). *, ** and *** represent p < 0.05, p < 0.01, and p < 0.001 respectively compared to control of MSC2D. (F-H) MSC2D were treated with indicated concentrations of rapamycin (F), 3MA (G), or Baf A1 (H). MSC3D were treated with indicated concentrations of 3MA (I) or Baf A1 (J) for 48 h. Cell viability was determined by MTS assay as described in the methods. Values are presented as mean ± SEM (n = 3). *, ** and *** represent p < 0.05, p < 0.01 and p < 0.001, respectively compared with control untreated cells. (K and L) MSC3D were transfected with siRNA targeting ATG5 (K), or LC3B (L), or control scrambled siRNA. Gene silencing efficiency was determined after 48 h of transfection by western blot analysis and presented in the lower panel. Cell viability was evaluated by MTS assay. Values are presented as mean ± SEM (n = 3 independent experiments). *, and ** represent p < 0.05 and p < 0.01 * compared to control, respectively
BECN1 independent autophagy activation suppresses apoptosis in MSC3D
As BECN1 expression level was not changed in MSC3D (), we further confirmed whether autophagy induction in MSC3D is BECN1 independent. As expected, genetic ablation of BECN1 did not affect LC3-II formation in MSC3D (). In addition, cell viability was not changed by gene silencing of BECN1 (). These results further support that autophagy induction in MSC3D is BECN1 independent (non-canonical). To further characterize autophagy observed in MSC3D, we examined the expression levels of other autophagy-related genes, including PIK3C3/VPS34 (phosphatidylinositol 3-kinase catalytic subunit type 3) and ATG7, which can also be observed in non-canonical autophagy activation [Citation19]. Protein expression levels of both PIK3C3 and ATG7 were markedly enhanced in MSC3D compared to MSC2D (Fig. S2A and S2B).
Figure 5. Role of BECN1 independent autophagy induction in suppression of apoptosis of MSCs. (A and B) MSC3D were transfected with siRNA targeting BECN1 or control scrambled siRNA. Gene silencing efficiency was determined after 48 h of transfection by western blot analysis and presented in the lower panel. Ratio of LC3-II:LC3-I was measured by western blot analysis and shown in the upper panel of the image (A). Values are presented as the fold change compared to control and expressed as mean ± SEM (n = 3 independent experiments). Cell viability was evaluated by MTS assay (B). Values are presented as the fold change compared to control and expressed as mean ± SEM (n = 3 independent experiments). (C) Basal protein expression levels of LAMP1 in MSC2D and MSC3D were measured by western blot analysis. Expression levels were quantified by densitometric analysis and shown in the upper panel of the image. Values are presented as the fold change compared to MSC2D and expressed as mean ± SEM (n = 3 independent experiments). ** represents p < 0.01. (D) Fluorescence intensity of LysoTracker at basal levels in MSC2D and MSC3D were determined by flow cytometer. After trypsinization, MSC2D and MSC3D were incubated with 50 nM of LysoTracker for 1 h, followed by the measurement of fluorescence intensity with flow cytometer. (Right panel) Fluorescence intensity values are presented as the fold change compared with MSC2D and are expressed as mean ± SEM (n = 3 independent experiments). ** represents p < 0.01. (E and F) MSC3D were treated with 3MA for 36 h (E), or transfected with LC3B siRNA (siLC3B) or control scrambled siRNA (Scr) for 36 h (F). (G) MSC2D were treated with rapamycin for 36 h. Expression levels of proCASP3, cCASP3, and BAX were determined by western blot analysis. Expression levels of BAX and cCASP3 were quantified by densitometric analysis and are shown in the upper panel of the image. Values are presented as the fold change compared with control cells and are expressed as mean ± SEM (n = 3 independent experiments). * indicates p < 0.05 for BAX expression as compared with control cells; # indicates p < 0.05 for cCASP3 as compared with control cells. For all western blot analyses, GAPDH was used as loading control
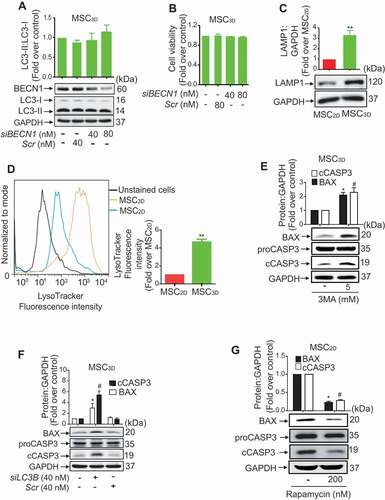
Because autophagy is a lysosomal-dependent degradation process, we measured the expression levels of lysosomal markers, which are responsible for the biogenesis of lysosomes including, LAMP1 (lysosomal associated membrane protein 1) and LAMP2 (lysosomal associated membrane protein 2) in MSCs [Citation20]. As shown in , LAMP1 expression was significantly increased in MSC3D compared to MSC2D, while no significant change in LAMP2 expression was observed (Fig. S2C), suggesting higher lysosomal biogenesis in MSC3D. In addition, lysosomal activity was markedly increased in MSC3D, as determined by LysoTracker staining (), suggesting a more efficient autophagic degradation of damaged organelles or proteins in the MSC3D compared to MSC2D. Collectively, these results indicate that lysosomal formation and autophagic activity were significantly enhanced in MSC3D.
Next, we investigated whether autophagy affects apoptotic signaling in MSCs. Interestingly, pretreatment with 3MA significantly increased expression levels of BAX and cleaved CASP3 (cCASP3) in MSC3D without significant effect on proCASP3 expression (). In addition, gene silencing of LC3B also generated similar effects on BAX expression and CASP3 activation in MSC3D (). Moreover, treatment with rapamycin substantially decreased expression levels of BAX and cCASP3 () in MSC2D, clearly indicating that BECN1 independent autophagy induction leads to suppression of apoptosis in MSCs.
HIF1A-HMOX1 axis mediates autophagy induction in MSC3D
To elucidate the signaling mechanisms underlying autophagy induction in MSC3D, we investigated the involvement of HMOX1 signaling. As shown in , CoPP treatment significantly increased the ratio of LC3-II:LC3-I and the expression of autophagy-related proteins, including ATG5, in MSC2D, while no significant effect was observed on BECN1 expression. Moreover, gene silencing of HMOX1 in MSC3D substantially decreased the conversion of LC3-I to LC3-II and expression levels of ATG5 without significant effect on BECN1 expression (), suggesting that HMOX1 signaling plays a critical role in autophagy induction, as well as modulation of ROS production, in MSCs.
Figure 6. Role of HIF1A-HMOX1 axis in autophagy activation in MSCs. (A and B) MSC2D were treated with CoPP, a pharmacological HMOX1 inducer, for 12 h. Expression levels of BECN1 and ATG5 (A), and LC3-II:LC3-I (B) were determined by western blot analysis. (C and D) MSC3D were transfected with siRNA targeting HMOX1 (siHMOX1) and expression levels of BECN1 and ATG5 (C), and LC3-II:LC3-I (D) were evaluated by western blot analysis. (E) Basal expression levels of HIF1A and hydroxy HIF1A in MSC2D and MSC3D were determined by western blot analysis. Expression levels of HIF1A and hydroxy HIF1A were quantified by densitometric analysis and are shown in the upper panel of the image. Values are presented as the fold change compared with MSC2D and are expressed as mean ± SEM (n = 3 independent experiments). * indicates p < 0.05 for HIF1A expression as compared with MSC2D; # indicates p < 0.05 for hydroxy HIF1A as compared with MSC2D. (F) MSC3D were transfected with HIF1A siRNA (siHIF1A) or control scrambled siRNA (Scr) and HMOX1 expression level was determined by western blot analysis. (Lower panel) Gene silencing efficiency was monitored by western blot analysis after 48 h of transfection. (G) MSC2D were treated with indicated concentrations of CoCl2, a HIF1A inducer, for 12 h and HMOX1 expression level was measured by western blot analysis. (H) MSC3D were treated with 3MA (5 mM) or Baf A1 (10 nM) for 24 h and HMOX1 expression level was measured by western blot analysis. (I) MSC3D were transfected with siRNA targeting LC3B (siLC3B) or control scrambled siRNA (Scr) for 36 h and HMOX1 expression level was determined by western blot analysis. For all the western blot analyses, band intensity, indicating expression levels of the target genes, was quantified by densitometric analysis and presented in the upper panel of the image. Values are presented as mean ± SEM (n = 3 independent experiments). * and ** represent p < 0.05 and p < 0.01, respectively compared to control cells. GAPDH was used as loading control for all western blot experiments
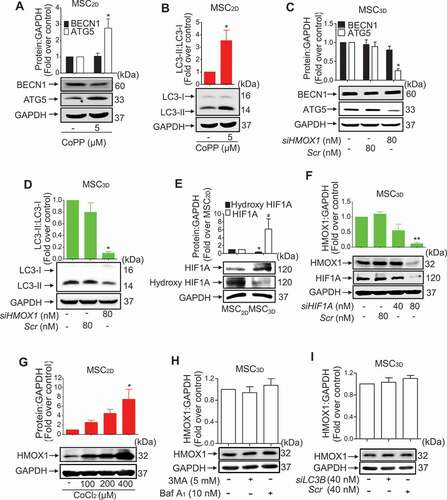
To further clarify the upstream signaling for HMOX1 induction and autophagy activation, we examined the involvement of HIF1A. As indicated in , HIF1A expression level was higher in MSC3D than MSC2D, while hydroxy-HIF1A level (inactive form) was slightly higher in MSC2D. In a series of experiments to verify the functional role of HIF1A, genetic ablation of HIF1A prominently suppressed HMOX1 protein expression in MSC3D (). Moreover, treatment with CoCl2, a pharmacological inducer of HIF1A, significantly increased HMOX1 expression in MSC2D (Fig. S3 and ), collectively indicating that HIF1A activation critically contributes to HMOX1 induction in MSC3D.
To further investigate the relationship between autophagy flux and HIF1A-HMOX1 axis, we investigated the role of autophagy in the modulation of HMOX1 expression in MSC3D. As indicated in , treatment of MSCs with autophagy inhibitors, including 3MA and Baf A1, did not significantly affect HMOX1 expression in MSC3D. Furthermore, gene silencing of LC3B generated similar results (), indicating that autophagy is not required for HMOX1 induction in MSC3D.
In vivo effects of MSC3D transplantation on the expression of the genes related with autophagy and oxidative stress
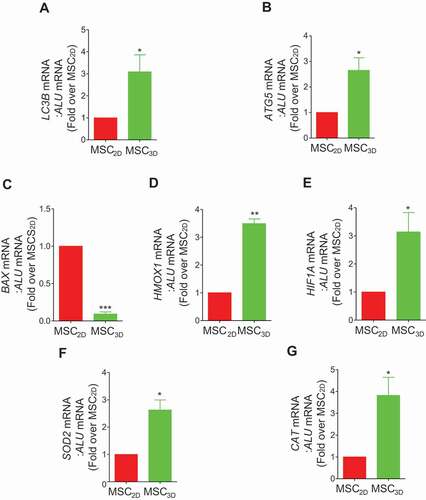
To validate the effects of MSC3D transplantation on autophagy induction and modulation of oxidative stress in vivo, mRNA levels of various target genes were evaluated in MSC2D- and MSC3D-transplanted group. LC3B and ATG5 mRNA expressions levels were higher in MSC3D (), consistent with the observations from in vitro study. In addition, BAX mRNA expression was suppressed (), while HMOX1 and HIF1A expressions were highly up-regulated following MSC3D transplantation (). Likewise, mRNA expression of anti-oxidant genes, such as SOD2 and CAT, were also significantly elevated in MSC3D-transplanted cells (). These results substantiated autophagy induction and suppression of ROS production in the in vivo model of MSC3D.
Figure 7. In vivo mRNA expression of the genes related with autophagy, apoptosis, and oxidative stress in transplanted MSC2D and MSC3D. 2 × 10⁶ MSC2D and equivalent MSC3D were injected subcutaneously in BALB/c nude mice. The subcutaneous tissue near the transplantation site was retrieved 3 days post- transplantation and mRNA expression levels of the target genes were determined as described in the method section. In order to check the mRNA levels specific to transplanted cells, primers used for PCR amplification were human gene sequence. ALU, which is specifically expressed in the human was used as the loading control. Messenger RNA levels of LC3B (A), ATG5 (B), BAX (C), HMOX1 (D), HIF1A (E), SOD2 (F), and CAT (G) were measured by qRT-PCR. The data are presented as mean ± SEM (n = 5 and 3 independent experiments). *, **, and *** indicate p < 0.05, p < 0.01, and p < 0.001, respectively compared with MSC2D.
High therapeutic effects of MSC3D transplantation in murine model of DSS-induced colitis is mediated by autophagy induction
To further determine the therapeutic efficacy of MSC3D transplantation and the role of autophagy induction in vivo, we prepared MSC3D transiently silenced with LC3B siRNA and injected intraperitoneally into the mice with DSS-induced colitis (). In a series of the experiments to evaluate pathological conditions, decreased body weight due to DSS treatment was restored more effectively by MSC3D transplantation than MSC2D. Interestingly, protective effect of MSC3D transplantation was substantially disappeared in LC3B siRNA transfected MSC3D (MSC3D-siLC3B). No significant decrease in the protective effect by scrambled siRNA transfected MSC3D (MSC3D-scr) was observed (). As depicted in , the severity of the disease was significantly decreased in MSC3D-transplanted group, while MSC2D did not generate a notable protective effect. Transplantation of MSC3D-siLC3B also did not recover severity. The protective effects of MSC3D transplantation by autophagy induction were further confirmed by measuring the colon length and MPO activity. Reduced colon length by DSS treatment was substantially restored by transplantation of MSC3D, which was not observed in MSC3D-siLC3B-transplanted group (). MSC3D transplantation more competently suppressed MPO activity enhanced by DSS treatment than MSC2D, and this was compromised by silencing of LC3B gene (). Histological analysis also revealed that DSS treatment-induced damaged mucosal integrity and massive infiltration of the immune cells into the colon were prominently improved by MSC3D transplantation, while no significant effect was observed by MSC2D transplantation. Likewise, these therapeutic effects by MSC3D transplantation were abrogated by gene silencing of LC3B ().
Figure 8. Critical role of autophagy activation in amelioration of DSS-induced colitis. (A) Timeline of the study. 3% DSS was provided to mice in each group for 7 days in drinking water, except control group. At day 1 of DSS treatment, different types of MSCs, including MSC2D, MSC3D, MSC3D transfected with LC3B siRNA (MSC3D-siLC3B), or MSC3D transfected with scrambled siRNA (MSC3D-scr) were intraperitoneally injected and mice were sacrificed at day 9 to evaluate the pathological conditions. (B) The change in body weight of mice in different treatment groups was recorded and represented as percentage change. (C) The extents of diarrhea, rectal bleeding, body weight decrease, and blood in stool were monitored every day and disease severity was calculated at day 7 on the basis of these symptoms. The disease severity was calculated by recording reduction in body weight (0–4), stool consistency (0–4), presence of rectal bleeding and hemoccult in stool (0–4). (D) The colons in each group were collected at day 9 and colon length was measured. The representative images in each group were shown. (E) MPO activity was evaluated to check the extent of neutrophil infiltration in the colon. MPO activity per mg of tissue was measured by colorimetry using O-dianisidine as a substrate. (F) Representative images of hematoxylin and eosin staining indicate infiltration and accumulation of monocytes (represented by *), extent of loss of goblet cells (represented by #), and ulceration and epithelial destruction (represented by arrowhead). (G and H) The colon tissues were collected and mRNA expression levels of Tnfa (G) and Tgfb (H) were measured. The data are represented as mean ± SEM (n = 5), * and *** indicate statistical significance p< 0.05 and p< 0.001, respectively compared to PBS treated group; # indicates p< 0.05 compared to MSC3D-transplanted group
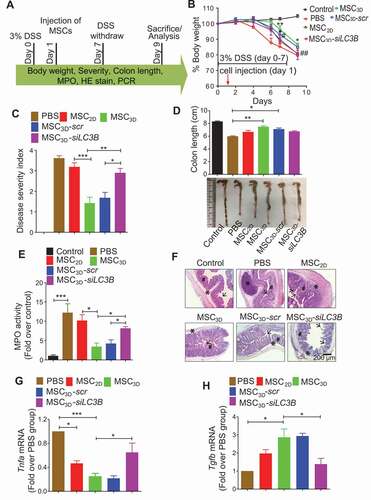
Finally, Tnfa expression was notably decreased in MSC3D transplantation group (). Interestingly, anti-inflammatory Tgfb mRNA level was enhanced by MSC3D transplantation (), while no significant effect on Il10 mRNA expression was observed (Fig. S4). The modulatory effects on expression of the inflammatory genes by MSC3D were abrogated by knockdown of LC3B gene (), indicating the crucial role of autophagy induction in anti-inflammatory effects by MSC3D transplantation.
Discussion
MSCs are attractive therapeutic agents for the treatments of a variety of diseases [Citation21]. However, the loss of ECM and the highly oxidative, hypoxic, and inflammatory microenvironment at the site of transplantation impair engraftment and survival of MSCs [Citation3,Citation8]. To overcome these limitations, recent studies have developed diverse strategies such as preconditioning cells with hypoxia or cytokines, genetic modifications, and 3D culture [Citation21]. In particular, 3D culture of MSC has shown effective therapeutic outcomes in bone and cartilage repair [Citation22], wound healing [Citation23], ischemic and cardiovascular defects [Citation24], liver and kidney diseases [Citation6], and higher potential for tissue repair in vivo [Citation25]. Recent studies have suggested that the higher therapeutic efficacy of MSC3D could be attributed by enhanced engraftment and survival rate. We have previously shown that MSC3D are more resistant to harsh oxidative stress compared with MSC2D wherein MSCs effectively regulated inflammation and showed enhanced therapeutic effect in an acute liver failure model [Citation26]. Similarly, a recent study also reports that 3D-cuture of MSCs enhances the resistance to oxidative stress-induced apoptosis of MSCs where treatment of H2O2 prevented apoptosis in MSC3D compared to MSC2D via inhibition of CASP3 and induction of SOD2 expression and promoted the therapeutic efficacy to treat oral mucositis [Citation27]. However, detailed molecular mechanisms underlying enhanced therapeutic efficacy by MSC3D remain elusive. In this study, we have elucidated the mechanisms which enable MSC3D to exhibit a higher functionality in DSS-induced colitis model. We demonstrated for the first time that autophagy induction and modulation of ROS production contribute toward improving the therapeutic efficacy of MSC3D. We have additionally identified that the HIF1A-HMOX1 axis critically contributes to autophagy induction and suppression of ROS production in MSC3D.
ROS act as vital cell signaling molecules and determine the fate of stem cells [Citation28]. While low and intermediate levels of ROS drive the proliferation and self-renewal of stem cells, abnormally high levels of ROS limit their self-renewal capacity and functions [Citation29]. In vivo, the MSC niche has low oxygen tension (2–8%) [Citation30]. However, in vitro, MSCs are typically cultured at 20% oxygen. This pro-oxidative condition may induce oxidative stress and genetic instability resulting in senescence or apoptosis. In contrast, culturing MSCs under lower oxygen tension improves lifespan and protects them from DNA damage [Citation31]. In this study, we observed that ROS production was suppressed in MSC3D via upregulation of anti-oxidant genes, including SOD2 and CAT (). In addition to anti-oxidant system, intracellular ROS levels are regulated by multiple mechanisms. We further examined the involvement of NADPH oxidase, which is considered a critical source for ROS production in MSCs [Citation32]. However, unexpectedly, NADPH oxidase activity was higher in MSC3D than MSC2D (Fig. S5A) suggesting that NADPH oxidase may not be a target for ROS production in MSC3D. Interestingly, this observation corresponded to a previous report demonstrating that a transient increase in NADPH oxidase activity in MSC3D strengthens the anti-oxidant system by triggering a negative feedback and promotes cell survival [Citation33]. Given that the transplantation site is often characterized by higher oxidative stress, these results indicate that enhanced cell viability and engraftment of MSC3D may be mediated, at least in part, via regulation of ROS production, in particular enhancing anti-oxidant system. With regards to the ROS production in MSC2D and MSC3D, previous studies have demonstrated an increase in ROS production in MSC3D [Citation27,Citation34], which is opposite to the present study. We assume that these contradictory results would be due to different experimental conditions, such as source of the MSCs used in each study and the number of the cells in spheroids during 3D culture. For example, previous studies have used the spheroids containing higher number of the cells than ours and big-sized spheroids might be more prone to severe hypoxia leading to the excessive oxidative stress. Although we could not address the reason for the conflicting results in ROS production, further studies seeking to the implication of spheroids preparation on ROS production would be worth considering for better understanding of the ROS production in MSCs and providing a model physiologically relevant.
There is a growing appreciation that autophagy and ROS production are closely related. For instance, ROS production leads to autophagy activation through MAPK/JNK signaling in MSCs [Citation35,Citation36]. Moreover, autophagy activation protects MSCs from oxidative stress, whereas suppression of autophagy results in enhanced ROS production in MSCs [Citation37]. Based on previous studies, it is likely that autophagy induction prevents ROS production in MSCs and acts as the self-defensive mechanism against oxidative stress-induced apoptosis. In the present study, MSC3D exhibited higher autophagy induction accompanied with lower level of ROS production, raising the possibility that autophagy induction modulates ROS production in our experimental condition. Although, herein, we did not thoroughly address the potential role of autophagy induction in the regulation of intracellular ROS production, deciphering the crosstalk between ROS signaling and autophagy induction in MSC3D would be an interesting avenue for future research.
Autophagy, a highly conserved self-digestive process, acts as a homeostatic mechanism in various stressful conditions [Citation13]. Autophagy modulates cell death and survival via complicated manners and its role in determining the fate of the cells depends upon the interactions with other conditions [Citation38]. Recently there has been increasing evidence that autophagy modulates survival, differentiation, and longevity of stem cells [Citation14]. For example, autophagy activation protects hematopoietic stem cells (HSCs) from starvation-induced apoptosis and maintains the longevity of old HSCs [Citation14]. Similarly, Zhang et al showed that atorvastatin-induced autophagy via AMP-activated protein kinase (AMPK)-MTOR (mechanistic target of rapamycin kinase) signaling contributes to the protection of MSCs from hypoxia or serum-starvation induced apoptosis [Citation17]. In contrast to the cytoprotective effects, autophagy induction also mediates apoptosis of MSCs induced by inflammatory cytokines [Citation39]. Moreover, inhibition of autophagy enhances the therapeutic effects of MSC transplantation [Citation18], suggesting that the role of autophagy in determining the fate of the stem cells would be determined by a context-dependent manner, which is similar to the modulation of cancer cells. In the present study, autophagy was highly induced in MSC3D as determined by increase in the expression of autophagy-related proteins (). Furthermore, inhibition of autophagy abrogated enhanced cell viability in MSC3D, whereas autophagy activation markedly increased cell viability in MSC2D (), collectively indicating that autophagy induction plays crucial role in the higher survival rate of MSC3D. In the experiments for investigating the role of autophagy in cell viability, treatment with Baf A1 and 3MA demonstrated higher suppressive effects on cell viability compared to those produced by gene silencing of LC3B or ATG5 (). These could be mediated via mechanisms independent of autophagy and nonspecific targeting of other signaling molecules, which are involved in the regulation of cell viability. To further confirm that autophagy induction contributes to the enhancement of cell viability in MSC3D, we also demonstrated that knockdown of autophagy-related genes suppressed cell viability in MSC3D (). In addition, we confirmed the pharmacological effect of 3MA on autophagy inhibition in our experimental system. 3MA treatment led to reduction in LC3-II formation and accumulation of SQSTM1 in MSC2D, while rapamycin treatment induced significant increase in LC3-II formation, but decrease in SQSTM1 expression (Fig. S1). All these results indicate that autophagy inhibition reinforces the reduction in cell viability of MSCs.
Mitophagy, a selective degradation of damaged mitochondria by autophagy, acts as a protective mechanism in mitochondrial stress, and contributes to enhanced cell viability and suppression of ROS production [Citation40]. Recent reports have shown that HIF1A induction activates mitophagy through upregulation of BNIP3 (BCL2 interacting protein 3) and BNIP3L/NIX (BCL2 interacting protein 3 like) expression [Citation41,Citation42]. As we observed HIF1A induction in MSC3D, we further investigated whether mitophagy occurs in MSC3D. During mitophagy induction, damaged mitochondria are removed resulting in loss of mitochondrial mass. We measured mitochondrial mass in MSCs and observed a significant reduction in MSC3D compared to MSC2D (Fig. S5B). In addition, mitochondrial membrane potential was also significantly decreased in MSC3D (Fig. S5C), raising a possibility of the removal of damaged mitochondria and induction of mitophagy in MSC3D. In the present study, while we demonstrate the initial stage evidence related to mitophagy in MSC3D, further studies regarding the role mitophagy and PINK1-PRKN/Parkin (parkin RBR E3 ubiquitin protein ligase) axis in the enhanced cell viability and modulation of ROS in MSCs will provide the further insights into the cellular biology of 3D culture of MSCs. With regards to the mechanisms underlying autophagy induction, we clearly demonstrated the crucial role of HMOX1 signaling. Apart from HMOX1 signaling, autophagy induction is regulated by diverse mechanisms, involving AMPK, SIRT1 (sirtuin 1), and FOXO3/FOXO3A signaling [Citation43,Citation44]. To further clarify the upstream signaling mechanisms underlying autophagy induction in MSC3D, we investigated the potential role of these signaling molecules. However, unexpectedly, expression levels of FOXO3 and p-AMPK were found to be lower in MSC3D, and no significant changes in SIRT1 expression between MSC2D or in MSC3D was observed (Fig. S6). Given that autophagy induction is modulated generally via multiple signaling mechanisms, other signaling molecules in addition to HMOX1, would be implicated in 3D culture-induced autophagy. Therefore, further studies are needed to gain better insights into the other probable mechanisms by which 3D culture enhances autophagic flux in MSCs.
Autophagy induction is implicated in various biological responses of MSCs, in addition to the regulation of cell death/survival. For example, treatment of MSC2D with rapamycin exhibits enhanced immunomodulatory effects through up-regulation of IL10, TGFB, and indoleamine-pyrrole 2,3-dioxygenase in graft-versus-host disease model [Citation45]. Moreover, autophagy induction enhances secretion of anti-inflammatory cytokine and improves the immunosuppressive effects in MSCs [Citation46]. Since previous studies have demonstrated that MSC3D transplantation effectively alleviates inflammation [Citation47], and efficiently inhibits CD4+ and CD8+ T cell infiltration and Th1 and Th17 differentiation in colitis model [Citation48], we examined the functional role of autophagy in the therapeutic effects by MSC3D transplantation in murine colitis model. Herein, we observed that transplantation of MSC3D enhanced immunosuppressive effect, suppressed Tnfa expression, and increased Tgfb expression, all of which were substantially abrogated by autophagy inhibition (), demonstrating the crucial role of autophagy induction in higher therapeutic effects by MSC3D transplantation in colitis.
HMOX1 exhibits a potent immunomodulatory and cytoprotective functions in various types of cells [Citation49]. Modulation of ROS production [Citation50] and autophagy induction [Citation51] are implanted in biological actions of HMOX1. Recent studies have also shown that high therapeutic effect of MSCs co-relates to up-regulation of HMOX1 [Citation52]. Moreover, HMOX1 signaling plays a crucial role in enhancing the survival rate of MSCs [Citation53], enhanced angiogenesis [Citation54], and inhibition of apoptosis [Citation55]. Herein, we found that HMOX1 induction contributes to suppression of ROS production and autophagy induction in MSC3D, both of which mediate prevention of MSC3D apoptosis. While it is well established that HMOX1 plays a role in a number of biological functions of MSCs, to the best of our knowledge, this is the first report demonstrating contribution of HMOX1 signaling in therapeutic potential of MSC3D.
HIF1A acts as a regulator of metabolic fate and stemness of MSCs [Citation56]. The upregulation of HIF1A in MSC3D enhances the angiogenic potential of MSCs [Citation57]. However, the role of HIF1A in regulating the survival of MSCs in 3D culture remains to be elucidated. Herein, we observed that HIF1A plays a pivotal role in HMOX1 induction (). The crucial role of HIF1A in HMOX1 induction and subsequent contribution for boosting the survival rate of MSC3D are in line with the previous reports showing that moderate hypoxia enhances the cell survival rate in vitro [Citation58]. Interestingly, we also observed metabolic changes when MSCs were cultured as MSC3D. MSCs in 3D culture exhibited quiescence represented by higher percentage of MSCs in G0 phase and decreased dehydrogenase activity and ATP production in MSC3D compared to MSC2D (Fig. S7A-C). Moreover, extracellular acidification and glucose uptake was significantly increased in MSC3D, suggesting the increased glycolysis, whereas oxygen consumption rate was significantly decreased, indicating the decreased oxidative phosphorylation in MSC3D compared to MSC2D (Fig. S7D-F). Collectively, the shift in metabolic activity of MSCs from oxidative stress to glycolytic metabolism and less consumption of oxygen suggest the occurrence of mild hypoxia during 3D culture of MSCs, which could be involved in upregulation of HIF1A in MSC3D. Indeed, glycolysis has been reported to affect the immunomodulatory effect of MSCs by regulating PGE2 and indoleamine-pyrrole 2,3-dioxygenase secretion [Citation59]. Thus, in addition to autophagy activation, HIF1A might have played important role in metabolic reconfiguration in MSC3D to enhance their therapeutic effect. Furthermore, this decrease in metabolic activity in MSC3D comapared to MSC3D could be due to the progression to quiescence. Indeed, MSCs in 3D culture showed low metabolic activity resulting their shift from metabolically active (proliferating) to quiescent cells. Interestingly, MSC3D demonstrated decreased level of cellular senescence (Fig S8A). Thus, maintenance of quiescence and reduction of cellular senescence might have enhanced the self-renewal and regenerative capacity of MSC3D. Notably, under normal circumstances, basal autophagy increases in quiescent stem cells and young MSCs [Citation60]. Autophagy induction might also have enhanced the therapeutic effect of MSC3D, at least in part, through maintenance of their quiescence and inhibition of cellular senescence. Apart from HIF1A, NFE2L2/NRF2 (nuclear factor, erythroid 2 like 2) is also known as a critical transcription factor for HMOX1 induction [Citation61]. To elucidate the related mechanisms for HMOX1 induction in more detail, we investigated if NFE2L2 is implicated in HMOX1 induction. However, unexpectedly, NFE2L2 expression was rather decreased in MSC3D (Fig. S8B). NFE2L2 expression level is determined by post-translational mechanisms, as well as at transcriptional level. NFE2L2 is susceptible for ubiquitination upon binding with KEAP1 (kelch like ECH associated protein 1), which acts as a redox sensor, and KEAP1 plays an important role in determining the stability of NFE2L2. Accumulating reports have shown that SQSTM1 competes with NFE2L2 for binding with KEAP1 and binding of SQSTM1 with KEAP1 induces degradation of KEAP1, which finally results in stabilization of NFE2L2 protein [Citation62]. In addition, NFE2L2 induces increase in SQSTM1 expression, as SQSTM1 gene promoter region consists of ARE region, which creates a positive feedback loop between NFE2L2 and SQSTM1 [Citation63]. In this study, we demonstrated that SQSTM1 expression was markedly decreased in MSC3D than MSC2D (). Thus, it is likely that KEAP1-mediated NFE2L2 ubiquitination and subsequent degradation by the proteasome would be enhanced in MSC3D. Although we could not thoroughly understand the mechanisms underlying suppression of NFE2L2 expression in MSC3D, it would be interesting to decipher the role of SQSTM1 signaling in NFE2L2 expression in MSCs.
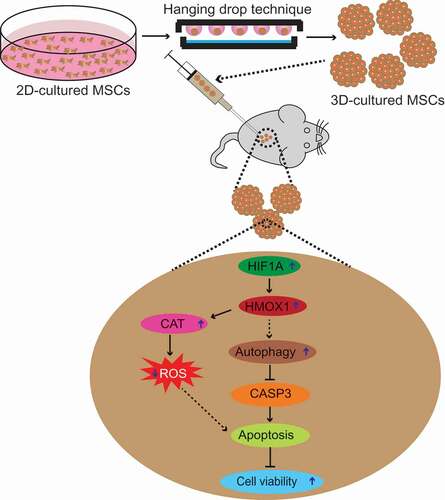
In summary, the present study demonstrates that the higher cell survival and therapeutic effects observed in MSC3D transplantation are mediated via suppression of ROS production and induction of autophagy. Autophagy induction negatively modulates apoptosis by targeting BAX and lower level of ROS production leads to enhanced survival of MSCs. Therefore, it is likely that autophagy induction and suppression of ROS generation synergistically enhance cell viability in MSC3D. We further showed that HIF1A-HMOX1 axis plays a critical role in both autophagy induction and suppression of ROS production in MSC3D (). The higher therapeutic efficacies by transplantation of MSC3D and critical role of autophagy induction were further validated in vivo DSS-induced colitis model. Based on these results, we propose that autophagy induction and modulation of ROS production are promising strategies to enhance cell viability and physiological functions of MSCs to gain optimum therapeutic benefits following transplantation of stem cells in various disease models.
Figure 9. Proposed model for enhanced cell viability via autophagy induction and modulation of ROS production in MSC3D. Transplantation of MSC3D exhibits enhanced viability and higher therapeutic potential for treatment of various disease models compared to MSC2D. Herein, we examine the role of autophagy activation and ROS production in context to enhanced viability and functionality in MSCs. We demonstrated that autophagy is induced and intracellular ROS level is decreased in MSC3D in comparison with MSC2D. Autophagy activation leads to suppression of apoptosis by targeted degradation of BAX, a pro-apoptotic gene, and thereby enhances the viability of MSC3D. The crucial role of autophagy induction in the therapeutic potential by MSC3D transplantation is confirmed in DSS-induced colitis model. Autophagy activation and suppression of ROS production in MSC3D are mediated via HIF1A-HMOX1 axis. The molecular mechanisms underlying the increased expression of HIF1A in MSC3D and by which HMOX1 signaling induces autophagy activation remain to be elucidated
Materials and methods
Cell culture
Human mesenchymal stromal cells (MSCs) derived from adipose tissues were purchased from Stemore, South Korea (STC002). MSCs were cultured in alpha-MEM (Hyclone, SH30265.01) containing 10% (v:v) fetal bovine serum (Hyclone, 2030348) and 1% (v:v) antibiotics/antimycotics (GenDEPOT, CA002). Cells from passages 4–8 were used in this study.
Materials
Reagents used for cell culture were procured from Hyclone laboratories. Cell viability assay kit/MTS assay kit (G3582) was obtained from Promega Corporation. Primary antibodies against LC3 (2775), BECN1 (3738), BCL2 (3498), GAPDH (2118), SOD2 (13194), CAT (14097), CASP3 (9662), hydroxyl HIF1A (3434), AMPK (5831), p-AMPK (2531), NFE2L2 (12721), ATG7 (2631s), and FOXO3 (2497) were purchased from Cell Signaling Technology. Rapamycin (9904S) was procured from Cell Signaling Technology. Antibodies specific for HIF1A (ab82832), PIK3C3 (ab124905), and LAMP2 (ab13524) were acquired from Abcam. Similarly primary antibodies against ATG5 (PA1-46178), and LAMP1 (PA1-654A) were purchased from Thermo Scientific. Antibodies specific for HMOX1 (ADI-SPA-894), and SIRT1 (sc-15404) were acquired from Enzo Life Sciences and Santa Cruz Biotechnology, respectively. Horseradish peroxidase (HRP) conjugated secondary antibodies against mouse (NCL 1430 KR) and rabbit (NCL 1460 KR) were purchased from Thermo Scientific. Carboxyfluorescein succinimidyl ester (CFSE) (ThermoFisher, C34554) and human genomic DNA kit (Bioneer, K-2012) were used for determining in vivo cell viability.
Animals
Mice (C57BL/6: C57BL/6NCrljOri and BALB/c-Nude: CAnN.Cg-Foxn1nu/crljOri) were purchased from Orient Biosciences (South Korea) and maintained under pathogen-free conditions. All animal experiments were conducted according to the protocols approved by Institutional Animal Care and Use Committee of Yeungnam University (IACUC: YU 2018–028). The sample size was calculated in the basis of “E” value, where “E” represents degree of freedom of analysis of variance (ANOVA). The sample size that keeps the value of “E” between 10 and 20 is considered as an adequate [Citation64].
Preparation of 3D-cultured MSC (MSC3D)
MSC3D were prepared by hanging drop technique as described previously [Citation26,Citation65]. The optimized size of spheroid (containing 1000 MSCs) was used in this study based on our previous study [Citation26]. Briefly, 1 × 10⁶ MSCs derived from adipose tissues were suspended in 25 ml of media and cell suspension (25 µL) was used to form hanging drops containing 1,000 cells per spheroid. Cells were incubated at 37ºC in 5% CO2 atmosphere. At day 3 of incubation, MSC3D were collected and used for further experiments.
Evaluation of intracellular levels of ROS in MSC3D
The amounts of ROS produced by MSC2D and MSC3D were determined by fluorescence method using 2ʹ,7ʹ-dichlorofluorescein diacetate (DCFDA; Sigma, D6883), as described previously [Citation66]. In brief, 3 × 10⁴ cells from MSC2D and 30 MSC3D spheroids were seeded into a 96-well black plate and treated with DCFDA reagent for 1 h. ROS levels were then measured using a microplate reader (SPARK 10 M, TECAN, Untersbergstrasse, Austria) at excitation and emission wavelengths of 485 nm and 535 nm, respectively. Fluorescence intensities were normalized with the respective DNA contents.
Determination of cell viability (MTS assay)
The cell viability of MSC2D and MSC3D was measured as described previously [Citation67]. Briefly, 2 × 10⁴ cells (MSC2D) or 20 spheroids (MSC3D) in each well were seeded in 96-well plate. After overnight incubation, cells were treated with various pharmacological agents as indicated in the figure legends and further incubated with 20 μL (3-[4, 5-dimethylthiazol-2-yl]-5-[3-carboxymethoxyphenyl]-2-[4-sulfophenyl]-2 H-tetrazolium) solution (MTS reagent; Promega, G3580) for 2 h at 37°C. The cell viability was determined by measuring the absorbance at 490 nm using a SPECTROstarNano microplate reader (BMG Labtech, Ortenburg, Germany).
Preparation of cellular extracts and western blot analysis
Total cellular extracts were prepared using radioimmunopreciptation assay buffer (Thermo Scientific, 89901) containing halt protease inhibitor cocktail (Thermo Scientific, 78430). For western blot analysis, 30–50 μg of total cellular protein was resolved in 8–15% sodium dodecyl sulfate-polyacrylamide gel electrophoresis (SDS-PAGE) and transferred to polyvinylidene difluoride (PVDF) membranes (Sigma, IPVH00010). The membranes were then blocked with 5% skim milk for 1 h and incubated with designated primary antibodies (1:1000 dilutions in 3% BSA (Sigma-Aldrich, 05470) in TBS (Bio-rad, 1706435) containing 0.1% Tween 20 (Sigma-Aldrich, P9416) overnight at 4°C. After washing with TBS containing 0.1% Tween 20, the membranes were further incubated with secondary antibodies conjugated with horseradish peroxidase (1:4000) for 1 h. Finally, the images were captured using a Fujifilm LAS-4000 mini (Fujifilm, Tokyo, Japan) and quantified by densitometric analysis using GelQuant. NET software (BiochemLab Solutions, CA, USA).
RNA isolation and quantitative polymerase chain reaction (qPCR)
Messenger RNA expression levels of the target genes were measured by qPCR as described previously [Citation68]. Briefly, total RNAs were isolated using Qiagen lysis solution (79306), according to the manufacturer’s instructions. Complementary DNA was then synthesized through reverse transcription of total RNA (1 μg) using Go Script reverse transcription system (Promega, A500C). Finally, quantitative real time PCR amplification was carried out using a Roche Light Cycler 1.5 (Roche Diagnostics, 04929292001) and an absolute QPCR SYBR green capillary mix AB gene system (Thermo Scientific, AB-1285) at 95°C for 15 min, 40 cycles at 95°C for 15 s, 60°C for 30 s and 72°C for 30 s. The relative mRNA expression of target genes were determined by comparative threshold (Ct) method in which the Ct value of the target mRNA was normalized to that of GAPDH or ALU. The primers for PCR amplifications of LC3B [Citation69], ATG5 [Citation70], HMOX1 [Citation71], HIF1A [Citation72], SOD2 [Citation73], CAT [Citation74], ALU [Citation26] and GAPDH [Citation70] were derived from previous studies. The primers for BAX were designed using Primer3 Input software (online available at http://primer3.ut.ee/) and specific amplification reactions in our experimental conditions were confirmed. The sequences of the primers used in this study are listed in .
Table 1. Sequences of primers used for quantitative RT-PCR
Transient transfection with small interfering RNA (siRNA)
3 x 10⁵ MSC2D or 300 MSC3D were seeded onto 35 mm dish. After overnight incubation, cells were transfected with corresponding siRNA of target gene or control scrambled siRNA using Dharmafect transfection reagent (Horizon, T-2003-03) according to the manufacturer’s instructions. Gene silencing efficiency was determined by western blot analysis after 48 h of transfection. The siRNA duplexes used in this study were procured from Bioneer (Daejeon, South Korea) and are listed in .
Table 2. Sequences of small interfering RNA (siRNA) used for transient transfection
ATP production
ATP production in MSC2D and MSC3D was assayed using cellTiter-Glo using luminescence method (Promega, G7570) according to the manufacturer’s protocol. Briefly, 104 MSC2D or 10 MSC3D (each MSC cluster containing 1000 MSCs) were kept in a white 96-well plate in 100 μL media. The cells were kept at room temperature for 30 min and the 100 μL ATP assay reagent was added to each well. The plate was kept in the shaker for 30 min for complete lysis of the cells and luminescence was measured using microplate reader.
Extracellular acidification rate
Extracellular acidification was measured to evaluate the extent of glycolysis in 2D and 3D-cultured cells. Whole assay was performed using extracellular acidification assay kit (Abcam, ab197244) according to the supplier’s protocol. Briefly, 5 × 10⁴ 2D cultured cells or 50 spheroids were suspended in 100 μL media and kept for 3 h at 37°C at normal atmospheric air condition. Then, the cells were centrifuged and washed with respiration buffer. The cells were suspended in 150 μL respiration buffer and seeded in a black 96-well plate. To each well, 10 μL of glycolysis assay reagent was added. The fluorescence intensity was measured for 120 min at an interval of 2 min at 37°C. Finally, the fluorescence intensity of each sample was deducted with blank and was normalized with the DNA content.
Cell cycle analysis
Cell cycle analysis was carried out by flow cytometry. Single cells were prepared from 2D and 3D-cultured MSCs by using trypsin. The cells were then washed, centrifuged at 300 x g, for 5 min, and fixed using 70% ethanol for 30 min at 4°C. After 30 min, ethanol was completely removed by washing with DPBS (Hyclone, SH30028.02). Then, cells were treated with ribonuclease (0.1 mg/mL; Sigma-Aldrich, R6513) for 30 min and 0.1 mg/mL propidium iodide (PI; Sigma, P4170) solution for 30 min in ice. Finally, the cells were analyzed using flow cytometer (BD Biosciences, CA, USA).
Glucose uptake
Glucose uptake by 2D-cultured and 3D-cultured MSCs was evaluated by using 2-(N-(7-nitrobenz-2-oxa-1,3-diazol-4-yl)amino)-2-deoxyglucose (2-NBDG; Abcam, ab235976), a fluorescent analog of glucose. Briefly, single cells derived from 2D or 3D-cultured cells were suspended in 500 μL DPBS with 0.5% FBS containing 2-NBDG at a concentration of 20 μg/mL and kept in cell culture incubator for 1 h. Cells were then centrifuged and washed with DPBS. Then, cells were stained with PI at concentration of 1 μg/mL for 10 min in ice in order to exclude PI positive dead cells. Finally cells were analyzed by FACS within 30 min.
Measurement of in vivo cell engraftment of transplanted MSC2D and MSC3D at transplantation site
In vivo cell engraftment efficacy after transplantation were evaluated by measuring human genomic DNA levels. For this, 1 × 10⁶ MSC2D or 1000 MSC3D were suspended into 200 μL DPBS and injected subcutaneously in 6- to 7-weeks-old male BALB/c nude mice. The area around the cell injection site was retrieved at day 0, 1, 3, and 7 post-transplantation. The retrieved tissue was chilled with liquid nitrogen, homogenized with mortar and pestle, and finally suspended in SDS (1% w:v; Sigma, L3771) and EDTA (20 mM; Sigma, V000114) prepared in distilled water. The DNA extracts were prepared using genomic DNA extraction kit (Bioneer Corporation, K-2012) according to manufacturer’s protocol and quantified using nanodrop technique (Nanodrop; TECAN). Quantitative real-time PCR (qRT-PCR) for genomic DNA was performed using 25 ng of genomic DNA, 5 µL of SYBR green (Thermo scientific, AB-1285), and 37.5 nM of ALU primer. The percentage of human genomic DNA in the transplantation site was calculated on the basis of calibration curve prepared as described previously [Citation26].
In vivo cell viability was also evaluated by in vivo imaging of fluorescence stained cells using fluorescence-labeled organism bioimaging instrument (FOBI; NeoScience, South Korea). MSCs were stained with carboxyfluorescein diacetate duccinimidyl ester (CFSE) and the stained cells were cultured in 2D or 3D. After formation of spheroids in MSC3D, fluorescence intensity was measured in cells collected from both MSC3D and MSC2D. Then, MSC3D and MSC2D (with equal initial fluorescence) were then injected subcutaneously and the fluorescence intensity of the CFSE-labeled cells was evaluated at day 0 and 3.
In vivo modulation of autophagy induction and expression of anti-oxidant genes in transplanted MSC2D and MSC3D
Messenger RNA expression levels of upstream and downstream targets of autophagy and anti-oxidant genes in the transplanted cells were measured by qRT-PCR. Briefly, 2 × 10⁶ MSC2D or 2000 MSC3D were injected subcutaneously in 6- to 7- weeks-old male BALB/c nude mice. The subcutaneous tissue near the injection site was retrieved at day 3 post-transplantation. The retrieved tissues were chilled in liquid nitrogen and homogenized with mortar and pestle. After total RNA isolation, mRNA expression levels of the target genes were measured by qPCR and comparative threshold (Ct) method as described previously. Finally, the mRNA levels of target genes were normalized by the expression levels of ALU, which is exclusively present in transplanted human cells.
In vivo therapeutic effect of MSC3D in murine model of DSS-induced colitis
For induction of colitis, male C57BL/6 mice (7–8 weeks) received 3% DSS (MPO biomedicals, 160110) in drinking water ad libitum for 7 days. Animals in each groups were selected randomly. One day after DSS administration, MSC2D, MSC3D, scrambled transfected MSC3D (MSC3D-scr), and LC3B siRNA transfected MSC3D (MSC3D-siLC3B) were injected intraperitoneally. Body weight and clinical symptoms were recorded daily. The disease severity was calculated on the basis of decreased body weight, rectal bleeding, stool consistency and presence of blood in stool at day 7. At day 9, mice were sacrificed and the colon tissues were used for gross examination of colon, histological analysis, MPO assay, and PCR.
Myeloperoxidase (MPO) assay
The extent of neutrophil infiltration was assessed by measuring MPO activity as described previously [Citation48]. Briefly, colon was weighed and homogenized in 50 mM PBS (pH 6; ThermoFisher, 70011044) containing hexadecyltrimethylammonium bromide (0.5% w:v; Sigma-Aldrich, H6269). Following centrifugation, the supernatant (20 µL) was collected and mixed with 0.0001% v:v hydrogen peroxide (90 µL; Sigma, H1009) and 2 mg/mL O-dianisidine (90 µL; Sigma-aldrich, D3252) in 50 mM PBS prepared from 10x PBS in a 96-well plate. After incubation for 10 min, absorbance was measured at 460 nm using SPARK 10 M.
Hematoxylin and eosin (HE) staining
The isolated colon was cleaned with PBS to remove feces, fixed in 4% paraformaldehyde (Sigma, 1.00496) for 30 min, and soaked in 30% w:v sucrose (Sigma, S0389) for 48 h. Thin sections of colon (25 µm) were prepared using freezing-sliding microtome (Thermo Scientific, Microm HM 450). The slices were then mounted on slides, rehydrated, and stained with hematoxylin (ScyTek laboratories, HMM500) and eosin (Muto pure chemicals, 3201.2). Slides were washed with PBS, dehydrated with gradients of alcohol, and covered with a coverslip using mounting solution. The images were captured using optical microscope (Nikon Eclipse Ti). Based on the histological changes in the colon observed in the HE staining, the severity of pathophysiology was determined by evaluating the extent of inflammatory cell infiltration, epithelial damage, goblet cell loss, hyperplasia, and cryptitis.
TUNEL assay
The TUNEL assay was performed in single cell derived from MSC2D and MSC3D. The assay was performed using tunnel assay kit (Abcam, ab66108) according to the protocol provided by manufacturer. Briefly, cells from 2D- and 3D-derived single MSCs were fixed with 4% paraformaldehyde solution for 15 min, followed by fixing with 70% ethanol. The fixed cells were washed with washing buffer and centrifuged to get cell pellets. Then, cells were incubated with staining solution for 60 min at 37°C. The cells were washed with rinse buffer and centrifuged. Finally, cells were incubated with PI and RNAse for 30 min at room temperature and analyzed with flow cytometry. The result was analyzed using FlowJo software.
Mitochondrial mass
To determine the mitochondrial mass, MitoTrackerTM Green FM (ThermoFisher Scientific, M7514) was used according to the manufacturer’s protocol. 2D- and 3D-derived single cells were incubated with 150 nM of MitoTracker Green for 30 min at 37°C in dark conditions. After 30 min of incubation, cells were washed with DPBS twice and analyzed in a flow cytometer. The data were analyzed using Flowjo software.
Lysosomal activity
Lysosomal activity was measured using LysoTrackerTM Red DND-99 (ThermoFisher Scientific, L7528), that accumulated in the acidic environment of lysosome. For this, 2D and 3D-derived cells were incubated with 50 nM of LysoTrackerTM Red DND-99 for 1 h in an incubator at 37°C. Finally, the stained cells were washed with DPBS and analyzed using a flow cytometer. The lysosomal activity was determined by analyzing the data using FlowJo software.
Statistical Analysis
Results are expressed as mean ± SEM. Data were analyzed using GraphPad Prism software version 5 (GraphPad Software, La Jolla, CA, USA) and compared using unpaired t-test or one-way ANOVA. p < 0.05 was accepted as statistically significant.
Supplemental Material
Download Zip (5 MB)Acknowledgments
This study was supported by the Basic Science Research Program through the National Research Foundation of Korea (NRF) funded by the Ministry of Science, ICT, and Future Planning (grants 2015R1A5A2009124 and 2020R1C1C1004733); and by the Basic Science Research Program through the National Research Foundation of Korea (NRF) funded by the Ministry of Education (grants 2018R1D1A1B0704970 and 2020R1A6A1A03044512).
Disclosure statement
The authors declare no competing interests.
Supplemental data
Supplemental data for this article can be accessed here.
Additional information
Funding
Related Research Data
References
- Hoogduijn MJ, Lombardo E. Mesenchymal stromal cells anno 2019: dawn of the therapeutic era? Concise review. Stem Cells Transl Med. 2019;8(11):1–9.
- Baldari S, Di Rocco G, Piccoli M, et al. Challenges and strategies for improving the regenerative effects of mesenchymal stromal cell-based therapies. Int J Mol Sci. 2017;18(10):2087.
- Chang W, Song BW, Moon JY, et al. Anti-death strategies against oxidative stress in grafted mesenchymal stem cells. Histol Histopathol. 2013;28(12):1529–1536.
- Regmi S, Jeong J-H. Superiority of three-dimensional stem cell clusters over monolayer culture: an archetype to biological application. Macromol Res. 2016;24(12):1037–1046.
- Ylöstalo JH, Bartosh TJ, Coble K, et al. Human mesenchymal stem/stromal cells cultured as spheroids are self‐activated to produce prostaglandin E2 that directs stimulated macrophages into an anti‐inflammatory phenotype. Stem Cells. 2012;30(10):2283–2296.
- Xu Y, Shi T, Xu A, et al. 3D spheroid culture enhances survival and therapeutic capacities of MSCs injected into ischemic kidney. J Cell Mol Med. 2016;20(7):1203–1213.
- Bartosh TJ, Ylöstalo JH, Mohammadipoor A, et al. Aggregation of human mesenchymal stromal cells (MSCs) into 3D spheroids enhances their antiinflammatory properties. Proc Natl Acad Sci USA. 2010;107(31):13724–13729.
- Song H, Cha M-J, Song B-W, et al. Reactive oxygen species inhibit adhesion of mesenchymal stem cells implanted into ischemic myocardium via interference of focal adhesion complex. Stem Cells. 2010;28(3):555–563.
- Wei H, Li Z, Hu S, et al. Apoptosis of mesenchymal stem cells induced by hydrogen peroxide concerns both endoplasmic reticulum stress and mitochondrial death pathway through regulation of caspases, p38 and JNK. J Cell Biochem. 2010;111(4):967–978.
- Matsuda S, Nakagawa Y, Kitagishi Y, et al. Reactive oxygen species, superoxide dimutases, and PTEN-p53-AKT-MDM2 signaling loop network in mesenchymal stem/stromal cells regulation. Cells. 2018;7(5):36. .
- Moya A, Paquet J, Deschepper M, et al. Human mesenchymal stem cell failure to adapt to glucose shortage and rapidly use intracellular energy reserves through glycolysis explains poor cell survival after implantation. Stem Cells. 2018;36(3):363–376. .
- Denton D, Xu T, Kumar S. Autophagy as a pro-death pathway. Immunol Cell Biol. 2015;93(1):35–42.
- Moreau K, Luo S, Rubinsztein DC. Cytoprotective roles for autophagy. Curr Opin Cell Biol. 2010;22(2):206–211.
- Warr MR, Binnewies M, Flach J, et al. FOXO3A directs a protective autophagy program in haematopoietic stem cells. Nature. 2013;494(7437):323–327.
- Song C, Song C, Tong F. Autophagy induction is a survival response against oxidative stress in bone marrow-derived mesenchymal stromal cells. Cytotherapy. 2014;16(10):1361–1370.
- Lee Y, Jung J, Cho KJ, et al. Increased SCF/c-kit by hypoxia promotes autophagy of human placental chorionic plate-derived mesenchymal stem cells via regulating the phosphorylation of mTOR. J Cell Biochem. 2013;114(1):79–88.
- Zhang Q, Yang Y-J, Wang H, et al. Autophagy activation: a novel mechanism of atorvastatin to protect mesenchymal stem cells from hypoxia and serum deprivation via AMP-activated protein kinase/mammalian target of rapamycin pathway. Stem Cells Dev. 2012;21(8):1321–1332.
- Dang S, Yu Z-M, Zhang C-Y, et al. Autophagy promotes apoptosis of mesenchymal stem cells under inflammatory microenvironment. Stem Cell Res Ther. 2015;6(1):247.
- Codogno P, Mehrpour M, Proikas-Cezanne T. Canonical and non-canonical autophagy: variations on a common theme of self-eating? Nat Rev Mol Cell Biol. 2011;13(1):7–12.
- Luzio JP, Hackmann Y, Dieckmann NMG, et al. The biogenesis of lysosomes and lysosome-related organelles. Cold Spring Harb Perspect Biol. 2014;6(9):a016840–a016840.
- Regmi S, Pathak S, Kim JO, et al. Mesenchymal stem cell therapy for the treatment of inflammatory diseases: challenges, opportunities, and future perspectives. Eur J Cell Biol. 2019;98(5–8):151041.
- Bhang SH, Lee S, Shin J-Y, et al. Transplantation of cord blood mesenchymal stem cells as spheroids enhances vascularization. Tissue Eng Part A. 2012;18(19–20):2138–2147.
- Amos PJ, Kapur SK, Stapor PC, et al. Human adipose-derived stromal cells accelerate diabetic wound healing: impact of cell formulation and delivery. Tissue Eng Part A. 2010;16(5):1595–1606.
- Lee EJ, Park SJ, Kang SK, et al. Spherical bullet formation via E-cadherin promotes therapeutic potency of mesenchymal stem cells derived from human umbilical cord blood for myocardial infarction. Mol Ther. 2012;20(7):1424–1433.
- Petrenko Y, Syková E, Kubinová Š. The therapeutic potential of three-dimensional multipotent mesenchymal stromal cell spheroids. Stem Cell Res Ther. 2017;8(1):94.
- Regmi S, Pathak S, Thanh TP, et al. Intraportally delivered stem cell spheroids localize in the liver and protect hepatocytes against GalN/LPS-induced fulminant hepatic toxicity. Stem Cell Res Ther. 2019;10(1):230.
- Zhang Q, Nguyen AL, Shi S, et al. Three-dimensional spheroid culture of human gingiva-derived mesenchymal stem cells enhances mitigation of chemotherapy-induced oral mucositis. Stem Cells Dev. 2012;21(6):937–947.
- Fatemeh A, Ali M, PM S. The role of reactive oxygen species in mesenchymal stem cell adipogenic and osteogenic differentiation: a review. Stem Cells Dev. 2015;24(10):1150–1163.
- Ito K, Hirao A, Arai F, et al. Reactive oxygen species act through p38 MAPK to limit the lifespan of hematopoietic stem cells. Nat Med. 2006;12:446–451.
- Mohyeldin A, Garzón-Muvdi T, Quiñones-Hinojosa A. Oxygen in stem cell biology: a critical component of the stem cell niche. Cell Stem Cell. 2010;7(2):150–161.
- Estrada JC, Albo C, Benguría A, et al. Culture of human mesenchymal stem cells at low oxygen tension improves growth and genetic stability by activating glycolysis. Cell Death Differ. 2011;19:743.
- Schieber M, Chandel Navdeep S. ROS function in redox signaling and oxidative stress. Curr Biol. 2014;24(10):R453–R462.
- Frasier CR, Moukdar F, Patel HD, et al. Redox-dependent increases in glutathione reductase and exercise preconditioning: role of NADPH oxidase and mitochondria. Cardiovasc Res. 2013;98(1):47–55.
- Lee M, Song BR, Kim DH, et al. Up-regulation of superoxide dismutase 2 in 3D spheroid formation promotes therapeutic potency of human umbilical cord blood-derived mesenchymal stem cells. Antioxidants. 2020;9(1):66.
- Liu G-Y, Jiang X-X, Zhu X, et al. ROS activates JNK-mediated autophagy to counteract apoptosis in mouse mesenchymal stem cells in vitro. Acta Pharmacol Sin. 2015;36(12):1473–1479.
- Liu D, Kong F, Yuan Y, et al. Decorin-modified umbilical cord mesenchymal stem cells (MSCs) attenuate radiation-induced lung injuries via regulating inflammation, fibrotic factors, and immune responses. Int J Radiat Oncol Biol Phys. 2018;101(4):945–956.
- Hu C, Zhao L, Wu D, et al. Modulating autophagy in mesenchymal stem cells effectively protects against hypoxia- or ischemia-induced injury. Stem Cell Res. Ther. 2019;10(1):120.
- Denton D, Kumar S. Autophagy-dependent cell death. Cell Death Differ. 2019;26(4):605–616.
- Dang S, Xu H, Xu C, et al. Autophagy regulates the therapeutic potential of mesenchymal stem cells in experimental autoimmune encephalomyelitis. Autophagy. 2014;10(7):1301–1315.
- Palikaras K, Lionaki E, Tavernarakis N. Mechanisms of mitophagy in cellular homeostasis, physiology and pathology. Nat Cell Biol. 2018;20(9):1013–1022.
- Palikaras K, Lionaki E, Tavernarakis N. Mitophagy: in sickness and in health. Mol Cell Oncol. 2016;3(1):e1056332.
- Schiavi A, Maglioni S, Palikaras K, et al. Iron-starvation-induced mitophagy mediates lifespan extension upon mitochondrial stress in c. elegans. Curr Biol. 2015;25(14):1810–1822.
- Pun NT, Subedi A, Kim MJ, et al. Globular adiponectin causes tolerance to lps-induced tnf-alpha expression via autophagy induction in RAW 264.7 macrophages: involvement of SIRT1/FoxO3A axis. PloS One. 2015;10(5):e0124636.
- Raut PK, Choi DY, Kim SH, et al. Estrogen receptor signaling mediates leptin-induced growth of breast cancer cells via autophagy induction. Oncotarget. 2017;8(65):109417–109435.
- Kim K-W, Moon S-J, Park M-J, et al. Optimization of adipose tissue-derived mesenchymal stem cells by rapamycin in a murine model of acute graft-versus-host disease. Stem Cell Res Ther. 2015;6(1):202.
- Gao L, Cen S, Wang P, et al. Autophagy improves the immunosuppression of CD4+ T cells by mesenchymal stem cells through transforming growth factor‐β1. Stem Cells Transl Med. 2016;5(11):1496–1505.
- Molendijk I, Barnhoorn MC, de Jonge-muller ESM, et al. Intraluminal injection of mesenchymal stromal cells in spheroids attenuates experimental colitis. J Crohns Colitis. 2016;10(8):953–964.
- Pathak S, Regmi S, Shrestha P, et al. Mesenchymal stem cell capping on ECM-anchored caspase inhibitor-loaded PLGA microspheres for intraperitoneal injection in DSS-induced murine colitis. Small. 2019;15(23):e1901269.
- Ryter SW, Choi AM. Targeting heme oxygenase-1 and carbon monoxide for therapeutic modulation of inflammation. Transl Res. 2016;167(1):7–34.
- Khakurel A, Park PH. Globular adiponectin protects hepatocytes from tunicamycin-induced cell death via modulation of the inflammasome and heme oxygenase-1 induction. Pharmacol Res. 2018;128:231–243.
- Surolia R, Karki S, Kim H, et al. Heme oxygenase-1-mediated autophagy protects against pulmonary endothelial cell death and development of emphysema in cadmium-treated mice. Am J Physiol Lung Cell Mol Physiol. 2015;309(3):L280–92.
- Chen X, Wu S, Tang L, et al. Mesenchymal stem cells overexpressing heme oxygenase-1 ameliorate lipopolysaccharide-induced acute lung injury in rats. J Cell Physiol. 2019;234(5):7301–7319.
- Chabannes D, Hill M, Merieau E, et al. A role for heme oxygenase-1 in the immunosuppressive effect of adult rat and human mesenchymal stem cells. Blood. 2007;110(10):3691–3694.
- Zeng B, Lin G, Ren X, et al. Over-expression of HO-1 on mesenchymal stem cells promotes angiogenesis and improves myocardial function in infarcted myocardium. J Biomed Sci. 2010;17(1):80.
- Zhang Z-H, Zhu W, Ren H-Z, et al. Mesenchymal stem cells increase expression of heme oxygenase-1 leading to anti-inflammatory activity in treatment of acute liver failure. Stem Cell Res Ther. 2017;8(1): 70-70.
- Palomäki S, Pietilä M, Laitinen S, et al. HIF-1α is upregulated in human mesenchymal stem cells. Stem Cells. 2013;31(9):1902–1909.
- Bhang SH, Cho S-W, La W-G, et al. Angiogenesis in ischemic tissue produced by spheroid grafting of human adipose-derived stromal cells. Biomaterials. 2011;32(11):2734–2747.
- Grayson WL, Zhao F, Izadpanah R, et al. Effects of hypoxia on human mesenchymal stem cell expansion and plasticity in 3D constructs. J Cell Physiol. 2006;207(2):331–339.
- Liu Y, Yuan X, Muñoz N, et al. Commitment to aerobic glycolysis sustains immunosuppression of human mesenchymal stem cells. Stem Cell Transl Med. 2019;8(1):93–106.
- Revuelta M, Matheu A. Autophagy in stem cell aging. Aging Cell. 2017;16(5):912–915.
- Loboda A, Damulewicz M, Pyza E, et al. Role of Nrf2/HO-1 system in development, oxidative stress response and diseases: an evolutionarily conserved mechanism. Cell Mol Life Sci. 2016;73(17):3221–3247.
- Lau A, Wang XJ, Zhao F, et al. A noncanonical mechanism of Nrf2 activation by autophagy deficiency: direct interaction between Keap1 and p62. Mol Cell Biol. 2010;30(13):3275–3285.
- Jain A, Lamark T, Sjøttem E, et al. p62/SQSTM1 is a target gene for transcription factor Nrf2 and creates a positive feedback loop by inducing antioxidant response element-driven gene transcription. J Biol Chem. 2010;285(29):22576–22591.
- Charan J, Kantharia ND. How to calculate sample size in animal studies? J Pharmacol Pharmacother. 2013;4(4):303–306.
- Regmi S, Cao J, Pathak S, et al. A three-dimensional assemblage of gingiva-derived mesenchymal stem cells and NO-releasing microspheres for improved differentiation. Int J Pharm. 2017;520(1–2):163–172.
- Kim MJ, Nagy LE, Park PH. Globular adiponectin inhibits ethanol-induced reactive oxygen species production through modulation of NADPH oxidase in macrophages: involvement of liver kinase B1/AMP-activated protein kinase pathway. Mol Pharmacol. 2014;86(3):284–296.
- Raut PK, Kim SH, Choi DY, et al. Growth of breast cancer cells by leptin is mediated via activation of the inflammasome: critical roles of estrogen receptor signaling and reactive oxygen species production. Biochem Pharmacol. 2019;161:73–88.
- Subedi A, Park PH. Autocrine and paracrine modulation of microRNA-155 expression by globular adiponectin in RAW 264.7 macrophages: involvement of MAPK/NF-kappaB pathway. Cytokine. 2013;64(3):638–641.
- Nepal S, Park PH. Activation of autophagy by globular adiponectin attenuates ethanol-induced apoptosis in HepG2 cells: involvement of AMPK/FoxO3A axis. Biochem Biophys Acta. 2013;1833(10):2111–2125.
- Nepal S, Kim MJ, Hong JT, et al. Autophagy induction by leptin contributes to suppression of apoptosis in cancer cells and xenograft model: involvement of p53/FoxO3A axis. Oncotarget. 2015;6(9):7166–7181.
- Abomaray F, Gidlöf S, Götherström C. Mesenchymal stromal cells are more immunosuppressive in vitro if they are derived from endometriotic lesions than from eutopic endometrium. Stem Cells Int. 2017;2017:3215962.
- Lalwani A, Warren J, Liuwantara D, et al. β cell hypoxia-inducible factor-1α is required for the prevention of type 1 diabetes. Cell Rep. 2019;27(8):2370–2384.
- Ito E, Yue S, Moriyama EH, et al. Uroporphyrinogen decarboxylase is a radiosensitizing target for head and neck cancer. Sci Transl Med. 2011;3(67):67ra7.
- Khor SC, Wan Ngah WZ, Mohd Yusof YA, et al. Tocotrienol-rich fraction ameliorates antioxidant defense mechanisms and improves replicative senescence-associated oxidative stress in human myoblasts. Oxid Med Cell Longev. 2017;2017:3868305.