
ABSTRACT
The ubiquitin-proteasome system (UPS) and autophagy-lysosomal pathway (ALP) are two major protein degradation pathways in eukaryotic cells. Initially considered as two independent pathways, there is emerging evidence that they can work in concert. As alterations of UPS and ALP function can contribute to neurodegenerative disorders, cancer and cardiac disease, there is great interest in finding targets that modulate these catabolic processes. We undertook an unbiased, total genome high-throughput screen to identify novel effectors that regulate both the UPS and ALP. We generated a stable HEK293 cell line expressing a UPS reporter (UbG76V-mCherry) and an ALP reporter (GFP-LC3) and screened for genes for which knockdown increased both UbG76V-mCherry intensity and GFP-LC3 puncta. With stringent selection, we isolated 80 candidates, including the transcription factor ZNF418 (ZFP418 in rodents). After screen validation with Zfp418 overexpression in HEK293 cells, we evaluated Zfp418 knockdown and overexpression in neonatal rat ventricular myocytes (NRVMs). Endogenous and overexpressed ZFP418 were localized in the nucleus. Subsequent experiments showed that ZFP418 negatively regulates UPS and positively regulates ALP activity in NRVMs. RNA-seq from Zfp418 knockdown revealed altered gene expression of numerous ubiquitinating and deubiquitinating enzymes, decreased expression of autophagy activators and initiators and increased expression of autophagy inhibitors. We found that ZPF418 activated the promoters of Dapk2 and Fyco1, which are involved in autophagy. RNA-seq from Zfp418 knockdown revealed accumulation of several genes involved in cardiac development and/or hypertrophy. In conclusion, our study provides evidence that ZNF418 activates the ALP, inhibits the UPS and regulates genes associated with cardiomyocyte structure/function.
Abbreviations: ACTN2, actinin alpha 2; ALP, autophagy-lysosomal pathway; COPB1, COPI coat complex subunit beta 1; DAPK2, death associated protein kinase 2; FYCO1, FYVE and coiled-coil domain autophagy adaptor 1; HEK293, human embryonic kidney cells 293; HTS, high-throughput screen; LC3, microtubule associated protein 1 light chain 3; NRVMs, neonatal rat ventricular myocytes; RNA-seq, RNA sequencing; RPS6, ribosomal protein S6; TNNI3, troponin I, cardiac 3; UPS, ubiquitin-proteasome system; shRNA, short hairpin RNA; SQSTM1/p62, sequestosome 1; VPS28, VPS28 subunit of ESCRT-I; ZNF418/ZFP418, zinc finger protein 418.
Introduction
The ubiquitin-proteasome system (UPS) and the autophagy-lysosomal pathway (ALP) are the two major protein degradation systems in eukaryotic cells and thus are crucial for cellular homeostasis. The UPS depends on the highly conserved small molecule ubiquitin that is tagged as a chain to a lysine residue on the target substrate in an energy-dependent manner. This ubiquitin chain formation involves the action of three enzymes: an E1 ubiquitin-activating, an E2 ubiquitin-conjugating and a specific E3 ubiquitin-ligating enzyme. The ubiquitin chain can then be recognized by the proteasome, which degrades the target substrate in an ATP-dependent manner [Citation1]. The ALP includes microautophagy, macroautophagy and chaperone-mediated autophagy. Here, we focus on macroautophagy/autophagy (hereafter ALP) that involves the formation of a transient double-membraned structure, the phagophore, which engulfs the target substrate such as proteins, protein aggregates, nucleic acids and whole or fragmented organelles. Expansion and completion of the phagophore generates an autophagosome, which then fuses with a lysosome to form the autolysosome for the degradation of its contents [Citation2]. Perturbation of one or both of the systems can contribute or even lead to disease. Neurodegenerative disorders (e.g. Alzheimer disease, Parkinson disease [Citation3]), cancers [Citation4,Citation5], infectious or immune diseases (e.g. microbe infection, Crohn disease [Citation6,Citation7]), muscular (e.g. Pompe disease [Citation8]) and cardiac diseases (e.g. DES [desmin]-related cardiomyopathy [Citation9–12]) are all associated with defects in these proteolytic systems. Traditionally, these two pathways were thought to act separately, but more recently effectors of both pathways and even direct communication between them have been observed [Citation13–18]. In order to identify novel proteins that impact both the UPS and ALP, we designed a fluorescence-based high-throughput cell screen (HTS), using a genome-wide knockdown of human genes via lentivirus-encoded short hairpin (sh)RNAs, and evaluated one of the hits in neonatal rat ventricular myocytes (NRVMs).
Results
A HEK293 cell line with stable expression of UbG76V-mCherry and GFP-LC3
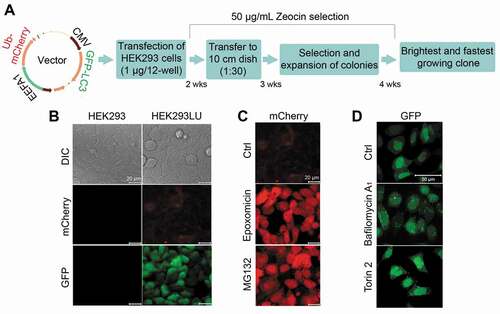
A cell line with stable expression of screened reporters considerably reduces variability and increases assay robustness by minimizing the noise inherent in multiple preparations of primary cells. To generate a stable cell line, we first cloned UbG76V-mCherry under the control of the EEF1A1 (eukaryotic translation elongation factor 1 alpha 1) promoter and GFP-LC3 under the control of the CMV promoter into a single mammalian expression vector with two multiple cloning sites. Using only one vector, we increased the likelihood of being able to measure cells with stable expression of both reporters. We first transfected HEK293 cells with the vector, selected with Zeocin for two weeks and plated cells sparsely to pick single clones. We then expanded the brightest and fastest growing clone, named HEK293LU, under further selection (). HEK293LU showed a low UbG76V-mCherry intensity and diffuse GFP-LC3 distribution with higher nuclear intensity (). We next treated the HEK293LU cells with the proteasomal inhibitors epoxomicin and MG132 () to confirm a positive signal for the UPS. As expected, proteasomal inhibition markedly increased UbG76V-mCherry intensity. Both MG132 and epoxomicin treatments of transiently transfected HL-1 and HEK293 cells resulted in accumulation of the UbG76V-mCherry reporter protein and (poly)ubiquitinated proteins by western blot, validating the reporter (Fig. S1). We also treated the HEK293LU cells with the lysosomal inhibitor bafilomycin A1 and the autophagy activator torin 2 () to confirm an appropriate response for the ALP. Both autophagy inhibition with bafilomycin A1 and autophagy activation with torin 2 increased the number of GFP-LC3 puncta due to inhibition of autophagosome degradation or induction of autophagosome formation.
Figure 1. Generation of a stable HEK293 UPS and ALP reporter cell line (HEK293LU). (A) A schematic diagram of the cell line-generating protocol. (B) Comparison of the reporter cell line (HEK293LU) to normal HEK293 cells. Differential interference contrast (DIC) and fluorescence images of mCherry and GFP are depicted. (C) HEK293LU ubiquitinG76V-mCherry expression with or without (control; ctrl) proteasome inhibitor treatment (250 nM epoxomicin or 1 μM MG132 treatment for 24 h). (D) HEK293LU GFP-LC3 expression with or without autophagy modulators (100 nM of the autophagy inhibitor bafilomycin A1 or 50 nM of the autophagy activator torin 2 for 3 h)
An unbiased genome-wide lentiviral shRNA library screen to identify targets of the UPS and ALP
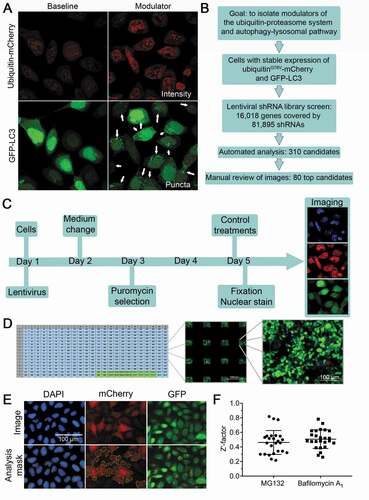
We performed an unbiased genome-wide RNA knockdown screen for gene products that modulated UPS and ALP in the HEK293LU reporter cell line, using a fluorescence-based readout, screening for genes for which knockdown increased both UbG76V-mCherry intensity and GFP-LC3 puncta (). The lentiviral shRNA library consists of 81,895 shRNA clones and targets 16,018 human genes: every gene is covered by several unique shRNA clones to enhance the success of reducing gene expression while also reducing false positives. The screen is schematically outlined in . The HTS assay consists of plated cells that were infected with the shRNA lentiviruses on day 1 (). Puromycin selection was then used to eliminate cells that were not transduced with lentivirus. Control wells were transduced with scrambled shRNA lentivirus. To set a scale for the observed signal, we used MG132 as a “high control” for UbG76V-mCherry intensity, because it decreases proteasomal degradation, which results in an accumulation of UbG76V-mCherry intensity. Along similar lines, we used bafilomycin A1 as a “high control” for GFP-LC3 puncta, because it inhibits autophagosome degradation and therefore results in an accumulation of GFP-LC3 puncta. The cells thus treated represented the high controls while untreated cells served to set the lower limit in the windows used for signal acquisition. Each well was transduced with a single lentivirus shRNA and each gene was covered by at least three lentivirus shRNA clones. The screen was conducted using 384-well format plates and for each well 16 images were acquired and analyzed. Parameters used to optimize the screen and reduce nonspecific noise and off-target effects have recently been detailed [Citation19]. Each plate contained 4 wells for each high control and 8 wells for the low control (). Nuclei (DAPI), mCherry and GFP were recorded for each image and for analysis mCherry-positive objects and GFP-LC3 puncta were normalized to the number of nuclei (). To assess assay quality, we calculated the Z’-factor [Citation20] for 10% of the plates for the high controls treated with MG132 and bafilomycin A1 and found that overall the assay was robust for a HTS screen (Z’-factor ~0,5; ).
Figure 2. Design of a high-throughput screen that identifies modulators of the UPS and ALP. (A) Example of candidate with increased UbG76V-mCherry intensity and increased number of GFP-LC3 positive puncta (arrows). (B) A flow diagram illustrating the goal of the screen and sequential steps in its implementation. (C) A flow diagram illustrating the HTS assay. (D) Assay plate set-up. The screen was performed in 384-well plates with 16 images taken per well. High and low controls (green) were placed at the bottom of each plate. Four wells on each plate were not transduced with lentivirus and treated with puromycin to validate puromycin efficacy (light blue). (E) Analyses masks. Nuclei (DAPI), mCherry and GFP puncta count. (F) Z’-factor distribution of positive controls MG132 and bafilomycin A1 for 10% of the plates
We screened for genes for which knockdown increased both UbG76V-mCherry intensity and GFP-LC3 puncta, in which at least 2 shRNA clones corresponding to different regions of the same transcript yielded a positive signal as defined by the window parameters. This initially resulted in 310 candidates (Table S1) selected on the basis of automated analysis of mCherry intensity and GFP puncta. Subsequently, 80 candidates were selected after reviewing and evaluating images of the 310 candidates manually for particularly strong signals, healthy cell morphology and signal intensity of the remaining clones that did not reach the automated threshold ( and Table S2). A typical example of increased UbG76V-mCherry intensity and GFP-LC3 puncta is shown in Fig. S2. Comparing all potential candidates to databases of UPS- and autophagy-associated genes (Tables S3-S6) revealed that 8/310 were known previously to encode proteasomal components, 4/310 encoded ubiquitinating enzymes and 9/310 candidates encoded autophagy-associated proteins (Fig. S3A,B). The low hit number for proteasomal components is the consequence of the screen readout that was designed to identify targets whose knockdown was associated with accumulation of both UPS and ALP reporters. Detailed analysis of one HTS plate containing 20 proteasome subunits revealed that 19 would have been a hit if we had looked at UbG76V-mCherry intensity only (data not shown). We also subjected all the 310 potential candidates to a protein interaction analysis using the Functional Enrichment analysis tool (Fig. S3C). The analysis detected two protein clusters consisting of 8 or more candidates (red nodes) and 5 protein clusters consisting only of 2 candidates. The 80 hits were distributed randomly among the clusters. The first cluster involved proteins from many different pathways including those associated with the cell cycle and cancer. The second cluster involved proteins involved in proteasomal degradation. Cluster 3 consisted of proteins that are associated with the SNARE complex. Cluster 4 consists of proteins from the coatomer complex 1, which is involved in membrane trafficking between the ER and Golgi. Cluster 5 proteins have a role in kinetochore-microtubule function. Cluster 6 proteins act in a variety of signaling pathways, while cluster 7 proteins are associated with G-protein coupled receptor signaling.
Table 1. HTS-generated candidates for modulating the ALP or UPS
ZFP418 predominantly localizes in the nucleus in cardiomyocytes
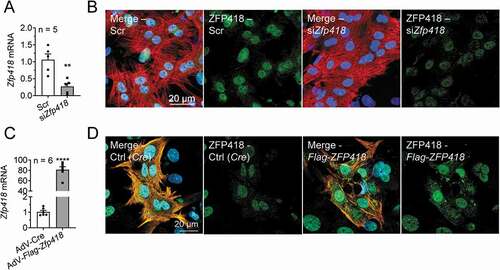
ZNF418 (ZFP418 in rodents) was identified as one of the most promising candidates in our screen as 4 independent ZNF418 shRNA clones yielded a positive signal (). We validated the screen with Zfp418 overexpression in HEK293LU cells, which revealed the opposite effect than with shZNF418, i.e. lower UbG76V-mCherry intensity and number of GFP-LC3 puncta (Fig. S4A,B). Very little is known about ZNF418, except that it localized in the nucleus and functioned as a transcription factor after ZNF418-EGFP gene transfer in COS-7 cells [Citation21], and its overexpression protected mice from cardiac hypertrophy and fibrosis in an acute disease model [Citation22]. To determine the localization of ZFP418 in cardiomyocytes and for subsequent analyses, we performed Zfp418 knockdown and overexpression experiments ( and Fig. S4C) in NRVMs. Knockdown by siRNA reduced Zfp418 mRNA levels in a concentration-dependent manner (data not shown) and up to 75% with 100 nM (). Staining of endogenous ZFP418 in NRVMs showed mainly a strong nuclear signal, which was reduced after Zfp418 knockdown (). Adenoviral-mediated Flag-Zfp418 gene transfer in NRVMs resulted in a marked overexpression ( and Fig. S4C). Immunofluorescence analysis showed a marked intensity in the nucleus and the cytoplasm of exogenous Flag-ZFP418 with both Flag and ZFP418 antibodies ( and Fig. S4C). The specificity of the anti-Flag antibody was validated by the dose-dependent increase of its immunofluorescence intensity and by another adenovirus carrying a Flag-tagged control protein (Flag-Asb2[Citation23]; Fig. S4C). These data suggest a predominantly nuclear localization of ZFP418 in cardiomyocytes, which is in line with previous findings in COS-7 cells [Citation21].
Figure 3. Zfp418 knockdown and overexpression in cardiomyocytes. (A) NRVMs were transfected with scramble siRNA (Scr) or siRNA targeting Zfp418 (siZfp418; 100 nM) and Zfp418 mRNA levels were determined by RT-qPCR after 5–6 days. (B) NRVMs were transfected with scramble siRNA (Scr) or siRNA targeting Zfp418 (siZfp418; 100 nM) and stained for ZFP418 (green), cardiomyocytes (TNNI3; red) and nuclei (DAPI; blue). (C) NRVMs were transduced with control adenovirus (AdV-Cre) or an adenovirus encoding Flag-Zfp418, and Zfp418 mRNA levels were determined by RT-qPCR after 5–6 days. (D) NRVMs were transduced with control adenovirus (Cre) or an adenovirus encoding Flag-Zfp418 and stained for ZFP418 (green), cardiomyocytes (TNNI3; orange) and nuclei (DAPI; blue). Data are presented as mean+SEM with **P< 0.01 and ****P< 0.0001, unpaired Student’s t-test (against Scr or AdV-Cre)
ZFP418 negatively regulates UPS activity in cardiomyocytes
We then evaluated whether the UPS activity is regulated by ZFP418. In basal (= DMSO) conditions, the level of (poly)ubiquitinated proteins was 60% higher after Zfp418 knockdown (), and the chymotrypsin-like activity of the proteasome was 15% lower in siZfp418- than in scramble-treated samples (). Conversely, the (poly)ubiquitinated protein level was 50% lower after Flag-Zfp418 overexpression (), whereas the chymotrypsin-like activity of the proteasome was not higher (). Epoxomicin stabilized the levels of (poly)ubiquitinated proteins in all conditions, but they remained higher and lower than in control after Zfp418 knockdown and Flag-Zfp418 overexpression, respectively (). These data suggest that ZFP418 may regulate the transcription of ubiquitin enzymes.
Figure 4. ZFP418 negatively regulates UPS activity. (A, B) NRVMs were transfected with scramble siRNA (Scr) or siRNA targeting Zfp418 (siZfp418; 100 nM) and treated with epoxomicin (proteasome inhibitor; 250 nM for 24 h) or DMSO (control). (A) After 5–6 days, cells were harvested and (poly)ubiquitinated protein levels were determined by western blot and normalized to ACTN2. (B) After 5–6 days, cells were harvested and chymotrypsin-like activity of the proteasome was measured. (C, D) NRVMs were transduced with adenovirus encoding Cre (AdV-Cre; control) or Flag-Zfp418 (AdV-Flag-Zfp418) and treated with epoxomicin (proteasome inhibitor; 250 nM for 24 h) or DMSO (control). (C) After 5–6 days, cells were harvested and (poly)ubiquitinated protein levels were determined by western blot and normalized to RPS6. (D) After 5–6 days, cells were harvested and chymotrypsin-like activity of the proteasome was measured. (E, F, G, H, I, J) NRVMs were transfected with siZfp418 or scramble siRNA and transduced with an adenovirus encoding GFPu (a reverse UPS reporter) or GFP (control). Where indicated, cells were treated with the proteasomal inhibitor epoxomicin (250 nM for 24 h) or DMSO (control) before harvest. (E) GFPu and GFP protein levels were determined by western blot. GAPDH was stained as loading control. (F) Immunofluorescence analysis of NRVMs stained for TNNI3 (red) and DAPI (blue) and GFPu or GFP (green). The ntensities of GFPu and GFP were quantified in NRVMs. (G) GFPu protein levels were determined by western blot. GAPDH was stained as loading control. (H) GFPu mRNA levels were determined by RT-qPCR and normalized to 18s. (I) NRVMs were scr-transfected and treated with 100 µM cycloheximide for indicated times and GFPu protein levels were determined by western blot. (J) NRVMs were treated with 100 µM cycloheximide for indicated times and GFPu protein levels were determined by western blot. Presented part of Ponceau was used as a loading control. (K) NRVMs were transduced with adenovirus encoding Cre recombinase (AdV-Cre; control) or Flag-Zfp418 and GFPu (a reverse UPS reporter). GFPu protein levels were determined by western blot. Presented part of Ponceau was used as a loading control. (L) NRVMs were transfected with scramble siRNA (Scr), siRNA targeting Zfp418 (siZfp418; 100 nM) and siRNA targeting Psmd1 (siPsmd1; 20 nM; essential proteasomal subunit). Four hours after transfection, NRVMs were transduced with an adenovirus encoding GFP-CRYABR120G (mutant protein that forms aggregates). After 5–6 days, cells were fixed and stained for immunofluorescence microscopy. CRYABR120G aggregates are depicted in green, cardiomyocytes in red (TNNI3) and nuclei in blue (DAPI). Aggregate-to-myocyte area was quantified. (M) NRVMs were transfected with siPsmd1 or scramble siRNA, transduced with an adenovirus encoding GFPu and treated with the proteasomal inhibitor epoxomicin (250 nM for 15 h) or DMSO before harvest. GFPu protein levels were determined by western blot and normalized to ACTN2. Data are presented as mean+SEM with *P < 0.05, **P < 0.01, ***P < 0.001 and ****P < 0.0001, two-way ANOVA plus Sidak multiple comparison test and #P < 0.05, unpaired Student’s t-test
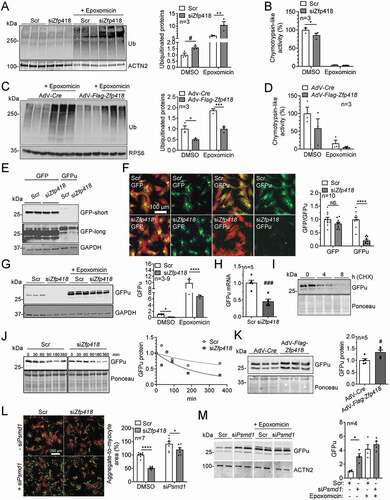
To evaluate the overall UPS activity, which is a complex interplay between ubiquitinating enzymes, deubiquitinating enzymes and proteasome, we used GFPu as a specific UPS activity reporter. GFPu contains a degron sequence that is ubiquitinated and specifically degraded by the UPS [Citation19,Citation24,Citation25]. After transfection with scramble or siZfp418 siRNA, cells were transduced with an adenovirus encoding GFP or GFPu for 5 to 6 days. The GFP protein level and staining intensity did not differ between the groups (), indicating similar transduction efficiency. In contrast, GFPu protein level and fluorescence intensity were markedly lower after Zfp418 knockdown, indicating increased UPS activity (). As expected, epoxomicin treatment led to a marked accumulation of GFPu in both conditions, but still ~30% lower in siZfp418 than in scramble transfection (), likely because of 50% lower GFPu mRNA level (). Importantly, epoxomicin increased GFPu levels ~100-fold in siZfp418-treated and ~10-fold in scramble-treated samples (), suggesting higher degradation of GFPu with Zfp418 knockdown. We tested GFPu turnover by a cycloheximide (CHX) chase assay () and found that GFPu protein levels decreased at least up to 8 h in scramble-transfected cells after CHX addition (). GFPu turnover was shorter in siZFp418 than in scramble transfection (t1/2 = 141 vs. 219 min; ). Conversely, GFPu protein level was higher after Flag-Zfp418 overexpression (). To further validate the screen, we also tested siRNAs directed against 2 other hits in NRVMs, Copb1 and Vps28, encoding COPI coat complex subunit beta 1 and VPS28 subunit of ESCRT-I, respectively. Similar to siZfp418, GFPu protein level was markedly lower in siCopb1 and siVps28 than in scramble transfection (Fig. S5A).
To strengthen the conclusion that ZFP418 regulates UPS activity, we evaluated the model of mutant CRYAB/αB-crystallin (CRYABR120G) overexpression, which leads to protein aggregation in NRVMs [Citation26]. It has been shown that increased UPS activity results in lower CRYABR120G aggregate load [Citation19,Citation25,Citation27]. We found fewer aggregates in siZfp418- than in scramble-treated cardiomyocytes in basal conditions (). Knockdown of the essential proteasomal unit Psmd1 increased GFPu protein level as expected to a similar extent as epoxomicin () and markedly reduced the effect of siZfp418 on CRYABR120G aggregates (). Taken together, the data suggest that ZFP418 negatively regulates UPS activity in NRVMs.
ZFP418 positively regulates ALP activity in cardiomyocytes
LC3-II protein levels reflect changes in autophagosome number [Citation28] and, by using ALP inhibitors and activators, we can evaluate whether ALP activity is increased or decreased at an early or late step of the process (). Electron microscope images showed a lower number of ALP-related vesicular structures (phagophores, autophagosomes, autolysosomes and lysosomes) in cells treated with Zfp418 siRNA (; Fig. S6). To evaluate ALP activity, we determined the number of LC3 puncta (LC3-positive vesicles) by staining endogenous LC3B with or without lysosomal inhibition by leupeptin. We found lower LC3 puncta numbers after Zfp418 knockdown in both basal and leupeptin conditions in NRVMs (), indicating a lower number of autophagosomes and autolysosomes. Furthermore, we determined LC3-II protein levels with and without leupeptin and/or early-step ALP activator torin 1 in NRVMs transfected with siZfp418 or scramble siRNA (). LC3-II protein level was lower in siZfp418- than in scramble-treated samples in basal conditions (= DMSO; ). All treatments increased LC3-II protein levels in scramble-treated samples and to a much lower extent in siZfp418-treated samples (), suggesting inhibition of ALP activity at an early step. We therefore evaluated protein levels of the omegasome markers ZFYVE1/DFCP1 (zinc finger, FYVE domain containing 1) and WIPI2 (WD repeat domain, phosphoinositide interacting 2), which are known as early markers of autophagy. However, number of puncta, protein levels (Fig. S7A,B) and gene expression levels (Table S7) did not differ between scramble- and siZfp418-treated samples in the presence or absence of torin 1. The selective autophagy receptor protein SQSTM1/p62 binds to protein aggregates and shuttles them to autophagosomes [Citation29]. In contrast to LC3-II, SQSTM1/p62 protein levels did not differ between siZfp418- and scramble-treated samples in DMSO, whereas it was lower after Zfp418 knockdown with torin 1 (). Leupeptin treatment did not induce accumulation of SQSTM1/p62 in NRVMs. We also evaluated the effect of knockdown of Copb1 and Vsp28 in NRVMs (Fig. S5B). LC3-II protein levels were higher in basal conditions and did not differ to scramble after bafilomycin A1 treatment in NRVMs, suggesting that both COPB1 and VSP28 activate autophagy, but at a different step than ZFP418 (Fig. S5B).
Figure 5. ZFP418 positively regulates ALP activity. (A) A diagram depicting the effects of the activators torin 1 and torin 2 or the inhibitors leupeptin and bafilomycin A1 on autophagic activity. Torin 1 and torin 2 inhibit mTOR complex 1 and activate autophagy at an early step. Leupeptin inhibits lysosomal proteases and inhibits autophagy at a late step. Bafilomycin A1 is an inhibitor of the V-ATPase and inhibits lysosomal acidification. (B, C, D) NRVMs were transfected with scramble siRNA (Scr) or siRNA targeting Zfp418 (siZfp418; 100 nM) and analyzed 6 days after transfection. (B) Electron microscope images after Scr or siZfp418 transfection. ALP related vesicles are marked with blue arrows. Vesicles of uncertain identity were marked with black arrows. Nuclei are marked with asterisks. Scale bar indicates 800 nm. Extended images in Figure S6. (C) NRVMs were treated with autophagy inhibitor leupeptin (100 μM, 24 h) or water, fixed and stained for LC3B (green) to detect LC3-positive vesicles that are markers for autophagosomes (puncta), cardiomyocytes (TNNI3; red) and nuclei (DAPI; blue). (D) NRVMs were treated with the autophagy inhibitor leupeptin (100 μM, 24 h) or/and autophagy activator torin 1 (1 μM, 3 h) or DMSO. LC3 and SQSTM1/p62 protein levels were determined by western blot, ACTN2 was stained as a loading control. LC3-II:ACTN2 and SQSTM1/p62:ACTN2 were quantified to determine autophagic activity. (E) NRVMs were transduced with an adenovirus encoding Cre (AdV-Cre; control) or Flag-Zfp418 and treated with autophagy inhibitor bafilomycin A1 (30 nM for 3 h) or/and autophagy activator torin 2 (50 nM, 3 h) or DMSO. LC3 and SQSTM1/p62 protein levels were determined by western blot. RPS6 was stained as a loading control and LC3-II:RPS6 and SQSTM1/p62:RPS6 were quantified to determine autophagic activity. Data are presented as mean+SEM with *P< 0.05, **P< 0.01, ***P< 0.001 and ****P< 0.0001, two-way ANOVA plus Sidak multiple comparison test, and #P< 0.05, ##P< 0.01, ###P< 0.001 and ####P< 0.0001 unpaired Student’s t-test
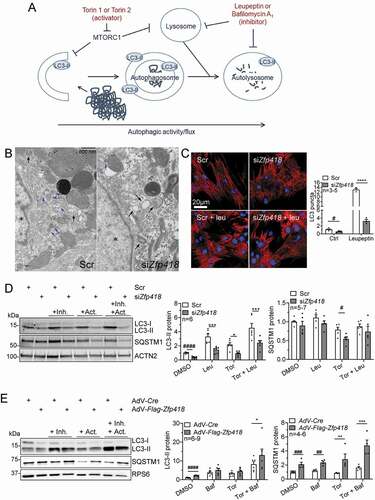
To further support the hypothesis that ZFP418 activates autophagy, we evaluated LC3-II and SQSTM1/p62 protein levels with and without lysosomal inhibitor bafilomycin A1 and/or early-step ALP activator torin 2 in NRVMs transduced with Flag-Zfp418 or control (Cre) adenovirus (). Both LC3-II and SQSTM1/p62 protein levels were higher after Flag-Zfp418 than Cre overexpression in basal conditions (= DMSO). Bafilomycin A1 increased LC3-II protein levels in both groups, and to a higher extent in combination with torin 2 in Flag-Zfp418 overexpression. Bafilomycin A1 did not affect the SQSTM1/p62 levels in Cre-transduced NRVMs. In contrast, the combination of bafilomycin A1 and torin 2 markedly increased the SQSTM1/p62 levels in Flag-Zfp418 transduction. Taken together, these data suggest that ZFP418 positively regulates ALP activity in cardiomyocytes.
ZFP418 regulates expression of numerous genes encoding proteins involved in UPS and ALP
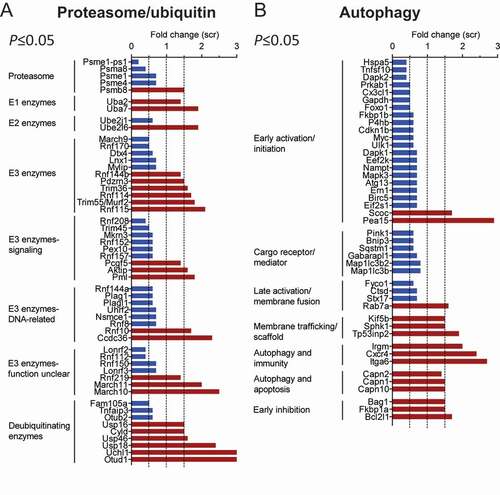
Since ZFP418 belongs to a family of transcription factors, we performed RNA-seq analysis of NRVMs with and without Zfp418 knockdown. Results were analyzed using the differential gene expression analysis method [Citation30] and genes with significantly (P≤ 0.05) altered expression after Zfp418 knockdown were compared to databases of proteins that are associated with the proteasome, ubiquitination processes, or autophagy (; Tables S4-S8). Out of the dysregulated genes, 53 encode UPS-related proteins and 44 ALP-related proteins, providing data consistent with a role for ZFP418 in regulating the UPS and ALP. Of the 53 genes encoding proteins associated with the proteasome or ubiquitination, 24 encode E3 ligating enzymes that function in cellular signaling, are DNA-related or have a yet unknown function and therefore may or may not be involved in UPS degradation. Of the remaining 29 genes, 5 encode proteasomal subunits. We did not observe any differences in mRNA levels of Psmb5, which is the subunit responsible for the chymotrypsin-like activity of the proteasome. Two of the proteins belong to the immunoproteasome 11S regulatory particles (gene names: Psme1-ps1, Psme1) [Citation31] and two of them are subunits involved in histone degradation and DNA damage (gene names: Psma8, Psme4) [Citation32,Citation33], which are not responsible for the main proteasome function. However, gene expression of one essential 20S proteasome component, PSMB8, which replaces PSMB5 in immunoproteasome complexes, was upregulated. Expression of a number of E1, E2 and E3 ubiquitinating enzymes was also upregulated and some E2 and E3 enzymes were downregulated. The upregulation of many genes encoding deubiquitinating enzymes may be a compensatory effect resulting from the high levels of ubiquitinated proteins. The transcript levels of the 4 ubiquitin genes Rps27a, Ubb, Ubc and Uba52 did not significantly differ between siZfp418- and scramble-treated samples (Table S7). Therefore, we believe that the observed effects are independent of the expression of the ubiquitin genes. Of the 44 genes encoding proteins associated with autophagy, 9 encode proteins that function in membrane trafficking, immunity or apoptosis and are therefore possibly not involved in ALP degradation. Most of the other genes encode for proteins that regulate early activation or initiation (20/22 downregulated) or early inhibition (3/3 upregulated) of autophagy, supporting our hypothesis that autophagy is inhibited at an early step of the pathway after Zfp418 knockdown. Furthermore, genes encoding 6 autophagy cargo receptors or mediators, important for early and late steps of autophagy, including Sqstm1, and Map1lc3b and Map1lc3b2, which we already found to be lower at the protein level (), were downregulated. Four genes encoding proteins that promote autophagy at a late step were deregulated (3/4 downregulated). Only the expression of 3 genes (Scoc, Pea15 and Rab7a) was upregulated. However, these genes could be upregulated as part of a compensatory response. These data suggest that Zfp418 expression may be required for the stable accumulation of ALP RNA transcripts, probably at the level of transcription, especially for those encoding a protein involved in an early step of autophagy.
Figure 6. Zfp418 knockdown changes expression of UPS and ALP genes. NRVMs were transfected with scramble siRNA (Scr) or siRNA targeting Zfp418 (siZfp418; 100 nM), harvested 5 days post-transfection and RNA sequencing was performed. Significantly (P≤ 0.05) up- (red) or downregulated (blue) genes after Zfp418 knockdown were compared to databases of genes encoding proteins related to the proteasome and ubiquitin (A) or autophagy (B). Databases are available in Tables S4-S7
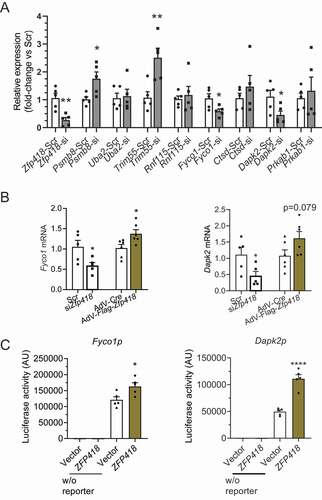
RT-qPCR performed on 9 genes confirmed the RNA-seq data for Zfp418, Psmb8, Trim55, Fyco1 and Dapk2 (). Down-regulation of the two ALP-related genes Fyco1 and Dapk2 by siZfp418 was supported by their up-regulation with Zfp418 overexpression (). In contrast, the 2 UPS-related genes Trim55 and Psmb8 did not change and even increased after Zfp418 overexpression, respectively (data not shown), suggesting indirect regulation by ZFP418. We then showed that ZFP418 activated Fyco1 and Dapk2 promoters in a luciferase assay in HEK cells (). A DisGeNET analysis of the RNA-seq derived from Zfp418 knockdown in NRVMs revealed a highly significant enrichment of our gene set in Alzheimer disease and heart failure, including Dapk2 in both (Table S9), supporting the role of ZNF418 in protein degradation.
Figure 7. Validation of targets identified in RNA sequencing. (A) NRVMs were transfected with scramble siRNA (Scr) or siRNA targeting Zfp418 (siZfp418; 100 nM) and indicated mRNA levels were determined by RT-qPCR after 5 days. (B) NRVMs were transfected with scramble siRNA (Scr) or siRNA targeting Zfp418 (siZfp418; 100 nM) or transduced with control adenovirus (AdV-Cre) or an adenovirus encoding Flag-ZFP418. Fyco1 or Dapk2 mRNA levels were determined by RT-qPCR after 5 days. (C) ZFP418 and Gaussia Luciferase plasmids with Fyco1 or Dapk2 promoter (Fyco1p or Dapk2p) were transfected into HEK293 cells. Luciferase activities were determined after 1 day. Data are presented as mean+SEM with *P< 0.05, **P< 0.01 and ****P< 0.0001, unpaired Student’s t-test. Abbreviations: Dapk2, death associated protein kinase 2; Fyco1, FYVE and coiled-coil domain autophagy adaptor 1. Primer sequences are given in Table S14
ZFP418 regulates several genes involved in cardiomyocyte structure and function
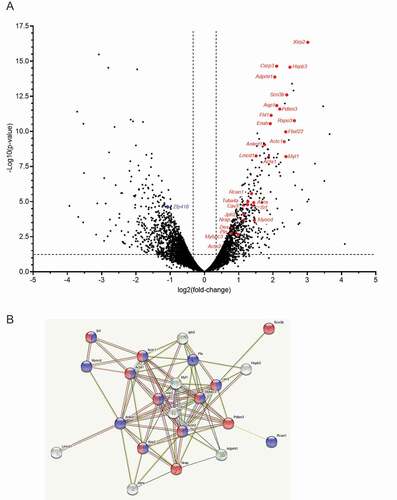
We evaluated the consequence of Zfp418 knockdown and overexpression in NRVMs on RNA levels of cardiomyocyte-specific markers with a dedicated custom-made Nanostring panel. We found higher RNA levels of genes associated with cardiomyocyte structure and function (Actc1, Casq2, Myh6, and Pln), but no difference in the expression of genes encoding markers of hypertrophy (Myh7, Nppa, Nppa, Fhl1) in siZfp418- than in Scr-treated NRVMs (Fig. S8A). Zfp418 overexpression did not have any effect on the expression of these genes (Fig. S8B). A volcano plot of the RNA-seq () and String pathway () derived from Zfp418 knockdown in NRVMs confirmed these data and revealed several other significantly up-regulated genes involved in striated muscle development and/or cardiac hypertrophy (Adprhl1, Fbxl22, Des, Fhl1, Jph2, Lmcd1, Myocd, Pdlim3, Pln, Rcan1, Rspo3, Tuba4a) and actin filament-based processes (Aqp1, Enah, Nrap, Scn3b) or both (Acta1, Actc1, Actn2, Cav3, Csrp3, Mybpc3, Srf, Xirp2). Gene ontology (GO) analyses of “cellular components” (Table S10) found “myofibril” and “contractile fiber”, of “biological process” (Table S11) found “muscle system process” and of “molecular function” (Table S12) found “potassium ion transmembrane transporter activity” as most significantly enriched genes in the data set, highlighting the importance of ZNF418 in the heart.
Figure 8. Zfp418 knockdown increases expression of cardiac genes associated with cardiomyocyte structure and function. NRVMs were transfected with scramble siRNA (Scr) or siRNA targeting Zfp418 (siZfp418; 100 nM), harvested 5 days post-transfection and RNA sequencing was performed. (A) Volcano plot. Significantly upregulated genes involved in cardiomyocyte maturation (actin-filament-based process) and hypertrophy are highlighted in red. Zfp418 down-regulation is shown in blue. Vertical dotted lines showed the 2-fold-change threshold, and the horizontal dotted line the limit of P < 0.05. (B) STRING protein network of highlighted genes of (A). Proteins with red nodes are involved in actin-filament-based processes. Proteins with blue nodes are involved in striated muscle development. Gene acronym and name are given in Table S15
Discussion
UPS and/or ALP disruption or activation, shifting the balance to either increased or decreased degradation, can result in increased disease pathology or morbidity. For example, many late-onset neurodegenerative diseases, such as Alzheimer, Parkinson and Huntington diseases [Citation34–37] display impairment of UPS and ALP. Additionally, the potential clinical importance of manipulating protein degradative pathways has made the UPS and ALP a focus for therapeutic intervention in clinical oncology with efforts to inhibit UPS activity and inhibit or activate ALP activity [Citation38].
A number of inherited cardiomyopathies such as Danon disease [Citation39], Vici syndrome [Citation40], LEOPARD syndrome [Citation41], dilated cardiomyopathy [Citation42,Citation43], DES-related cardiomyopathy [Citation25,Citation27,Citation44], and left ventricular noncompaction [Citation45] have been linked to deregulation of the UPS and/or ALP. We previously described altered UPS and ALP in tissue samples of hypertrophic cardiomyopathy patients and mice with cardiac MYBPC3 (myosin binding protein C3) mutations [Citation23,Citation46,Citation47], and found that UPS inhibition or ALP activation ameliorated the cardiomyopathy in mice [Citation47,Citation48]. In other cardiac disease models, UPS activation or ALP inhibition has been shown to ameliorate the phenotype [Citation27,Citation49]. In summary, the UPS and ALP can have an important disease-modifying role in a number of diseases, but for every class of disease, it has to be defined which kind of modulation is needed and we still lack many appropriate targets and/or drugs. Thus, there is a need for additional discovery science to identify as yet unidentified proteins whose actions can either inhibit or activate these pathways.
HTS is an attractive and relatively unbiased method to find novel proteins that impact on cellular processes. Given the existence of reporters for the UPS, fluorescent reporters tagged to modified ubiquitin or degron sequences, and ALP, LC3 tagged to fluorescent reporters, we were able to develop a cell-based, automated screen for modulators of the two systems. We used HEK293 cells as they are relatively robust, grow well and can be stably transfected at very high efficiencies, providing a highly reproducible substrate for the screen. The UPS and ALP are both highly conserved pathways and therefore we hypothesized that a number of the clones identified would be valid for other cell types. This hypothesis was partially validated by subsequent experiments using cardiomyocytes ().
Multiple, independent shRNA clones to ZNF418 were identified in the initial screen. Although the screen was designed to find genes whose knockdown increased both UbG76V-mCherry intensity (= UPS inhibition) and GFP-LC3 puncta (= ALP inhibition) in HEK293 cells, the subsequent Zfp418 knockdown or overexpression experiments in NRVMs did not have exactly the same results. Indeed, we found that ZFP418 activates autophagy (supporting the screen) but inhibits UPS as shown by accumulation of GFPu (opposite of the screen). Similarly, we found that two other HTS hits, COPB1 and VPS28 also activate autophagy and inhibit the UPS in NRVMs (Fig. S5), supporting our data. We cannot exclude that accumulation of UbG76V-mCherry in HEK293 cells is the consequence of autophagy inhibition, since previous data showed that inhibition of autophagy by several means compromises proteasomal degradation in HeLa cells [Citation15]. It is also possible that the regulation of the proteolytic systems differs between the cells used in the screen compared to differentiated cardiomyocytes. We also provide evidence that Zfp418 is upregulated in the CRYABR120G mouse model of proteotoxicity [Citation26], likely as a compensation (Fig. S8) and showed that knockdown of Zfp418 such as of Jak1 [Citation19] reduced aggregates induced by CRYABR120G in NRVMs (), supporting UPS activation [Citation50], but not ALP inhibition. Although counter-intuitive, it has been shown that the activation of one of the two proteolytic system is sufficient to clear aggregates [Citation19,Citation27,Citation50]. We cannot exclude that ALP activation is a secondary response to UPS inhibition by ZNF418. Although it activated the Dapk2 and Fyco1 promoters, whose products are involved in autophagy activation (), this activation could still be an indirect effect, because, for example, proteasome inhibition has been shown to activate the expression of several ALP genes through activating transcription factor EB [Citation51]. There are a paucity of data regarding ZNF418 function, but interestingly, it can be cardioprotective in an acute cardiac disease model [Citation22]. ZNF418 (ZFP418 in rodents) was identified in a human embryo heart cDNA library, appears to be related to the evolutionary conserved zinc finger protein family and contains a regulatory Krüppel-associated box (KRAB)-A and 17 tandem C2H2 type zinc finger motifs [Citation21]. ZNF418 overexpression in COS-7 cells showed nuclear localization and repression of luciferase activity in a reporter system [Citation21]. We confirmed nuclear localization of endogenous and overexpressed ZFP418 in NRVMs. Intriguingly, ZNF418 protein levels were markedly lower in hearts of patients with DCM or HCM and its homologue in hypertrophic mouse models as well, while overexpression of ZFP418 in the mouse model or in primary cardiomyocytes was protective against cardiac hypertrophy and ameliorated loss of function after aortic banding in mice [Citation22]. Although we could not detect any difference in ZNF418 mRNA levels in both mouse and human HCM and DCM cardiac samples when compared to controls (data not shown), our RNA-seq analysis from siZfp418-treated NRVMs supports the view that ZNF418 is protective against cardiomyocyte hypertrophy and heart failure (, Fig. S8, Tables S9-S12). Another group reported DNA hyper-methylation and down-regulation of ZNF418 in patients with esophageal squamous cell carcinoma [Citation52], and low ZNF418 expression is associated with a poor prognosis in patients with gastric carcinoma [Citation53], suggesting a role for ZNF418 in human disease. However, those data do not make a connection between ZNF418 and regulation of the UPS and ALP-associated genes. Our data, which define the protein’s impact on UPS and ALP function, may also explain its positive effects on cardiac hypertrophy and cancer, since for both diseases, inhibition of UPS activity and upregulation of ALP activity can be beneficial [Citation38,Citation47,Citation48,Citation54]. However, these data have to be taken cautiously, because others have shown that genetically-based enhancement of the proteasome activity is cardioprotective or inhibition of cardiac proteasomes is detrimental to the heart after myocardial ischemia/reperfusion injury or pressure overload in mice [Citation27,Citation55,Citation56], and importantly, proteasome inhibitors such as bortezomib or carfilzomib can cause cardiotoxicity in humans with multiple myeloma [Citation57].
In conclusion, UPS and ALP activities play decisive roles in several diseases and we believe that targeting the two pathways has significant therapeutic potential. Here, we have isolated candidates that modulate UPS and ALP activity in HEK293 cells and extend those data to NRVMs, validating the potential scalability of the screen across different cell types and tissues. Future experiments will reveal their ability to modulate the UPS and ALP in other cell types and disease models.
Material and methods
Cloning the expression vector pBUDCE4.1-GFP-LC3-UbG76V-mCherry
EGFP-rLC3 was cloned from adenovirus 5 backbone (provided by Joseph A. Hill, UT Southwestern, Dallas, Texas, USA) into the mammalian expression vector pBudCE4.1 (two multiple cloning sites; Invitrogen, V53220) under the control of the CMV promoter. UbG76V (provided by Antonio Sarikas, TUM, Munich, Germany) and mCherry (provided by Ingke Braren, UKE, Hamburg, Germany) were cloned in a single step using the In-Fusion HD Cloning Kit (Clontech, 639,650) under the control of the EEF1A1/EF-1α promoter into pBudCE4.1 – GFP-LC3. Primer sequences can be found in Table S13.
Generation and validation of HEK293LU
For stable and transient transfections, HEK293 or HL-1 cells were plated into 12-well plates at a density of 1.5 × 10⁵ cells/well and transfected with 1 μg/well pBudCE4.1-GFP-LC3-UbG76V-mCherry using TurboFect (Fermentas, R0531) according to the manufacturer’s protocol. Two days after transfection, cells were selected with 50 μg/mL Zeocin (Thermo Fisher Scientific, R25001). The cells were selected for two weeks with media changes every 48 h. After two weeks, cells were transferred from one well of a 12-well plate to 10-cm dishes (1:30 dilution). Colonies that grew approximately 3 weeks under Zeocin selection were picked and expanded in 24-well plates for another 4 weeks under selection, until confluency. The fastest growing clone with the brightest fluorescence intensity (named HEK293LU) was further expanded under Zeocin selection and aliquots were frozen. After 1 freeze-thaw cycle, the clone was grown without Zeocin selection for at least 3 months to validate stable transfection. HEK293LU cells were treated with UPS inhibitors or ALP inhibitor and activator for validation of the reporters. For this, 1 × 10⁵ cells per well were seeded onto Lab-Teks (Nalge Nunc International, 154,461). For UPS inhibition, cells were treated with the proteasome inhibitor MG132 (1 μM; Sigma-Aldrich, 474,791) or epoxomicin (250 nM; Calbiochem, 324,801) for 24 h. For ALP inhibition, cells were treated with 100 nM bafilomycin A1 (Sigma-Aldrich, B1793) for 3 h. For ALP activation, cells were treated with 50 nM torin 2 (LC Laboratories, T-8448) for 3 h. Following treatment, cells were fixed with 4% paraformaldehyde and nuclei stained with DRAQ5 (Biostatus Limited, DR50050). Confocal images were acquired with a Zeiss Axiovert microscope with a 40x or 100x oil (GFP-LC3 puncta) objective.
Genome-wide lentiviral shRNA high-throughput screen
The shRNA library was developed by the RNAi Consortium (TRC) [Citation58]. The human library covers 16,018 genes with 81,895 shRNA clones (i.e. 4–5 clones for most of the genes; about 300 x 384-well plates). A 5-day-long HTS assay was developed. We coated 384-well plates (black; clear bottom; Corning, 3712) with sterile 0.1% gelatin for 30 min at room temperature. Cells were seeded at a density of 800 cells per well in 30 μL DMEM (Gibco, 10,569–010), 10% FBS (Sigma-Aldrich, F2442), 1% non-essential amino acids, 1% penicillin-streptomycin, 1% pyruvate (culture medium) and immediately transduced with 15 μL from lentiviral library plates, and 4 μg/mL polybrene (Sigma-Aldrich, TR-1003-G) was added to each well. A scrambled shRNA lentivirus was used for control wells. On the second day, 35 μL were gently removed and replaced by 70 μL culture medium. On day 3, puromycin (Thermo Fisher Scientific, A1113803) selection was started to select for transduced cells by removing 70 μL medium and adding 50 μL medium including 4 μg/mL puromycin. On day 5, 50 μL medium was replaced by 25 μL culture medium including bafilomycin A1 (final concentration 100 nM) or MG132 (final concentration 5 μM) for the high control wells or plain culture medium for all other wells. Each plate contained four wells for each high control (bafilomycin A1 or MG132) and eight wells for the low control (untreated). After 4 h, cells were fixed in 4% paraformaldehyde and stained with DAPI for nuclei. The plates were read with a 20x objective by a BioTek Cytation 3 Imager (16 images per well) and images were analyzed by the Gen5 software for mCherry intensity and GFP puncta. To measure mCherry intensity, cells were marked and fluorescence intensity was measured within the marked area. The mCherry intensity was related to the number of nuclei. To measure GFP-LC3 puncta, a threshold was set for GFP intensity and dots within a size and circularity range were counted as puncta. The number of GFP-LC3 puncta was related to the number of nuclei. In order to select the best hits, all images were manually reviewed for thorough detection of the puncta. The top hits were selected as follows: i) considering remaining “negative” clones, e.g. if two of five shRNA clones were positive, the remaining three were reviewed for UbG76V-mCherry intensity and GFP-LC3 puncta, i.e. if the signals were slightly below the threshold or either positive for puncta or intensity; ii) nuclei looked healthy; iii) it was checked if the positive controls had a particularly strong effect for the plate, hence setting the threshold for the clones very high. To validate the results of the screen for ZNF418, HEK293LU cells were transfected with either 0.5 µg pCMV-SPORT6-mmZfp418 or pCMV-Sport6 (vector control) and fluorescence images were taken with a Zeiss Axiovert microscope with 40x oil objective. UbG76V-mcherry intensity and GFP-LC3 puncta were quantified with ImageJ.
Neonatal rat ventricular myocyte (NRVM) isolation
NRVMs were isolated as described previously [Citation19,Citation59]. In brief, hearts were harvested from 1-3-day-old pups and incubated in 0.05% trypsin (Gibco, 25,300,054) overnight at 4°C. Upon removal of trypsin, hearts were rinsed with ice-cold αMEM (Gibco, 12,571–063) and dissociated with 260 units/heart collagenase (Worthington Biochemical Corporation, LS004176) in αMEM for 40 min at 37°C. The solution was triturated to disperse cell clumps and passed through a 40-μm strainer. The homogenate was then centrifuged for 5 min at 50–100 x g and the pellet resuspended in αMEM containing 10% FBS (Gibco, 16,000–044) and DNase I (Roche, 10,104,159,001). A preplating step was done to selectively isolate NRVMs from the cardiac fibroblasts. Ten mL of cell suspension were added to uncoated 10-cm plates and incubated for 40 min at 37°C in a 5% CO2 incubator. The medium was removed and transferred to a conical tube.
NRVM transfection
NRVMs were seeded into 12-well plate wells or onto gelatin-coated Lab-Teks (Nalge Nunc International, 154,461) at a density of 1 × 10⁵ cells per well. One day after plating (day 1), they were transfected with siZfp418 (100 nM; Thermo Fisher Scientific, s146507), siPsmd1 (20 nM; Thermo Fisher Scientific, s136286) or scramble siRNA (100 nM; Thermo Fisher Scientific, 4,390,846) in OptiMEM (Thermo Fisher Scientific, 51,985–026) using Lipofectamine 3000 transfection reagent (Thermo Fisher Scientific, L3000008) for 5–7 h after which double-concentrated serum medium (final concentration of 10% FBS) was added. Medium was changed on day 3 to DMEM, 10% FBS and 10 μM cytosine β-D-arabinofuranoside (Sigma-Aldrich, C1768) to inhibit growth of remaining fibroblasts. Cells were harvested between 5–6 days post-transfection for RNA or protein extraction or fixed in 4% paraformaldehyde for imaging.
NRVM adenovirus transduction and compound treatment
Zfp418 was amplified from mouse ventricular RNA extractions by PCR, 5ʹ-tagged with Flag and cloned into pShuttle-CMV with SalI and HindIII restriction enzymes. For overexpression of Flag-mZfp418, GFP-CryABR120G or GFPu [Citation60,Citation61], NRVMs were transduced with the respective adenoviruses for 2 h. For proteasome inhibition, NRVMs were treated for 24 h prior to harvest or fixation with 250 nM epoxomicin (Calbiochem, 324,801). For the GFPu chase assay, cells were incubated in culture medium with 100 µM cycloheximide (Sigma-Aldrich, c4859) for indicated times. For ALP activation, NRVMs were treated with 1 μM torin 1 (Tocris Bioscience, 4247) or 50 nM torin 2 (LC laboratories, T8448) for 3 h prior to harvest or fixation. For ALP inhibition, NRVMs were treated with 100 μM leupeptin (Sigma-Aldrich, L8511) for 24 h or 30 nM bafilomycin A1 for 3 h prior to harvest or fixation. Medium was changed with every compound treatment.
NRVM fluorescence imaging
After fixation, cells were stained for the cardiomyocyte marker TNNI3 (troponin I, cardiac 3; Millipore, MAB1691), nuclei (DAPI or DRAQ5; Thermo Fisher Scientific, D1306) and antibodies against the protein of interest (LC3B – Cell Signaling Technology, 2775; ZNF418 – Sigma-Aldrich, SAB2700695; FLAG – Sigma-Aldrich, F3165; ZFYVE1/DFCP1 – Cell Signaling Technology, 85156S; WIPI2 – Invitrogen, PAS-54,098). Slides were imaged using a Nikon Eclipse Ti inverted microscope with 10–20x air objective, Nikon A1R confocal microscope with 20–60x objective or a Zeiss Axiovert microscope with 40x or 63x oil objective and 7 images/well were captured. Images were analyzed with NIS Elements software.
Quantitative reverse transcription PCR (RT-qPCR)
To measure siRNA knockdown or Flag-Zfp418 overexpression, cells were lysed in RNAzol RT Reagent (Molecular Research Center Inc, RN 190) or TRIzol Reagent (Thermo Fisher Scientific, 15,596,018), RNA was transcribed into cDNA with iScript cDNA synthesis kit (Bio-Rad, 1,708,840) or SuperScript III (Thermo Fisher Scientific, 18,080–051) and RT-qPCR was performed by using TaqMan gene expression assays (Thermo Fisher Scientific: Rn01523785_g1 for rat Zfp418, Rn01523785_g1 for mouse Zfp418, Hs03003631_g1 for Rn18s control) according to the manufacturer’s protocols. For comparison of endogenous rat Zfp418 and overexpressed exogenous mouse Flag-Zfp418 expression levels, forward primer 5ʹ-GGTGAATGTGGGAAGACC-3‘ and reverse primer 5ʹ-CTCCAGTGTGAAGTAGCT-3‘ were used with SYBR green (Thermo Fisher Scientific, K0222) detection. The primers for validation of RNA-seq data can be found in Table S14.
Western blotting
For western blot analysis, cells were harvested in 70 μL lysis buffer (3% SDS, 30 mM Tris base, pH 8.8, 5 mM EDTA, 30 mM NaF, 10% glycerol, 1 mM DTT) and 25–50 μg protein with 6x Laemmli buffer was loaded onto 4–20% Bio-Rad Mini- PROTEAN Precast Gels or 12% self-casted acrylamide/bisacrylamide (29:1) gels. After electrophoresis, the proteins were transferred to PVDF membranes with Bio-Rad Tris/Glycine buffer or self-made transfer buffer (25 mM Tris base, 190 mM glycine, 20% methanol, pH 8.3) and stained with the following antibodies: ubiquitin – FK2 clone Millipore, 04–263; mCherry – Novus Biologicals, NBP1-96,752; GFP – Santa Cruz Biotechnology, sc-9996; LC3B – Cell Signaling Technology, 2775; SQSTM1/p62 – Sigma-Aldrich, P0067; ZFTVE1/DFCP1 – Cell Signaling Technology; WIPI2 – Invitrogen; ACTN2 (actinin alpha 2) – Sigma-Aldrich, A2543 or A7811; RPS6 (ribosomal protein S6) – Cell Signaling Technology, 2771; GAPDH – HyTest, 5G4. Western blots were either detected with LI-COR Biosciences Odyssey () or Biorad ChemiDoc ().
Chymotrypsin-like activity measurements
The chymotrypsin-like activity of the proteasome was assessed in NRVMs as described previously [Citation48]. Briefly, 30 μg of protein were diluted in incubation buffer (20 mM HEPES, 0.5 mM EDTA, 5 mM DTT, 0.1 mg/ml ovalbumin, pH 7.8) and the synthetic fluorogenic substrate Suc-LLVY-AMC (Merck Biosciences, 539,142) was added to a final concentration of 60 μM. After incubation in the dark for 1 h at 37°C, the fluorescence of the released AMC reporter was measured using a BioTek Cytation 3 Imager at Abs/Em = 360/460 nm.
Electron microscopy
Electron microscopy was performed as described previously [Citation47]. NRVMs were seeded on gelatin-covered 35 × 10 mm Permanox dishes (Electron Microscopy Sciences, 70,340) at a density of 2 × 10⁵ cells per plate and transfected with siRNA as described above. Six days after transfection, NRVMs were rinsed with warm (room temperature), diluted 1:1 with ddH2O, cardioplegic buffer (50 mmol/L KCl, 5% dextrose in PBS, pH 7.4) and fixed on ice in 1% paraformaldehyde/2% glutaraldehyde in 50 mM cacodylate buffer, pH 7.2, for 20 min, postfixed in reduced osmium (1% OsO4, 0.75% K3Fe(CN)6, 25 mM cacodylate buffer, pH 7.2), dehydrated using a graded series of acetone, and embedded in epoxy resin. After polymerization thin layer containing cell monolayers were detached from the bottom of the dish, cut into small fragments and glued to stubs for sectioning. Ultrathin sections were counterstained with uranyl acetate and lead salts. Images were acquired on a Hitachi 7600 electron microscope equipped with an Advanced Microscopy Techniques digital camera.
RNA sequencing and analysis
RNA sequencing was performed and analyzed by the Cincinnati Children’s Hospital and Medical Center DNA core using RNA polyA-stranded library preparation, paired end 75 bp sequencing conditions and 20 M reads per sample. Data were then analyzed by using the differential gene expression analysis method and significantly modified genes (P≤ 0.05) were compared to databases of UPS or ALP genes with FunRich (Functional Enrichment Analysis Tool [Citation62];). Data sets for proteasomal components, ubiquitinating and deubiquitinating enzymes and autophagy-associated genes were taken from the HUGO Gene Nomenclature Committee website (HGNC; genenames.org) or the Human Autophagy Database (HADb; autophagy.lu).
Luciferase assays
HEK293 cells were seeded into 12-well plates and transfected with either 0.5 µg pCMV-SPORT6-mmZfp418 or pCMV-Sport6 (vector control) and 0.5 µg pEZX-PG02-Fyco1p (mouse; Genecopoeia) or pEZX-PG02-Dapk2p (mouse; Genecopoeia) with TurboFect (Fermentas, R0531) according to the manufacturer’s protocol. Twenty-four hours after transfection, Gaussia luciferase assay (Genecopoeia/BioCat, LF061) was performed in a 96-well plate using the culture medium according to manufacturer’s protocol and measured with a Centro LB 960 Luminometer (Berthold Technologies, Bad Wildbad, Germany).
NanoString RNA expression analysis
For gene expression analysis we used a customized rat-specific NanoString’s nCounter® Elements TagSet panel of 27 genes coding for proteins regulated in hypertrophy and heart failure. As described previously [Citation47,Citation63], 50 ng of each sample were hybridized to target-specific capture and reporter probes at 67°C overnight (16 h) according to manufacturer’s instructions. Samples were cooled down at 4°C, filled up with 15 µl H2O, loaded into the NanoString cartridge and the nCounter Gene Expression Assay was started immediately. Raw data were analyzed with nCounter® Sprint Profiler including background subtraction using negative controls and normalization to 6 housekeeping genes (Abcf1, Actb, Cltc, Gapdh, Pgk1, Tubb5). Data represented the mean of normalized counts and were expressed as fold-change.
Statistical analysis
Statistical tests were performed with GraphPad Prism 8. The applied test and significance are indicated in the figure legends.
Supplemental Material
Download MS Excel (259.6 KB)Supplemental Material
Download MS Word (3.5 MB)Acknowledgments
We thank Joseph A. Hill (UT Southwestern, Dallas, Texas, USA) for providing a GFP-LC3 adenovirus, Antonio Sarikas (TUM, Munich, Germany) for providing a UbG76V-GFP plasmid, Ingke Braren (UKE, Hamburg, Germany) for providing an mCherry plasmid, the CCHMC DNA Sequencing and Genotyping Core for RNA sequencing and analysis, Elisabeth Krämer and the NanoString core Facility (UKE, Hamburg, Germany) for the RNA expression experiments, UKE HEXT Vector Facility (Ingke Braren) for virus productions and Kritton Shay-Winkler (CCHMC, Cincinnati, Ohio, USA), June Uebeler and Thomas Schulze (UKE, Hamburg, Germany) for isolating NRVMs, and Elke Oetjen and Sabine Schröder (UKE, Hamburg, Germany) for help with Luciferase assays.
Disclosure statement
No potential conflict of interest was reported by the authors.
Supplemental material
Supplemental data for this article can be accessed here.
Supplementary material
Supplemental data for this article can be accessed here.
Additional information
Funding
Related Research Data
References
- Hershko A, Ciechanover A. The ubiquitin system. Annu Rev Biochem. 1998;67(1):425–479.
- Ohsumi Y. Molecular dissection of autophagy: two ubiquitin-like systems. Nat Rev Mol Cell Biol. 2001;2(3):211–216.
- Rubinsztein DC. The roles of intracellular protein-degradation pathways in neurodegeneration. Nature. 2006;443(7113):780–786.
- Galluzzi L, Pietrocola F, Bravo-San Pedro JM, et al. Autophagy in malignant transformation and cancer progression. Embo J. 2015;34(7):856–880.
- Hoeller D, Dikic I. Targeting the ubiquitin system in cancer therapy. Nature. 2009;458(7237):438–444.
- Levine B, Mizushima N, Virgin HW. Autophagy in immunity and inflammation. Nature. 2011;469(7330):323–335.
- Wang J, Maldonado MA. The ubiquitin-proteasome system and its role in inflammatory and autoimmune diseases. Cell Mol Immunol. 2006;3:255–261.
- Sandri M. Protein breakdown in muscle wasting: role of autophagy-lysosome and ubiquitin-proteasome. Int J Biochem Cell Biol. 2013;45(10):2121–2129.
- Bravo-San Pedro JM, Kroemer G, Galluzzi L. Autophagy and mitophagy in cardiovascular disease. Circ Res. 2017;120(11):1812–1824.
- McLendon PM, Robbins J. Proteotoxicity and cardiac dysfunction. Circ Res. 2015;116(11):1863–1882.
- Schlossarek S, Frey N, Carrier L. Ubiquitin-proteasome system and hereditary cardiomyopathies. J Mol Cell Cardiol. 2014;71:25–31.
- Zech ATL, Singh SR, Schlossarek S, et al. Autophagy in cardiomyopathies. Biochim Biophys Acta Mol Cell Res. 2020;1867(3):118432.
- Ding WX, Ni HM, Gao W, et al. Linking of autophagy to ubiquitin-proteasome system is important for the regulation of endoplasmic reticulum stress and cell viability. Am J Pathol. 2007;171(2):513–524.
- Ju JS, Weihl CC. p97/VCP at the intersection of the autophagy and the ubiquitin proteasome system. Autophagy. 2010;6(2):283–285.
- Korolchuk VI, Mansilla A, Menzies FM, et al. Autophagy inhibition compromises degradation of ubiquitin-proteasome pathway substrates. Mol Cell. 2009;33(4):517–527.
- Korolchuk VI, Menzies FM, Rubinsztein DC. Mechanisms of cross-talk between the ubiquitin-proteasome and autophagy-lysosome systems. FEBS Lett. 2010;584(7):1393–1398.
- Pandey UB, Nie Z, Batlevi Y, et al. HDAC6 rescues neurodegeneration and provides an essential link between autophagy and the UPS. Nature. 2007;447(7146):859–863.
- Lamark T, Johansen T. Autophagy: links with the proteasome. Curr Opin Cell Biol. 2010;22(2):192–198.
- McLendon PM, Davis G, Gulick J, et al. An unbiased high throughput screen to identify novel effectors that impact on cardiomyocyte aggregate levels. Circ Res. 2017;121(6):604–616.
- Zhang JH, Chung TD, Oldenburg KR. A simple statistical parameter for use in evaluation and validation of high throughput screening assays. J Biomol Screen. 1999;4(2):67–73.
- Li Y, Yang D, Bai Y, et al. ZNF418, a novel human KRAB/C2H2 zinc finger protein, suppresses MAPK signaling pathway. Mol Cell Biochem. 2008;310:141–151.
- Pan L, Sheng M, Huang Z, et al. Zinc-finger protein 418 overexpression protects against cardiac hypertrophy and fibrosis. PLoS One. 2017;12(10):e0186635.
- Thottakara T, Friedrich FW, Reischmann S, et al. The E3 ubiquitin ligase Asb2beta is downregulated in a mouse model of hypertrophic cardiomyopathy and targets desmin for proteasomal degradation. J Mol Cell Cardiol. 2015;87:214–224.
- Bence NF, Bennett EJ, Kopito RR. Application and analysis of the GFPu family of ubiquitin-proteasome system reporters. Methods Enzymol. 2005;399:481–490.
- Gupta MK, Gulick J, Liu R, et al. Sumo E2 enzyme UBC9 is required for efficient protein quality control in cardiomyocytes. Circ Res. 2014;115(8):721–729.
- Wang X, Osinska H, Klevitsky R, et al. Expression of R120G-alphaB-crystallin causes aberrant desmin and alphaB-crystallin aggregation and cardiomyopathy in mice. Circ Res. 2001;89(1):84–91.
- Li J, Horak KM, Su H, et al. Enhancement of proteasomal function protects against cardiac proteinopathy and ischemia/reperfusion injury in mice. J Clin Invest. 2011;121(9):3689–3700.
- Klionsky DJ, Abdelmohsen K, Abe A, et al. Guidelines for the use and interpretation of assays for monitoring autophagy (3rd edition). Autophagy. 2016;12:1–222.
- Pankiv S, Clausen TH, Lamark T, et al. p62/SQSTM1 binds directly to Atg8/LC3 to facilitate degradation of ubiquitinated protein aggregates by autophagy. J Biol Chem. 2007;282(33):24131–24145.
- Anders S, Huber W. Differential expression analysis for sequence count data. Genome Biol. 2010;11(10):R106.
- Preckel T, Fung-Leung WP, Cai Z, et al. Impaired immunoproteasome assembly and immune responses in PA28-/- mice. Science. 1999;286(5447):2162–2165.
- Qian MX, Pang Y, Liu CH, et al. Acetylation-mediated proteasomal degradation of core histones during DNA repair and spermatogenesis. Cell. 2013;153(5):1012–1024.
- Khor B, Bredemeyer AL, Huang CY, et al. Proteasome activator PA200 is required for normal spermatogenesis. Mol Cell Biol. 2006;26(8):2999–3007.
- Keller JN, Hanni KB, Markesbery WR. Impaired proteasome function in Alzheimer’s disease. J Neurochem. 2000;75(1):436–439.
- McNaught KS, Belizaire R, Isacson O, et al. Altered proteasomal function in sporadic Parkinson’s disease. Exp Neurol. 2003;179(1):38–46.
- Nixon RA. The role of autophagy in neurodegenerative disease. Nat Med. 2013;19:983–997.
- Seo H, Sonntag KC, Isacson O. Generalized brain and skin proteasome inhibition in Huntington’s disease. Ann Neurol. 2004;56(3):319–328.
- White E, DiPaola RS. The double-edged sword of autophagy modulation in cancer. Clin Cancer Res. 2009;15(17):5308–5316.
- Nishino I, Fu J, Tanji K, et al. Primary LAMP-2 deficiency causes X-linked vacuolar cardiomyopathy and myopathy (Danon disease). Nature. 2000;406(6798):906–910.
- Cullup T, Kho AL, Dionisi-Vici C, et al. Recessive mutations in EPG5 cause Vici syndrome, a multisystem disorder with defective autophagy. Nat Genet. 2013;45:83–87.
- Marin TM, Keith K, Davies B, et al. Rapamycin reverses hypertrophic cardiomyopathy in a mouse model of LEOPARD syndrome-associated PTPN11 mutation. J Clin Invest. 2011;121(3):1026–1043.
- Choi JC, Muchir A, Wu W, et al. Temsirolimus activates autophagy and ameliorates cardiomyopathy caused by lamin A/C gene mutation. Sci Transl Med. 2012;4(144):144ra02.
- Ramos FJ, Chen SC, Garelick MG, et al. Rapamycin reverses elevated mTORC1 signaling in lamin A/C-deficient mice, rescues cardiac and skeletal muscle function, and extends survival. Sci Transl Med. 2012;4(144):144ra03.
- Bhuiyan MS, Pattison JS, Osinska H, et al. Enhanced autophagy ameliorates cardiac proteinopathy. J Clin Invest. 2013;123(12):5284–5297.
- Muhammad E, Levitas A, Singh SR, et al. PLEKHM2 mutation leads to abnormal localization of lysosomes, impaired autophagy flux and associates with recessive dilated cardiomyopathy and left ventricular noncompaction. Hum Mol Genet. 2015;24(25):7227–7240.
- Schlossarek S, Englmann DR, Sultan KR, et al. Defective proteolytic systems in Mybpc3-targeted mice with cardiac hypertrophy. Basic Res Cardiol. 2012;107:235.
- Singh SR, Zech ATL, Geertz B, et al. Activation of autophagy ameliorates cardiomyopathy in Mybpc3-targeted knockin mice. Circ Heart Fail. 2017;10(10):e004140.
- Schlossarek S, Singh SR, Geertz B, et al. Proteasome inhibition slightly improves cardiac function in mice with hypertrophic cardiomyopathy. Front Physiol. 2014;5:484.
- Zhu H, Tannous P, Johnstone JL, et al. Cardiac autophagy is a maladaptive response to hemodynamic stress. J Clin Invest. 2007;117(7):1782–1793.
- Xu N, Gulick J, Osinska H, et al. Ube2v1 positively regulates protein aggregation by modulating ubiquitin proteasome system performance partially through K63 ubiquitination. Circ Res. 2020;126(7):907–922.
- Pan B, Li J, Parajuli N, et al. The calcineurin-TFEB-p62 pathway mediates the activation of cardiac macroautophagy by proteasomal malfunction. Circ Res. 2020;127(4):502–518.
- Pu W, Wang C, Chen S, et al. Targeted bisulfite sequencing identified a panel of DNA methylation-based biomarkers for esophageal squamous cell carcinoma (ESCC). Clin Epigenetics. 2017;9(1):129.
- Hui HX, Hu ZW, Jiang C, et al. ZNF418 overexpression protects against gastric carcinoma and prompts a good prognosis. Onco Targets Ther. 2018;11:2763–2770.
- Manasanch EE, Orlowski RZ. Proteasome inhibitors in cancer therapy. Nat Rev Clin Oncol. 2017;14:417–433.
- Tian Z, Zheng H, Li J, et al. Genetically induced moderate inhibition of the proteasome in cardiomyocytes exacerbates myocardial ischemia-reperfusion injury in mice. Circ Res. 2012;111(5):532–542.
- Ranek MJ, Zheng H, Huang W, et al. Genetically induced moderate inhibition of 20S proteasomes in cardiomyocytes facilitates heart failure in mice during systolic overload. J Mol Cell Cardiol. 2015;85:273–281.
- Wu P, Oren O, Gertz MA, et al. Proteasome inhibitor-related cardiotoxicity: mechanisms, diagnosis, and management. Curr Oncol Rep. 2020;22(7):66.
- Moffat J, Grueneberg DA, Yang X, et al. A lentiviral RNAi library for human and mouse genes applied to an arrayed viral high-content screen. Cell. 2006;124(6):1283–1298.
- Friedrich FW, Reischmann S, Schwalm A, et al. FHL2 expression and variants in hypertrophic cardiomyopathy. Basic Res Cardiol. 2014;109(6):451.
- Dong X, Liu J, Zheng H, et al. In situ dynamically monitoring the proteolytic function of the ubiquitin-proteasome system in cultured cardiac myocytes. Am J Physiol Heart Circ Physiol. 2004;287(3):H1417–25.
- Sanbe A, Osinska H, Saffitz JE, et al. Desmin-related cardiomyopathy in transgenic mice: a cardiac amyloidosis. Proc Natl Acad Sci U S A. 2004;101(27):10132–10136.
- Pathan M, Keerthikumar S, Ang CS, et al. FunRich: an open access standalone functional enrichment and interaction network analysis tool. Proteomics. 2015;15:2597–2601.
- Kresin N, Stucker S, Kramer E, et al. Analysis of contractile function of permeabilized human hypertrophic cardiomyopathy multicellular heart tissue. Front Physiol. 2019;10:239.