
ABSTRACT
Retinal ganglion cell axons are heavily myelinated (98%) and myelin damage in the optic nerve (ON) severely affects vision. Understanding the molecular mechanism of oligodendrocyte progenitor cell (OPC) differentiation into mature oligodendrocytes will be essential for developing new therapeutic approaches for ON demyelinating diseases. To this end, we developed a new method for isolation and culture of ON-derived oligodendrocyte lineage cells and used it to study OPC differentiation. A critical aspect of cellular differentiation is macroautophagy/autophagy, a catabolic process that allows for cell remodeling by degradation of excess or damaged cellular molecules and organelles. Knockdown of ATG9A and BECN1 (pro-autophagic proteins involved in the early stages of autophagosome formation) led to a significant reduction in proliferation and survival of OPCs. We also found that autophagy flux (a measure of autophagic degradation activity) is significantly increased during progression of oligodendrocyte differentiation. Additionally, we demonstrate a significant change in mitochondrial dynamics during oligodendrocyte differentiation, which is associated with a significant increase in programmed mitophagy (selective autophagic clearance of mitochondria). This process is mediated by the mitophagy receptor BNIP3L (BCL2/adenovirus E1B interacting protein 3-like). BNIP3L-mediated mitophagy plays a crucial role in the regulation of mitochondrial network formation, mitochondrial function and the viability of newly differentiated oligodendrocytes. Our studies provide novel evidence that proper mitochondrial dynamics is required for establishment of functional mitochondria in mature oligodendrocytes. These findings are significant because targeting BNIP3L-mediated programmed mitophagy may provide a novel therapeutic approach for stimulating myelin repair in ON demyelinating diseases.
Abbreviations: A2B5: a surface antigen of oligodendrocytes precursor cells, A2B5 clone 105; ACTB: actin, beta; APC: an antibody to label mature oligodendrocytes, anti-adenomatous polyposis coli clone CC1; ATG5: autophagy related 5; ATG7: autophagy related 7; ATG9A: autophagy related 9A; AU: arbitrary units; BafA1: bafilomycin A1; BCL2: B cell leukemia/lymphoma 2; BECN1: beclin 1, autophagy related; BNIP3: BCL2/adenovirus E1B interacting protein 3; BNIP3L/NIX: BCL2/adenovirus E1B interacting protein 3-like; CASP3: caspase 3; CNP: 2′,3′-cyclic nucleotide 3′-phosphodiesterase; Ctl: control; COX8: cytochrome c oxidase subunit; CSPG4/NG2: chondroitin sulfate proteoglycan 4; DAPI: 4′6-diamino-2-phenylindole; DNM1L: dynamin 1-like; EGFP: enhanced green fluorescent protein; FACS: fluorescence-activated cell sorting; FIS1: fission, mitochondrial 1; FUNDC1: FUN14 domain containing 1; GAPDH: glyceraldehyde-3-phosphate dehydrogenase; GFAP: glial fibrillary growth factor; GFP: green fluorescent protein; HsESC: human embryonic stem cell; IEM: immunoelectron microscopy; LAMP1: lysosomal-associated membrane protein 1; LC3B: microtubule-associated protein 1 light chain 3; MBP: myelin basic protein; MFN2: mitofusin 2; Mito-Keima: mitochondria-targeted monomeric keima-red; Mito-GFP: mitochondria-green fluorescent protein; Mito-RFP: mitochondria-red fluorescent protein; MitoSOX: red mitochondrial superoxide probe; MKI67: antigen identified by monoclonal antibody Ki 67; MMP: mitochondrial membrane potential; O4: oligodendrocyte marker O4; OLIG2: oligodendrocyte transcription factor 2; ON: optic nerve; OPA1: OPA1, mitochondrial dynamin like GTPase; OPC: oligodendrocyte progenitor cell; PDL: poly-D-lysine; PINK1: PTEN induced putative kinase 1; PRKN/Parkin: parkin RBR E3 ubiquitin protein ligase; RFP: red fluorescent protein; RGC: retinal ganglion cell; ROS: reactive oxygen species; RT-PCR: real time polymerase chain reaction; SEM: standard error of the mean; SOD2: superoxide dismutase 2, mitochondrial; SQSTM1/p62: sequestosome 1; TEM: transmission electron microscopy; TMRM: tetramethylrhodamine methyl ester; TOMM20: translocase of outer mitochondrial membrane 20; TUBB: tubulin, beta; TUBB3: tubulin, beta 3 class III.
Introduction:
Retinal ganglion cells (RGCs) are the cells that are responsible for transferring information from the eye to the brain via the optic nerve [Citation1]. In the optic nerve (ON), 98% of the RGC axons are myelinated [Citation1]. Enwrapping of the RGC axons by myelin that is generated by oligodendrocytes is absolutely essential for rapid impulse transmission along axons [Citation2]. The dynamic regulation of myelination, which continues throughout an animal’s lifespan, is crucial for both cognitive processes and vision [Citation3–5]. In patients with multiple sclerosis (MS), myelin damage that results from optic nerve inflammation leads to significant vision loss (often one of the earliest symptoms of MS) [Citation6,Citation7]. Since disruption of ON RGC axon myelination severely affects vision [Citation8], understanding the molecular events leading to oligodendrocyte maturation will be critical for developing novel therapeutic strategies against demyelinating diseases affecting the ON [Citation9]. At present, the detailed molecular mechanisms of oligodendrocyte differentiation and myelination are still poorly understood. This is due largely to the lack of availability of purified oligodendrocyte lineage cells from the ON [Citation10]. Here, we report a novel method for the isolation and culture of these cells and utilize this approach to investigate the molecular mechanisms of ON oligodendrocyte differentiation.
Differentiation of oligodendrocytes is accompanied by a marked increase in membrane extensions and substantial remodeling of cell morphology [Citation11]. Generally, macroautophagy (hereafter referred to as autophagy) selectively degrades organelles and proteins, a process that is crucial to cellular remodeling during differentiation [Citation12,Citation13]. In addition, several molecular nodes of interconnections between autophagy and cell death determine the life and death of cells [Citation14,Citation15]. However, the specific mechanisms by which autophagy regulates cellular differentiation are largely unknown [Citation12,Citation16]. It has been shown that ATG9A (autophagy related 9A) is the only transmembrane autophagy protein that is essential for autophagosome formation [Citation17]. It has also been shown that Atg9a mRNA is highly expressed in oligodendrocyte lineage cells relative to other autophagy genes [Citation18].
Mitochondria are organelles that regulate cellular energy and cell death [Citation19]. Therefore, the removal of damaged mitochondria by autophagy, a process called mitophagy, is crucial for the viability of cells [Citation20]. Moreover, mitophagy is tightly interconnected with mitochondrial dynamics, which is integral to preserving mitochondrial function and maintaining energy production [Citation21,Citation22]. Mitochondrial dynamics refers to the highly coordinated cycles of mitochondrial fusion and fission, which are key to multiple biological processes including the coordination of cellular differentiation [Citation23]. BNIP3L/NIX (BCL2/adenovirus E1B interacting protein 3-like) is required for programmed mitophagy, a quality control mechanism necessary for degradation of mitochondria that occurs during differentiation of certain cell types, such as red blood cells and RGCs [Citation24–26].
Our studies showed that ATG9A-mediated autophagy is required for the survival of ON-derived oligodendrocyte progenitor cells (OPCs). Moreover, we found that BNIP3L-mediated programmed mitophagy plays a pivotal role in mitochondrial remodeling during oligodendrocyte differentiation. Taken together, our data demonstrate that mitophagy is involved in the establishment of myelin-forming oligodendrocytes in the ON.
Results:
Culture of optic nerve oligodendrocyte lineage cells
The ability to isolate significant quantities of purified rodent OPCs is necessary to study the molecular mechanisms of lineage progression from OPC to mature oligodendrocyte. In addition, obtaining OPCs in such quantity from the ON would allow the study of RGC axon myelination and the role of oligodendrocytes in myelin repair after ON injury. Although techniques for isolating OPCs from the rat brain are well-documented, obtaining purified OPCs from the ON has remained challenging. Here, we describe a novel method for the preparation of enriched OPCs from rat ON (). In comparison to previous established protocols, this method has some advantages. For instance, in the culture system based on mixed glial cells [Citation27] that is usually used for isolation of oligodendrocytes from cerebral cortex, isolation of a pure population of OPCs is very difficult. Moreover, in comparison to protocols that require several passages to obtain pure OPCs [Citation28], our method is faster.
Figure 1. A novel method for isolation of oligodendrocyte lineage cells from ON. (A) Schematic showing the steps for isolation and culture of oligodendrocyte lineage cells. (B) Slow shaking ON-derived dissociated cells for a week led to separation of two cell types (left panel): spheroids and attached cells. When the spheroids are dissociated and cultured on PDL coated plates without shaking (right panel), the morphology of individual cells is very different from the adherent cells seen in the left panel. Scale bar: 70 μm. (C) Specific markers are expressed in different oligodendrocyte lineage cell types (DIV, days in vitro). (D) Flow cytometry analysis revealed the relative proportion of different cell populations; OPCs (A2B5 positive, O4 negative), pre-oligodendrocytes (A2B5, O4 positive), immature oligodendrocytes (O4 positive, A2B5 negative), and unstained cells from freshly prepared ON dissociated cells, and from primary or secondary spheroids obtained from expanding cells in culture. (E) Primary spheroids were fixed and immunostained against CSPG4; approximately 50% of cells were CSPG4 positive. (F) Immunostaining of secondary spheroids showed that the majority of cells were OLIG2 and O4 positive. Scale bar: 20 μm. (G) OPCs (A2B5-positive, O4-negative cells) were differentiated for 8 days in co-culture with HsESC-derived RGCs, immunostained for MBP and TUBB3 (neuronal marker) and examined by confocal microscopy. Myelin segments formed between neurons and differentiated OLs, as indicated by colocalization. Scale bar: 5 μm
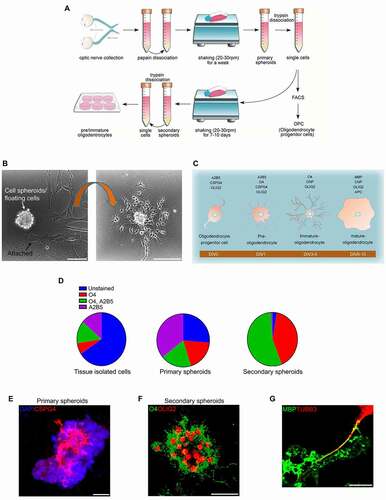
ON tissue was collected from rat pups and dissociated with papain. Dissociated cells were transferred into flasks and shaken inside an incubator at 37°C, 5% CO2 for a week. Slow shaking allowed for the selective attachment of astrocytes to the flask surface (, S1A), as the attachment affinity of astrocytes for the surface is higher than that of OPCs [Citation29]. The non-adherent OPCs formed spheroids. As shown in , the morphology of the attached cells (astrocytes) was very different from the cells that formed spheroids, indicating that these were two distinct populations. After one week in culture, the spheroids (primary spheroids) were isolated, dissociated and prepared for flow cytometry. From the primary spheroids, approximately 35% of cells were immunolabeled for a marker of OPC, A2B5 (a surface antigen of oligodendrocyte precursor cells, A2B5 clone 105), 19% for O4 (oligodendrocyte marker O4) and A2B5 (pre-oligodendrocytes), 18% for O4 (immature oligodendrocytes), and 28% were unstained (, D). The flow cytometry data were confirmed by immunostaining of primary spheroids for CSPG4 (chondroitin sulfate proteoglycan 4), marker of OPCs and pre-oligodendrocytes (). To further culture OPCs, cells positive for A2B5, but negative for O4 were sorted by fluorescence-activated cell sorting (FACS) and transferred onto poly-D-lysine (PDL)-coated plates (). The remaining cells dissociated from the primary spheroids were transferred into different flasks containing the same medium with shaking for an additional week. New spheroids (secondary spheroids) formed and were again dissociated and prepared for flow cytometry analysis. We found that in the secondary spheroids, approximately 55% of cells were A2B5 and O4 positive and 40% were O4 positive, but A2B5 negative, with less than 5% of cells remaining unstained (). The flow cytometry data were confirmed by immunostaining of secondary spheroids for O4 (marker of pre- and immature oligodendrocytes) (). To culture pre- and immature oligodendrocytes, dissociated cells from the secondary spheroids (hereafter referred to as undifferentiated cells) were plated onto PDL-coated plates (). To show differentiation potential, these cells were exposed to differentiation media. These cells differentiated into mature oligodendrocytes with high expression of MBP (myelin basic protein), marker of mature oligodendrocytes (Fig. S1B, C). Moreover, in a co-culture system, colocalization of MBP with the axons of human embryonic stem cell (HsESC)-derived RGCs demonstrated the potential of the differentiated cells to myelinate RGC axons ().
Autophagy is essential for survival of proliferating OPCs
To determine if autophagy machinery is active in A2B5-positive, O4-negative cells (OPCs), these cells were transduced with a green fluorescent protein (GFP)-LC3B (microtubule-associated protein 1 light chain 3 beta) construct. Blocking autophagic flux with bafilomycin A1 (BafA1), a lysosomotropic agent, for 2 h resulted in the accumulation of autophagosomes, indicating active autophagy flux in these cells (). To study the effect of this active autophagic flux on the proliferation of OPCs, autophagy machinery was downregulated in cultured OPCs using Atg9a-shRNA and Becn1-shRNA [Citation30]. Infection of cultured OPCs with Ad-rat-Atg9a-shRNA led to a significant reduction in ATG9A expression (Fig. S2A, B). In addition, the protein expression of SQSTM1/p62 (sequestosome 1) [Citation25,Citation26] was significantly increased, however, there was not a significant change in mRNA levels of SQSTM1/p62, indicating impaired autophagy flux in these cells (Fig. S2C, D). Moreover, infection of Ctl and Atg9a-shRNA OPCs with RFP-GFP-LC3B (red fluorescent protein-GFP tandem fluorescent-tagged LC3B) construct showed that the ratio of autolysosomes to autophagosomes, an indicator of autophagy flux [Citation13], was significantly reduced in Atg9a-shRNA OPCs relative to control (). Importantly, the number of proliferating cells was significantly reduced when autophagy was impaired, indicating an essential role for autophagy in the self-renewal of OPCs (, 2SE). Confirming these findings, infection of cultured OPCs with Becn1-shRNA (AAV2-GFP-rat-Becn1-shRNA) led to a significant reduction in BECN1 expression (Fig. S3A, B) and a significant increase in SQSTM1/p62 protein [Citation31,Citation32], but not in mRNA, again indicating dysregulated autophagy flux in these cells (Fig. S3C, D). In addition, immunostaining of Ctl and Becn1-shRNA OPCs showed a significant reduction in the colocalization of LC3 with LAMP1 (lysosomal-associated membrane protein 1), indicating inhibition of autophagy flux in Becn1-shRNA treated OPCs relative to control (Fig. S3E). Notably, the number of proliferating cells was significantly reduced in Becn1-shRNA OPCs relative to control (Fig. S3F, G), suggesting an essential role for autophagy in the self-renewal of OPCs.
Figure 2. Active autophagy flux in OPCs. (A) OPCs were transduced by GFP-LC3B construct and treated with the lysosomal inhibitor, bafilomycin A1 (BafA1, 50 nM) during the final 2 hours in culture. Confocal imaging showed an increase of GFP-LC3B puncta in the BafA1-treated cells, indicating active autophagy flux. Scale bar: 10 μm. (B) Ctl and Atg9a-shRNA treated cells were transduced by RFP-GFP-LC3B construct. Yellow puncta correspond to autophagosomal structures since both GFP and RFP fluoresce at cytoplasmic pH. Red puncta represent autolysosomes because GFP is quenched by the acidity of lysosomes. Merged confocal images demonstrated many red puncta in Ctl-shRNA treated cells. In contrast, most puncta were yellow in Atg9a-shRNA treated cells, indicating blockage of autophagic flux. The numbers of autophagosomes and autolysosomes were quantified from 30 images per group for each experiment. Scale bar: 10 μm. (C) Proliferation rates of Ctl and Atg9a-shRNA treated cells were measured by counting the total number of cells after 72 h in culture and dividing by the initial number of cells. The cell proliferation is reduced and cell death is increased in Atg9a-shRNA treated cells relative to control. (D) Dead cell stain kit was used to measure the level of cell death by flow cytometry. Cell death was markedly increased in the Atg9a-shRNA treated cells. (E) CASP3 activity is significantly increased in Atg9a-shRNA cells. Treatment of Atg9a-shRNA cells with the selective CASP3 inhibitor (CI, Ac-DEVD-CHO) attenuated cell death and rescued the proliferation rate to control levels. Data are mean ± SEM. *p < 0.05; **p < 0.01
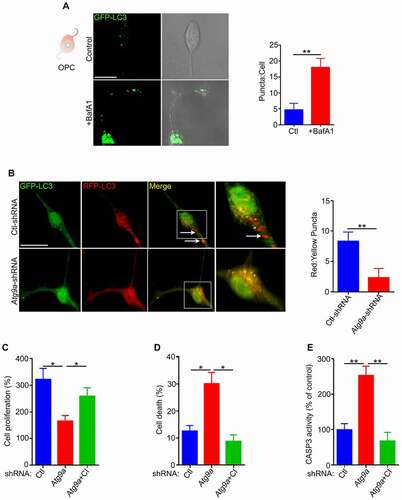
It is known that there is crosstalk between autophagy and cell death [Citation14,Citation30]. We consistently found that the level of cell death was significantly increased when ATG9A expression was inhibited by shRNA (). In addition, the level of CASP3 (caspase 3) activity is also increased in Atg9a-shRNA treated cells (). To verify the involvement of CASP3 in death of autophagy deficient OPCs, the CASP3 activity was inhibited by a selective inhibitor, Ac-DEVD-CHO. Our data showed that inhibition of CASP3 activity not only reduces cell death but also partially rescued the proliferation defect in autophagy deficient OPCs (, D, E), indicating a pro-survival role of autophagy in the maintenance of proliferating OPCs.
It has been previously shown that activated CASP3 can inhibit autophagy flux and promote cell death by degradation of certain autophagy-related genes [Citation14]. Therefore, we tested if CASP3 inhibition leads to restored autophagy flux in our study. To this aim, the protein and mRNA expressions of SQSTM1/p62 were measured in Atg9a-shRNA treated cells with and without Ac-DEVD-CHO. No significant difference was seen in either protein or mRNA expression of SQSTM1/p62 (Fig. S4A, B), indicating that CASP3 inhibition is not able to rescue the autophagy impairment in Atg9a-shRNA treated cells. In this study, the activation of CASP3 is secondary because autophagy machinery is directly targeted and significantly inhibited. Therefore, it is expected that CASP3 inhibition may not affect autophagy flux.
Autophagy flux is increased during differentiation of oligodendrocytes
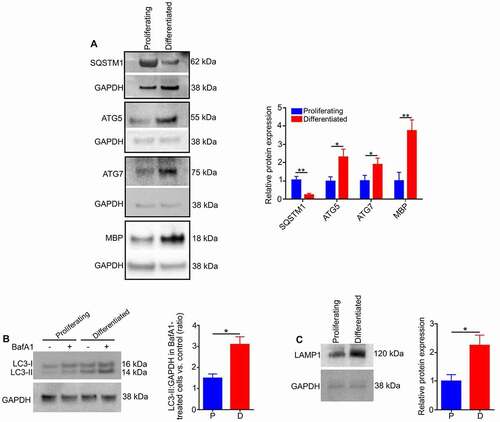
It has been demonstrated that the effect of autophagy on cellular differentiation varies in different cell types [Citation33]. The level of autophagic activity is reduced during differentiation of fibroblasts and neutrophils [Citation33,Citation34], but it is upregulated during differentiation of neural and cardiac stem cells [Citation30,Citation35]. To assess changes in autophagy during oligodendrocyte differentiation, immunoblotting of cell lysates was performed on both proliferating undifferentiated cells and mature oligodendrocytes isolated after six days of differentiation in culture. The levels of autophagy markers such as ATG5 (autophagy related 5) and ATG7 (autophagy related 7) were significantly increased in the differentiated cells, whereas the level of SQSTM1 was greatly reduced (). In addition, as shown in the histogram, the LC3-II flux in the differentiated cells was significantly increased relative to proliferating cells, indicating an increase in autophagy flux (). The expression of LAMP1 was significantly increased, consistent with differentiation ().
Figure 3. The activation of autophagy during oligodendrocyte differentiation. (A) Western blotting of proteins extracted from proliferating (undifferentiated) cells and differentiated cells (oligodendrocytes) showed that levels of ATG5, ATG7 and MBP were significantly increased and SQSTM1 expression was greatly reduced in differentiated cells relative to proliferating cells. (B) Undifferentiated and differentiated cells were cultured in the presence or absence of the lysosomal inhibitor bafilomycin A1 (BafA1). The cells were then lysed and protein lysates analyzed for LC3 by western blotting. A significant increase in the accumulation of the autophagosome-positive LC3-II isoform was observed in differentiated cells relative to undifferentiated (proliferating) cells after BafA1 treatment, indicating an increase in autophagy flux during differentiation. (C) Immunoblotting showed that expression of LAMP1 was increased in differentiated cells relative to undifferentiated cells. Values are mean ± SEM. *p < 0.05; **p < 0.01
Changes in mitochondrial morphology during oligodendrocyte differentiation
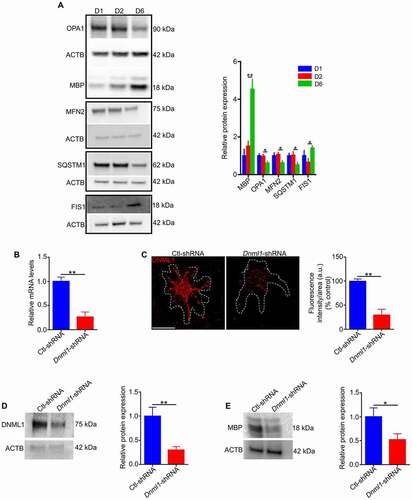
The functional association of mitophagy with mitochondrial dynamics is critical for mitochondrial homeostasis [Citation21]. It is well-known that mitochondrial dynamics plays a key role in the differentiation processes of various cell types [Citation23]. Accordingly, we examined the changes in mitochondrial morphology during OPC differentiation. Mitochondrial morphology was compared in undifferentiated and differentiated cells in vivo by electron microscopy (EM) on optic nerves from 5, 10, and 21 day old rat pups. Oligodendrocyte lineage cells were identified by labeling of specific markers with colloidal gold. In undifferentiated cells, mitochondria have a tubular shape, whereas in mature oligodendrocytes, mitochondria have a more punctate (fragmented) shape (, S5A), denoting a change in mitochondrial dynamics during differentiation. Consistently, a recent study has demonstrated that mitochondria in oligodendrocytes are far smaller and less abundant compared to neurons and astrocytes [Citation36]. Furthermore, immunostaining of differentiating oligodendrocytes for both MBP and TOMM20 (translocase of outer mitochondrial membrane 20) showed that as differentiation progressed, MBP expression increased as mitochondrial morphology changed from tubular to a fragmented and punctate shape (, S5B). The expression of proteins related to mitochondrial dynamics was then compared in cells at different stages of differentiation. With increasing differentiation, the expression of mitochondrial fusion proteins such as MFN2 (mitofusin 2) and OPA1 (OPA1, mitochondrial dynamin like GTPase) decreased, while expression of FIS1 (fission, mitochondrial 1) increased (). In addition, our data showed that when immature cells were incubated in differentiation medium, SQSTM1 expression decreased as differentiation advanced, while MBP increased (). These findings prompted us to investigate the effect of mitochondrial fission on the differentiation of oligodendrocytes. To this end, the expression of DNM1L (dynamin 1-like), a protein required for mitochondrial division in mammalian cells [Citation37], was down regulated in undifferentiated cells by viral-mediated delivery of shRNA, then the cells were maintained in differentiating medium for 6 days. We found that inhibition of DNM1L expression (, C, D) reduces MBP expression in oligodendrocytes (). Moreover, inhibition of DNM1L function in differentiating cells by mitochondrial division inhibitor 1 (Mdivi-1), a cell-permeable small molecule derived from quinazolinone [Citation38], led to a reduction in oligodendrocyte differentiation (Fig. S6A, B). Collectively, these findings suggest that inhibition of mitochondrial fission decreases MBP expression in oligodendrocytes. Furthermore, given that mitochondrial fission precedes mitophagy [Citation39], these data suggest a possible role for mitophagy in the differentiation of oligodendrocytes.
Figure 4. Mitochondrial remodeling during OPC differentiation. (A) Representative electron microscopy images showing mitochondria (arrows) in undifferentiated precursor cells (OPCs and pre-oligodendrocytes) and differentiated oligodendrocytes from the ON. The undifferentiated cells from ON tissue of 5- and 10-day-old rat pups were identified by immunogold labeling using antibodies against A2B5 (marker of OPCs and oligodendrocytes) and O4 (marker of pre and immature oligodendrocytes at this age), while differentiated cells were identified using immunogold labeled antibodies against APC (an antibody to label mature oligodendrocytes) on the ONs of 21-day-old rat pups. In OPCs, mitochondrial morphology is more tubular while in differentiated cells the mitochondria are more fragmented. Scale bar: 800 nm. (B) Immunostaining of oligodendrocyte lineage cells against TOMM20 and MBP showed that as the expression of MBP is increased, the number of puncta from mitochondria (arrows) is also significantly increased. Scale bar: 10 μm
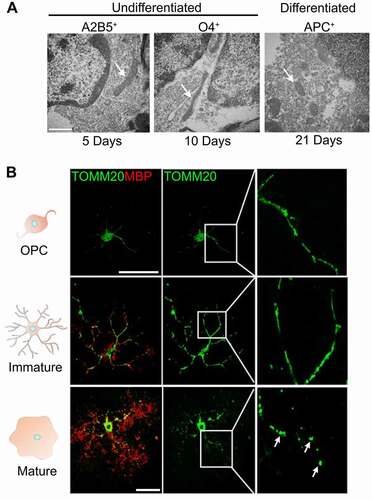
Figure 5. Changes in expression of proteins that regulate mitochondrial dynamics during differentiation of oligodendrocytes. (A) Undifferentiated cells (pre- and immature oligodendrocytes) were grown in differentiating media for 6 days. Immunoblotting showed a marked increase in MBP expression at the terminal stage of cell differentiation that is associated with a significant reduction in expression of mitochondrial fusion proteins (OPA1 and MFN2) and SQSTM1. However, the expression of mitochondrial fission protein (FIS1) is significantly increased. (B) Real-time PCR analysis showed that the mRNA expression of Dnm1l is significantly reduced in Dnm1l-shRNA treated cells relative to control. (C, D) Confocal microscopy and immunoblotting revealed a significant decrease in the staining pattern and protein expression of DNM1L in Dnm1l-shRNA treated cells compared to Ctl-shRNA. Scale bar: 10 μm. a.u., arbitrary units. (E) Undifferentiated cells treated with Dnm1l-shRNA or Ctl-shRNA were grown in differentiation medium for 6 days. Immunoblotting showed that expression of Dnm1l-shRNA in undifferentiated cells led to a significant reduction in MBP expression in differentiated cells relative to control. Data are mean ± SEM. *p < 0.05; **p < 0.01
Mitophagy is activated during oligodendrocyte differentiation
As we demonstrated above, during differentiation of oligodendrocytes mitochondrial fragmentation is associated with increased autophagy flux. We were interested in knowing whether mitophagy is activated during differentiation. To assess the level of mitophagy, we used the COX8 (cytochrome c oxidase subunit 8)-enhanced GFP (EGFP)-mCherry fluorescence reporter that is targeted to the mitochondrial matrix [Citation40]. Yellow puncta correspond to normal mitochondria since both EGFP and mCherry fluoresce at cytoplasmic pH, while red puncta represent mitochondria in lysosomes since EGFP is quenched by the lysosomal acidity. Therefore, the number of red puncta is indicative of mitophagy. We found that the number of red puncta greatly increased as the cells became more differentiated ().
Figure 6. Mitophagy is increased during OPC differentiation. (A) Oligodendrocyte lineage cells were transduced by Adenovirus-COX8-EGFP-mCherry and observed under a confocal microscope. The number of acidic (red-only) mitochondria is significantly increased as differentiation progressed. (mean ± SEM; n = 30 cells from three different experiments). Scale bar: 10 μm. (B) mt-Keima fluorescent protein was expressed in OPCs by lentiviral-mediated delivery and the cells were allowed to differentiate for 6 days. The mt-Keima signal was significantly increased in differentiated cells relative to OPCs (n = 40 cells from three different experiments). Scale bar: 10 μm. (C) OPCs and differentiated cells were transduced with Mito-GFP and then fixed and stained with anti-LAMP1. The Pearson’s correlation co-efficient analysis showed that colocalization greatly increased in differentiated cells. Arrows demonstrate colocalized mitochondria and LAMP1 in zoomed images (n = 20 cells from three different experiments). Scale bar: 10 μm. Data are mean ± SEM. *p < 0.05; **p < 0.01; ***p < 0.001
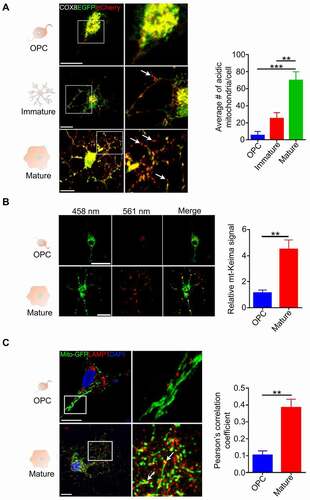
To further confirm these findings, we used the mt-Keima fluorescence reporter, a dual-excitation ratiometric fluorescent pH-sensitive protein that exhibits shorter-wavelength excitation at the physiological pH of normal cytoplasm, and longer-wavelength excitation within the acidic lysosomes [Citation41,Citation42]. We found that the longer-wavelength mt-Keima signal significantly increased in differentiated cells relative to less differentiated cells (), suggesting increased degradation of mitochondria in lysosomes. Furthermore, immunostaining revealed a significant increase in the colocalization of mitochondria with lysosomes in differentiated cells relative to OPCs (). Overall, these data indicate that mitophagy is increased in the terminal stages of oligodendrocyte differentiation.
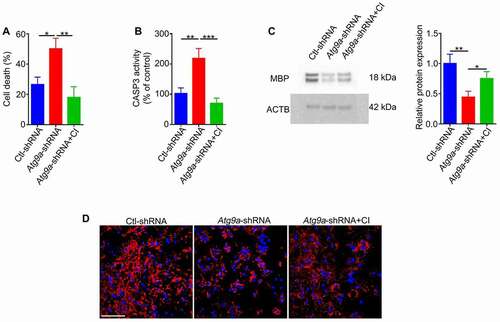
To understand the effect of mitochondrial clearance on cell differentiation, we downregulated ATG9A expression in undifferentiated cells by viral transduction of shRNA (, B, C). After maintaining these cells in differentiating media for six days, autophagy flux () and mitophagy were dramatically reduced (, F). In addition, the level of cell death was increased in shRNA treated cells that was associated with a significant increase in CASP3 activity. Further, the level of cell death was significantly reduced by treatment of cells with a selective CASP3 inhibitor (Ac-DEVD-CHO) (, B). Our data showed that autophagy impairment led to a reduction in oligodendrocyte differentiation. However, reduction of CASP3 activity partially rescued this differentiation defect (, D). Collectively, these data show that inhibition of autophagy flux augments CASP3-mediated cell death in differentiating cells and ultimately caused impaired differentiation.
Figure 7. ATG9A is essential for autophagy and mitophagy during differentiation of oligodendrocytes (A) Real-time PCR analysis showed that expression of ATG9A mRNA is significantly reduced in Atg9a-shRNA treated cells relative to control. (B) Confocal microscopy and (C) immunoblotting revealed a significant decrease in immune-staining and protein expression of ATG9A in Atg9a-shRNA treated cells compared to control cells. Scale bar: 10 μm. (D) Undifferentiated cells treated with Atg9a-shRNA or Ctl-shRNA were allowed to grow in differentiation medium for 6 days with and without BafA1 during the last three hours of culture. The cells were then lysed and protein lysates were analyzed for LC3 by immunoblotting. A significant reduction in the accumulation of the LC3-II-positive autophagosomes was observed in Atg9a-shRNA treated cells relative to Ctl-ShRNA treated cells after BafA1 treatment. (E, F) During the last two days of culture, some cells were transduced with either COX8-EGFP-mCherry or mt-Keima fluorescent reporters. In (E), the number of acidic (red-only) mitochondria was significantly reduced in the Atg9a-shRNA cells relative to control. In (F), the mt-Keima signal was significantly reduced in the Atg9a-shRNA cells relative to control. Scale bar: 20 μm. Data are mean ± SEM. *p < 0.05; **p < 0.01
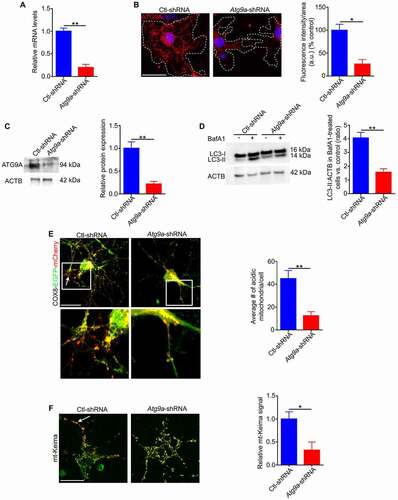
Figure 8. Autophagy impairment leads to increased susceptibility to cell death in newly formed differentiated cells. Undifferentiated cells infected with Atg9a-shRNA or Ctl-shRNA were grown in differentiation medium for 6 days. (A) Cell death and (B) CASP3 activity were increased in the Atg9a-shRNA treated cells relative to control. To measure cell death, the cells were stained with YO-PRO-1 and Hoechst followed by quantification of cell death with ImageJ software. In addition, treatment of Atg9a-shRNA cells with CASP3 inhibitor (CI, Ac-DEVD-CHO) led to a reduction in levels of cell death to the levels similar to those of Ctl-shRNA cells. (C) Representative immunoblot and (D) confocal images showing decreased MBP in Atg9a-shRNA treated cells, that was partially rescued by the CASP3 inhibitor. Scale bar: 100 μm. Values are mean ± SEM. *p < 0.05; **p < 0.01; ***p < 0.001
BNIP3L is required for mitophagy in the terminal stage of oligodendrocyte differentiation
It has been demonstrated in many cell types that the PINK1-PRKN signaling pathway plays a critical role in mitophagy under cell stress [Citation43–45]. We did not find a significant change in PRKN expression between differentiated and undifferentiated cells (Fig. S7A). In addition, downregulation of PRKN in undifferentiated cells via viral-mediated delivery of shRNA led to no significant changes in mitophagy in differentiated cells (Fig. S7B, C, D), suggesting that the PRKN-dependent pathway is not required for programmed mitophagy during oligodendrocyte differentiation. Consistently, it has been shown that basal mitophagy occurs independently of PINK1 (PTEN induced putative kinase 1) and PRKN (parkin RBR E3 ubiquitin protein ligase) in mammalian cells [Citation46,Citation47].
To understand the roles of two important mitophagy receptors, BNIP3 (BCL2/adenovirus E1B interacting protein 3) and FUNDC1 (FUN14 domain containing 1) [Citation35,Citation48] during differentiation of oligodendrocytes, mRNA levels for FUNDC1 and BNIP3 were evaluated in undifferentiated and differentiated cells. There was no significant difference in mRNA expression of FUNDC1 (Fig. S8A), however, the mRNA expression of BNIP3 was significantly increased in differentiated cells (Fig. S8B). Therefore, to understand the role of BNIP3 in regulation of mitophagy during differentiation, the expression of BNIP3 was downregulated in differentiating cells by viral mediated shRNA (Fig. S8C, D) and the level of mitophagy analyzed by either COX8-EGFP-mCherry or mt-Keima fluorescence. No significant difference was seen in the level of mt-Keima or COX8-EGFP-mCherry signals in Bnip3-shRNA OPCs relative to control (Fig. S8E, F), indicating BNIP3 is not critical for programmed mitophagy in the differentiation of oligodendrocytes.
Therefore, to investigate the mechanism of mitophagy, we focused on BNIP3L, the main regulator of programmed mitophagy during differentiation of various cell types [Citation25,Citation26,Citation35,Citation49,Citation50]. While Bnip3l mRNA is known to be upregulated during oligodendrocyte maturation, neither the expression level nor the function of the protein in oligodendrocyte differentiation has been investigated [Citation51]. Our data show that expression of BNIP3L is increased during the differentiation of oligodendrocytes (). Given that oligodendrocyte differentiation is tied to increases in both mitophagy activation and BNIP3L expression, we hypothesized that BNIP3L may be required for mitochondrial clearance during oligodendrocyte differentiation. Therefore, in order to monitor the effect of this protein on the differentiation of oligodendrocytes, we downregulated BNIP3L expression in undifferentiated cells via adenovirus-mediated delivery of shRNA (approximately 80% downregulation, , C), and then maintained the cells for 6 days in differentiating medium. By studying the cells after 6 days in differentiating medium, we found that downregulation of BNIP3L expression increased mitochondrial content () and reduced mitophagy, as evidenced by reduced colocalization of lysosomes and mitochondria (). These data suggest that BNIP3L is required for mitochondrial clearance during differentiation of oligodendrocytes. Moreover, downregulation of BNIP3L expression was associated with decreased autophagy flux () and impaired oligodendrocyte differentiation (), indicating that BNIP3L regulates autophagy/mitophagy during oligodendrocyte differentiation.
Figure 9. BNIP3L regulates mitophagy during differentiation of oligodendrocytes. (A) Immunoblotting of protein extracts from cultured undifferentiated cells and cells differentiated for 6 days showed that expression of BNIP3L was significantly increased in differentiated cells relative to undifferentiated cells. (B) Real-time PCR analysis showed that expression of Bnip3l mRNA is significantly reduced in Bnip3l-shRNA cells relative to control. (C) Expression of BNIP3L in undifferentiated cells was significantly reduced after treatment with Bnip3l-shRNA. (D) Immunoblotting showed that expression of Bnip3l-shRNA in undifferentiated cells led to a significant increase in TOMM20 in differentiated Bnip3l-shRNA oligodendrocytes relative to Ctl-shRNA. (E, F) Undifferentiated cells were treated with Bnip3l-shRNA or Ctl-shRNA and allowed to grow in differentiation medium for 6 days. (E) Then, these cells were transduced with Mito-RFP, fixed and immunostained with LAMP1. The fluorescent signal in the fully differentiated cells was visualized using confocal microscopy. An analysis of Pearson’s colocalization coefficient showed a significant reduction in colocalization of mitochondria and lysosomes in Bnip3l-shRNA cells (arrows) relative to Ctl-shRNA. Scale bar: 20 μm. Data are mean ± SEM; n = 25 cells from three different experiments. (F) On the sixth day, the Bnip3l-shRNA or Ctl-shRNA differentiating cells were cultured in differentiation medium with or without BafA1 during the last three hours of culture. Then, cells were then lysed and protein lysates were analyzed for LC3 by immunoblotting. A significant reduction in the accumulation of the LC3-II-positive autophagosomes was observed in Bnip3l-shRNA treated cells relative to Ctl-ShRNA after BafA1 treatment. Scale bar: 10 μm. Values are mean ± SEM. *p < 0.05
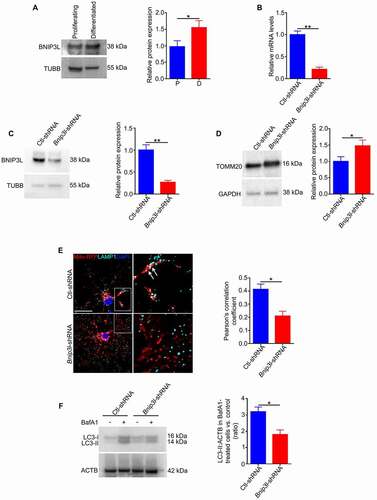
Figure 10. BNIP3L is required for mitochondrial function and survival of newly differentiated oligodendrocytes. Undifferentiated cells were infected with Bnip3l-shRNA or Ctl-shRNA and cultured in differentiation medium for 6 days. (A) Immunoblotting analysis showed a decrease in expression of MBP in Bnip3l-shRNA treated cells relative to those treated with control shRNA. (B) Representative confocal microscope images and quantitative analysis of TMRM fluorescence indicated a significant reduction in MMP in Bnip3l-shRNA cells relative to control. Scale bar: 50 μm. (C) Quantitative analysis of superoxide release showed that the level of superoxide is enhanced in Bnip3l-shRNA infected cells relative to control. (D) Representative images and quantification of MitoSOX fluorescence showed that the level of mitochondrial ROS is increased in Bnip3l-shRNA cells compared to control. Scale bar: 20 μm. (E) Immunoblotting of proteins extracted from differentiated cells showed elevated SOD2 expression in Bnip3l-shRNA infected cells relative to control. (F) Quantification of cell death (%) showed a significant reduction in the viability of Bnip3l-shRNA infected cells relative to control. (G) The level of CASP3 activity is increased in the Bnip3l-shRNA cells relative to control. (H) OPCs treated with Bnip3l or Ctl-shRNA were co-cultured with HsESC-dervied RGCs for 8 days in differentiation medium, then immunostained for MBP and TUBB3. Cells treated with Bnip3l-shRNA had fewer myelin segments (arrows) compared to Ctl-shRNA-treated cells. Scale bar: 10 μm. Values are mean ± SEM. *p < 0.05
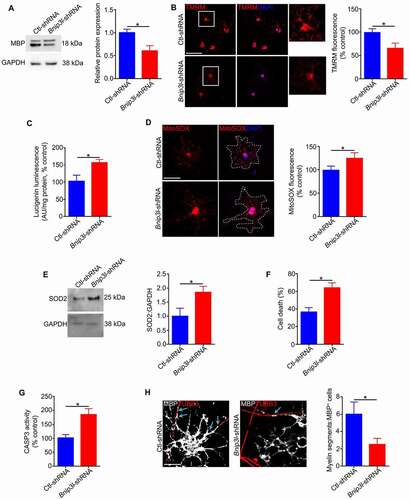
When mitophagy is impaired, modifications in the redox environment can induce cellular stress and cell death [Citation52]. We found that dysregulation of BNIP3L-mediated mitochondrial clearance during differentiation reduced mitochondrial membrane potential (MMP) () and increased mitochondrial superoxide anion generation (, D). Moreover SOD2 (superoxide dismutase 2, mitochondrial), a critical mitochondrial antioxidant, was significantly increased in Bnip3l-shRNA infected cells, relative to control, confirming increased oxidative stress signaling in these cells (). Additionally, an impairment in BNIP3L-mediated mitophagy during the differentiation of oligodendrocytes led to an increase in CASP3 activity and cell death in newly formed differentiated cells (, G).
To evaluate the importance of BNIP3L in regulating the proliferation in OPCs, BNIP3L expression was downregulated in these cells. We found that decreasing BNIP3L did not affect the rate of proliferation or the level of SQSTM1 expression in OPCs (Fig. S9A-C), which indicates a specific role for BNIP3L in the regulation of autophagy and mitophagy during the latter stages of oligodendrocyte differentiation.
BNIP3L-mediated mitophagy is important for myelination
Our data so far showed the effect of mitochondrial clearance on the differentiation and survival of newly formed oligodendrocytes. However, to explore the effect of mitophagy on axonal myelination, we compared the ability of Ctl-shRNA or Bnip3l-shRNA-infected OPCs to myelinate RGCs in co-cultures. Myelin segments were recognized by immunostaining for MBP and TUBB3 (tubulin, beta 3 class III). Cells expressing Ctl-shRNA formed significantly more myelin segments than Bnip3l-shRNA-expressing cells ().
Discussion:
Our study sheds light on the role of mitophagy in the terminal differentiation of oligodendrocytes. First, we demonstrated that while autophagy is required for the proliferation and survival of OPCs, the level of autophagy flux is increased during the differentiation of OPCs into mature oligodendrocytes. Second, we found an alteration in mitochondrial dynamics and morphology during differentiation of OPCs, which is associated with an increase in the mitophagy machinery. Finally, programmed mitophagy during differentiation of OPCs is mediated by BNIP3L. Therefore, our studies demonstrate a key role of BNIP3L-mediated programmed mitophagy in the regulation of proper mitochondrial remodeling in the terminal differentiation of ON oligodendrocytes.
A growing body of evidence demonstrates that mitochondrial remodeling occurs during differentiation of various cell types [Citation53]. We found significant mitochondrial remodeling during the differentiation of OPCs. In OPCs, pre-oligodendrocytes, and immature oligodendrocytes, the mitochondria mainly exhibit elongated morphology. In contrast, the mitochondrial network in mature oligodendrocytes is characterized by a more punctate (fragmented) shape. This mitochondrial remodeling is accompanied by significant changes in the expression of mitochondrial fusion and fission proteins during the differentiation of oligodendrocytes. Our data showed that inhibition of mitochondrial fission significantly reduced oligodendrocyte differentiation, suggesting this mitochondrial remodeling is required for the differentiation of oligodendrocytes.
ATG9A and BECN1 are two critical components of mammalian autophagy and play important roles in embryonic development [Citation17,Citation54,Citation55]. Autophagy flux is high in proliferating neural and cancer progenitor cells, and BECN1-mediated autophagy is required for self-renewal and survival of these cells [Citation30,Citation56]. Likewise, our studies showed that autophagy is active in OPCs, and that the same autophagy machinery is essential for their proliferation. Indeed, autophagy controls the expansion of OPCs in part through regulation of cell death, since inhibition of CASP3 activity partially rescued the proliferation defect in autophagy-deficient OPCs. OPCs undergo extensive morphological changes during differentiation [Citation57]. It is also well-documented that autophagy contributes to the cell remodeling occurring during differentiation of certain cells types, as a crucial homeostatic quality control mechanism [Citation11]. Consistently, our data showed that both the expression of the lysosomal marker (LAMP1) and autophagy flux are increased during the differentiation of oligodendrocytes. Recent studies suggest that autophagy is essential for proper myelin formation in both brain (oligodendrocytes) and the peripheral nervous system (Schwann cells) [Citation58,Citation59]. However, the specific molecular mechanisms largely remain unknown. Degradation of excess and damaged cellular molecules and organelles allows for structural changes in differentiating cells [Citation60]. Recent studies indicate that mitochondrial clearance is required for the elimination of dysfunctional mitochondria in precursor cells, and the establishment of new functional mitochondria in differentiated cells [Citation61]. Furthermore, we show that mitophagy is significantly increased with the progression of differentiation in OPCs. In addition, autophagy impairment in differentiating cells led to reduced mitochondrial clearance, increased susceptibility to cell death and ultimately impaired oligodendrocyte differentiation. Thus, we demonstrate that increased autophagy flux and mitophagy is essential for differentiation of oligodendrocytes.
Two distinct signaling pathways can regulate mitophagy: either PINK1-PRKN or receptor-mediated mitophagy [Citation62]. Most studies to date have focused on PINK1-PRKN-mediated mitophagy because it is recognized as the main pathway for clearing depolarized mitochondria under cell stress [Citation43–45]. However, in an elegant study, McWilliams et al, showed that PINK1 is not essential for basal mitophagy in mammalian cells [Citation46,Citation47]. Consistent with that study, we show that PRKN is not critical for programmed mitophagy in oligodendrocytes.
BNIP3L is considered to be the main regulator of programed mitophagy during cell differentiation [Citation25,Citation26,Citation35,Citation49]. In addition, BNIP3L is a mitophagy receptor that can directly induce mitophagy, independent of PINK1-PRKN [Citation62]. Our data revealed that increased expression of BNIP3L is required for the regulation of programmed mitophagy and the mitochondrial network remodeling that accompanies oligodendrocyte differentiation.
Mitophagy eliminates dysfunctional mitochondria and their harmful generation of reactive oxygen species, thereby helping maintain cellular homeostasis [Citation48,Citation63]. During the differentiation of oligodendrocytes, mitophagy-deficient cells displayed increased mitochondrial ROS generation, compared to control cells, suggesting a protective role for mitophagy in maintenance of a healthy mitochondrial network during oligodendrocyte differentiation. In addition, downregulation of BNIP3L in differentiating cells reduced mitochondrial function and increased susceptibility to cell death. Previous studies have shown a pro-survival role for BNIP3L-mediated mitophagy in cardiac progenitor cell differentiation [Citation35], and in different disease models [Citation64,Citation65]. We found that BNIP3L-mediated mitophagy is not only important to the survival of newly formed oligodendrocytes, but also to axonal myelination, indicating a critical role of functional mitochondria in myelin formation. Our data showed that BNIP3L regulates autophagy flux and mitophagy during the differentiation of oligodendrocytes. Although we showed that autophagy was required for proliferation and survival of OPCs, the downregulation of BNIP3L expression in these cells did not affect the rate of proliferation. Therefore, this suggests that autophagy machinery might be regulated by different molecular mechanisms at different stages of cellular differentiation in oligodendrocytes.
In conclusion, our data demonstrate that significant remodeling of the mitochondrial network is essential for the differentiation of oligodendrocytes and that this remodeling is dependent on a marked upregulation of mitophagy. We found that BNIP3L-mediated programmed mitophagy plays an important role in the mitigation of mitochondrial oxidative stress and the survival of newly formed differentiated oligodendrocytes. Therefore, targeting BNIP3L-mediated mitophagy may be a novel therapeutic approach for promoting myelination in demyelinating diseases.
Materials and Methods:
Animals
All animal studies were performed in accordance with the institutional guidelines for the Care and Use of Animals (National Academy Press) and were approved by the University of Pittsburgh Animal Care and Use Committee. The Sprague-Dawley rats (neonatal pups) used in this study were housed in the animal facility of the John G. Rangos Sr. Research Center at Children’s Hospital of Pittsburgh.
Culture of oligodendrocyte lineage cells
The ONs were collected from postnatal (P) 4 to P7 day old rat pups, dissociated with papain (Worthington Biochemical, LS003126) and transferred into T25 collagen IV coated flasks (Thermo Fisher, 132706). Cells were shaken at 20–30 revolutions per minute (rpm) while incubating at 37°C, 5% CO2 for a week. The basal medium composition was: Dulbecco’s modified eagle medium and Ham’s F-12 medium (DMEM:F12) (Thermo Fisher, 11330032), penicillin-streptomycin (Thermo Fisher, 15140163), SM1 neuronal supplement, N2 supplement B (STEMCELL Technologies, 5711, and 07156, respectively), N-acetyl-cysteine (Sigma, A8199), forskolin (Calbiochem, 344270) and CNTF (ciliary neurotrophic factor; PeproTech, 450–50). For the proliferation medium, growth factors PDGF (platelet-derived growth factor) and NT3 (neurotrophin 3) (PeproTech, 100–13A, 450–03) were added. The final concentration of each compound is reported in supplementary information (Table S1). To prepare the differentiation medium, 40 ng/mL of triiodothyronine (T3; Sigma-Aldrich, T5516-1 MG) was added to the basal media. After culturing for one week in proliferation media, primary spheroids were dissociated with 0.25% trypsin (Thermo Fisher Scientific, 25200072) for 5 min, and then labeled with A2B5 Alexa Fluor 405-conjugated and O4 Alexa Fluor 750-conjugated (R&D Systems, FAB1416V, FAB1326S) for fluorescence-activated cell sorting (FACS).
Flow cytometry
For flow cytometry experiments, spheroids were collected after one or two weeks in culture and washed with phosphate-buffered saline (PBS; Gibco, 10010–023) followed by treatment with 0.25% trypsin (Gibco, 25200–072) for 5 min. Trypsin was deactivated with trypsin inhibitor (Sigma, T9253), and cells were centrifuged at 300 x g for 5 min, and suspended in flow cytometry buffer (BD Bioscience, 554656). Cells were then stained with a mixture of A2B5 Alexa Fluor 405-conjugated and O4 Alexa Fluor 750-conjugated antibodies in flow cytometry buffer for 15 min at room temperature. Excess cell suspensions were combined for unstained and single stain controls. Samples were run on a BD Aria III flow cytometer (BD Biosciences, San Jose, CA, USA) and analyzed using BD FACS DIVA software [Citation66].
Gene silencing
To examine expression of genes of interest in oligodendrocytes, cells were infected with rat adenovirus (Ad)-YFP-U6-Atg9a-shRNA or Ad-YFP-U6-scrambled-shRNA (Vector Biolabs, shADV-293236, 1783), Adenovirus (Ad)-GFP-U6-Bnip3l-shRNA or Ad-GFP-U6-scrambled-shRNA (Vector Biolabs, shADV-294092, 1122), AAV2-GFP-Becn1-shRNA or AAV2 control shRNA (Vector Biolabs, shAAV-290735, 7041) at 100 multiplicity of infection (MOI) for 48 h before conducting experiments [Citation67]. SMARTvector Rat Lentiviral Bnip3 shRNA and lentiviral shRNA control (Dharmacon, V3SR7594, RHS4348), Prkn shRNA lentiviral particles (Santa Cruz Biotechnology, sc-270243-V), Dnm1l shRNA lentiviral particles (Santa Cruz Biotechnology, sc-270298-V), and control shRNA lentiviral particles (Santa Cruz Biotechnology, sc-108080) were administered at 20 MOI (multiplicity of infection) for 48 h before conducting experiments. Infection and gene knockdown efficiency was evaluated by fluorescence microscopy, quantitative RT-PCR or immunoblotting.
Labeling autophagosomes and mitochondria in live cells
To visualize autophagosomes and mitochondria, we used the commercially available Premo autophagy sensor LC3B-GFP kit (Life Technologies, P36235; expresses GFP-LC3B) and mitochondria-RFP (Mito-RFP) kit (Life Technologies, C10505) respectively, according to the manufacturer’s protocols. Autophagosomes and mitochondria in the Ad-Bnip3l-shRNA-infected differentiating cells were visualized by Premo autophagy sensor LC3B-RFP kit (Life Technologies, P36236; expresses RFP-LC3B) and MitoTracker Deep Red (Cell Signaling Technology, 8778S) respectively, as stated by the manufacturer’s protocol.
MMP and superoxide generation
MMP was measured with tetramethylrhodamine methyl ester (TMRM; Invitrogen, T668), and MitoSOX Red Mitochondrial Superoxide Indicator (Thermo Fisher Scientific, M36008) was used to measure mitochondrial superoxide, following the manufacturer’s instructions. At least 30 live cells per condition for each experiment were imaged using a Zeiss LSM 710 confocal microscope (Zeiss, Switzerland). Alternatively, mitochondrial superoxide generation was measured with lucigenin (bis-N-methylacridinium nitrate; Sigma, M8010) as previously described [Citation68]. In brief, 5 mM lucigenin was prepared in Hanks’ balanced salt solution (HBSS) and 100 μL of pre-warmed lucigenin buffer was added to the culture plates and incubated at 37°C and 5% CO2 for 5 min. Luminescence was then measured using a Glomax bioluminescence apparatus (Promega, E5311), with 5 consecutive readings per sample taken for 1 s each. The luminescence signal was normalized to total protein content and represented as arbitrary units (AU) per mg of protein.
Keima targeted to mitochondria (mt-Keima)
mt-Keima plasmid, kindly provided by Dr. Toren Finkel (Director, UPMC Aging Institute), and mt-Keima lentivirus were prepared as described before [Citation69]. In summary, the lentivirus (LV) constructs were packaged with Virapower lentiviral packaging mix and transfected into 293 T cells using lipofectamine 3000 (Invitrogen, L3000015). Supernatants were concentrated at 96 h post transfection using Lenti-X concentrator (Clontech, 631231), then processed according to manufacturer’s specifications. Cells were infected with LV-mt-Keima at a MOI of approximately 3, using 6 µg/ml polybrene (Sigma Aldrich, TR-1003) during infection. Culture medium was changed 24 h after infection. Fluorescence change in mt-Keima was analyzed by confocal microscopy, and mt-Keima fluorescence signal was calculated as described previously [Citation41,Citation42].
COX8-EGFP-mCherry
pCLBW COX8 EGFP mCherry plasmid was purchased (Addgene, 78520; deposited by the laboratory of Dr. David Chan) and the sequence corresponding to COX8-EGFP-mCherry was subcloned into an adenovirus vector at Vector Biolabs as a paid service. The cells were infected at 50 MOI for 24 h before conducting experiments.
qRT-PCR
RNA isolation, cDNA synthesis and qRT–PCR were performed as described previously [Citation70]. PCR amplification was performed using the 7500 PCR Fast Real-Time System (Applied Biosystems, Carlsbad, CA, USA), using custom-made TaqMan probes from Life Technologies for rat Becn1 (Rn00586976_m1), Bnip3l (Rn01534668_g1), Atg9a (Rn01400691_m1), Dnm1l/Drp1 (Rn00586466_m1), Prkn (Rn00571787_m1), Bnip3 (Rn00821446_g1), and Fundc1 (Rn01430711_m1). Actb (Rn01412977_g1) was used as a loading control. All data were analyzed with the ABI 7500 Real-Time PCR system, using Data Assist Software (Applied Biosystems); the graphs were plotted using Microsoft Excel (Microsoft, Redmond, WA, USA).
Cell death assay
LIVE/DEAD™ Fixable Blue Dead Cell Stain Kit (Invitrogen, L34961) was used to measure the level of cell death in OPCs by flow cytometry, following the manufacturer’s instructions. The level of cell death in differentiated cells was determined as described previously [Citation35]. In brief, cells were stained with YO-PRO-1 (Thermo Fisher Scientific, Y3603) and Hoechst 33342 (Thermo Fisher Scientific, 62249) for 5 min at 37°C. Cells were imaged and cell death was quantified with ImageJ software. At least 150 cells were quantified for each experimental condition in three replicates.
CAPS3 activity assay
The level of CASP3 activity was measured by using the CASP3 Activity Assay Kit (Cell Signaling Technology, 5723S) according to the manufacturer’s protocol. Reduction of CASP3 activity was achieved by using a selective CASP3 inhibitor (Ac-DEVD-CHO; Santa Cruz Biotechnology, sc-506284) that was prepared in DMSO. Cells were treated with CASP3 inhibitors or DMSO (equal volume). The effective dose of Ac-DEVD-CHO for treatment of cells was 2 μM. At this dose, the CASP3 activity of Atg9a-shRNA cells was reduced to levels similar to those of Ctl-shRNA cells, rather than complete inhibition.
Immunocytochemistry
Cells were fixed and permeabilized as described previously [Citation71]. Cells were stained with the following primary antibodies: TOMM20, SQSTM1 (Abcam, ab11415, ab91526), MBP (Biolegend, 808401), MKI67 (Invitrogen, MA5-14520), A2B5, O4 (R&D Systems, MAB1416, MAB1326), OLIG2, DNM1L/DRP1, BECN1 (Novus Biologicals, NBP1-28667, NB110-55288, NB500-249), ATG9A, LAMP1 (Abcam, ab108338, ab25245) and LC3 (Cell Signaling Technology, 2775). Secondary antibodies were: Alexa Fluor 488 (Life Technologies, A21206, A21202), Alexa Fluor 555 (Life Technologies, A31570, A31572) or Alexa Fluor 633 (Life Technologies, A21082).
Densitometry
For quantitative analysis of immunofluorescence intensity, images were processed using ImageJ software. Images were split by red, green and blue (RGB) channels and converted from 24-bit to 8-bit. Regions present in each membrane were automatically identified in the red channel using the “triangle” auto-threshold method. Mean intensity and total area measured were then determined using ImageJ.
Western blotting and antibodies
Western blotting and quantification was carried out as described previously [Citation71,Citation72]. The signal intensity of the bands was quantified by using ImageJ software [Citation3]. All targeted proteins and internal loading controls were detected and verified within the same linear range. Primary antibodies used were LC3, ATG5, ATG7, BNIP3L, GAPDH (Cell Signaling Technology, 2775S, 12,994, 8558S, 12,396, 5174), SQSTM1 (Novus Biologicals, NBP1-42821), SOD2 (Abcam, ab13533), ATG9A (Abcam, ab108338), ACTB (Sigma Aldrich, A2066), TOMM20, MFN2, OPA1, FIS1, PRKN, DNM1L/DRP1, BNIP3 (Novus Biologicals, H00009804-M01, NBP2-6638355, NBP2-59770SS, NB100-56646SS, NBP1-80515, NB110-55288, NB100-56150), LAMP1 (Abcam, ab24170) and MBP (Biolegend, 808401). Secondary antibodies used were peroxidase-labeled goat anti-rabbit and anti-mouse (KPL, 074–1506 and 074–1806).
Transmission electron microscopy (TEM)
ONs were dissected from rats at different ages and fixed in 4% paraformaldehyde (PFA) for 12 h followed by 24 h treatment in 30% sucrose (Sigma, S0389). Tissues were embedded in optimal cutting temperature compound (OCT), and cryosections were cut with 12 micrometer thickness. Sections were subject to 24 h immunolabeling with primary antibodies: APC (Calbiochem, OP80), A2B5, and O4 (R&D Systems, MAB1416, MAB1326). Sections were then treated with a secondary antibody, goat anti-mouse IgG + IgM (H + L), 6-nm colloidal gold (Jackson Immunoresearch, 115–195-068). Specimens were then fixed with a cold solution of 2.5% glutaraldehyde (25% glutaraldehyde stock EM grade; Taab Chemical, G002) in 0.01 M PBS (Fisher Scientific, BP3994) at pH 7.3. After rinsing in PBS, specimens were post-fixed in 1% osmium tetroxide (Electron Microscopy Sciences, 19110) with 1% potassium ferricyanide (Fisher Scientific, P232-500) and dehydrated through a graded series of ethanol (30% – 90% – Reagent Alcohol, Fisher Scientific, A962-4; and 100% – Ethanol 200 Proof, Pharmco, 111000200CSPPTF). For sectioning, samples were embedded in Poly/Bed® 812 (Luft Formulations kit; Polysciences, 02600–1; dodecenyl succinic anhydride, nadic methyl anhydride, Poly/Bed 812 resin and dimethylaminomethyl). Semi-thin (300 nm) sections were taken with a Leica Reichart Ultracut (Leica Microsystems, Buffalo Grove, IL, USA) stained with 0.5% Toluidine Blue (Fisher Chemical, T161-25) in 1% sodium borate (Fisher Scientific, LC229551)) and examined under a light microscope. Ultrathin sections (65 nm) were stained with 2% uranyl acetate (Electron Microscopy Sciences, 22400) and Reynold’s lead citrate (lead nitrate, sodium citrate and sodium hydroxide; Fisher Scientific, L62-100, S470-212, S318-100), and examined on a JEOL 1400 transmission electron microscope (JEOL Peabody, MA, USA) with a side mount AMT 2k digital camera (Advanced Microscopy Techniques, Danvers, MA, USA).
Co-culture of OPCs and HsESC-derived RGCs
Human ESC-derived RGCs were prepared as described previously [Citation73] and were plated (50,000 cells/coverslip) on PDL-laminin-coated coverslips in medium (containing neurobasal media, B27 supplement and N2 supplement) to permit neurite outgrowth for a week, prior to seeding with Bnip3l-shRNA or Ctl-shRNA OPCs. Once seeded, OPC HsESC-derived RGC co-cultures were maintained for 8 days in a 1:1 mixture of neuronal culture and OPC differentiating media to permit OPC maturation. Finally, cells were fixed, and immunocytochemistry assessment of myelin segments was performed by MBP (Biolegend, 808401) and TUBB3 (Abcam, ab18207) immunostaining.
Statistical analysis
Statistical analysis was performed using GraphPad 6.0 software. The P-values were assayed using 2-tailed Student’s t-test and repeated-measure ANOVA tests with Tukey’s post-hoc test based on the data obtained from at least 3 independent experiments. The difference between groups were considered as significant when * P < 0.05; ** P < 0.01; *** P < 0.001. Data are presented as mean ± SEM and each biological replicate has at least three technical replicates.
Supplemental Material
Download MS Word (2.7 MB)Acknowledgments
We thank Drs. Simon Watkins (Director of the Center for Biologic Imaging and Vice-Chair, Department of Cell Biology, University of Pittsburgh School of Medicine, USA) and Shomi Bhattacharya (UCL Institute of Ophthalmology, UK) for critical reading and insightful discussions. We would like to thank Dr. Toren Finkel, Director of UPMC Aging Institute, for kindly providing the mt-Keima plasmid. We would also like to thank the Imaging Core Facility, Department of Pediatrics, University of Pittsburgh School of Medicine for their help with the confocal microscopy studies. This study was funded by the Knights Templar Eye Foundation (award to MY), NIH R21HD059008-01 (to DS), University of Pittsburgh start-up funds (to DS), Jennifer Salvitti Davis Chair in Ophthalmology (to DS), NIH P30 EY08098 (to Department of Ophthalmology Molecular Biology Core), Research to Prevent Blindness, NY (to Department of Ophthalmology, UPMC), 1K99EY029011 (to XC) and P30EY001765 (to DJZ).
Disclosure statement
The authors have nothing to disclose.
Supplementary material
Supplemental data for this article can be accessed here.
Additional information
Funding
References
- Yazdankhah M, Shang P, Ghosh S, et al. Role of glia in optic nerve. Prog Retin Eye Res. 2020 Aug 6:100886. PubMed PMID: 32771538; eng. DOI:https://doi.org/10.1016/j.preteyeres.2020.100886.
- Simons M, Nave KA. Oligodendrocytes: myelination and axonal support. Cold Spring Harbor Perspect Biol. 2015 Jun 22;8(1):a020479. . PubMed PMID: 26101081; PubMed Central PMCID: PMCPMC4691794. eng.
- Reiszadeh-Jahromi S, Sepand MR, Ramezani-Sefidar S, et al. Sepantronium bromide (ym155), a small molecule survivin inhibitor, promotes apoptosis by induction of oxidative stress, worsens the behavioral deficits and develops an early model of toxic demyelination: in vivo and in-silico study. Neurochem Res. 2019 Nov;44(11):2482–2498. PubMed PMID: 31489534; eng.
- Dooley MC, Foroozan R. Optic neuritis. J Ophthalmic Vis Res. 2010 Jul;5(3):182–187. PubMed PMID: 22737354; PubMed Central PMCID: PMCPMC3379920. eng
- Williamson JM, Lyons DA. Myelin dynamics throughout life: an ever-changing landscape? Front Cell Neurosci. 2018;12:424. . PubMed PMID: 30510502; PubMed Central PMCID: PMCPMC6252314. eng
- Costello F. Vision disturbances in multiple sclerosis. Semin Neurol. 2016 Apr;36(2):185–195. . PubMed PMID: 27116725; eng
- Harirchian MH, Tekieh AH, Modabbernia A, et al. Serum and CSF PDGF-AA and FGF-2 in relapsing-remitting multiple sclerosis: a case-control study. Eur J Neurol. 2012 Feb;19(2):241–247. PubMed PMID: 21771201; eng.
- Quinn TA, Dutt M, Shindler KS. Optic neuritis and retinal ganglion cell loss in a chronic murine model of multiple sclerosis. Front Neurol. 2011;2:50. . PubMed PMID: 21852980; PubMed Central PMCID: PMCPMC3151613. eng
- Klistorner A, Arvind H, Garrick R, et al. Remyelination of optic nerve lesions: spatial and temporal factors. Mult Scler. 2010 Jul;16(7):786–795. PubMed PMID: 20530125; eng.
- Suzuki N, Sekimoto K, Hayashi C, et al. Differentiation of oligodendrocyte precursor cells from sox10-venus mice to oligodendrocytes and astrocytes. Sci Rep. 2017 Oct 26;7(1):14133. PubMed PMID: 29074959; PubMed Central PMCID: PMCPMC5658394. eng.
- de Faria O Jr., Dhaunchak AS, Kamen Y, et al. TMEM10 promotes oligodendrocyte differentiation and is expressed by oligodendrocytes in human remyelinating multiple sclerosis plaques. Sci Rep. 2019 Mar 5;9(1):3606. PubMed PMID: 30837646; PubMed Central PMCID: PMCPMC6400977. eng.
- Boya P, Codogno P, Rodriguez-Muela N. Autophagy in stem cells: repair, remodelling and metabolic reprogramming. Development. 2018 Feb 26;145(4). PubMed PMID: 29483129; eng. DOI:https://doi.org/10.1242/dev.146506.
- Yazdankhah M, Shang P, Ghosh S, et al. Modulating EGFR-MTORC1-autophagy as a potential therapy for persistent fetal vasculature (PFV) disease. Autophagy. 2019 Sep 1:1–13. PubMed PMID: 31462148; eng. DOI:https://doi.org/10.1080/15548627.2019.1660545.
- Fimia GM, Corazzari M, Antonioli M, et al. Ambra1 at the crossroad between autophagy and cell death. Oncogene. 2013 Jul 11;32(28):3311–3318. PubMed PMID: 23069654; eng.
- Kang R, Zeh HJ, Lotze MT, et al. The beclin 1 network regulates autophagy and apoptosis. Cell Death Differ. 2011 Apr;18(4):571–580. PubMed PMID: 21311563; PubMed Central PMCID: PMCPMC3131912. eng.
- Clarke AJ, Simon AK. Autophagy in the renewal, differentiation and homeostasis of immune cells. Nat Rev Immunol. 2019 Mar;19(3):170–183. . PubMed PMID: 30531943; eng
- Feng Y, Klionsky DJ. Autophagic membrane delivery through ATG9. Cell Res. 2017 Feb;27(2):161–162. . PubMed PMID: 28072404; PubMed Central PMCID: PMCPMC5339853. eng
- Belgrad J, De Pace R, Fields RD. Autophagy in myelinating glia. J Neurosci. 2020 Jan 8;40(2):256–266. . PubMed PMID: 31744863; PubMed Central PMCID: PMCPMC6948934. eng.
- Tait SW, Green DR. Mitochondria and cell signalling. J Cell Sci. 2012 Feb 15;125(Pt 4):807–815. . PubMed PMID: 22448037; PubMed Central PMCID: PMCPMC3311926. eng.
- Lu H, Li G, Liu L, et al. Regulation and function of mitophagy in development and cancer. Autophagy. 2013 Nov 1;9(11):1720–1736. PubMed PMID: 24091872; eng.
- Bordi M, Nazio F, Campello S. the close interconnection between mitochondrial dynamics and mitophagy in cancer. Front Oncol. 2017;7:81. . PubMed PMID: 28512624; PubMed Central PMCID: PMCPMC5411450. eng
- Ikeda Y, Sciarretta S, Nagarajan N, et al. New insights into the role of mitochondrial dynamics and autophagy during oxidative stress and aging in the heart. Oxid Med Cell Longev. 2014;2014(210934). DOI:https://doi.org/10.1155/2014/210934. PubMed PMID: 25132912; PubMed Central PMCID: PMCPMC4124219. eng.
- Noguchi M, Kasahara A. Mitochondrial dynamics coordinate cell differentiation. Biochem Biophys Res Commun. 2018 May 27;500(1):59–64. . PubMed PMID: 28634072; eng.
- Ney PA. Mitochondrial autophagy: origins, significance, and role of BNIP3 and NIX. Biochim Biophys Acta. 2015 Oct;1853(10 Pt B):2775–2783. . PubMed PMID: 25753537; eng
- Esteban-Martinez L, Sierra-Filardi E, McGreal RS, et al. Programmed mitophagy is essential for the glycolytic switch during cell differentiation. Embo J. 2017 Jun 14;36(12):1688–1706. PubMed PMID: 28465321; PubMed Central PMCID: PMCPMC5470043. eng.
- Schweers RL, Zhang J, Randall MS, et al. NIX is required for programmed mitochondrial clearance during reticulocyte maturation. Proc Natl Acad Sci U S A. 2007 Dec 4;104(49):19500–19505. PubMed PMID: 18048346; PubMed Central PMCID: PMCPMC2148318. eng.
- Sánchez-Gómez MV, Serrano MP, Alberdi E, et al. Isolation, expansion, and maturation of oligodendrocyte lineage cells obtained from rat neonatal brain and optic nerve. Methods Mol Biol. 2018;1791:95–113. . PubMed PMID: 30006704; eng
- Bögler O. Isolation and purification of primary oligodendrocyte precursors. Curr Protoc Neurosci. 2001May; Chapter 3:Unit 3. 4. DOI:https://doi.org/10.1002/0471142301.ns0304s00. PubMed PMID: 18428468; eng
- O’Meara RW, Ryan SD, Colognato H, et al. Derivation of enriched oligodendrocyte cultures and oligodendrocyte/neuron myelinating co-cultures from post-natal murine tissues. J Vis Exp. 2011 Aug;21(54). PubMed PMID: 21876528; PubMed Central PMCID: PMCPMC3217647. eng. DOI:https://doi.org/10.3791/3324.
- Yazdankhah M, Farioli-Vecchioli S, Tonchev AB, et al. The autophagy regulators ambra1 and beclin 1 are required for adult neurogenesis in the brain subventricular zone. Cell Death Dis. 2014 Sep;4(5):e1403. . PubMed PMID: 25188513; PubMed Central PMCID: PMCPMC4540193. eng.
- Heerma van VMR, Kammers K, Vesuna F, et al. Global effects of ddx3 inhibition on cell cycle regulation identified by a combined phosphoproteomics and single cell tracking approach. Transl Oncol. 2018 Jun;11(3):755–763. PubMed PMID: 29684792; PubMed Central PMCID: PMCPMC6050443. eng.
- Bjorkoy G, Lamark T, Pankiv S, et al. Monitoring autophagic degradation of p62/SQSTM1. Methods Enzymol. 2009;452:181–197. . PubMed PMID: 19200883; eng
- Pan H, Cai N, Li M, et al. Autophagic control of cell ‘stemness’. EMBO Mol Med. 2013 Mar;5(3):327–331. PubMed PMID: 23495139; PubMed Central PMCID: PMCPMC3598074. eng.
- Salemi S, Yousefi S, Constantinescu MA, et al. Autophagy is required for self-renewal and differentiation of adult human stem cells. Cell Res. 2012 Feb;22(2):432–435. PubMed PMID: 22184008; PubMed Central PMCID: PMCPMC3271583. eng.
- Lampert MA, Orogo AM, Najor RH, et al. BNIP3L/NIX and FUNDC1-mediated mitophagy is required for mitochondrial network remodeling during cardiac progenitor cell differentiation. Autophagy. 2019 Jul;15(7):1182–1198. PubMed PMID: 30741592; PubMed Central PMCID: PMCPMC6613840. eng.
- Rinholm JE, Vervaeke K, Tadross MR, et al. Movement and structure of mitochondria in oligodendrocytes and their myelin sheaths. Glia. 2016 May;64(5):810–825. PubMed PMID: 26775288; eng.
- Fonseca TB, Á S-G, Milosevic I, et al. Mitochondrial fission requires DRP1 but not dynamins. Nature. 2019 Jun;570(7761):E34–e42. PubMed PMID: 31217603; eng.
- Cassidy-Stone A, Chipuk JE, Ingerman E, et al. Chemical inhibition of the mitochondrial division dynamin reveals its role in Bax/Bak-dependent mitochondrial outer membrane permeabilization. Dev Cell. 2008 Feb;14(2):193–204. PubMed PMID: 18267088; PubMed Central PMCID: PMCPMC2267902. eng.
- Twig G, Shirihai OS. The interplay between mitochondrial dynamics and mitophagy. Antioxid Redox Signal. 2011 May 15;14(10):1939–1951. . PubMed PMID: 21128700; PubMed Central PMCID: PMCPMC3078508. eng.
- Rojansky R, Cha MY, Chan DC. Elimination of paternal mitochondria in mouse embryos occurs through autophagic degradation dependent on PARKIN and MUL1. eLife. 2016 Nov 17;5. doi:https://doi.org/10.7554/eLife.17896. PubMed PMID: 27852436; PubMed Central PMCID: PMCPMC5127638. eng.
- Sun N, Yun J, Liu J, et al. Measuring in vivo mitophagy. Mol Cell. 2015 Nov 19;60(4):685–696. PubMed PMID: 26549682; PubMed Central PMCID: PMCPMC4656081. eng.
- Sun N, Malide D, Liu J, et al. A fluorescence-based imaging method to measure in vitro and in vivo mitophagy using mt-Keima. Nat Protoc. 2017 Aug;12(8):1576–1587. PubMed PMID: 28703790; eng.
- Narendra D, Tanaka A, Suen DF, et al. Parkin is recruited selectively to impaired mitochondria and promotes their autophagy. J Cell Biol. 2008 Dec 1;183(5):795–803. PubMed PMID: 19029340; PubMed Central PMCID: PMCPMC2592826. eng.
- Kubli DA, Zhang X, Lee Y, et al. Parkin protein deficiency exacerbates cardiac injury and reduces survival following myocardial infarction. J Biol Chem. 2013 Jan 11;288(2):915–926. PubMed PMID: 23152496; PubMed Central PMCID: PMCPMC3543040. eng.
- Durcan TM, Fon EA. The three ‘P’s of mitophagy: PARKIN, PINK1, and post-translational modifications. Genes Dev. 2015 May 15;29(10):989–999. . PubMed PMID: 25995186; PubMed Central PMCID: PMCPMC4441056. eng.
- McWilliams TG, Prescott AR, Montava-Garriga L, et al. Basal mitophagy occurs independently of pink1 in mouse tissues of high metabolic demand. Cell Metab. 2018 Feb 6;27(2):439–449. e5. PubMed PMID: 29337137; PubMed Central PMCID: PMCPMC5807059. eng.
- Mitochondria BK. The needless PINK1. Nat Rev Mol Cell Biol. 2018 Jan 23; 19(2):76. . PubMed PMID: 29358687; eng.
- Baechler BL, Bloemberg D, Quadrilatero J. Mitophagy regulates mitochondrial network signaling, oxidative stress, and apoptosis during myoblast differentiation. Autophagy. 2019;15(9):1606–1619. Sep. PubMed PMID: 30859901; PubMed Central PMCID: PMCPMC6693454. eng.
- Brennan LA, McGreal-Estrada R, Logan CM, et al. BNIP3L/NIX is required for elimination of mitochondria, endoplasmic reticulum and golgi apparatus during eye lens organelle-free zone formation. Exp Eye Res. 2018;174:173–184. Sep. PubMed PMID: 29879393; PubMed Central PMCID: PMCPMC6110959. eng.
- Sandoval H, Thiagarajan P, Dasgupta SK, et al. Essential role for nix in autophagic maturation of erythroid cells. Nature. 2008 Jul 10;454(7201):232–235. . PubMed PMID: 18454133; PubMed Central PMCID: PMCPMC2570948. eng
- Itoh T, Itoh A, Pleasure D. Bcl-2-related protein family gene expression during oligodendroglial differentiation. J Neurochem. 2003;85(6):1500–1512. Jun. PubMed PMID: 12787069; eng.
- Jiang XS, Chen XM, Hua W, et al. PINK1/parkin mediated mitophagy ameliorates palmitic acid-induced apoptosis through reducing mitochondrial ROS production in podocytes. Biochem Biophys Res Commun. PubMed PMID: 32173525; eng. 2020 Mar 12. DOI:https://doi.org/10.1016/j.bbrc.2020.02.170.
- Bahat A, Gross A. Mitochondrial plasticity in cell fate regulation. J Biol Chem. 2019 Sep 20; 294(38):13852–13863. . PubMed PMID: 31383739; PubMed Central PMCID: PMCPMC6755789. eng.
- Levine B, Klionsky DJ. Development by self-digestion: molecular mechanisms and biological functions of autophagy. Dev Cell. 2004 Apr;6(4):463–477. . PubMed PMID: 15068787; eng
- Yue Z, Jin S, Yang C, et al. Beclin 1, an autophagy gene essential for early embryonic development, is a haploinsufficient tumor suppressor. Proc Natl Acad Sci U S A. 2003 Dec 9;100(25):15077–15082. . PubMed PMID: 14657337; PubMed Central PMCID: PMCPMC299911. eng
- Gong C, Bauvy C, Tonelli G, et al. Beclin 1 and autophagy are required for the tumorigenicity of breast cancer stem-like/progenitor cells. Oncogene. 2013 May 2. [Cited 2272e.1-11]. 32(18):2261–2272. PubMed PMID: 22733132; PubMed Central PMCID: PMCPMC3679409. eng.
- Osterhout DJ, Wolven A, Wolf RM, et al. Morphological differentiation of oligodendrocytes requires activation of Fyn tyrosine kinase. J Cell Biol. 1999 Jun 14;145(6):1209–1218. PubMed PMID: 10366594; PubMed Central PMCID: PMCPMC2133143. eng.
- Bankston AN, Forston MD, Howard RM, et al. Autophagy is essential for oligodendrocyte differentiation, survival, and proper myelination. Glia. 2019 Sep;67(9):1745–1759. PubMed PMID: 31162728; eng.
- Jang SY, Shin YK, Park SY, et al. Autophagy is involved in the reduction of myelinating Schwann cell cytoplasm during myelin maturation of the peripheral nerve. PloS One. 2015;10(1):e0116624. . PubMed PMID: 25581066; PubMed Central PMCID: PMCPMC4291222. eng
- Mizushima N, Levine B. Autophagy in mammalian development and differentiation. Nat Cell Biol. 2010 Sep;12(9):823–830. . PubMed PMID: 20811354; PubMed Central PMCID: PMCPMC3127249. eng
- Sin J, Andres AM, Taylor DJ, et al. Mitophagy is required for mitochondrial biogenesis and myogenic differentiation of C2C12 myoblasts. Autophagy. 2016;12(2):369–380. . PubMed PMID: 26566717; PubMed Central PMCID: PMCPMC4836019. eng
- Palikaras K, Lionaki E, Tavernarakis N. Mechanisms of mitophagy in cellular homeostasis, physiology and pathology. Nat Cell Biol. 2018 Sep;20(9):1013–1022. PubMed PMID: 30154567, eng
- Pickles S, Vigie P, Youle RJ. Mitophagy and quality control mechanisms in mitochondrial maintenance. Curr Biol. 2018 Feb 19; 28(4):R170–r185. . PubMed PMID: 29462587; eng.
- Ma J, Ni H, Rui Q, et al. Potential roles of NIX/BNIP3L pathway in rat traumatic brain injury. Cell Transplant. 2019 May;28(5):585–595. PubMed PMID: 30961359; eng.
- Yuan Y, Zheng Y, Zhang X, et al. BNIP3L/NIX-mediated mitophagy protects against ischemic brain injury independent of PARK2. Autophagy. 2017 Oct 3;13(10):1754–1766. . PubMed PMID: 28820284; PubMed Central PMCID: PMCPMC5640199. eng
- Robinson AP, Rodgers JM, Goings GE, et al. Characterization of oligodendroglial populations in mouse demyelinating disease using flow cytometry: clues for MS pathogenesis. PloS One. 2014;9(9):e107649. . PubMed PMID: 25247590; PubMed Central PMCID: PMCPMC4172589. eng
- Ou Z, Sun Y, Lin L, et al. Olig2-Targeted G-protein-coupled receptor gpr17 regulates oligodendrocyte survival in response to lysolecithin-induced demyelination. J Neurosci. 2016 Oct 12;36(41):10560–10573. PubMed PMID: 27733608; PubMed Central PMCID: PMCPMC6601930. eng.
- Kuribayashi F, Tsuruta S, Yamazaki T, et al. Cell adhesion markedly increases lucigenin-enhanced chemiluminescence of the phagocyte NADPH oxidase. Genes Cells. 2008 Dec;13(12):1249–1256. PubMed PMID: 19032347; eng.
- Brothers KM, Kowalski RP, Tian S, et al. Bacteria induce autophagy in a human ocular surface cell line. Exp Eye Res. 2018 Mar;168:12–18. PubMed PMID: 29288646; PubMed Central PMCID: PMCPMC5826873. eng.
- Shang P, Valapala M, Grebe R, et al. The amino acid transporter SLC36A4 regulates the amino acid pool in retinal pigmented epithelial cells and mediates the mechanistic target of rapamycin, complex 1 signaling. Aging Cell. 2017 Apr;16(2):349–359. PubMed PMID: 28083894; PubMed Central PMCID: PMCPMC5334531. eng.
- Ghosh S, Padmanabhan A, Vaidya T, et al. Neutrophils homing into the retina trigger pathology in early age-related macular degeneration. Commun Biol. 2019;2:348. . PubMed PMID: 31552301; PubMed Central PMCID: PMCPMC6754381. eng
- Ghosh S, Shang P, Terasaki H, et al. A Role for betaA3/A1-crystallin in type 2 emt of rpe cells occurring in dry age-related macular degeneration. Invest Ophthalmol Vis Sci. 2018 Mar 20;59(4):Amd104–amd113. PubMed PMID: 30098172; PubMed Central PMCID: PMCPMC6058694. eng.
- Sluch VM, Chamling X, Liu MM, et al. Enhanced stem cell differentiation and immunopurification of genome engineered human retinal ganglion cells. Stem Cells Transl Med. 2017 Nov;6(11):1972–1986. PubMed PMID: 29024560; PubMed Central PMCID: PMCPMC6430043. eng.