
ABSTRACT
Alzheimer disease (AD) is usually accompanied by two prominent pathological features, cerebral accumulation of amyloid-β (Aβ) plaques and presence of MAPT/tau neurofibrillary tangles. Dysregulated clearance of Aβ largely contributes to its accumulation and plaque formation in the brain. Macroautophagy/autophagy is a lysosomal degradative process, which plays an important role in the clearance of Aβ. Failure of autophagic clearance of Aβ is currently acknowledged as a contributing factor to increased accumulation of Aβ in AD brains. In this study, we have identified crocetin, a pharmacologically active constituent from the flower stigmas of Crocus sativus, as a potential inducer of autophagy in AD. In the cellular model, crocetin induced autophagy in N9 microglial and primary neuron cells through STK11/LKB1 (serine/threonine kinase 11)-mediated AMP-activated protein kinase (AMPK) pathway activation. Autophagy induction by crocetin significantly increased Aβ clearance in N9 cells. Moreover, crocetin crossed the blood-brain barrier and induced autophagy in the brains’ hippocampi of wild-type male C57BL/6 mice. Further studies in transgenic male 5XFAD mice, as a model of AD, revealed that one-month treatment with crocetin significantly reduced Aβ levels and neuroinflammation in the mice brains and improved memory function by inducing autophagy that was mediated by AMPK pathway activation. Our findings support further development of crocetin as a pharmacological inducer of autophagy to prevent, slow down progression, and/or treat AD.
Abbreviations: Aβ: amyloid-β; ABCB1/P-gp/P-glycoprotein: ATP-binding cassette, subfamily B (MDR/TAP), member 1; AD: Alzheimer disease; AMPK/PRKAA: AMP-activated protein kinase; APP: amyloid beta (A4) precursor protein; ATG: autophagy related; BBB: blood-brain barrier; BECN1: beclin 1, autophagy related; CAMKK2/CaMKKβ: calcium/calmodulin-dependent protein kinase kinase 2, beta; CSE: Crocus sativus extract; CTSB: cathepsin B; EIF4EBP1: eukaryotic translation initiation factor 4E binding protein 1; GFAP: glial fibrillary acidic protein; GSK3B/GSK3β: glycogen synthase kinase 3 beta; Kp: brain partition coefficient; LRP1: low density lipoprotein receptor-related protein 1; MAP1LC3B/LC3B: microtubule-associated protein 1 light chain 3 beta; MAP2: microtubule-associated protein 2; MAPK/ERK: mitogen-activated protein kinase; MAPT/tau: microtubule-associated protein tau; MTT: 3-(4,5-dimethylthiazol-2-yl)-2,5-diphenyltetrazolium bromide; MTOR: mechanistic target of rapamycin kinase; MWM: Morris water maze; NFKB/NF-κB: nuclear factor of kappa light polypeptide gene enhancer in B cells; NMDA: N-methyl-d-aspartic acid; RPTOR: regulatory associated protein of MTOR; RPS6KB1/p70S6K: ribosomal protein S6 kinase 1; SQSTM1: sequestosome 1; SRB: sulforhodamine B; STK11/LKB1: serine/threonine kinase 11; TFEB: transcription factor EB; TSC2: TSC complex subunit 2; ULK1: unc-51 like kinase 1.
Introduction
Alzheimer disease (AD) is one of the most common neurodegenerative disorders. AD generally affects aged people and is characterized by memory loss and cognitive decline [Citation1,Citation2]. Pathology of AD is complex; it is usually accompanied by the presence of amyloid-β (Aβ) plaques and MAPT/tau (microtubule associated protein tau) neurofibrillary tangles in the brains of AD patients as key hallmarks of the disease [Citation3]. A major cause of Aβ accumulation in the brain is the imbalance in Aβ production and clearance [Citation4,Citation5]. In sporadic AD, Aβ clearance is reduced due to the disruption of several mechanisms of Aβ elimination [Citation6]. Autophagy is one of the most important physiological mechanisms by which Aβ is cleared in the brain [Citation7,Citation8]. Autophagy is a cellular degradation pathway for protein aggregates, long-lived proteins and cytoplasmic components inside cells [Citation9–12]. Compared to age-matched control subjects, in the brains of mild cognitive impairment (MCI) and AD patients, increased levels of protein aggregate associated with reduced autophagy have been reported [Citation13]. These aggregates could create a direct toxic insult to neurons, and their removal by increasing autophagy reduces neuronal degeneration [Citation14,Citation15].
Recent studies have implicated defective autophagy for the accumulation of Aβ in the brains of AD mouse models suggesting an important role of autophagy in the clearance of Aβ [Citation16,Citation17]. Reduced levels of the autophagy-related protein BECN1 (beclin 1, autophagy related) has been associated with increased accumulation of Aβ in the brains of APP (amyloid beta precursor protein) transgenic mice, whereas enhanced levels of BECN1 reduced the accumulation of Aβ [Citation18]. Besides, existing studies demonstrated accumulation of Aβ induces autophagy dysfunction. For example, in a comparison study for the expression level of autophagy markers ATG5 (autophagy related 5), MAP1LC3B/LC3B-I (microtubule-associated protein 1 light chain 3 beta)-I and LC3B-II in the hippocampus tissues of Tg2576 mice brains, a mouse model of AD that expresses mutant APP, were significantly lower than those in non-transgenic wild-type mice [Citation19]. These findings suggest the abnormal accumulation of mutant APP and Aβ induces autophagy dysfunction [Citation19]. Thus, developing interventions that increase autophagy could provide a useful therapeutic treatment to combat Aβ accumulation and protein aggregation. Metformin, a first-line medication for treatment of type 2 diabetes, demonstrated a beneficial effect against proteins misfolding and aggregation, which are characteristics of neurodegenerative diseases including AD [Citation20], by activating AMP-activated protein kinase (AMPK/PRKAA) and inducing autophagy through the inhibition of MTOR (mechanistic target of rapamycin kinase) signaling [Citation21].
Recently, we identified crocetin as a potential inducer of autophagy to be tested against AD pathology. Crocetin is a natural active compound in the hydroalcoholic extract of flower stigmas of Crocus sativus and formed by enzymatic deglycosylation of crocin in the intestine [Citation22]. Crocetin possesses multiple pharmacological characteristics, such as antioxidant and anti-inflammatory, with neuroprotective properties [Citation23–28]. For example, Berger and colleagues reported crocetin to inhibit glutamate- and N-methyl-d-aspartic acid (NMDA)-induced membrane depolarization in rat cortical brain slices [Citation25]; and Chalatsa et al. (2019) reported crocetin significantly reduced APP processing to produce Aβ by inhibiting BACE1 (beta-secretase 1) and the catalytic components of gamma-secretase (PSEN1 [presenilin 1] and PSEN2) in APP expressing SH-SY5Y cells, and reduced total and hyper-phosphorylated MAPT/tau by downregulating GSK3B (glycogen synthase kinase 3 beta), MAPK1/ERK2 (mitogen-activated protein kinase 1), and phospho-MAPK1/ERK2-MAPK3/ERK1 [Citation26]. Additionally, in in vitro studies, crocetin has been shown to restore the reduced ability of AD patients’ monocytes to degrade Aβ42 [Citation27] and to reduce Aβ accumulation and inflammation in the brains of APPsw transgenic mice by suppressing NFKB/NF-κB (nuclear factor of kappa light polypeptide gene enhancer in B cells) activation [Citation28]. Crocetin is one of the main active constituents of Crocus sativus extract (CSE), and recently we reported that CSE significantly reduced Aβ levels in 5XFAD mice brains by increasing Aβ clearance [Citation29]. Mechanistic studies revealed CSE increased Aβ clearance by inducing Aβ major transport proteins, namely ABCB1/P-gp/P-glycoprotein (ATP-binding cassette, sub-family B (MDR/TAP), member 1) and LRP1 (low density lipoprotein receptor-related protein 1) located at the endothelial cells of the blood-brain barrier (BBB) [Citation29].
In the current study, we have explored the effect of crocetin on the clearance of brain Aβ by autophagy. We have established the molecular mechanism of crocetin’s actions and have shown that its AMPK-inducing role promotes the clearance of Aβ both in-vitro using mouse microglia N9 cells and primary neuronal cells and in vivo using 5XFAD mice as an AD model. We have further shown that crocetin crosses the BBB to induce autophagy in both C57BL/6 wild-type and 5XFAD mice. Based on the current study findings, we propose crocetin as a potential pre-clinical candidate to prevent, treat, and/or slow the progression of AD.
Results
Crocetin-induced autophagy is concentration- and time-dependent
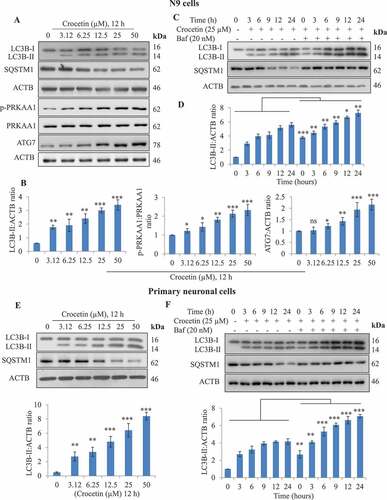
Our initial experiments revealed that crocetin treatment for 12 h induced autophagy over a range of concentrations in mouse microglia N9 cells ). Crocetin treated N9 cells displayed increased LC3B-II levels in a concentration-dependent manner from 3.12 to 50 µM; crocetin also abrogated the expression of SQSTM1 (sequestosome 1) in a concentration-dependent manner ( and S1A). Similar results were observed in primary neuronal cells ( and S1B). Before conducting experiments using the neuronal cells, the purity of the primary neuron cells was assessed by confirming expression of neuronal marker MAP2 (microtubule-associated protein 2) and absence of astroglial marker GFAP (glial fibrillary acidic protein) by immunocytochemistry (Fig. S1E). Next, we attempted to analyze the concentration-dependent effect of crocetin on the phosphorylation of AMPK at Thr172 (p-PRKAA1 at Thr172, hereafter referred to as p-PRKAA1), a major regulator of autophagy and ATG7. The results indicated that crocetin has insignificant mild effect on these proteins at lower concentrations, whereas, at 25 and 50 µM, the upregulation of these proteins was highly significant (). Based on these results, we assessed whether crocetin is toxic if used at 25 µM by 2 methods viz the 3-(4,5-dimethylthiazol-2-yl)-2,5-diphenyltetrazolium bromide (MTT) and sulforhodamine B (SRB) assays. Findings from MTT assay demonstrated crocetin is not toxic when tested in N9 and neuronal cells (Fig. S1C). Similar results were obtained by SRB-based assay in primary neurons, confirming that crocetin does not induce toxicity after 96 h of treatment at 25 µM (Fig. S1D). Collectively and based on these results, 25 µM concentration of crocetin was selected for subsequent in vitro studies. At this concentration, crocetin with or without bafilomycin A1, which blocks fusion between autophagosomes and lysosomes [Citation30], induced LC3B-II in N9 cells, primary neuronal cells and astrocytes in a time-dependent manner at 3, 6, 9, 12 and 24 h (, S1A, S1B and S1F).
Figure 1. Crocetin induces autophagic markers in microglia N9 and primary neuronal cells. (A) Concentration-dependent effect of crocetin on LC3B-II, SQSTM1, p-PRKAA1 and ATG7 in N9 cells after 12-h treatment, and (B) their densitometry analysis. (C) Time-dependent effect of crocetin (25 µM) on autophagic flux in N9 cells, and (D) their densitometry analysis. (E) Concentration-dependent effect and densitometry analysis of crocetin on LC3B-II and SQSTM1 in primary neuronal cells after 12 h treatment. (F) Autophagic flux in primary neuronal cells and densitometry analysis was calculated after treatment with crocetin (25 µM) in the absence and presence of 20 nM bafilomycin A1 (Baf) for 6 h in a time-dependent manner. Cell lysates were analyzed by western blotting for LC3B-II, SQSTM1, p-PRKAA1 and ATG7. Quantification of western blots for densitometric analysis of LC3B-II and ATG7 normalized to ACTB while p-PRKAA1 was normalized to total PRKAA1 by using ImageJ software. Data is presented as mean±SD of three independent experiments, and statistical analysis was performed using Bonferroni test. * P < 0.05, ** P < 0.01, *** P < 0.001, ns = not significant
Crocetin induced autophagy markers by activating AMPK pathway
We then investigated the mechanism of crocetin-induced autophagic markers by evaluating AMPK pathway in N9 and primary neuronal cells. As shown in and S2, data revealed 25 µM crocetin significantly upregulated the expression of p-PRKAA1 in a time-dependent manner. Downstream target of activated AMPK that is ULK1 (unc-51 like kinase 1) was similarly upregulated, while expression of p-MTOR was strongly abrogated, which further confirmed the activation of AMPK ( and S2). To explain AMPK activation, we analyzed the expression of two major kinases responsible for its activation, STK11/LKB1 (serine/threonine kinase 11) and CAMKK2/CaMKKβ (calcium/calmodulin-dependent protein kinase kinase 2, beta). Crocetin treated N9 and primary neuronal cells displayed a strong increase in expression of p-STK11, whereas no alteration in CAMKK2 expression was observed (, S2A, and S2B). To rule out the role of CAMKK2 in AMPK activation, the effect of crocetin on changes in intracellular levels of calcium in N9 cells was monitored using Fluo3-AM assay, and results demonstrated crocetin has no effect on calcium levels (Fig. S2C). Crocetin treated N9 and primary neuronal cells further showed enhanced expression of autophagic markers including BECN1, ATG5, ATG7 and ATG12 in a time-dependent manner (, S2A, and S2B).
Figure 2. Crocetin promotes STK11-dependent phosphorylation of AMPK pathway. Representative western blotting results of autophagy markers p-STK11 (Ser334), STK11, p-PRKAA1, PRKAA1, p-ULK1 (Ser317), ULK1, p-MTOR (Ser2448), TSC2, BECN1, ATG5, ATG7, and ATG12 levels in (A) N9 cells and (B) primary neuronal cells treated with crocetin 25 µM for different time intervals. ACTB was used as the housekeeping protein. Findings demonstrated crocetin upregulated autophagy marker in a time-dependent manner. These experiments were repeated three independent times. Data quantification is shown in Supplementary data (Fig. S2A and S2B)
Crocetin crossed the BBB and induced autophagy in brain hippocampus of C57BL/6 mice
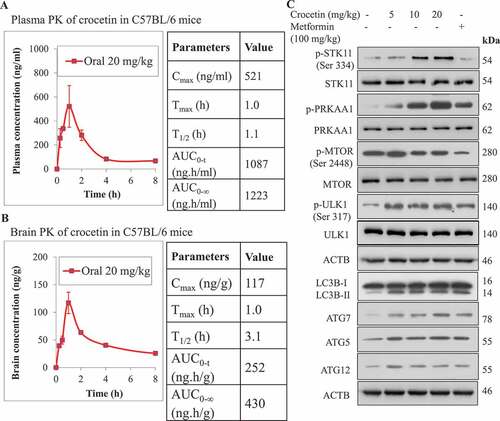
A single dose of crocetin (20 mg/kg) was orally administered to male C57BL/6 mice, and blood and brain samples were collected at various time points (0, 0.5, 1, 2, 4, 6 and 8 h) for pharmacokinetic studies in plasma and brain. Plasma Cmax (maximum concentration) of crocetin was determined as 521 ng/ml, whereas Cmax in the brain was 117 ng/g with Tmax (time at Cmax) value of 1.0 h in both plasma and brain (). Half-life (T1/2) value of crocetin in the brain was three times higher at 3.1 h than that in plasma with 1.1 h. Brain partition coefficient (Kp) of crocetin was determined from its AUC values in plasma and brain [Citation31], with obtained value of 0.35 supporting crocetin crosses the BBB and reaches the brain. Next, C57BL/6 mice (n = 6 per group) were treated once daily by oral gavage for 30 d with 5, 10 and 20 mg/kg crocetin to assess its effect on autophagy markers in mice brains. At the end of treatment, brains’ hippocampi were isolated and homogenized to analyze the expression of proteins related to AMPK and autophagy pathway. Simultaneously, an additional mice group was treated with metformin (100 mg/kg, n = 6), used as a positive control, once daily for 30 d by oral gavage. Protein expression analysis of the homogenates of crocetin-treated mice displayed high level of autophagic activity even at 5 mg/kg dose, which was evident by enhanced expression of LC3B-II and the upregulation of several autophagic protein markers including ATG7, ATG5 and ATG12 ( and S3). In addition, crocetin treatment led to phosphorylation of STK11 at Ser334 and AMPK activation. The phosphorylation of AMPK at Thr172 (p-PRKAA1) led to ULK1 phosphorylation at Ser317 and inhibition of p-MTOR (Ser2448), which collectively demonstrated that crocetin induced autophagy in the C57BL/6 mice hippocampi ( and S3).
Figure 3. Crocetin crosses the BBB and induced autophagy markers in the brains of wild-type C57Bl/6 mice. Crocetin level in (A) plasma, and (B) brain tissue versus time profiles as determined by HPLC (n = 3 mice per time point) following the administration of a single oral dose of 20 mg/kg crocetin. (C) Representative western blot of p-STK11 (Ser334), STK11, p-PRKAA1, PRKAA1, p-ULK1 (Ser317), p-MTOR (Ser2448), LC3B-II, ATG5, ATG7, and ATG12 following daily administration of 5, 10 and 20 mg/kg crocetin and 100 mg/kg metformin by oral gavage for 30 d
STK11 role in crocetin mediated activation of AMPK pathway
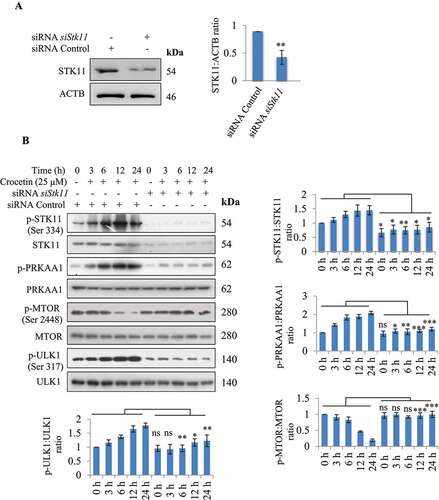
To confirm the role of STK11 in crocetin-mediated activation of AMPK pathway, we knocked down Stk11 by siRNA in N9 cells followed by treatment with crocetin. As shown in , a significant reduction in STK11 was observed in N9 cells transfected with siStk11 demonstrating successful knockdown. As expected, when tested in N9 cells transfected with siStk11, crocetin did not demonstrate AMPK activation, which is in contrast to treated wild-type N9 cells (MOCK cells) that displayed a significant activation of AMPK pathway (). The effect of crocetin on downstream proteins such as p-ULK1 (Ser317) and MTOR was also reversed in Stk11 knocked down cells, thus confirming the role of STK11 in crocetin-mediated activation of AMPK pathway ().
Figure 4. Knockdown of STK11 Abrogates crocetin induced AMPK activation. (A) N9 cells transfection with siStk11 successfully reduced the expression of STK11. (B) Representative western blots and densitometry analysis of p-STK11 (Ser334), STK11, p-PRKAA1, PRKAA1, p-ULK1 (Ser317), ULK, p-MTOR (Ser2448) and MTOR in N9 STK11-knockdown N9 cells treated with crocetin (25 µM) at different time points. Data are presented as mean±SD of three independent experiments, and statistical analysis was performed using Bonferroni test. * P < 0.05, ** P < 0.01, *** P < 0.001, ns = not significant
Crocetin induced Aβ42-hilyte Fluor 555 clearance that was abrogated by STK11 knockdown in microglia N9 cells
AD is characterized by brain accumulation of Aβ in the form of plaques. Autophagy is a physiological process to clear misfolded proteins and worn-out organelles in the cells. Therefore, we assessed if crocetin could increase Aβ clearance by autophagy induction. For this, N9 cells were pre-treated with crocetin for 2 h followed by the addition of fluorescently tagged Aβ42-hilyte Fluor 555 for 12 h. Cells’ engulfing of Aβ42-hilyte Fluor 555 was monitored by confocal microscopy and flow cytometer in the presence or absence of crocetin. Findings from fluorescence imaging displayed that in the absence of crocetin, a strong intracellular red fluorescence was observed, whereas, cells treated with crocetin showed highly reduced intensity of red fluorescence suggesting clearance of Aβ by crocetin ( and S4A). Rapamycin, which was used as a positive control, also demonstrated similar results ( and S4A). The autophagy inhibitor bafilomycin A1, on the contrary, enhanced the red fluorescence, indicating diminished clearance of Aβ ( and S4A). The enhanced fluorescence of Aβ42-hilyte Fluor 555 in cells treated with bafilomycin A1 and crocetin suggests bafilomycin A1 blocked crocetin-induced autophagy ( and S4A). These results were further corroborated by using flow cytometer analysis under similar conditions (). Furthermore, to assess the remaining quantity of Aβ42-hilyte Fluor 555 in the media, we measured the fluorescence intensity in the media. Cells treated with crocetin showed reduced levels of Aβ in the media, while the media of cells treated with bafilomycin A1 displayed enhanced red fluorescence indicating inhibition of autophagic clearance of Aβ, which strongly corroborates our previous results (Fig. S4B). To further validate Aβ42 clearance by crocetin in N9 cells, ELISA of intracellular and extracellular Aβ42 was performed by treating the cells under a similar condition as above with Aβ42. The intracellular and extracellular levels of Aβ42 were significantly reduced in cells treated with crocetin and rapamycin, while increased accumulation of both intracellular and extracellular Aβ42 was observed in cells treated with bafilomycin A1 (Fig. S4C).
Figure 5. Effect of crocetin on clearance of Aβ42 in N9 cells. (A) Confocal images of N9 cells treated with fluorescently tagged Aβ42-hilyte fluor 555 displayed significantly reduced red fluorescence of Aβ when treated with crocetin (Cro) 25 µM compared with cells treated with Aβ alone. Rapamycin (Rap, 200 nM) in all the experiments was used as a positive control; bafilomycin A1 (Baf, 20 nM) on the contrary reduced the clearance of Aβ. All the images were taken by Olympus Fluoview, FV-1000 confocal laser scanning microscope at 60x. Scale bars: 6 μm. (B) Flow cytometer analysis of N9 cells treated with crocetin as described above for the analysis of Aβ42-hilyte fluor 555 fluorescence. Samples treated with crocetin alone displayed marked decrease in number of Aβ-positive cells when compared to samples treated with Aβ alone. (C) Knockdown of STK11 hampers crocetin-induced clearance of Aβ42-hilyte fluor 555 in N9 cells. Flow cytometry analysis for clearance of Aβ42-hilyte fluor 555 was performed in siStk11-transfected N9 cells in presence or absence of crocetin. Data is presented as mean ± SD of three independent experiments, and statistical analysis was performed using Bonferroni test. * P < 0.05, ** P < 0.01, ns = not significant
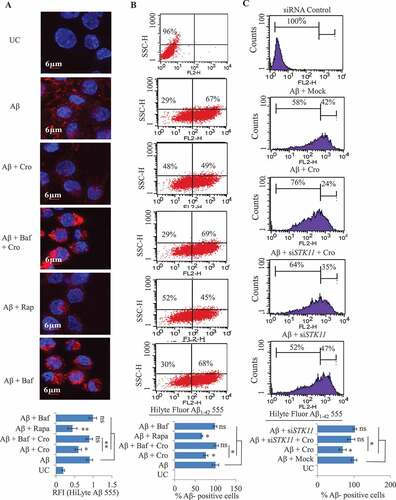
Since crocetin induced autophagy through the STK11 pathway, we further tested the specific contribution of STK11 to Aβ clearance. STK11 knockdown N9 cells, by siStk11, were treated with Aβ42-hilyte Fluor 555 and crocetin, and the extent of accumulation of Aβ42 was determined. The flow cytometry analysis revealed that N9 control cells treated with Aβ42-hilyte Fluor 555 alone showed 42% cells positive for Aβ42-hilyte Fluor 555 fluorescence, which was reduced to 24% when the cells were treated with crocetin. However, crocetin was not able to significantly reduce the number of Aβ42 positive cells in the samples treated with siStk11 (). These data suggest the importance of STK11 in autophagic clearance of Aβ42 by crocetin.
Further, the fusion of autophagosomes with lysosomes is an important step for Aβ clearance. It has been reported that reduced levels or loss of CTSB (cathepsin B)-CTSL, which are regulators of lysosomal function and fusion of autophagosomes with lysosomes, causes lysosomal dysfunction and accumulation of Aβ [Citation32]. To evaluate the effect of crocetin on this process, N9 cells were treated with Aβ42 (10 μM) in presence and absence of crocetin to analyze lysosomal activity using rhodamine 110. Increased rhodamine fluorescence in crocetin-treated cells (with and without Aβ) demonstrated increased activity of CTSB-CTSL (Fig. S5), suggesting increased lysosomal function by crocetin. On the contrary, the lysosomal activity in cells treated with the lysosomal function inhibitor bafilomycin A1 [Citation30], with and without crocetin, was not altered (Fig. S5). Rapamycin as a positive control showed similar results to those observed with crocetin.
Crocetin treatment reduced total Aβ load in 5XFAD mice brains
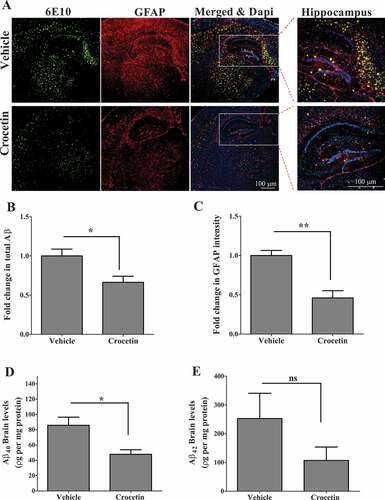
We next tested the effect of crocetin (10 mg/kg) on total Aβ load in the brains of 5XFAD mice (male mice), an AD mouse model. Crocetin dosage regimen (i.e. 10 mg/kg for one month) in 5XFAD was selected based on the results obtained from the in vivo dose-dependent experiments described above from wild-type mice, which demonstrated that at 10 mg/kg, crocetin was able to significantly upregulate the expression of autophagy-related markers including p-PRKAA1, p-STK11, p-ULK1, MTOR, LC3B-II, ATG7, and ATG5, an effect that was greater than the 5 mg/kg dose but similar to those observed with the 20 mg/kg dose. Findings from immunohistochemical analysis of 6E10-detected total Aβ (green) and GFAP (red) demonstrated crocetin significantly reduced total Aβ levels in mice brains (), and the effect was also associated with reduced levels of GFAP (). In addition, ELISA quantification of soluble Aβ40 and Aβ42 in total brain homogenates from 5XFAD mice treated with crocetin confirmed a significant reduction in Aβ40 levels by 45% (P < 0.05); on the other hand, while it didn’t reach significant levels, crocetin reduced Aβ42 level by 57% when compared to vehicle-treated mice ().
Figure 6. Crocetin significantly reduced brain Aβ load in 5XFAD mice treated with 10 mg/kg crocetin for 30 d. (A) Representative brain sections and their quantification analysis showing total Aβ, detected by staining with 6E10 (green) antibody, and GFAP to detect activated astrocytes, detected by GFAP antibody (red), demonstrated significant reduction in (B) brain Aβ levels and (C) GFAP levels; DAPI (blue) to stain nuclei. Closed inserts are showing higher magnification of the hippocampus region. Scale bar: 100 μm. Brain levels of (D) soluble human Aβ40, and (E) soluble human Aβ42 levels as determined by ELISA. Data are presented as mean ± SEM of n = 7 mice in each group. Statistical analysis was determined by Student’s t-test. *P < 0.05, **P < 0.01 versus vehicle-treated group; ns is not significant
Crocetin treatment induced autophagy markers in 5XFAD mice brains
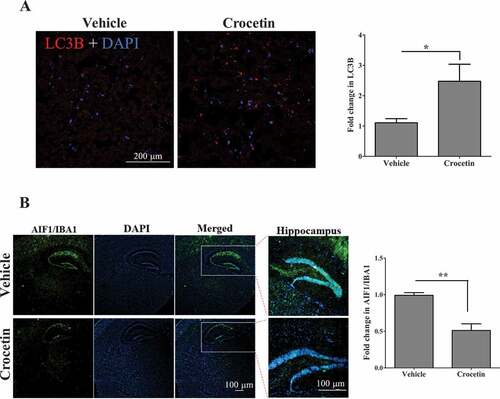
Autophagy markers evaluated in the above in vitro and in vivo wild-type mice studies were analyzed in the brains of 5XFAD mice. Only male mice were used. These autophagy markers affect either the initiation or the maturation of autophagosomes and autophagic flux. As shown in , crocetin treatment significantly induced major autophagosome initiation proteins p-PRKAA1, ULK1, p-STK11, BECN1, ATG7 and ATG5 (). In addition, 30 d of crocetin treatment significantly abrogated p-MTOR expression and increased the expression of RPTOR (regulatory associated protein of MTOR), a part of the MTORC1 complex that binds to MTOR and its downstream signaling proteins EIF4EBP1 (eukaryotic translation initiation factor 4E binding protein 1) and RPS6KB1/p70S6K (ribosomal protein S6 kinase B1) (). Moreover, crocetin treatment significantly induced the expression of TFEB (transcription factor EB) and TSC2 (TSC complex subunit 2) proteins () and reduced SQSTM1, which was associated with significant increase in the level of LC3B-II (). We also assessed the effect of crocetin on the abundance of LC3B presence in mice brains by immunohistochemistry. As shown in , compared to vehicle-treated mice, crocetin significantly enhanced LC3B-II levels in mice brains by about 120%.
Figure 7. Crocetin significantly induced autophagy markers in 5XFAD mice brains treated with 10 mg/kg for 30 d. (A-C) Representative blots and their densitometry analysis showed a significant increase in the expression of ULK1, p-ULK1 (Ser317), p-STK11 (Ser334), p-PRKAA1, LC3B-I/-II, ATG5, ATG7, BECN1, RPTOR, p-RPTOR (Ser792), TSC2 and TFEB; while a significant reduction in SQSTM1and p-MTOR (Ser2448) in brain homogenates of mice treated with crocetin. Data are presented as mean ± SEM of n = 7 mice in each group. Statistical analysis was determined by Student’s t-test. *P < 0.05, **P < 0.01, and ***P < 0.001 versus vehicle group, ns is not significant
Figure 8. Crocetin significantly reduced brain levels of Aβ by inducing autophagy in 5XFAD mice treated with 10 mg/kg for 30 d. (A) Representative images and quantitative analysis from brain sections stained with LC3B antibody (red) demonstrated increased levels of LC3B in 5XFAD mice brains treated with crocetin (10 mg/kg for 30 d) when compared with vehicle-treated mice. Scale bar: 200 μm. Blue staining for DAPI. (B) Representative images and quantitative analysis from brain sections stained with AIF1/IBA1 antibody (green) to detect activated microglia; blue staining for DAPI. Crocetin significantly attenuated brain gliosis in 5XFAD mice brains. Closed inserts are showing higher magnification of the hippocampus region. Scale bar: 100 μm. Data are presented as mean ± SEM of n = 4 mice in each group. Statistical analysis was determined by Student’s t-test. *P < 0.05, **P < 0.01 versus vehicle-treated group
Crocetin treatment attenuated brain gliosis in 5XFAD mice brains
Gliosis is one of the earliest markers of AD characterized by increased levels of GFAP with elongated shape and thick branches, and the microglia marker AIF1/IBA1. In 5XFAD mice brains, increased levels of brain Aβ is associated with neuroinflammation and gliosis. As expected, when tested in the male 5XFAD mice, the reduced levels of Aβ caused by crocetin was associated with a significant reduction in astrogliosis concomitant with ameliorated astrocytes shape and reduced GFAP intensity (), and a significant reduction in microglial marker AIF1 as demonstrated by immunostaining () when compared to the vehicle-treated group.
Crocetin improved learning and memory in 5XFAD mice as determined by Morris water maze
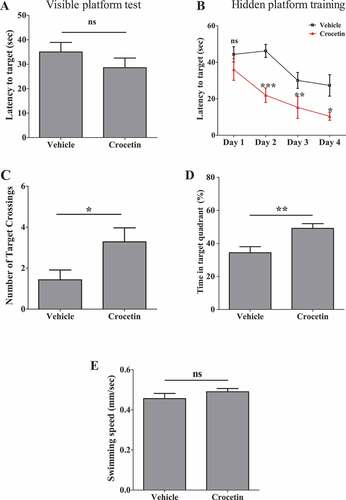
Morris water maze (MWM) test was performed to assess crocetin effect on 5XFAD mice learning and memory on the fifth day of training; only male mice were used. The following parameters were analyzed, number of target crossing, time spent in target quadrant (%), and swimming speed (mm/s). On day one, visible platform test was performed, and as shown in , crocetin- and vehicle-treated 5XFAD mice exhibited a similar latency to escape onto the visible platform. In hidden platform test, crocetin-treated mice showed a significant shorter latency to escape onto the hidden platform on days 2, 3 and 4 as determined by two-way ANOVA analysis (). In the probe trial on the 5th day, crocetin-treated mice traveled into the quadrant where the hidden platform was placed significantly more times than controls (P < 0.05; ). Moreover, the crocetin-treated 5XFAD mice spent more time in the hidden probe quadrant compared to the vehicle-treated 5XFAD mice (P < 0.01; ). There was no difference between the two groups in swimming speed thus excluding motor changes as a cause of the observed improvement (). These results demonstrate crocetin enhanced learning () and memory () when compared to vehicle-treated mice.
Figure 9. Crocetin improved learning and memory in 5XFAD mice treated with crocetin (10 mg/kg) for 30 d as determined by MWM. (A) Latency to target (visible platform test) on day one demonstrating similar latency to escape to the visible platform. (B) Latency to target (hidden platform) on days 2, 3 and 4 of training demonstrated significant reduction in latency to escape onto the hidden platform. (C) Number of target quadrant crossing demonstrated crocetin-treated mice crossed the quadrant of the hidden probe more times than the vehicle-treated group. (D) Time in target quadrant demonstrated crocetin-treated mice spent more time in the quadrant of the hidden probe. (E) The swimming speed was not significantly different between the groups; (n = 7 mice/group). Data are presented as mean ± SEM of n = 7 mice per group. Statistical analysis was determined by Student’s t-test for (A, C-E), and by two-way ANOVA for (B).*P < 0.05, **P < 0.01, ***P < 0.001, ns = not significant versus vehicle group
Discussion
One of the key physiological functions of autophagy is to clear misfolded proteins by degradation [Citation9–12,Citation33], a process that is compromised in AD [Citation13–18]. The significance of autophagy dysfunction in AD pathophysiology is now appreciated due to several lines of evidence reporting dysfunctional autophagy in the AD brain lead to neuronal degeneration [Citation34–36]. In addition, several studies demonstrated autophagy as a key regulator of Aβ generation and clearance [Citation37–39]. For example, in autophagy-deficient AD mice, Nilsson et al, reported a significant reduction in Aβ metabolism associates with increased intraneuronal Aβ accumulation, which further enhances neurodegeneration and memory impairment [Citation37]. As dysfunctional autophagy contributes to AD pathology, few studies have reported the pharmacological induction of autophagy could have the potential to alleviate neuronal degeneration and restore memory function [Citation34–36]. A recent study demonstrated that the induction of autophagy in primary cortical neurons causes an efficient removal of newly formed autophagosomes after fusion with lysosomes [Citation40]. In addition, we recently reported autophagy induction through AKT inhibition enhances Aβ clearance in microglia and primary neuronal cells [Citation41]. Thus, in the current study using cellular and in vivo models, we investigated crocetin as a potential molecule to reduce Aβ and related pathology via autophagy induction. Our findings showed crocetin effectively induced autophagy over a range of concentrations and in a time-dependent manner, which was evident by its ability to induce the expression of LC3B-II and autophagy flux markers in primary mouse neuronal, astrocytes and microglial N9 cells, suggesting crocetin induces autophagy in different brain cells. These results were further confirmed in vivo in wild-type and 5xFAD mice.
One of the major pathways regulating the process of autophagy is the AMPK pathway [Citation42]. AMPK plays a critical role in the process of autophagy by regulating energy metabolism [Citation43]. In addition, studies have revealed that autophagy induction by AMPK has the potential to reduce brain levels of Aβ in AD, SNCA/α-synuclein in Parkinson disease and ameliorates Huntington disease pathology [Citation43–46]. Therefore, small molecules that can induce autophagy by AMPK pathway can offer promising therapies that can halt the succession of neurodegeneration. Intriguingly, crocetin treatment of N9 and primary neuronal cells induced the phosphorylation of AMPK at Thr172 (p-PRKAA1), an effect that was also observed in the brains of 5XFAD-treated mice. Besides, autophagy induction was also evident by inhibition of AMPK downstream target MTOR, increased phosphorylation of ULK1 at Ser317 in a time and dose-dependent manner, and increased expression of autophagy protein markers BECN1, ATG7, ATG5 and ATG12. Our findings suggested the mechanism by which crocetin activated AMPK pathway could be mediated by activating STK11, which further phosphorylates and activates AMPK [Citation47].
Following the mechanistic confirmation of autophagy induction in vitro, a pharmacokinetic study was performed to evaluate whether crocetin crosses the BBB, which is necessary to exhibit its effect in the brain. While a previous study used an in vitro cell-based BBB model to demonstrate crocetin crosses the in vitro model [Citation22], here, we are confirming that crocetin reaches the brain and crosses the BBB in vivo with Kp value of 0.35, suggesting sufficient access to the brain.
When tested in wild-type mice, 30 d treatment with crocetin at three different doses (5, 10 and 20 mg/kg), results revealed crocetin was able to activate AMPK pathway and autophagic proteins in mice brains, which is consistent with the in vitro findings. In these experiments, metformin was used as a positive control based on its reported role in induction of autophagy through AMPK pathway and its neuroprotective role [Citation20,Citation21,Citation48,Citation49]. Compared to metformin at 100 mg/kg dose, crocetin at lower doses (5–20 mg/kg) demonstrated greater and/or equivalent effects to metformin, suggesting crocetin greater potency to induce autophagy.
Next, we evaluated the effect of autophagy induction by crocetin on fluorescence tagged Aβ42 clearance in microglial N9 cells. As expected, the significant increase in the expression of the autophagic markers was associated with increased Aβ42 clearance. These results were further supported by ELISA and flow cytometry, where levels of Aβ42 were significantly reduced in crocetin treated cells similar to rapamycin effect. Bafilomycin A1, as an inhibitor of autophagy, reversed crocetin-induced clearance of Aβ42, which collectively supports crocetin’s role as autophagy inducer. Furthermore, autophagic degradation of Aβ42 was associated with enhanced activity of the lysosomal cysteine proteases CTSB-CTSL as evident by increase in the rhodamine 110 fluorescence, supporting induced autophagy by crocetin. Once the effect of crocetin on clearance of Aβ by autophagy was confirmed, mechanistic studies were performed to explain crocetin-induced autophagy effect. The knockdown of Stk11 by siRNA in N9 cells demonstrated a significant accumulation of Aβ42, an effect that was not reversed by crocetin, suggesting STK11, which activates AMPK pathway, is the target of crocetin.
When tested in vivo using a mouse model of AD, namely 5XFAD, compared to vehicle-treated mice, crocetin significantly reduced brain Aβ load as demonstrated by ELISA and immunostaining that was associated with asignificant reduction in gliosis. A recent study examined postmortem brains of AD patients suggested a link between autophagy and Aβ aggregation [Citation50]. The autophagy markers SQSTM1 and LC3B were abnormally accumulated and co-localized with Aβ deposits and hyper-phosphorylated MAPT/tau in the brains of AD patients [Citation50]. Autophagy induction, thus, has been proposed as a strategy to rectify the pathology of numerous diseases by promoting clearance of aggregated and hyper-phosphorylated proteins in the cytoplasm [Citation51]. Findings from immunostaining analysis demonstrated significantly lower Aβ levels in the brains of 5XFAD mice in crocetin compared to vehicle-treated mice. This significant reduction in Aβ load could be explained by autophagy induction through activation of STK11-mediated AMPK pathway and inhibition of MTOR pathway as observed from the in vitro studies. Furthermore, the collective effect of crocetin as a consequence of autophagy induction that reduced Aβ levels and related pathology was associated with improved memory function as demonstrated by Morris water maze test.
However, our study has the limitation of testing crocetin only in male wild-type and 5xFAD mice. While it is yet to be explained, several studies demonstrated female sex as a risk factor for AD influenced by female-specific factors such as pregnancy and incidence of some diseases like diabetes that is higher in females than males [Citation52–54]. In addition, it has been shown that females who are carriers of APOE/apolipoprotein E4 demonstrate a higher risk of progressing to AD than males [Citation55]. Moreover, available studies have reported that autophagy is affected by sex and demonstrated that females develop AD greater than males as females have lower basal autophagy [Citation56], which could affect the degree of induction by a potential therapeutic intervention. Thus, for the effect of crocetin, comparison studies by testing female mice besides male mice is necessary to assess sex effect, as a biological factor, and whether the observed effect of crocetin in female mice is comparable, or not, to male mice, which indeed requires further evaluation. Yet, at least in male mice, our findings demonstrated a positive effect against Aβ and related pathology by targeting autophagy.
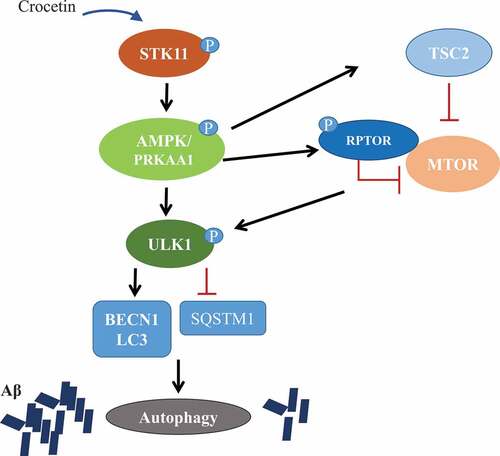
In conclusion, our data suggest that crocetin has the ability to clear Aβ through the induction of autophagy in vitro in different types of brain cells and in wild-type mice brains. These results were further confirmed in 5XFAD mouse as a model of AD. Our findings have established the mechanism of autophagy induced by crocetin is mediated by STK11-AMPK activation pathway (). In conclusion, our findings support further exploration of crocetin for its development as a potential drug candidate for AD prevention and/or treatment.
Figure 10. Crocetin induces autophagy through STK11-AMPK activation pathway and inhibition of the MTOR pathway
Material and methods
Reagents
Dulbecco’s minimal essential medium (DMEM; D1152), Minimum Essential Medium Eagle (MEM; M0894), Ham’s Nutrient Mixture F12 medium (N3520), RPMI-1640 (R6504), penicillin G sodium salt (P3032), streptomycin (S6501), antibiotic-antimycotic solution (A5955), non-essential amino acids (M7145), sodium bicarbonate (S5761), sodium pyruvate (P2256), 4, 6-diamidino-2-phenylindole (DAPI; D9542), DMSO (D2650), papain (76,220), bafilomycin A1 (B1793), rapamycin (R8781), Aβ42 peptide (A9810), bovine serum albumin (BSA; A2153), Triton X-100 (T8787), and rhodamine 110 (432,202) were purchased from Sigma. siRNA to Stk11/Lkb1 and scramble siRNA were purchased from Santa Cruz Biotechnology (SC-35,817 and Sc-37,007). MTT assay kit was purchased from Alpha Aesar (L11939). Neurobasal medium (21,103,049), Hibernate-E medium (A12476), OPTI-MEM medium (11,058–021), and fetal bovine serum (FBS; 10,270) were purchased from Gibco Thermo Fisher Scientific. Aβ42-hilyte Fluor 555 (60,480) was purchased from Anaspec Inc. Protein molecular weight marker (161–0375) and protein assay dye (161–0737) were purchased from Bio-Rad Laboratories. Human Aβ ELISA kit (KHB3482) was purchased from Thermo Fisher Scientific. PVDF membrane (SEQ00010) and Immobilon Western Chemiluminescent HRP substrate (WBKLS0500) were purchased from Merck Millipore. All antibodies used in this work are listed in . Crocetin was synthesized in the laboratory from commercially purchased crocin (Sigma, Cat no. 17,304) using alkaline hydrolysis method, as described earlier [Citation57]. The HPLC purity of crocetin was >95% with the trans: cis ratio of 98: 2.
Table 1. List of antibodies used in the study
Cell culture
The N9 microglial cell line was a kind of gift from Dr. Anirban Basu (National Brain Research Center, Gurgaon, India), and the cells were cultured in RPMI-1640 media supplemented with NaHCO3 (3.7 g/L) 10% FBS, streptomycin (100 mg/L), pencillin G (70 mg/L) in a humid atmosphere of 5% CO2 and 95% air at 37°C.
Primary neuronal and astrocyte culture
For primary neuronal culture, primary E18 mouse cortical neurons were isolated from C57BL/6 mouse and cultured in poly-L-lysine-coated 60-mm dishes containing neurobasal medium supplemented with 2% B27 (Gibco, 17,504,044), 1% penicillin-streptomycin and 2 mM GlutaMax (Gibco, 35,050,061) for 15 d at 37°C in a 5% CO2 incubator. For primary astrocyte culture, the cortical hemisphere region of 4- to 5-d-old pups of C57BL/6 mice was isolated and digested in HBSS containing 2.5% trypsin. After repeated shaking and centrifugation, the cells were cultured in DMEM-high glucose media. During culture, media was replaced every 2 d. After 6–7 d of culture, the microglial layer was separated from underlying astrocytic layer by shaking. Oligodendrocytes were removed after vigorous shaking (240 rpm) for 6 h. The astrocytes were trypsinized and cultured again for further experiments. The primary astrocyte culture was maintained at 37°C in an incubator with 5% CO2 and 95% humid air. All animal procedures were approved by Institutional Animals Ethics Committee IAEC, Indian Institute of Integrative Medicine, Jammu, India. All pups used in this study to prepare primary cells were not genotyped for sex, thus female and male pups were included in the prepared cultures.
Cell viability and toxicity assays
To assess the cytotoxicity of crocetin, two different methods including MTT and SRB assays were used. For MTT assay, N9 cells (3 × 10³ cells) in a 96-well plate and primary neuronal cells (8 × 10³) in a poly-L-lysine-coated 96-well plate were seeded. Cells were treated with crocetin (25 µM) for 6, 12, 24, 48 and 96 h. MTT dye at a concentration of 2.5 mg/ml was added into each well for 4 h at 37°C before the termination of experiment. Formazan crystals were dissolved in 150 µl of DMSO before taking the OD at 570 nm. SRB assay was performed as previously described [Citation41]. Briefly, primary neuronal cells were grown on a poly-L-lysine-coated 96 well plates and were then treated with crocetin (25 µM) for 6, 12, 24, 48 and 96 h. The cells were fixed with ice-cold trichloroacetic acid for 1 h at 4°C. The samples were washed three times with water and air-dried followed by 30-min incubation with 0.4% SRB dye (HiMedia, TC478) at room temperature. The plates were washed with 1% acetic acid for the removal of unbounded dye and allowed to air dry at room temperature followed by 10 mM Tris buffer, pH 7.4 for solubilizing bound dye. Absorbance was taken at 510 nm. The viability of control cells was taken as 100%.
Transfection of N9 cells with Stk11 siRNA
N9 cells were grown into 6 well plates at a density of 0.7 × 10⁶ per well for flow cytometric analysis, or were seeded in 60-mm dishes for western blot. These cells were transfected with siStk11 using Lipofectamine 3000 (Invitrogen, L3000015) in the ratio (1:200) into OPTI-MEM media. Twenty-four hours later, transfected cells were treated with desired treatments and samples were analyzed by flow cytometer (BD FACSCalibur flow cytometer, BD Bioscience) and western blotting.
Preparation of Aβ42-Hilyte Fluor 555
HiLyte FluorTM 555-labeled Aβ42 peptide was prepared according to the manufacturer’s protocol. To prepare the soluble form of Aβ42, a stock solution of 2 mg/ml Aβ42 was prepared by dissolving the peptide in 1% ammonium hydroxide that was further diluted in 1:1 ratio (v:v) with phosphate-buffered saline (PBS; Sigma Aldrich, D5652) to obtain a concentration of 1 mg/ml stock and stored at −20°C.
Flow cytometry analysis of intracellular Aβ42-Hilyte Fluor 555
Cells were seeded in 6-well plates and treated with a variety of stimuli (crocetin 25 µM, rapamycin at 200 nM and bafilomycin A1 at 20 nM) for 24 h. Aβ42-Hilyte Fluor 555 was added 12 h before termination of the experiment. At the end of the experiment, cells were washed and suspended in PBS for the analysis of intracellular fluorescence of Aβ42-Hilyte Fluor 555 by flow cytometry.
Measurement of intracellular calcium level
N9 cells were seeded into 6 well plates at a density of 0.7 × 10⁶ and were treated with crocetin in a concentration-dependent manner for 24 h. Fluo3-AM (5 μM; Sigma Aldrich, 73,881) was added to each well 30 min before experiment termination at 37°C. Cells were washed three times with calcium- and magnesium-free PBS (Sigma Aldrich, D8537) and acquired on a flow cytometer for the intracellular fluorescence of Fluo3-AM in FL1 channel at BD FACSCalibur flow cytometer.
Confocal microscopy to monitor the effect crocetin on Aβ42-HiLyte Fluor 555 clearance
To analyze the effect of crocetin on Aβ42 clearance, microglia N9 cells were seeded and grown on coverslips for 24 h. After treatment with crocetin, Aβ42-HiLyte Fluor555 (2 μg/ml) was added 12 h before the end of the experiment in the absence or presence of crocetin. Rapamycin at 200 nM and bafilomycin A1 at 20 nM were used as positive and negative controls, respectively.
Enzyme-linked Immunosorbent Assay (ELISA)
N9 cells were seeded into 24-well plates and were treated with crocetin at 25 µM. Cells were treated with Aβ42 for 24 h. Culture media was removed, and cells were lysed and analyzed for intracellular levels of Aβ42 by ELISA in accordance with the manufacturer’s protocol. Rapamycin at 200 nM and bafilomycin A1 at 20 nM were used as positive and negative controls, respectively. Quantification of Aβ was done by standard curve generated using recombinant human Aβ42 provided with the kit.
Measurement of CTSB-CTSL activity
Cells were given desired treatments to prepare sample lysates in M2 buffer (1 mM sodium vanadate [Sigma Aldrich, 450,243], 20 mM glycerol phosphate [Sigma Aldrich, G6501], 2 mM dithiothreitol, 3 mM EDTA, 0.5 mM phenylmethylsulfonyl fluoride [Sigma Aldrich, 11,359,061,001], protease inhibitor cocktail [Sigma Aldrich, P8340], 3 mM EGTA, 0.5% NP-40 [Sigma Aldrich, E3889], 20 mM Tris, pH 7, 250 mM NaCl). The lysates (20 μg) were incubated with rhodamine 110 at a concentration of 50 μM in 100 μl cell-free buffer (220 mM mannitol, 10 mM HEPES-NaOH pH 7.4, 2.5 mM KH2PO4, 2 mM MgCl2, 2 mM NaCl, 0.5 mM EGTA, 1 mM dithiothreitol, 0.1 mM PMSF, 5 mM pyruvate, 68 mM sucrose (Fisher Scientific, BP220-1)) at 37°C for 1 h in a 96-well plate. The fluorescence intensity of rhodamine 110 product was detected by a fluorometer at 498 nm excitation and 521 nm emission. Data are presented as the percentage of fluorescence intensity compared with the control group.
Pharmacokinetics and tissue distribution study of crocetin
Study design: Pharmacokinetic study of crocetin was performed by using male C57BL/6 mice after single-dose oral administration at 20 mg/kg. Animals were fasted for 12 h prior to the day of experiment. Total forty-five animals were divided into nine subgroups containing five mice in each subgroup. Dose formulation was prepared by using 5% DMSO and 95% capryol 90 (v:v; a kind gift from Gattefosse India Pvt. Ltd.). Dose volume was 10 mL/kg. For pharmacokinetic study, blood samples were collected at 0, 0.25, 0.5 1, 2, 4, and 8 h after dose administration from retro orbital plexus followed by separation of plasma. For tissue distribution study, animals were sacrificed using CO2 anesthesia immediately after the blood sample collection to obtain mice brains. Then, brains were rinsed with normal saline, blotted dry, and weighed. After that, brain homogenate (350 mg/mL) was prepared by adding appropriate volume of PBS and homogenizing by tissue homogenizer (Polytron PT 2500E, Kinematica AG).
Sample preparation: Fresh stock solution (1 mg/mL) of crocetin was prepared in DMSO and then, diluted further with acetonitrile to prepare standard solutions, which were spiked into plasma or brain homogenate to prepare matrix match calibration standards. Mouse plasma (100 µL from mice treated with vehicle or crocetin) was processed with 200 µL of acetonitrile and vortex mixed for 2 min followed by centrifugation at 26,000 x g for 10 min at 4°C. Then, supernatants were transferred into vials and injected onto the HPLC system to determine crocetin levels. For tissue sample, 500 µL of brain homogenate was processed as mentioned above for plasma sample.
Chromatographic conditions: Quantification of crocetin was carried out using HPLC system (Ultimate 3000, Thermo Fisher Scientific). Chromatographic separation was achieved by Lichrospher RP-18 column (250 × 4.6 mm, 5 µm) using mixture of methanol, water and acetonitrile (85:14.5:0.5, v:v:v) as the mobile phase, which was delivered at 0.8 mL/min. Column was maintained at 30°C. UV detector was set at 400 nm. Processed sample (90 μL) was injected onto the HPLC system. Retention time of crocetin was obtained at 6.8 with run time of 10 min.
Data analysis: Concentrations of crocetin in plasma and brain samples at different time points were obtained and further used to calculate the following pharmacokinetic parameters: maximum plasma concentration (Cmax), time to reach maximum plasma concentration (Tmax), elimination half-life (T1/2), area under the curve for plasma concentration from zero to the last measurable plasma sample time (AUC0-t) and to infinity (AUC0-∞) by noncompartmental model using PK solution software.
In vivo studies for effect of crocetin on autophagy in wild-type and AD mice models
All experimental procedures used with C57BL/6 mice (males, 6–8 weeks old) were conducted in compliance with Institutional Animals Ethics Committee (IAEC), CSIR-Indian Institute of Integrative Medicine, Jammu, India. All experiments and procedures used with the 5XFAD mice (males, 4 months old) were approved by The Institutional Animal Care and Use Committee of Auburn University and according to the National Institutes of Health guidelines Principles of laboratory animal care. All mice were maintained under standard conditions with 12-h light/dark intervals, 60% humidity and 22°C temperature. Mice were fed standard dry chow pellets (Ashirwad Industries, 23,099,010) and water. After seven days of acclimatization, C57BL/6 mice were randomly distributed for vehicle control group and drug treatment groups. For treatment groups, mice were administered crocetin at 3 different doses for 30 d by oral gavage. Mice were randomly segregated into the following groups: vehicle control received 95% Capryol-90 and 5% DMSO (n = 6 mice), crocetin dissolved in vehicle (5 mg/kg, n = 6 mice, 10 mg/kg, n = 6 mice, 20 mg/kg, n = 6 mice), and metformin (used as standard) dissolved in vehicle (50 mg/kg, n = 6 mice). For experiments with the AD mouse model 5XFAD, at 4 months of age, mice received the treatments for one month and then euthanized for brain collection at the age of 5 months. 5XFAD is a well-known transgenic mouse model for AD with five mutations including APPKM670/671NL (Swedish), APPI716V (Florida), APPV717I (London), PSEN1M146L, and PSEN1L286V. These mutations cause the aggressive accumulation of Aβ leading to plaque deposition associated with astrogliosis, synapse and neuronal loss, and deficits in spatial learning [Citation58]. Mice were divided into 2 groups, vehicle control (95% Caproyl-90 with 5% DMSO, v/v) group and crocetin treatment (10 mg/kg) group (n = 7 mice/group) for 30 d. During the treatment period, 5XFAD mice body weights were monitored every week; the average mouse weight was 28 ± 3 g and 27 ± 2 for the control and crocetin treated groups, respectively, at the end of treatment. Health status and normal behavior were checked daily, with no observed side effects. At the end of treatment period, mice were anesthetized with xylazine and ketamine mixture (i.p., 20 and 125 mg/kg, respectively) followed by decapitation. From C57BL/6 mice brains, the hippocampus region was immediately isolated and homogenized with RIPA buffer (Thermo Fisher Scientific, PI89900) containing protease inhibitor cocktail and stored at −80°C until analysis by western blot. For 5XFAD mice, brains were collected and stored at −80°C until analysis by immunostaining, western blot, and other biochemical analyses.
Western blotting analysis
For the in vitro studies, cells (Microglia N9 and primary neuronal cells) were seeded, separately, in 60-mm dishes and treated with vehicle or crocetin. Cells were lysed with RIPA buffer containing 1% protease inhibitor cocktail. Lysed samples were centrifuged at 12,000 g for 10 min at 4°C. Supernatants were collected and protein estimation was done by Bradford method as per manufacturer protocol. For western blot, proteins (60 μg of cell lysates or 25 μg of brain homogenate lysates) were loaded and resolved using 10% SDS-polyacrylamide gel at 200 V for 1 h and transferred electrophoretically to PVDF membrane (Millipore) at 300 mA for 1.5 h at 4°C. The membrane containing proteins was subjected to blocking with 5% milk (Fisher Scientific, NC9730946) for 1 h at room temperature. Membranes were then incubated with primary antibodies for overnight at 4°C. Primary and secondary antibodies used are listed in . Protein blots were developed using a chemiluminescence detection kit (SuperSignal West Femto substrate; Thermo Fisher Scientific, PI34096). Bands were visualized using ChemiDoc™ MP Imaging System (Bio-Rad Hercules, CA, USA) and quantified by densitometric analysis using Image Lab™ Software V.6.0 (Bio-Rad).
Immunohistochemical analysis of 5XFAD mice brains
Brain sections of 18-μm-thickness were prepared using Thermo Scientific™ HM525 NX Cryostat (Waltham, MA, USA). Sections were fixed by incubation in methanol for 10 min at −20°C, followed by washing in PBS (5 times) and blocking with PBS containing 10% donkey serum (Sigma Aldrich, D9663) for 1 h at room temperature. Immunostaining was performed for brain hippocampi and cortices of 5XFAD mice. For total Aβ detection, 5XFAD brain sections were immunostained with Alexa Fluor 488-labeled 6E10 human-specific anti-Aβ antibody at 1:200 dilution. For reactive astrocytes, 5XFAD sections were probed with rabbit anti-GFAP polyclonal IgG at 1:100 dilution followed by anti-rabbit IgG-CFL594 secondary antibody. For reactive microglia, 5XFAD sections were probed with goat anti-AIF1/IBA1 polyclonal IgG at 1:100 dilution followed by anti-goat IgG-CFL488 secondary antibody for each treatment (). Image acquisition was performed in 4 tissue sections spanning the hippocampus, each separated by 150 μm (total of 40 sections per mouse). Total Aβ load, GFAP and AIF1 were captured and quantified at a total magnification of 4X. Hippocampi magnified images were captured at a total magnification of 20X. All images were visualized using Nikon Eclipse TiS inverted fluorescence microscope (Melville, NY).
In addition, changes in LC3B levels were monitored by immunostaining. Brain sections from 5XFAD mice were fixed in 4% paraformaldehyde, blocked and permeabilized with a solution containing 1% goat serum and 0.25% Triton X-100. Brain sections were then immunostained with LC3B rabbit monoclonal primary antibody. Incubation with the antibody was performed in a solution containing 1% goat serum and 0.25% Tween 20 (Acros Organics, AC23336) overnight at 4°C. Secondary antibody conjugated with Alexa Fluor 594 (Invitrogen) was used. Tissue slides were washed three times for 15 min, after both primary antibody and secondary antibody incubation steps. Nuclei were counterstained with DAPI (Invitrogen, NBP2311561). The cells were finally rinsed briefly with PBS, and the coverslips were mounted on glass slides containing tissue sections with fluorescent antifade mounting reagent (Vector Laboratories, H-1000). Images of immunostained tissue sections were acquired with a Nikon TiE inverted fluorescence microscope and images were captured with Nikon elements software. Quantification of fluorescence intensity was performed using ImageJ® version 1.6.0 software (Research Services Branch, National Institute of Mental Health/National Institutes of Health, Bethesda, MD) after adjusting for threshold.
Human Aβ40 and Aβ42 determination in 5XFAD mice brains by ELISA
To quantitatively extract soluble Aβ from 5XFAD mice brain, 150 mg of brain tissue was polytron homogenized in diethylamine (DEA; Alfa Aesar, A11716-AE) buffer (50 mM NaCl, 0.2% DEA), with complete mammalian protease inhibitor (Sigma-Aldrich, P8340) and centrifuged at 21,000 g for 45 min at 4°C. Supernatants were collected and analyzed for Aβ40 and Aβ42 brain levels using commercially available ELISA kits (Fisher Scientific, KHB3481 and KHB3441, respectively) according to the manufacturer’s instructions. All samples were run at least in triplicates and corrected to the total protein amount in each sample using BCA assay.
Behavioral testing by Morris water maze test in 5XFAD mice
MWM test was performed for 5XFAD mice to assess learning and memory performance at the end of the treatment as reported previously [Citation59,Citation60]. All mice underwent reference memory training 4 times a day at 20-min intervals for 4 consecutive days. Twenty-four hours after the final trial (i.e. on day 5), the mice underwent the memory probe test to assess memory retention to find the hidden platform. An overhead camera connected to a computerized tracking system (SMART 3.0 Platform, Panlab Harvard apparatus [Holliston, MA, USA]) was used to record the movements of the mice. The results including latency, time spent in target quadrant and number of crossings were collected and used for statistical analysis.
Statistical analysis
Data from in-vitro experiments shown here are presented as mean±SD of three independent experiments. Statistical analysis was done by Instat-3 software and Bonferroni method was used to calculate statistical significance with ***P < 0.001, **P < 0.01, *P < 0.05. For all in-vivo experiments, data shown are mean±SEM for n = 5–7 mice/group. The experimental results were statistically analyzed for significant differences using Student’s t-test for two groups. Data analyses were performed using GraphPad Prism, version 6.0. In the figures, the fold-change for control groups was calculated by dividing each control value on the average of all control mice values for a specific protein. Treatment values were then normalized to control (1.0).
Availability of data
The data that support the findings of this study are available from the corresponding authors [A. Kaddoumi and A. Kumar] upon reasonable request.
Supplemental Material
Download MS Word (1.1 MB)Acknowledgments
This research work was funded by the National Institute of Neurological Disorders and Stroke (NIH/NINDS) under grant number R15NS091934 (Amal Kaddoumi), and by CSIR-Indian Institute of Integrative Medicine through the Project BSC-0205 and Major Lab Project (MLP-6002; Ajay Kumar). Acknowledgements are also due to CSIR for the Senior Research Fellowship grant to Abubakar Wani. This MS has been provided the institutional publication no. as CSIR-IIIM/IPR/00135.
Disclosure statement
The authors declare no conflict of interest.
Supplementary material
Supplemental data for this article can be accessed here.
Additional information
Funding
References
- Mattson MP. Pathways towards and away from Alzheimer’s disease. Nature. 2004;430:631–639.
- Albert MS. Memory decline: the boundary between aging and age-related disease. Ann Neurol. 2002;51:282–284.
- Querfurth HW, LaFerla FM. Alzheimer’s disease. N Engl J Med. 2010;362:329–344.
- Hardy J, Selkoe DJ. The amyloid hypothesis of Alzheimer’s disease: progress and problems on the road to therapeutics. Science. 2002;297:353–356.
- Mawuenyega KG, Sigurdson W, Ovod V, et al. Decreased clearance of CNS beta-amyloid in Alzheimer’s disease. Science. 2010;330:1774.
- Tarasoff-Conway JM, Carare RO, Osorio RS, et al. Clearance systems in the brain-implications for Alzheimer disease. Nat Rev Neurol. 2015;11:457–470.
- Caccamo A, Majumder S, Richardson A, et al. Molecular interplay between mammalian target of rapamycin (mTOR), amyloid-beta, and Tau: effects on cognitive impairments. J Biol Chem. 2010;285:13107–13120.
- Majumder S, Richardson A, Strong R, et al. Inducing autophagy by rapamycin before, but not after, the formation of plaques and tangles ameliorates cognitive deficits. PLoS One. 2011;6:e25416.
- Seglen PO, Bohley P. Autophagy and other vacuolar protein degradation mechanisms. Experientia. 1992;48:158–172.
- Kim J, Klionsky DJ. Autophagy, cytoplasm-to-vacuole targeting pathway, and pexophagy in yeast and mammalian cells. Annu Rev Biochem. 2000;69:303–342.
- Mizushima N, Komatsu M. Autophagy: renovation of cells and tissues. Cell. 2011;147:728–741.
- Harris H, Rubinsztein DC. Control of autophagy as a therapy for neurodegenerative disease. Nat Rev Neurol. 2011;8:108–117.
- Kepchia D, Huang L, Dargusch R, et al. Diverse proteins aggregate in mild cognitive impairment and Alzheimer’s disease brain. Alzheimers Res Ther. 2020;12:75.
- Simonsen A, Cumming RC, Brech A, et al. Promoting basal levels of autophagy in the nervous system enhances longevity and oxidant resistance in adult drosophila. Autophagy. 2008;4:176–184.
- David DC, Ollikainen N, Trinidad JC, et al. Widespread protein aggregation as an inherent part of aging in C. elegans. PLoS Biol. 2010;8(8):e1000450.
- Yu WH, Cuervo AM, Kumar A, et al. Macroautophagy–a novel Beta-amyloid peptide-generating pathway activated in Alzheimer’s disease. J Cell Biol. 2005;171:87–98.
- Nixon RA. Autophagy, amyloidogenesis and Alzheimer disease. J Cell Sci. 2007;120:4081–4091.
- Pickford F, Masliah E, Britschgi M, et al. The autophagy-related protein beclin 1 shows reduced expression in early Alzheimer disease and regulates amyloid beta accumulation in mice. J Clin Invest. 2008;118:2190–2199.
- Manczak M, Kandimalla R, Yin X, et al. Hippocampal mutant APP and amyloid beta-induced cognitive decline, dendritic spine loss, defective autophagy, mitophagy and mitochondrial abnormalities in a mouse model of Alzheimer’s disease. Hum Mol Genet. 2018;27:1332–1342.
- Abdelaziz DH, Thapa S, Abdulrahman B, et al. Metformin reduces prion infection in neuronal cells by enhancing autophagy. 2020;523:423–428.
- Howell JJ, Hellberg K, Turner M; Howell JJ, Hellberg K, Turner M, Talbott G, Kolar MJ, Ross DS, Hoxhaj G, Saghatelian A, Shaw RJ, Manning BD. Metformin inhibits hepatic mTORC1 signaling via dose-dependent mechanisms involving AMPK and the TSC complex. Cell Metabol. 2017;25:463–471.
- Lautenschlager M, Sendker J, Huwel S, et al. Intestinal formation of trans-crocetin from saffron extract (Crocus sativus L.) and in vitro permeation through intestinal and blood brain barrier. Phytomedicine. 2015;22:36–44.
- Yoshino F, Yoshida A, Umigai N, et al. Crocetin reduces the oxidative stress induced reactive oxygen species in the stroke-prone spontaneously hypertensive rats (SHRSPs) brain. J Clin Biochem Nutr. 2011;49:182–187.
- Wang X, Jiao X, Liu Z, et al. Crocetin potentiates neurite growth in hippocampal neurons and facilitates functional recovery in rats with spinal cord injury. Neurosci Bull. 2017;33:695–702.
- Berger F, Hensel A, Nieber K. Saffron extract and trans-crocetin inhibit glutamatergic synaptic transmission in rat cortical brain slices. Neuroscience. 2011;180:238–247.
- Chalatsa I, Arvanitis DA, Koulakiotis NS, et al. The Crocus sativus compounds trans-crocin 4 and trans-crocetin modulate the amyloidogenic pathway and tau misprocessing in Alzheimer disease neuronal cell culture models. Front Neurosci. 2019;13:249.
- Tiribuzi R, Crispoltoni L, Chiurchiù V, et al. Trans-crocetin improves amyloid-beta degradation in monocytes from Alzheimer’s Disease patients. J Neurol Sci. 2017;372:408–412.
- Zhang J, Wang Y, Dong X, et al. Crocetin attenuates inflammation and amyloid-beta accumulation in APPsw transgenic mice. Immun Ageing. 2018;15:24.
- Batarseh YS, Bharate SS, Kumar V, et al. Crocus sativus extract tightens the blood-brain barrier, reduces amyloid beta load and related toxicity in 5XFAD Mice. ACS Chem Neurosci. 2017;8:1756–1766.
- Yamamoto A, Tagawa Y, Yoshimori T, et al. Bafilomycin A1 prevents maturation of autophagic vacuoles by inhibiting fusion between autophagosomes and lysosomes in rat hepatoma cell line, H-4-II-E cells. Cell Struct Funct. 1998;23:33–42.
- Lanevskij K, Japertas P, Didziapetris R. Improving the prediction of drug disposition in the brain. Expert Opin Drug Metab Toxicol. 2013;9:473–486.
- Cermak S, Kosicek M, Mladenovic-Djordjevic A, et al. Loss of cathepsin B and L leads to lysosomal dysfunction, NPC-like cholesterol sequestration and accumulation of the key Alzheimer’s proteins. PLoS One. 2016;11:e0167428.
- Nilsson P, Loganathan K, Sekiguchi M, et al. Aβ Secretion and Plaque Formation Depend on Autophagy. Cell Rep. 2013;5:61–69.
- Thellung S, Scoti B, Corsaro A, et al. Pharmacological activation of autophagy favors the clearing of intracellular aggregates of misfolded prion protein peptide to prevent neuronal death. Cell Death Dis. 2018;9:166.
- Kovacs T, Billes V**, Komlós M, et al. The small molecule AUTEN-99 (autophagy enhancer-99) prevents the progression of neurodegenerative symptoms. Sci Rep. 2017;7:42014.
- Tsvetkov AS, Miller J, Arrasate M, et al. A small-molecule scaffold induces autophagy in primary neurons and protects against toxicity in a Huntington disease model. Proc Natl Acad Sci USA. 2010;107:16982–16987.
- Nilsson P, Saido TC. Dual roles for autophagy: degradation and secretion of Alzheimer’s disease Aβ peptide. BioEssays. 2014;36:570–578.
- Uddin MS, Stachowiak A, Mamun AA, et al. Autophagy and Alzheimer’s disease: from molecular mechanisms to therapeutic implications. Front Aging Neurosci. 2018;10:1–18.
- Li L, Zhang X, Le W. Autophagy dysfunction in Alzheimer’s disease. Neurodegener Dis. 2010;7:265–271.
- Boland B, Kumar A, Lee S, et al. Autophagy induction and autophagosome clearance in neurons: relationship to autophagic pathology in Alzheimer’s disease. J Neurosci. 2008;28:6926–6937.
- Wani A, Gupta M, Ahmad M, et al. Alborixin clears amyloid-β by inducing autophagy through PTEN-mediated inhibition of the AKT pathway. Autophagy. 2019;15:1810–1828.
- Kim J, Kundu M, Viollet B, et al. AMPK and mTOR regulate autophagy through direct phosphorylation of Ulk1. Nat Cell Biol. 2011;13:132–141.
- Vingtdeux V, Chandakkar P, Zhao H, et al. Novel synthetic small-molecule activators of AMPK as enhancers of autophagy and amyloid-beta peptide degradation. Faseb J. 2011;25:219–231.
- Wu Y, Li X, Zhu JX, et al. Resveratrol-activated AMPK/SIRT1/autophagy in cellular models of Parkinson’s disease. Neurosignals. 2011;19:163–174.
- Park SY, Lee HR, Lee WS, et al. Cilostazol modulates autophagic degradation of beta-amyloid peptide via SIRT1-Coupled LKB1/AMPKalpha signaling in neuronal cells. PLoS One. 2016;11:e0160620.
- Walter C, Clemens LE, Muller AJ, et al. Activation of AMPK-induced autophagy ameliorates Huntington disease pathology in vitro. Neuropharmacology. 2016;108:24–38.
- Long YC, Zierath JR. AMP-activated protein kinase signaling in metabolic regulation. J Clin Invest. 2006;116:1776–1783.
- Jiang T, Yu JT, Zhu XC, et al. Acute metformin preconditioning confers neuroprotection against focal cerebral ischaemia by pre-activation of AMPK-dependent autophagy. Br J Pharmacol. 2014;171:3146–3157.
- Stephenne X, Foretz M, Taleux N, et al. Metformin activates AMP-activated protein kinase in primary human hepatocytes by decreasing cellular energy status. Diabetologia. 2011;54:3101–3110.
- Ahmed ME, Iyer S, Thangavel R, et al. Co-localization of glia maturation factor with NLRP3 inflammasome and autophagosome markers in human Alzheimer’s disease brain. J Alzheimer’s Dis. 2017;60:1143–1160.
- Alvarez-Arellano L, Pedraza-Escalona M, Blanco-Ayala T, et al. Autophagy impairment by caspase-1-dependent inflammation mediates memory loss in response to beta-Amyloid peptide accumulation. J Neurosci Res. 2018;96:234–246.
- Rahman A, Schelbaum E, Hoffman K, et al. Sex-driven modifiers of Alzheimer risk: A multimodality brain imaging study. Neurology. 2020;95:e166–e178.
- Colucci M, Cammarata S, Assini A, et al. The number of pregnancies is a risk factor for Alzheimer’s disease. Eur J Neurol. 2006;13:1374–1377.
- Kim SE, Lee JS, Woo S, et al. Sex-specific relationship of cardiometabolic syndrome with lower cortical thickness. Neurology. 2019;93:e1045–e1057.
- Arnold M, Nho K, Kueider-Paisley A, et al. Sex and APOEε4 genotype modify the Alzheimer’s disease serum metabolome. Nat Commun. 2020;11;229:148.
- Congdon EE. Sex differences in autophagy contribute to female vulnerability in Alzheimer’s disease. Front Neurosci. 2018;12:372.
- Reddy CN, Bharate SB, Vishwakarma RA, et al. Chemical analysis of saffron by HPLC based crocetin estimation. J Pharm Biomed Anal. 2020;181:113094.
- Oakley H, Cole SL, Logan S, et al. Intraneuronal beta-amyloid aggregates, neurodegeneration, and neuron loss in transgenic mice with five familial Alzheimer’s disease mutations: potential factors in amyloid plaque formation. J Neurosci. 2006;26:10129–10140.
- Wang C, Zhao CC, Jiang G, et al. The role of posttraumatic hypothermia in preventing dendrite degeneration and spine loss after severe traumatic brain injury. Sci Rep. 2016;6:37063.
- Ding Y, Qiao A, wang Z, et al. Retinoic acid attenuates beta-amyloid deposition and rescues memory deficits in an Alzheimer’s disease transgenic mouse model. J Neurosci. 2008;28:11622–11634.