
 ?Mathematical formulae have been encoded as MathML and are displayed in this HTML version using MathJax in order to improve their display. Uncheck the box to turn MathJax off. This feature requires Javascript. Click on a formula to zoom.
ABSTRACT
Intervertebral disc degeneration (IDD) is the primary pathological mechanism that underlies low back pain. Overloading-induced cell death, especially endogenous stem cell death, is the leading factor that undermines intrinsic repair and aggravates IDD. Previous research has separately studied the effect of oxygen concentration and mechanical loading in IDD. However, how these two factors synergistically influence endogenous repair remains unclear. Therefore, we established in vitro and in vivo models to study the mechanisms by which hypoxia interacted with overloading-induced cell death of the nucleus pulposus derived stem cells (NPSCs). We found the content of HIF1A (hypoxia inducible factor 1 subunit alpha) and the number of NPSCs decreased with disc degeneration in both rats and human discs. Hence, we isolated this subpopulation from rat discs and treated them simultaneously with hypoxia and excessive mechanical stress. Our results demonstrated that hypoxia exerted protective effect on NPSCs under compression, partially through elevating macroautophagy/autophagy. Proteomics and knockdown experiments further revealed HIF1A-BNIP3-ATG7 axis mediated the increase in autophagy flux, in which HMOX1 and SLC2A1 were also involved. Moreover, HIF1A-overexpressing NPSCs exhibited stronger resistance to over-loading induced apoptosis in vitro. They also showed higher survival rates, along with elevated autophagy after being intra-disc transplanted into over-loaded discs. Jointly, both in vivo and in vitro experiments proved the anti-apoptotic effect of HIF1A on NPSCs under the excessive mechanical loading, suggesting that restoring hypoxia and manipulating autophagy is crucial to maintain the intrinsic repair and to retard disc degeneration.
Abbreviations: 3-MA: 3-methyladenine; ACAN: aggrecan; ATG7: autophagy related 7; BafA1: bafilomycin A1; BAX: BCL2 associated X, apoptosis regulator; BECN1: beclin 1; BNIP3: BCL2 interacting protein 3; BNIP3L: BCL2 interacting protein 3 like; CASP3: caspase 3; CCK8: cell counting kit-8; CHT: chetomin; CMP: compression; CoCl2: cobalt chloride; COL2A1: collagen type II alpha 1 chain; Ctrl: control; DAPI: 4,6-diamidino-2-phenylindole; DEP: differentially expressed protein; DiR: 1,1-dioctadecyl-3,3,3,3-tetramethyl indotricarbocyanine; ECM: extracellular matrix; FCM: flow cytometry; GD2: disialoganglioside GD 2; GFP: green fluorescent protein; GO: gene ontology; GSEA: gene set enrichment analysis; H&E: hematoxylin-eosin; HIF1A: hypoxia inducible factor 1 subunit alpha; HK2: hexokinase 2; HMOX1: heme oxygenase 1; HX: hypoxia mimicry; IDD: intervertebral disc degeneration; IF: immunofluorescence; IHC: immunohistochemistry; IVD: intervertebral disc; KEGG: kyoto encyclopedia of genes and genomes; LBP: low back pain; Lv: lentivirus; MAP1LC3B/LC3B: microtubule associated protein 1 light chain 3 beta; MMP: mitochondrial membrane potential; NC: negative control; NIR: near-infrared; NP: nucleus pulposus; NPC: nucleus pulposus cell; NPSC: nucleus pulposus derived stem cell; NX: normoxia; PPI: protein-protein interactions; RFP: red fluorescent protein; SLC2A1/GLUT1: solute carrier family 2 member 1; SQSTM1/p62: sequestosome 1; TEK/TIE2: TEK receptor tyrosine kinase; TEM: transmission electron microscopy; TUBB: tubulin beta class I.
Introduction
Despite the improvement in surgery and medicine, low back pain (LBP) remains one of the leading causes of health expenditure and financial burden [Citation1]. Intervertebral disc degeneration (IDD) has been identified as the primary pathological reason of LBP [Citation2] and received mounting attention from regenerative medicine. Correspondingly, stem-cell-based therapies are now shedding light on IDD treatment [Citation3]. Researchers have discovered that intervertebral disc (IVD) contains nucleus pulposus derived stem cell (NPSC), a promising seed cell resource for cellular therapy or tissue engineering in the field of IVD repair and regeneration [Citation4–7]. However, the harsh microenvironment in degenerated discs impairs the restorative function of NPSC and results in cell death [Citation8,Citation9], which consequently causing failure of stem-cell-based IVD regeneration [Citation10].
As the inner part of IVD, the nucleus pulposus (NP) serves to transmit the external force evenly to the annulus fibrosus, thus avoiding the over-load induced local damage [Citation11]. In degenerated discs, however, the excessive loading that initiates IDD continuously undermines the integrity of the nucleus pulposus matrix, increases the local pressure in NP, thus challenging the survival and function of the committed IVD cells, endogenous stem cells, as well as the cells introduced from cellular therapy [Citation12–14]. Our group has recently demonstrated that excessive compression impaired the differentiation potency and cell vitality of human NPSCs [Citation15,Citation16]. However, research about protecting NPSC from overloading-induced cell death remains limited.
Nucleus pulposus is featured by the avascular and hypoxic environment in which the HIF1A (hypoxia inducible factor 1 subunit alpha) plays a significant role by participating in genesis, energy metabolism, and extracellular matrix (ECM) synthesis [Citation17,Citation18]. Besides, HIF1A can activate macroautophagy/autophagy through various pathways [Citation19–22]. These characteristics enable HIF1A to modulate the homeostasis and stemness of multiple endogenous stem cells [Citation23–26]. In late-stage disc degeneration, neovascularization increases the oxygen concentration in IVD [Citation25,Citation27,Citation28] and consequently accelerates the oxygen-dependent degradation of HIF1A [Citation29]. Although hypoxia is regarded as a harmful factor in the in vitro culture of IVD cells [Citation30,Citation31], Nasto LA et al. and Jiang LB et al. demonstrate that hypoxia is beneficial for restricting ROS production [Citation32,Citation33], promoting chondrogenic differentiation, and cartilaginous matrix synthesis [Citation34,Citation35]. Therefore, we hypothesize degradation of HIF1A would further damage the homeostasis of NPSC, but maintaining the hypoxic environment could help IVD cells adapt to the degenerative environment in late-stage IDD. If so, retaining the content of HIF1A in NPSC at a proper level will be an effective strategy for retarding the progression of IDD.
Hence, we investigated the role of HIF1A in the NPSC under excessive mechanical load to clarify whether hypoxia is beneficial or harmful for the stem-cell-based IVD regeneration. More importantly, our group, for the first time, studied overload and hypoxia, the two essential IVD characteristics, synthetically. Furthermore, to evaluate the in vivo effect of HIF1A, we transplanted the HIF1A-overexpressing NPSCs into the overloaded discs and analyzed the cell death of cells inside the degenerated discs. Jointly, our results demonstrated that HIF1A facilitated stem-cell-based disc repair, offering direction to overcome current challenges in the treatment of disc degeneration and low back pain.
Results
The content of HIF1A decreases in degenerated discs
In order to understand the changes of the nucleus pulposus hypoxic environment during disc degeneration, we collected tissue samples from patients who accepted lumbar discectomy surgery because of lumbar disc herniation. The degenerated discs of different degrees demonstrated varied signal intensity in T2 Weight-Images of Magnetic Resonance (). Specifically, NP tissues of late-stage degenerated discs showed atrophic volume and decreased elasticity when compared to those of earlier stages (). In addition, the histological characteristics were evaluated to specify the degeneration degree of each sample [Citation36,Citation37] (). The history of donors and the grading results were shown in Table S1. According to immunohistochemistry (IHC) assay, we found an over 5 times lower level of HIF1A in grade IV NP tissues comparing to grade II, irrelevant with gender or age (33.372 ± 7.647 cells/mm2 in grade II vs. 6.198 ± 2.500 cells/mm2 in grade IV) (). Besides, the percentage of HIF1A-positive cells among total cells was 67.98 ± 5.13% in grade II vs. 10.38 ± 2.98% in grade IV discs (p < 0.001) (). These results suggested cells in the nucleus pulposus were exposed to a disrupted hypoxic environment in late-stage IDD.
Figure 1. Alternations during the disc degeneration in humans and rats. (A) Typical human MR T2-weighted images of grade II (left panel) and grade IV (right panel) IVD. The degenerated discs were indicated by white arrows. Scale bar: 5 cm. (B) General view of nucleus pulposus from donors who accepted nucleus pulposus discectomy surgery; Scale bar: 1 cm. The H&E and Safranin O-Fast Green staining of nucleus pulposus from human degenerated disc were shown on the right. Scale bar: 200 μm. (C) IHC staining of HIF1A in human nucleus pulposus sections. Scale bar: 200 μm. Quantitative analysis of HIF1A was shown as cells/mm2 (left panel) and positive rate (right panel). (D) IF staining of TEK and cleaved-CASP3 in human nucleus pulposus sections, the nucleus was labeled with DAPI, the region of nucleus pulposus was framed by dotted lines, the positive staining cells were indicated by white arrowheads. Scale bar: 200 μm. The positive rate of TEK and cleaved-CASP3 was shown in the statistical chart. (E) IHC staining of HIF1A and COL2A1 (collagen type II alpha 1 chain) in young and aged rat tissue sections. Positively stained cells were in brown. Scale bar: 200 μm. The expression level of COL2A1 was shown as the percentage of positively stained area, while HIF1A was quantified as positive rate (right panel). (F) IF staining of TEK and cleaved-CASP3 in rat tissue sections. Scale bar: 200 μm. The positive rate of TEK and cleaved-CASP3 was shown. Results were shown as mean ± SD. P value was calculated with t-test. *p < 0.05, *p < 0.01, ***p < 0.001
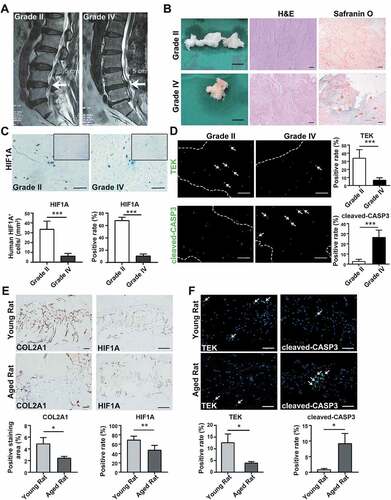
As previously reported [Citation38], the angiopoietin-1 receptor, TEK/TIE2 (TEK receptor tyrosine kinase), is among the biomarkers of nucleus pulposus progenitor cells. Here, less TEK-positive cells were detected in remarkably degenerated NP tissues (33.866 ± 9.584% in grade II vs. 6.566 ± 2.715% in grade IV) (). Meanwhile, the positive rate of cleaved-CASP3 (caspase 3), the crucial executor of apoptosis, in grade IV tissues was 10 times higher than that of grade II tissues (2.586 ± 2.006% in grade II vs. 26.408 ± 6.828% in grade IV) (). Since the apoptosis induced stem-cell death is concomitant with decreased HIF1A, we reason that apoptosis-induced stem-cell death results from the disruption of the hypoxic environment.
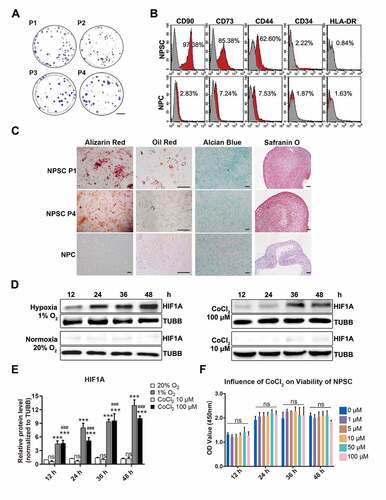
Then, we investigated aging-related alternations in lumbar discs of Sprague-Dawley rats. NP tissues from young rats’ lumbar discs (8- to 12-weeks old, n = 30) as well as aged rats’ lumbar discs (18- to 24-months old, n = 30) were fixed, sliced, and stained. Comparing the IHC results of young and aged rats, we also found disruption of hypoxia in rats’ degenerated discs, which was evidenced by fewer HIF1A staining (). Notably, these aged rats also had increased apoptosis and declined TEK-positive cells, along with disc degeneration (). Given the similarities between degenerated discs of rats and human beings, which were shown in IHC assays, we isolated NPSC from adult rat lumbar disc for further study. Hence, we concurrently excluded problems of gathering cells from heterogenous human samples. After isolation and expansion culture, we identified the characteristics of the isolated cells. These cells demonstrated rapid proliferation (Fig. S1B) and the colony forming units per 100 cells were higher than 90 (1st to 4th passage) (). Moreover, these cells expressed stem cell surface markers () and possessed adipogenic, chondrogenic, and osteogenic differentiation potency (). Therefore, we defined this population as NPSCs. We used the 4th generation of cells for most of the experiments, whose characteristics were consistent during the passage. The comparison of the characteristics of committed nucleus pulposus cells (NPCs) and NPSCs was shown in Fig. S1A.
Figure 2. The characteristics of NPSCs under normoxia, CoCl2 mimicked hypoxia, and environmental hypoxia. (A) Colony formation test of four generations of NPSCs (P1 to P4). Scale bar: 2 cm. (B) Surface markers including CD90, CD73, CD44, CD34, and HLA-DR were detected with flow cytometry. The red curves indicated the percentage of labeled NPSCs and the gray curves represented the blank control. The positive rate of each surface marker was shown as the deviation between red curve and the blank control. (C) The multi-lineage differentiation potency of NPSCs (P1 and P4) and NPCs was assessed. Calcium nodules which were stained in red with Alizarin Red were demonstrated in NPSC after osteogenic induction (1st column). Scale bar: 100 µm. Lipid droplets in NPSC were stained in sepia with Oil Red O after adipogenic induction (2nd column). Scale bar: 200 µm. The monolayer of NPSC after chondrogenic differentiation induction produced glycosaminoglycan, which was stained in blue with Alcian Blue (3rd column). Scale bar: 100 µm. Micro pellets that were formed by 3D cultured NPSCs were cultured with chondrogenic differentiation medium, the section of which was stained with Safranin O (4th column). Scale bar: 50 µm. (D) Western blot analysis of NPSCs under hypoxia (1% O2) or normoxia (20% O2), and 10 μM or 100 μM CoCl2 for 12 h – 48 h. The protein TUBB (tubulin beta class I) was set as the internal reference. The elevation pattern of HIF1A in CoCl2 groups was similar to that of environmental hypoxia. (E) Densitometric analysis of HIF1A under different conditions. Results were shown as mean ± SD. ns, non-significant, p > 0.05; ###, comparing to the CoCl2 10 μM group, p < 0.001; ***, comparing to the 20% O2 group, p < 0.001. (F) The cell viability of NPSCs treated with different concentrations of CoCl2. ns, non-significant
CoCl2 induced cell hypoxia model with NPSC
Cobalt (Co2+) can diminish the activity of HIF specific hydroxylase and inhibits the interaction between HIF alpha subunit and VHL (von Hippel-Lindau tumor suppressor) [Citation39], thus decreasing the degradation of HIF1A to simulate hypoxia. However, high concentrations of cobalt chloride (CoCl2) may induce cytotoxicity and even cell apoptosis [Citation40,Citation41]. To test the cytotoxic effect of CoCl2 and to verify its effectiveness in hypoxia mimicry (HX), the NPSCs were treated with 10 μM or 100 μM CoCl2 in normoxia (NX), compared with those cultured in 1% O2 (the group that imitates oxygen concentration in human nucleus pulposus [Citation42]). The level of HIF1A increased continuously for 48 h in the 1% O2 group, while in the 20% O2 group (NX), it stayed at a relatively lower level. In both 10 μM and 100 μM CoCl2 groups, HIF1A was elevated in a time-dependent manner (, ). Comparing these two models, we found elevation pattern of HIF1A in CoCl2 groups was similar to the effect of environmental hypoxia. Furthermore, one-way ANOVA analysis of cell vitality results showed non-significant difference between 1 μM and 100 μM CoCl2, even though there was a slight decline at 48 h (). The above results indicated that 10 μM to 100 μM CoCl2 was safe and efficacious in hypoxia mimicry for the in vitro study of NPSC.
The anti-apoptosis effect of HIF1A in compression-induced NPSC apoptosis
We cultured NPSCs under 1.0 MPa hydrostatic pressure [Citation43], with or without CoCl2 for two days, during which the cell viability of NPSCs was analyzed with cell counting kit-8 (CCK-8) assays every 12 h. The decline in cell viability amplified with time but was reversed by 50 μM and 100 μM CoCl2 (). Both the Co2+ concentration and the duration time affected cell viability (statistical analysis was shown in Table S2). So, we chose 48 h as the observation point due to the most obvious protective effect of CoCl2 was measured.
Figure 3. The anti-apoptotic effect of HIF1A in compression-induced apoptosis. (A) The cell viability of NPSC treated with compression and different concentrations of CoCl2 for 12, 24, 36, and 48 h. (B) FCM results of ANXA5/Annexin V-PI staining of NPSCs treated with 48-h compression and different concentrations of CoCl2. The apoptosis rate was the sum of the proportion of ANXA5+ PI− and ANXA5+ PI+ cells. Results were shown as mean ± SD. ns, non-significant, p > 0.05; *, compared to the Ctrl group; #, compared to the compression (CMP) group. *,#, p < 0.05; **,##, p < 0.01; ***, ###, p < 0.001. (C) Western blot analysis of NPSCs treated with 48-h compression and different concentrations of CoCl2. (D) The JC-1 probe staining of NPSCs treated with 48-h compression and different concentrations of CoCl2. Scale bar: 200 μm. (E) The cell viability of NPSCs treated with CHT followed by 100 μM CoCl2 (hypoxia mimicry, HX) and 48-h compression. The 0.01% dimethyl sulfoxide (DMSO; Sigma-Aldrich, D2650) in DMEM/F12 was used as vehicle controls. ***, compared to CMP group, p < 0.001; ###, compared to HX group, p < 0.001; ^, compared to HX+vehicle group, ^^^p < 0.001. (F) FCM results of ANXA5/Annexin V-PI staining of NPSCs treated with CHT, CoCl2, and 48-h compression (left). The apoptosis rate was shown as mean ± SD (right). (G) Blots and densitometric analysis of apoptosis-related proteins in NPSCs treated with CHT, CoCl2, and 48-h compression. Data was shown as mean ± SD. *, compared to CMP group. ns, non-significant; *p < 0.05, **p < 0.01, ***p < 0.001
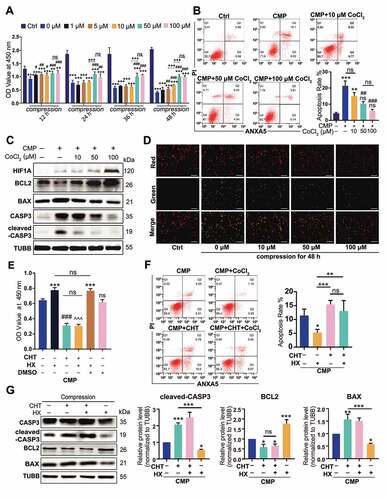
After 48-h compression, NPSCs that were treated with 50 μM and 100 μM CoCl2 had a more integrated cell shape and more explicit cell boundary than the compression group (CMP, without CoCl2). Hypoxia mimicry significantly reduced the proportion of karyopyknotic cells, which was induced by 48-h compression (Fig. S2). With flow cytometry (FCM) measuring the ANXA5/annexin V-PI stained cells, we found the PI+ ANXA5− cluster expanded in all compression-treated groups, suggesting that CMP led to death of NPSCs. Though there was no difference in the single-PI+ population between the CMP+CoCl2 groups and the CMP group, the apoptosis rate was significantly altered. Specifically, when compression (CMP) elevated the apoptosis rate to nearly 7 times higher than the control (Ctrl) group, the 50 μM, 100 μM CoCl2 treated cells had a remarkably lower apoptosis rate (p < 0.05) when compared to the CMP group (). Moreover, 10 μM CoCl2 reserved the cell vitality, as shown in CCK-8 assays, but had no significant effect on the apoptosis rate, indicating that CoCl2 had a dose-effect in protecting the NPSCs under compression.
Studies have shown that excessive pressure can result in mitochondrial apoptosis of NPCs [Citation44,Citation45]. Hence, we investigated the content of mitochondrial apoptosis pathway-related proteins and detected mitochondrial membrane potential (MMP) in NPSC. Under pressure, the anti-apoptotic protein, BCL2 (BCL2 apoptosis regulator), decreased while an increase in BAX (BCL2 associated X, apoptosis regulator) and cleaved-CASP3, often responsible for mitochondrial apoptosis, was observed (). In cells treated with CoCl2, however, the mitochondrial apoptosis pathway was significantly downregulated (). Besides, while 48-h compression decreased the MMP, indicated by decreased red:green fluorescence ratio, CoCl2 restored the mitochondrial polarization level and displayed a dose-effect at the same time ().
We then used chetomin (CHT, 100 nM), a protein that binds to EP300 (E1A binding protein p300) to block the transcription factor activity of HIF1A [Citation46,Citation47], whereby clarifying whether the anti-apoptosis effect was HIF1A-dependent. Between the CMP+CHT group and CMP+HX+CHT group (hypoxia mimicry using 100 μM CoCl2), no difference in cell viability was observed (). Moreover, the HX-induced decline in both early-stage and late-stage apoptosis was canceled at the presence of CHT, according to FCM assays (). Also, the alternations of apoptosis-related proteins in CMP+HX group were reversed by CHT (). In summary, CHT blocked the anti-apoptosis effect of HX under compression. Thereby, we conclude that the anti-apoptosis effect of HX depends on the transcription factor activity of HIF1A.
HIF1A upregulates autophagy in NPSC under compression
To elucidate the mechanism by which HIF1A protected the NPSCs from over-loading induced apoptosis, we used transmission electron microscopy (TEM) to investigate subcellular structures. In the CMP group, the cells had shrunk volume, creased nucleus, plenty of apoptotic bodies, and condensed chromatin (Figure 4Aii). These subcellular structure alternations proved NPSCs exposed to over-loading conditions underwent apoptosis. With upregulated HIF1A, however, NPSC demonstrated complete cell morphology and a more evident subcellular structure since the organelles were easily distinguished. More importantly, an increasing number of vesicles containing fragments of organelles and other dense materials were visualized in cells of CMP+HX (treated with 100 μM CoCl2 under compression) group, which indicated autophagosomes and autolysosomes at various stages (Figure 4Aiii).
Then, we marked the autophagosomes by immunofluorescence (IF) and analyzed the MAP1LC3B/LC3B (microtubule associated protein 1 light chain 3 beta)-positive puncta. The LC3B positive puncta area was increased in CMP+HX group compared to CMP group (p < 0.001), while HX alone had no significant influence (, ). For the protein level, CMP+HX group showed an over 2-fold higher ratio of LC3B-II:I when compared to the CMP group, but compression alone had no significant effect on LC3B-II:I. Intriguingly, the level of SQSTM1/p62 in the CMP group strongly increased, suggesting that autophagy in overloaded cells was insufficient to scavenge the accumulating cellular waste (, ) [Citation48].
Figure 4. HIF1A upregulates autophagy in NPSC under compression. (A) TEM analysis of NPSC under different conditions: Ai. NPSC without compression or CoCl2; Aii. NPSC exposed to 48-h compression (CMP); Aiii. NPSC treated with 100 μM CoCl2 (Hypoxia mimicry, HX) during the 48-h compression. The double-membrane vesicles were autophagosomes, indicated by white arrows, while the single-membrane vesicles, which were autolysosomes, were pointed by black arrows. (B) IF of MAP1LC3B/LC3B (here after LC3B) in NPSCs under different conditions. Scale bar: 20 μm. (C) Data showed 10–90 percentile and mean of puncta area percentage in Ctrl, HX, CMP, and CMP+HX groups, analyzed by Kruskal-Wallis test. n = 120 cells from 3 independent experiment. (D) Western blot analysis of autophagy-related proteins in NPSCs treated with CoCl2 and 48-h compression. (E) Densitometric analysis of autophagy-related proteins. ns, non-significant; ***, compared to the Ctrl group, p < 0.001. (F) Densitometric analysis of the fold change of LC3B-II:I before and after inhibiting autophagic degradation with BafA1. *, compared to NX+BafA1 group, p < 0.05; ns, non-significant, compared to NX+BafA1 group; #, compared to CMP+BafA1 group, p < 0.05. (G) Western blot analysis of LC3B-II:I in cells treated with or without hypoxia mimicry (HX), with or without compression. BafA1 was added in the last 4 h. (H) Representative fluorescence images showing the autophagosomes (yellow dots, GFP+ RFP+) and autolysosomes (free red dots, GFP− RFP+) in AdV-mRFP-GFP-LC3 transfected NPSCs. Scale bar: 10 μm. (I) Quantification of the number of autophagosomes and autolysosomes per cell was shown as mean ± SD. Cells were from 3 independent experiments. ns, non-significant; ***p < 0.001. (J) Western blot analysis of autophagy-related proteins in NPSCs under compression and hypoxia treated with CHT. (K) Densitometric analysis of autophagy-related proteins when CHT was added. ns, non-significant; *, compared to CMP group, *p < 0.05, **p < 0.01, ***p < 0.001
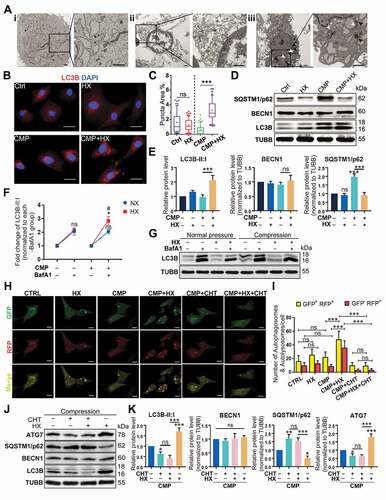
To elucidate whether the autophagy flux was altered by compression or hypoxia mimicry, we used bafilomycin A1 (BafA1) to prevent the fusion of autophagosomes and lysosomes to analyze the influx of autophagy [Citation49]. Displayed by western blot assays, the change of LC3B-II:I was 2.050 ± 0.151 fold under compression, showing no significant difference comparing to the change in the pair of control groups (2.049 ± 0.269 fold) (p > 0.05). Hypoxia mimicry alone also had no significant effect (2.114 ± 0.153 fold) although there was a slight increase (p > 0.05). Notably, the amplitude of elevation in HX+CMP groups (2.828 ± 0.324 fold) was apparently higher than that of CMP group (p < 0.05), supporting that hypoxia mimicry had an autophagy-stimulating effect on overloaded NPSCs (, ).
In parallel, we visualized the autophagosomes and autolysosomes in mRFP-GFP-LC3 adenovirus (AdV-mRFP-GFP-LC3) transfected NPSCs. The autophagosomes were labeled in yellow, as the LC3-label fluorescence is merged from both RFP and GFP. The autolysosomes were in red since the acid lysosomes can quench GFP. We found a significant increase in the number of both autophagosomes and autolysosomes in CMP+HX group compared with CMP group (p < 0.001) (, ). Moreover, when CHT was added, the autophagy-stimulating effect of HIF1A was canceled, evidenced by the non-significant comparison of yellow and red puncta between the CMP+CHT group and the CMP+CHT+HX group (p > 0.05) (, ). Consistently, LC3B-II:I and the levels of autophagy-related proteins remained constant when CHT was applied (, ). These results prove that HIF1A was the key molecule that upregulated autophagy in overloaded NPSCs.
The anti-apoptotic effect of HIF1A relies on activating autophagy
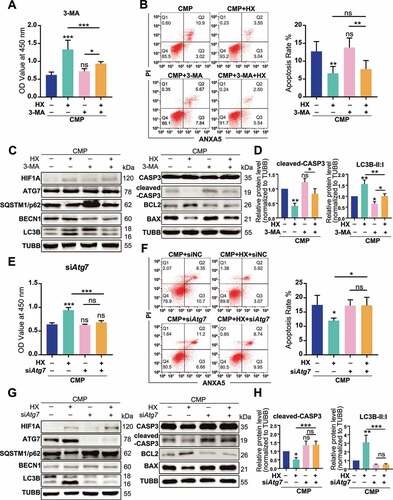
To clarify whether autophagy was responsible for the anti-apoptotic effect of HIF1A, we used different methods to manipulate different autophagy phases. With 3-methyladenine (3-MA) decreasing the autophagosome formation via inhibiting the class III phosphatidylinositol 3-kinase (PtdIns3K) [Citation50], the viability and the apoptosis rate of overloaded cells were no longer altered by hypoxia (, ). Meanwhile, higher levels of BAX and cleaved-CASP3 were detected in both 3-MA treated groups, comparing respectively to the CMP or the HX+CMP group (, ). Yet, because 3-MA treatment was reported to induce apoptosis on itself [Citation51], it was uncertain whether 3-MA directly caused higher apoptosis. Therefore, we transfected siRNA to knock down Atg7 (autophagy related 7), which was essential to autophagosome assembly [Citation52,Citation53] (the efficacy of siRNA transfection was presented in Fig. S4A and S4B). In Atg7 knockdown groups, the cell viability impaired by compression could no longer be recovered by hypoxia (). Also, both the apoptosis rate and apoptosis-related proteins that were regulated by HIF1A remained constant upon siAtg7 treatment (, , ). According to these results, we concluded that the upregulation of autophagy was necessary for HIF1A to exert its anti-apoptotic function.
Figure 5. The anti-apoptotic effect of HIF1A relies on up-regulating autophagy. (A) Cell viability of NPSCs treated with compression, hypoxia (HX), and 3-MA. *, compared to CMP group. (B) FCM analysis of NPSCs treated with compression, hypoxia, and 3-MA. The apoptosis rate was shown in the statistical chart (right). (C) Western blot analysis of apoptosis and autophagy-related proteins with the treatment of 3-MA. (D) Densitometric analysis of key proteins related to apoptosis (cleaved-CASP3) and autophagy (LC3B) was shown in the statistical chart. Other protein data was shown in Fig. S3. (E) Cell viability of NPSCs transfected with siNC or siAtg7 under compression and hypoxia. (F) FCM analysis of siNC or siAtg7 transfected NPSCs treated with compression and hypoxia. The apoptosis rate was shown in the statistical chart (right). (G)Western blot analysis of apoptosis and autophagy-related proteins with the treatment of siAtg7. (H) The densitometric analysis of key proteins in autophagy and apoptosis was shown in the statistical chart. ns, non-significant; *, compared to CMP group; *p < 0.05, **p < 0.01, ***p < 0.001
HIF1A overexpression in NPSC alleviates the apoptosis of NPSC by upregulating autophagy
In order to construct a self-sustaining hypoxic NPSC model, we conducted a GFP-labeled lentivirus (Lv) transfection to overexpress HIF1A in NPSC, whereby genetically mimicking hypoxia. The transcription and translation of Lv-HIF1A in NPSC were detected (Fig. S4E and S4F). After being treated with 48 h compression in vitro, remarkably more LC3 puncta were found in HIF1A-overexpressing cells (Lv-HIF1A-NPSCs), comparing with the negative control (Lv-NC) group (). Meanwhile, TUNEL staining showed that Lv-HIF1A-NPSC had three times less apoptosis than the Lv-NC group (). Besides, western blot results exhibited lower cleaved-CASP3 levels in Lv-HIF1A-NPSCs. Consistent with the chemical mimicked hypoxia, Lv-HIF1A-NPSCs also had a higher ratio of LC3B-II:I than the Lv-NC group (), suggesting transgenic HIF1A-overexpressing also upregulated autophagy and inhibited overloading-induced apoptosis.
Figure 6. Overexpressing HIF1A induces autophagy activation and alleviates apoptosis of NPSCs under compression. (A) Ad-RFP-LC3 was used to label and detect LC3. After Ad-RFP-LC3 transfection, Lv-HIF1A-NPSC or Lv-NC-NPSC and followed by 48-h compression, the autophagy level was detected (above) and quantified (bottom). ***p < 0.001; Scale bar: 20 μm. (B) TUNEL staining of Lv-HIF1A-NPSC or Lv-NC-NPSC under compression. Transfected cells displayed green fluorescence, and TUNEL positive cells were emitting red fluorescence. Scale bar: 100 μm. The positive rate of TUNEL staining was shown in the subjacent chart. *p < 0.05. (C) Western blot analysis of key proteins in apoptosis and autophagy. Cells were transfected with Lv-HIF1A-GFP or Lv-NC-GFP and cultured with or without compression. Densitometric analysis was shown in the subjacent statistical chart. ns, non-significant; *, compared to the Lv-NC-NPSC group, **p < 0.01, ***p < 0.001. (D) Western blot analysis of key proteins related to apoptosis and autophagy in Lv-HIF1A-NPSC or Lv-NC-NPSC, which were transfected with siAtg7 or siNC. Densitometric analysis was shown in the right statistical chart. *, compared to the Lv-HIF1A-NPSC+CMP group, *p < 0.05, **p < 0.01, ***p < 0.001. (E) TUNEL staining (red signal) of Lv-HIF1A-NPSC or Lv-NC-NPSC transfected with siAtg7 or siNC under compression. Scale bar: 50 μm. The positive rate of TUNEL staining was shown in the right chart. ns, non-significant; *, compared to the Lv-NC-NPSC+CMP group, *p < 0.05, **p < 0.01, ***p < 0.001
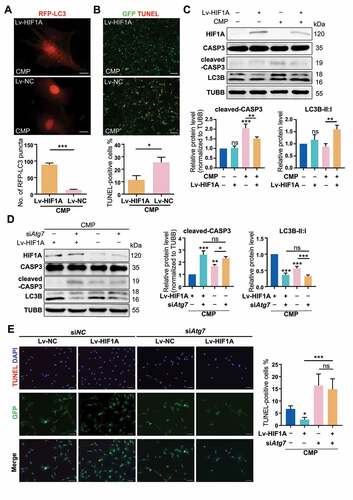
Further, we used siAtg7 to knockdown the autophagy in lentivirus-transfected cells. The ratio of LC3B-II:I in the Lv-HIF1A+siNC group was 2.76 times higher than that of Lv-HIF1A+siAtg7 group (). Not surprisingly, we detected more TUNEL positive cells when autophagy was inhibited (14.839 ± 4.107% in Lv-HIF1A+siAtg7 group vs. 2.377 ± 0.861% in Lv-HIF1A+siNC group, p < 0.001) (). Based on these results, we demonstrated that lentivirus-mediated overexpressing of HIF1A in NPSCs exerted a similar anti-apoptotic effect through activating autophagy.
Enrichment analysis of HIF1A activated proteins
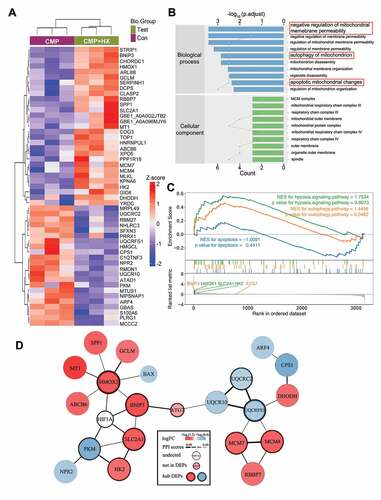
For an in-depth understanding of the mechanisms that underly the function of HIF1A, we conducted label-free quantitative proteomic analysis with NPSCs from CMP+HX group and CMP group. We identified 51 differentially expressed proteins (DEPs) with 29 upregulated proteins and 22 downregulated proteins in the hypoxia mimicry group (, Fig. S5A). The information of DEPs was shown in Table S3 and Data S1. Gene Ontology (GO) analysis revealed these DEPs were highly relevant to the regulation of mitochondrial membrane permeability, mitochondrial auto-phagy, and mitochondrial apoptosis. Moreover, mitochondria emerged as the most dramatically enriched cellular component terms, which established associations among hypoxic adaption, apoptosis, and mitophagy functionality (). Kyoto Encyclopedia of Genes and Genomes (KEGG) pathway analysis showed the DEPs enriched in HIF1A signaling pathway and autophagy, which further verified our observation (Fig. S5B). Moreover, we performed Gene Set Enrichment Analysis (GSEA) for several predefined gene sets of KEGG pathways (HIF1A signaling pathway [rno04066], apoptosis [rno04210], autophagy [rno04140]). The result showed the proteins upregulated in the CMP+HX group were significantly enriched in the process of autophagy and the HIF1A signaling pathway (p < 0.05). In the leading-edge subset, DEPs that simultaneously associated with autophagy, apoptosis, and HIF1A signaling pathway were BNIP3 (BCL2 interacting protein 3), HMOX1 (heme oxygenase 1), SLC2A1 (solute carrier family 2 member 1), and HK2 (hexokinase 2). All of these proteins belonged to the downstream molecules of HIF1A [Citation54] (). To further illuminate the relationship between these related DEPs and the mechanism of hypoxia-elevated autophagy, we applied protein-protein interactions (PPI) analysis. Our results highlighted the proteins reported to be interacting with HIF1A and ATG7, namely BNIP3, HMOX1, and SLC2A1 (ranked in the top 10 for network connection degree of the PPI network) [Citation55,Citation56] ().
Figure 7. Quantitative proteomic analysis reveals the proteins that mediate the autophagy-stimulating effect of HIF1A. (A) Heatmap depicting the expression profiling of the 51 DEPs in the comparison between CMP+HX and CMP group. (B) GO enrichment analysis (biological processes and cellular component) of DEPs illustrating the gene count (indicated by the lines) and the adjusted hypergeometric p values (indicated by the bars). (C) GSEA of the FC-ranked DEP list showing the normalized enriched scores (NES) and the Kolmogorov–Smirnov p values for each predefined KEGG gene sets. Several interested proteins shown in the ranked list metric part were highlighted with the color same as their correlated pathways. (D) The PPI networks for DEPs and several related proteins. ATG7 was proved significantly upregulated by hypoxia (Figure 5 G) but excluded from DEPs due to p > 0.05. The thickness of connecting lines indicated the PPI confidence scores (values>0.4) according to the database STRINGv11. Node colors indicated the logFC values of DEPs. Hub DEPs, ranking the top in the list of connection degree that was generated by the Cytoscape plugin cytoHubba, were shown in nodes with bold borders
HIF1A-BNIP3-ATG7 axis mediates the autophagy-stimulating and anti-apoptotic effects of HIF1A
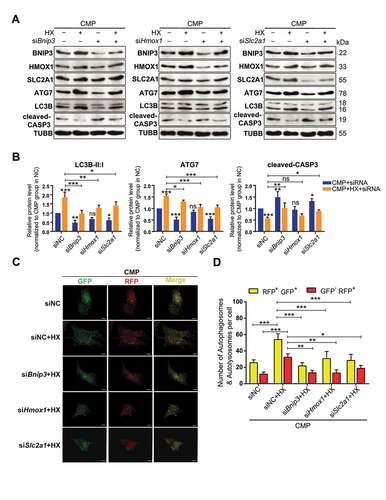
To take an in-depth look at the possible signal pathway that dominated the HIF1A-ATG7-autophagy axis, we performed siRNA interference experiments by separately targeting the genes encoding these three proteins. After confirming that the expression of these proteins were consistent with the proteomic results (Fig. S5C), we evaluated the level of auto-phagy and apoptosis, as well as the protein levels of BNIP3, HMOX1, SLC2A1 in NPSCs treated by siRNA and cultured in hypoxia-overloading conditions (). Not surprisingly, when comparing the CMP+HX+siRNA group with the CMP+HX group, all three siRNAs resulted in inhibition of auto-phagy, according to the changes in ATG7 and LC3B-II:I, while siBnip3 and siSlc2a1 increased apoptosis, evidenced by the level of cleaved-CASP3 (, ). Notably, the most apparent blocking effect on LC3B-II:I existed in the siRNA-Bnip3 group, in which the hypoxia-induced increase in LC3B-II:I was significantly suppressed (0.973 ± 0.142 in siBnip3+ HX+CMP vs. 1.853 ± 0.233 in siNC+HX+CMP, normalized by CMP+siNC group, p < 0.001). Also, siBnip3 aggravated the compression-induced apoptosis while the other two showed less influence. Meanwhile, the autophagy flux in siRNA-transfected cells under compression and hypoxia mimicry was also tested. All three CMP+HX+siRNA groups showed a significant decrease in the number of autophagosomes (GFP+ RFP+) and autolysosomes (GFP− RFP+) when comparing with CMP+HX+siNC group. Consistently, cells treated with siBnip3 exhibited the most apparent blocking effect on autophagy flux (, ). More importantly, western blot assays demonstrated that BNIP3 was decreased when inhibiting SLC2A1 or HMOX1, but the knockdown of BNIP3 had no significant effect on SLC2A1 or HMOX1 (). These results suggested that the HIF1A-BNIP3-ATG7 pathway mediated the effects of HIF1A, while HMOX1 and SLC2A1 participated in this regulatory network by interacting with BNIP3.
Figure 8. Knocking down of BNIP3, HMOX1, or SLC2A1 inhibits the autophagy-stimulation and the anti-apoptotic effects of hypoxia. (A) Western blot analysis of identified hub proteins (BNIP3, HMOX1, and SLC2A1), autophagy-related, and apoptosis-related proteins. Cells were transfected with siBnip3, or siHmox1, or siSlc2a1 or siNC, and then cultured under compression, with or without hypoxia mimicry. (B) Densitometric analysis of LC3B-II:I, ATG7, and cleaved-CASP3 was shown in the statistical charts. Other proteins analysis was shown in Fig. S5E. ns, non-significant; *, compared to CMP+siNC group; *p < 0.05, **p < 0.01, ***p < 0.001. (C) Representative fluorescence images showing the autophagosomes (yellow dots, GFP+ RFP+) and autolysosomes (free red dots, GFP− RFP+) in AdV-mRFP-GFP-LC3 transfected NPSCs treated with siRNA or siNC under CMP (above) or CMP+HX (below) conditions. Scale bar:10 μm. (D) Quantification of the number of autophagosomes and autolysosomes per cell was shown as mean ± SD. Cells were from 3 independent experiments. ns, non-significant; *p < 0.05, **p < 0.01, ***p < 0.001
Lv-HIF1A-NPSC retards IDD in a rat model
Using axial-compressing external-fixation devices, we loaded the caudal discs (C8-9 and C9-10) of adult rats with 1.3 MPa pressure for four weeks [Citation57,Citation58] (), whereby inducing intervertebral disc degeneration in the instrumented discs. The HIF1A level in nucleus pulposus declined after 4-week axial mechanical loading, so as the number of TEK+ cells, which was in alignment with the aging model (Fig. S6C). To study the survival of HIF1A-overexpressing NPSCs in an overloading condition, we transplanted 1,1-dioctadecyl-3,3,3,3-tetramethyl indotricarbocyanine (DiR) Iodide-labeled NPSCs into the compressed disc on the 7th day (The workflow was shown in ). Micro syringe (33 Gauge, d = 0.35 mm) was used in intra-disc injection to avoid disc degeneration [Citation59].
Figure 9. HIF1A overexpressed NPSCs retards IDD in vivo. (A) Typical image showing the rat IDD model, photographed by X-Ray after the operation. The white arrowheads indicated the compressed disc. Scale bar: 1 cm. (B) Schematic diagram explaining the workflow and the group settings of animal experiments. The IDD model rats on the 7th day post-surgery were randomly divided into five groups (n = 20 for each group). Near infra-red (NIR) in-vivo imaging was conducted for those underwent intra-disc transplantation. (C) NIR signals emitted from the transplanted cells were visualized at 1, 3, 7, and 14 days after intra-disc transplantation. The correlation between color and the intensity of the image was shown in the right panel. (D) The dynamics of the relative ratio of NIR net intensity (data aligned according to the 1st day image) of each group was shown in the statistical chart. Results were shown as mean ± SEM. ***, compared to the Lv-NC-NPSC group, p < 0.001; ###, compared to the NPSC group, p < 0.001. (E) IF staining of LC3B (The left panel: general view of disc sections for each group, the dotted lines indicated the border of NP, scale bar: 200 μm; Red: anti-LC3B. Green: anti-GFP. Blue: DAPI; The right panel: Representative images of LC3B staining, scale bar: 20 μm), cleaved-CASP3 (the positive cells were indicted by the white arrows, scale bar: 50 μm) and ACAN (scale bar: 50 μm) in the disc of each group. (F) The expression level of LC3B and cleaved-CASP3 was shown in the statistical chart. Implanted NPSC (GFP+) and host cells (GFP−) were respectively analyzed. For the statistical charts from at least 3 independent experiments, results were shown as mean ± SD. ns, non-significant; *, compared to Lv-HIF1A-GFP+-NPSC group, *p < 0.05, **p < 0.01, ***p < 0.001. (G) The expression level of ACAN was shown in the statistical chart. ns, non-significant; *, compared to Lv-HIF1A-NPSC group, *p < 0.05, **p < 0.01, ***p < 0.001. (H) Representative pictures of H&E and Safranin O-Fast Green staining of each transplantation group at 21 days after transplantation. The black dotted lines showed the region of transplanted cells (upper right). Scale bar: 500 μm. (I) Histological degenerative scores at 7, 14, and 21 days after intra-disc transplantation. ns, non-significant; *, compared to Lv-HIF1A-NPSC group; #, compared to Lv-NC-NPSC group; ^, compared to the NPSC group. *p < 0.05; **p < 0.01; ###, ^^^, ***, p < 0.001
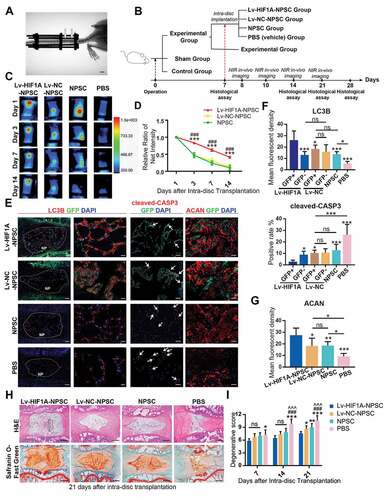
Through monitoring the changes in near-infrared (NIR) intensity over 2 weeks after transplantation, we found a slower decay in the Lv-HIF1A-NPSC group, comparing to Lv-NC-NPSC and NPSC groups (, ). After 14 days, nearly 42% of Lv-HIF1A-NPSC could still be detected but less than 12% of Lv-NC-NPSC and NPSC were measured. Moreover, in the immunostaining of the tissue sections, the anti-GFP staining of tissue sections suggested that at 3 weeks post-transplantation, the cell number of Lv-HIF1A-NPSC was more abundant when comparing to the Lv-NC-NPSC (). Meanwhile, the apoptosis of transplanted cells was decreased by HIF1A, evidenced by a significantly lower rate of cleaved-CASP3-positive cells in Lv-HIF1A-NPSCs (GFP+) when comparing with the Lv-NC-NPSCs (GFP+). Besides, a higher LC3B intensity was measured in Lv-HIF1A-NPSC group, comparing to the Lv-NC-NPSC group (, ). Moreover, the expression level of ACAN (aggrecan) in cell-transplanted groups, especially in the GFP-positive region in the Lv-HIF1A-NPSC group, was notably higher than that of the PBS group, suggesting the transplanted cells facilitated ECM restoration (, ).
Then, the histological structure of IVD was analyzed by hematoxylin-eosin (H&E) and Safranin O-Fast Green staining (). Comparing with the PBS (vehicle) group, NPSC transplantation retarded the ECM loss and NP volume reduction in the IDD model. Notably, the Lv-HIF1A-NPSC group displayed a more intact IVD structure and a more homogenized ECM structure. Moreover, the cell numbers in the Lv-HIF1A-NPSC group were higher than those from other groups. The degenerative score was evaluated based on H&E and Safranin O-Fast Green staining at 7, 14, 21 days after transplantation [Citation60](, Fig. S6D). The score of the PBS group was higher than that of other groups after transplantation. Lv-HIF1A-NPSC group got a lower score than Lv-NC-NPSC and NPSC group at 21-day after transplantation (). Together, these results demonstrated the positive effects of HIF1A on upregulating autophagy, decreasing apoptosis, and promoting ECM synthesis in NPSC, which consequently retarded the progression of excessive mechanical loading induced IDD.
Discussion
Various types of stem cells have been applied to treat IDD in animal experiments or clinical trials [Citation61–64]. However, challenges such as mechanical loading and hypoxia confronted by cellular therapy and intrinsic stem-cell-based repair remain to be overcome [Citation12,Citation65]. Particularly, how hypoxia influences the homeostasis and the stem-cell-based repair of degenerated discs, which are continuously exposed to mechanical loading, is still unknown. Therefore, we studied the role of HIF1A, the most crucial hypoxia responsible element, under an over-loading condition that induced IVD degeneration. Our research not only demonstrated that the disruption of hypoxia in late-stage disc degeneration was concomitant with elevating apoptosis of NPSCs, but also elucidated the anti-apoptotic effect of HIF1A in these endogenous stem cells exposed to excessive loading. Specifically, the protective effect of hypoxia was carried out by activating autophagy in a HIF1A dependent approach. Together, our results highlighted the prominent role of HIF1A in both intrinsic disc repair and stem-cell-based cellular therapy for IVD degenerative diseases.
By investigating the NP tissues from humans and rats, we found HIF1A decreased in late-stage IDD (), which could be resulted from oxygen-mediated degradation of HIF1A [Citation28]. These findings aligned with the results of Yao Y et al. [Citation66] that the HIF1A decreases in degenerated cartilage endplate, another critical structure of IVD that is impaired during IDD. Moreover, our group and Sakai et al. [Citation38] demonstrated that TEK-positive cells, the stem-cell-like subpopulation in nucleus pulposus, that decreased with aging and disc degeneration. Our results of immunofluorescent assays showed that 33.866 ± 9.584% cells in grade II discs are TEK+ (n = 6, age ranges 24 to 38 years) (). This number is higher than expected since conventionally, the endogenous stem cells are trace within mature tissue. However, as reported before [Citation38], the TEK single-positive cells within human NP tissues range from 0% to 71.4% (n = 23, age ranges 19 to 70 years), whose change is markedly negatively co-related with the increase of age. Therefore, we deduce that this difference is because the donors in our study were relatively younger.
Nevertheless, TEK as a single marker is imperfect, and the challenge to identify NPSC with reliable markers remains. Another latent NPSC marker is disialoganglioside GD 2 (GD2). When cultured in vitro, TEK+ GD2− cells rapidly proliferate and gain GD2 expression during the expansion, indicating that TEK single-positive cells are precursors of GD2+ cells [Citation38]. Intriguingly, the latter population persists the proliferation capacity [Citation38]. Thus, gating GD2-positive cells will omit the TEK+ GD2− stem-cell-like subpopulation. To overcome the challenges brought about by temporal dynamics and cellular hierarchy, we will include more patients at a broader range of age in future studies, and use novel research tools, including single-cell RNA sequencing and lineage-tracing study to investigate cells in the NP tissue.
Considering that the degenerated discs had a pronounced decline in cellular density, the significantly decreasing proportion of TEK+ cells indicated that this subpopulation was more vulnerable during disc degeneration. This phenomenon is consistent with other types of endogenous stem cells, for example, muscle satellite cells [Citation23], intestinal stem cells [Citation67], and hematopoietic stem cells [Citation24]. A validated mechanism is that when these endogenous stem cells are activated at adulthood and reenter into cell cycle, their DNA is exposed to ROS but concomitant with impaired protective machinery, thus being more likely to die [Citation23,Citation24,Citation67]. This theory led us to evaluate the apoptosis of NPSCs during IDD. Another assumption accounting for the loss of NPSC is that TEK-positive cells downregulate their expression of TEK when adapting to the environmental change, which needs to be verified using transgenic lineage-tracing tools.
Surprisingly, NPSCs that were exposed to normal oxygen concentration, or hypoxic environment, or cobalt-mimicked hypoxia that induced a similar HIF1A level to 1% O2 hypoxia group, all showed similar vitality (). This non-significant comparison suggested apoptosis of NPSC in vivo was not induced directly by the alternation in the HIF1A level but by the increase of the vulnerability of NPSC in the harsh disc environment. Notably, NPSC showed strong tolerance to chemically mimicked hypoxia since 100 μM Co2+ did not influence the vitality of NPSC, while this concentration could cause cell death of adult stem cells and cancer cells [Citation40]. This distinction supports that the cells in IVD have adapted to the hypoxic environment owing to tissue-specific properties, highlighting an advantage of NPSC in IDD treatment.
Though various models have been applied to study IVD cell apoptosis, how to investigate the role of hypoxia on mechanically loaded cells has not been reported. Here, we adopted a previously described vessel to load 1.0 MPa hydrostatic pressure intermittently on monolayer NPSCs [Citation16] and mimicked the 1% O2 environment by treating the NPSCs with CoCl2 (). We found that 48-h intermittent compression caused approximately 30% of NPSC apoptosis, while the hypoxic cells significantly resisted to the compression-induced apoptosis (). Considering this pronounced effect was canceled by chetomin, the inhibitor that blocked HIF1A-mediated transcription, we concluded that the acute stress imposed by compression on NPSC was to a large extent counteracted by the HIF1A mediated protective cellular process. An alternative explanation for these results is that mechanical stimulation directly induces adaptive feedback, and HIF1A is among the signal molecules. Although studies have reported that short-term mechanical stimulation increases ECM synthesis in IVD cells via TGFB/TGF-β signaling [Citation57], besides, intracellular pathways such as MAPK (mitogen-activated protein kinase) [Citation68] and YAP1 (Yes1 associated transcriptional regulator)-TAZ (tafazzin) [Citation69] are participating mechanotransduction, how these involved pathways participate in apoptosis is still unknown. Hence, whether HIF1A could mediate the response to mechanical stress in NPSCs needs to be investigated in future work.
With TEM, LC3B immunostaining, and western blot assays, we discovered the increase in the number of auto-phagosomes in the hypoxic cells that were under compression. Intriguingly, compression alone showed no significant influence on the level of LC3B-II:I, though it significantly increased the level of SQSTM1/p62, a cargo protein that binds other proteins for selective autophagy. This result encouraged us to study how the autophagy flux was changed under each condition. Using BafA1 and AdV-mRFP-GFP-LC3, we found hypoxic-overloaded cells had the highest level of autophagy flux, while hypoxia alone and compression alone had no significant influence (). Taking these results together, we reason autophagy flux in overloaded NPSCs was insufficient to scavenge the accumulating damaged organelles and other cellular waste in time. With hypoxia, however, the cells had enhanced autophagy flux to clear cellular waste, thus showing resistance to the overloading-induced apoptosis [Citation70]. Interestingly, the elevation of autophagy was HIF1A dependent since it was reversed by CHT, thus differing from previous studies on the hypoxia-induced autophagy activation in NPCs [Citation71]. This inconsistency about the role of HIF1A may be due to the different approaches to simulate hypoxia. Besides, autophagy has been proven to be important in maintaining the stemness of the endogenous stem cells [Citation23], which could be regulated by HIF1A mediated transcription and downstream pathways. Therefore, hypoxia-mediated autophagy could exhibit cell-type specificity in these two cell types [Citation71,Citation72]. Intriguingly, we also detected the constant level of BECN1/beclin1 in hypoxia-mimicked cells, implying that BECN1-mediated initiation was not the target of HIF1A in NPSC, which was reported by a previous study [Citation73]. Although the molecular mechanism varies under different conditions, our results positively demonstrated that HIF1A enhanced autophagy in NPSC.
For the mechanism through which HIF1A regulated autophagy, we hypothesized that HIF1A activated auto-phagy via modulating the later stages because the 3-MA treatment only exerted a moderate effect on the hypoxic cells (). Moreover, hypoxia itself showed no increase in the BECN1 protein level in NPSC (), though the HIF1A-MTOR-ULK1-BECN1 axis was widely reported [Citation71,Citation74]. Given the result that HIF1A no longer increased the autophagy in siAtg7 treated NPSCs, it was strongly supported that HIF1A activated autophagy through accelerating the ATG7-dependent substrates encapsulation [Citation75].
To date, the exact mechanism of hypoxia-induced auto-phagy for NPSC is not yet fully elucidated. In this study, we observed obvious mitochondrial injury in compression-treated cells, which resulted in cell apoptosis through activating caspase cascade (). Meanwhile, the inhibition of autophagy, which can also mitigate mitophagy, blocked the protective effect of hypoxia (). Mitophagy as a crucial cellular procedure that selectively sequestrates and subsequently clears the damaged mitochondrial plays a significant role in maintaining the function and regulating the number of mitochondria [Citation76,Citation77]. Thus, there is a high chance that the hypoxia-induced elevation in mitophagy mediates the protective effect of hypoxia. Accordingly, we detected a significant enrichment of mitophagy and mitochondrial apoptosis-associated proteins among the DEPs in response to hypoxia and overloading ().
Among the highest-ranking DEPs in our proteomic results, BNIP3, HMOX1, and SLC2A1 were downstream targets of HIF1A (). The HIF1A-dependent expression of BNIP3 and BNIP3L (BCL2 interacting protein 3 like) has been extensively regarded as the key mechanism of hypoxia-induced autophagy, while depletion of both components can totally abrogate mitophagy and significantly increase cell death [Citation21]. BNIP3-BNIP3L-induced mitophagy upon hypoxia additionally requires the activity of essential autophagy components such as ATG7 and the interaction with LC3B [Citation78,Citation79]. HMOX1, an inducible enzyme that catalysis the degradation of pro-oxidant heme, has been described to play a role in mitophagy as well as mitochondrial biogenesis, thereby strongly affecting the pool of mitochondria within the cells and controlling the anti-apoptotic process [Citation55,Citation56]. However, the association between SLC2A1, a member of glycolytic enzymes regulated by HIF1A, and mitophagy is rarely reported [Citation80,Citation81].
Therefore, we investigated the relationship between HMOX1, SLC2A1, BNIP3, and mitophagy by manipulating each molecule with siRNA. Our results demonstrated that HIF1A triggered autophagy activation through the HIF1A-BNIP3-ATG7 axis, while HMOX1 and SLC2A1 were involved by interacting with BNIP3 (). Nonetheless, siRNA-Bnip3 did not entirely cancel the effect of hypoxia since HX induction could still stimulate autophagy when siRNAs were added. Possibly, the remnant BNIP3 protein could still mediate hypoxia-induced autophagy, given that the RNA interference technique cannot wipe out the targeted molecule at the protein level. Meanwhile, other pathways outside the scope of proteomics study, like non-coding regulatory RNAs [Citation82], could also involve and need more investigations.
Our study, for the first time, constructed HIF1A overexpressing NPSC using lentivirus transfection. These engineered cells demonstrated stronger resistance to over-loading induced cell death. They also displayed elevated autophagy, which was consistent with the chemically mimicked hypoxic cells (). Previous studies that transplanted hypoxic-preconditioned bone marrow mesenchymal stem cells into the nucleus pulposus of puncture-suction induced IDD model detected decreased cell apoptosis [Citation83,Citation84]. However, due to differences in weight burden patterns in human beings and rodents, the findings that indicate a positive role of transient hypoxia in an unloaded IDD model need to be further examined. In this research, we utilized the axial-mechanical loading model to simulate the mechanical loading on IVD before transplanting reparative cells. Though it does not incorporate other mechanical variables and different force types, this model allows force simulation that cannot be achieved by the puncture-suction model. For another aspect, since we loaded the discs continuously with 1.3 MPa axial compression and maintained it for 3 weeks after the transplantation [Citation85], whether the hypoxic-preconditioning method can persist within this time span has not been validated. Hence, we used a lentivirus overexpressing approach to adapt the NPSCs to the degenerated disc. Four-week observation revealed that HIF1A-overexpressing NPSCs enjoyed a higher survival rate in the pressurized disc ().
Within the 3-week follow up, we found a minor improvement in the histology score of IVD, which may raise a doubt on the in vivo reparative effect of HIF1A overexpressing NPSCs. However, we found that Lv-HIF1A-NPSCs synthesized more ACAN in local, a significant step to restore the IVD matrix (). With a higher survival rate, it is in the prospect that these transplanted Lv-HIF1A-NPSCs can facilitate IVD repair and regeneration in a more extended period. Nonetheless, considering the role of autophagy in mediating the protective effect of HIF1A, another concern is that autophagy has a function in stemness maintenance [Citation23], which could keep stem cells in quiescence and suspend the intrinsic tissue repair [Citation24]. Since IVD repair and regeneration requires not only the maintenance of stem cells abundance but also appropriate differentiation at specific spatial and temporal conditions, the accurate regulation of autophagy is of significant meaning for the cellular therapy and stem-cell-based regeneration.
Figure 10. Strategies based on NPSC transplantation therapy for retarding IDD and restoring disc homeostasis
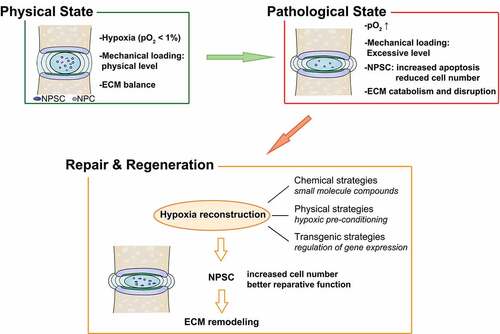
In summary, our research revealed that hypoxia stimulated autophagy through the HIF1A-BNIP3-ATG7 axis, thereby increasing the resistance of stem cells to overload. These findings highlighted the beneficial role of hypoxia in intrinsic IVD repair and stem-cell-based IVD regeneration, thus providing a promising therapeutic target for IDD treatment.
Materials and Methods
Human and Rat tissue specimens
The NP tissues were obtained from patients who underwent spine operations at the Union Hospital, Tongji Medical College (Wuhan, China). The relatively normal human lumbar NP tissues were obtained from 6 patients (age ranges 24 to 38 years, grade I~ II) with acute lumbar disc herniation or adolescent idiopathic scoliosis but without IDD. The degenerated NP were obtained from 12 patients (age ranges 43 to 81 years, grade III~V) with disc degeneration. The degenerated degree of the disc was graded by the Pfirrmann classification [Citation37]. The information of the samples was shown in Table S1. All study procedures were approved by the Ethics Committee of Tongji Medical College, Huazhong University of Science and Technology (Wuhan, China).
All animal experiments were carried out following the protocols approved by the Animal Experimentation Committee of Tongji Medical College. The lumbar discs of old rats (n = 30, 18- to 24-months old) and young rats (n = 30, 8- to 12-weeks old, skeletally mature) were gathered after euthanasia.
Tissue Collection and Histology assay
The NP tissue from human and rats were freshly collected and fixed immediately in 4% paraformaldehyde (Servicebio, G1101). Additionally, the rat IVD samples were decalcified with EDTA decalcifying solution (Servicebio, G1105) for 14 days. All samples were then embedded in paraffin for serial sectioning and staining. Sections were stained with H&E (Solarbio, G1120) and Safranin O-Fast Green (Solarbio, G1371) to analyze histological grading and proteoglycans loss.
Tissue immunostaining
The endogenous peroxidase activity on the sections was blocked using 3% H2O2 solution followed by blocking with 10% goat serum (Boster, AR1009). Primary antibodies targeting HIF1A (1:50; NOVUS, NB100-105), ACAN (1:100; Proteintech, 13,880-1-AP), COL2A1 (1:50; Proteintech, 15,943-1-AP) were added to the sections, which were incubated at 4°C overnight. Then, HRP-conjugated secondary antibodies (Proteintech, SA00001-1, SA00001-2) were applied to the corresponding primary antibody. Afterward, we stained the samples with diaminobenzidine (DAB; Solarbio, DA1015) and hematoxylin for nuclei staining.
For tissue immunofluorescence assays, slides were incubated with 10% donkey serum for 30 min after dewaxing and antigen retrieval. Then, slides were incubated with primary LC3B (1:200; Sigma-Aldrich, L7543), cleaved-CASP3 (1:200; Cell Signaling Technology, 9661), TEK/TIE2 (1:200; Bioss, bs-1300 R), ACAN (1:100; Proteintech, 13,880-1-AP), GFP (1:200; NOVUS, NB600-597) at 4°C overnight. On the other day, the sections were incubated at 37°C for 1 h with corresponding secondary antibodies (goat anti-mouse IgG: 1:500; Abcam, ab150113; donkey anti-rabbit IgG: 1:500; Abcam, ab150064) and counterstained with 4,6-diamidino-2-phenylindole (DAPI; Solarbio, C0065) before mounting. Images were captured with an inversion fluorescence microscope (Olympus, IX71, Japan). At least three sections from each specimen were used to observe protein expression in the rat and human NP tissue.
Cell isolation, culture, and treatment
Primary rat NPSCs were isolated using a method previously reported by Li et al [Citation86]. Briefly, we isolated nucleus pulposus tissue from 5 lumbar discs of one Sprague-Dawley rat and mixed tissues of 6 rats together (n = 6, 12-week, female) before collagenase II (Solarbio, C8150)-based digestion. After 30 min of digestion in 37°C, the remained microtissue and cells were cultured in 10-cm culture plates instead of 25-cm2 culture flasks so that the cells from NP would expand from an extremely low density, thus permits the isolation of subpopulation formed by fast proliferating cells. DMEM/F12 (Gibco, 12,634) medium supplemented with 10% fetal bovine serum (FBS; Gibco, 10,099) and 1% penicillin-streptomycin combination (Gibco, 15,070,063) was used as culture medium at 37°C in a humidified atmosphere containing 5% CO2 and changed twice per week until the cell colonies (defined as a cluster larger than 1 mm) were observed. Colonies were selected and isolated on the 10th day using cloning rings (Sigma-Aldrich, C2059-1EA) that help to enclose the Trypsin-EDTA solution (Gibco, 25,300,054). These cells were then subjected to identification assays, including colony formation test, proliferation assay, multi-lineage differentiation, and surface marker identification. The NPCs were cultured following the protocols in previous studies [Citation15]. The 1st passage of isolated cells were subjected to expanding culture with mesenchymal stem cell complete medium (Cyagen, RASMX-90,011). When reached 80 ~ 90% confluent, cells were trypsinized at 37°C for expansion culture. The cultures after three times of passage showed homologous morphology, in which the cells with spindle shape took up almost 100% of the whole population. The characteristics of P4 cells were also tested. Cells up to the 4th passage were used throughout the following experiments.
For hypoxic culture, NPSCs were cultured in complete medium and treated with different concentration (0, 1, 5, 10, 50, and 100 μM) of CoCl2 solution (Sigma-Aldrich, C8661) for 12, 24, 36, and 48 h under normal air pressure at 37°C. Another group of NPSCs under hypoxic conditions was cultured in a hypoxic incubator (YCP-30/Q, Huaxi Electronics, Changsha, China) with 1% O2, 5% CO2, and 94% N2 at 37°C for 12 to 48 h. In the following experiments, the inhibitor chetomin (CHT, 100 nM; Selleck, S7939) and 3-MA (5 mM; Selleck, S2767) were added 1 h before the CoCl2 treatment. Bafilomycin A1 (BafA1, 100 nM; Selleck, S1413) was used in the last 4 h of hypoxic and compression treatment.
Colony formation assay
One hundred cells from passage 1 to passage 4 were seeded in each 10-cm dish and cultured in complete medium for 14 days with the medium changed each other day. The crystal violet (Solarbio, C8470) staining was used for visualizing the colonies formed by NPSCs. Clusters with a diameter larger than 2 mm were were analyzed and counted with ImageJ v1.51k software. This experiment was conducted for three times.
Surface markers detection
For surface marker detection, the 1st passage of NPSCs was suspended to 1.5 million cells/mL with PBS (Gibco, 10,010,049) and aliquoted into 200 µL per tube (BD Biosciences, 352,052). After centrifugation and resuspension, cells were incubated with antibody of CD90 (1:1000; Abcam, ab226), NT5E/CD73 (1:1000; BD Biosciences, 551,123), CD44 (1:1000; Abcam, ab189524), CD34 (1:1000; Abcam, ab81289) and HLA-DR (1:1000; Abcam, ab92511) at 37°C for 1 h. The labeled cells were rinsed and then marked by secondary antibodies at 37°C for 20 min. The cells without secondary antibodies were performed as negative control. A minimum of three samples was analyzed for each surface marker. Cells were washed twice and resuspended in 200 μL FACS-Buffer. Samples were analyzed by flow cytometry (BD Biosciences, USA).
Differentiation assays
The osteogenic, adipogenic, and chondrogenic differentiation were induced to assess the multi-lineage differentiation potency. Before the osteogenic induction, 2 × 10⁴ isolated cells were seeded in the 1% gelatin (Cyagen, GLT-11,301)-coated 24-well plates and grown to 80% confluent. The osteogenic differentiation medium (Cyagen, RASMX-90,021) was changed each other day. The calcium nodules were stained with Alizarin Red (Cyagen, RASMX-90,021) after 3-week induction. The adipogenic induction began when cell culture reaches complete confluent. The isolated cells were cultured in adipogenic differential medium A (Cyagen, RASMX-90,031) for 3 days and then maintained with adipogenic differential medium B (Cyagen, RASMX-90,031) for 1 day. After 4 cycles, the cells were cultured with B medium for fat synthesis before the droplet detection. Then, the cultures were fixed with 4% paraformaldehyde and stained with Oil Red O (Cyagen, RASMX-90,031). For chondrogenic differentiation, 2.5 × 10⁵ cells were centrifuged at 450 × g, 5 min to form cell pellets, and the three-dimension induction was performed with chondrogenic differentiation medium (Cyagen, RASMX-9004) in 15 mL centrifuge tubes. Two weeks later, the pellets were formalin-fixed, paraffin-embedded, and sliced for Safranin O (Solarbio, S8020) staining. The monolayer chondrogenic differentiation induction assay was also performed, and the cells were stained with Alcian Blue (Cyagen, RASMX-9004) after the two-week induction. The isolated cells were cultured in 10% FBS-DMEM/F12 and were stained to serve as the control.
Cell compression apparatus
The cell compression apparatus (ZL 201,120,082,425.3) inside which cells can be cultured under hydrostatic pressure was used to simulate the load on human lumbar disc as previously described [Citation16,Citation44]. Culture plates and dishes were put into the gas-tight chamber. Then the whole apparatus was placed into a thermotank at 37°C. The partial pressure of carbon dioxide (CO2) was stabilized at near 50.0 KPa (5% of standard atmospheric pressure) by filling 460 mL CO2 gas (measured with a rotameter) into the 8.6 L apparatus. The pressure inside the chamber was then increased to 1.0 MPa by an air compressor in settled protocols.
Cell viability assay
The NPSCs viability was detected by cell counting kit-8 assays (CCK-8; Dojindo, CK04) following the manufacture’s instruction. Briefly, NPSCs were seeded into 96-well plates at a density of 5 × 10³ cells per well. After treatment with different reagents, the culture medium in each well was replaced with 100 μL CCK-8 detection solution (90 μL fresh medium mixed with 10 μL CCK-8 solution). The time of color reaction with CCK-8 in each test was fixed to 2 h to avoid irrelevant variables. Optical density (OD) values were detected with a spectrophotometer (Bio‐Tek, VT, USA) at 450 nm.
Apoptosis rate detection
The apoptosis rate of NPSCs was determined using ANXA5‐FITC Apoptosis Detection Kits (Keygen Biotech, KGA106). Cells were harvested and stained following the manufacturer’s instructions and analyzed by flow cytometry. Apoptosis rates were calculated as the sum of early-apoptotic (ANXA5+ PI−) cells and late-apoptotic (ANXA5+ PI+) cells.
JC-1 Probe staining
The mitochondrial membrane potential (MMP) changes of NPSCs after treatment was detected with JC-1 fluorescent probe (Beyotime, C2006). The working solution was prepared following the manufacture’s instruction at 37°C. Cells were incubated with 500 µL working solution for 20 min at 37°C. After rinsed twice with a pre-cooled buffer solution, the fluorescence images were captured with a fluorescence microscope. The mitochondria with higher potential were labeled with red fluorescence. The lower potential mitochondria, which indicate an early stage of apoptosis, were labeled with green fluorescence. The MMP is expressed as the ratio of red fluorescence intensity to green fluorescence intensity.
Protein extraction and western blot
After treatment, cells were immediately placed on ice and washed twice with PBS. Cell lysates were prepared with the RIPA (Solarbio, R0020) supplemented with Protease Inhibitor Cocktail (Beyotime, P1005). Protein concentration was determined using the BCA kit (Beyotime, P0012). Total proteins collected in SDS-PAGE sample buffer (Beyotime, P0015) were electrophoresed on 10%-12% SDS-PAGE gel (Beyotime, P0012A) and transferred to PVDF membranes (Millipore, IPVH00010). Membranes were blocked with 5% skim milk (Solarbio, D8340) in TBST (Solarbio, T1081) for 60 min. After blocking, the membranes were incubated overnight at 4°C with the corresponding primary antibodies of HIF1A (1:500; NOVUS, NB100-105), CASP3 (1:1000; Proteintech, 19,677-1-AP), BCL2 (1:1000; Abcam, ab196495), BAX (1:1000; Cell Signaling Technology, 2772), LC3B (1:1000; Sigma-Aldrich, L7543), BECN1 (1:1000; Cell Signaling Technology, 3495), SQSTM1/p62 (1:1000; Abcam, ab109012), ATG7 (1:1000; Cell Signaling Technology, 8558), TUBB (1:1000; Cell Signaling Technology, 2146), BNIP3 (1:1000; Cell Signaling Technology, 3769) HMOX1 (1:1000; Proteintech, 10,701-1-AP), HK2 (1:1000; Proteintech, 22,029-1-AP), SLC2A1 (1:1000; Preoteintech, 21,829-1-AP). HRP-conjugated secondary antibodies (1:5000; Proteintech, SA00001-1, SA00001-2) were then applied. Immunoblotting was finally detected by UVP ChemiDoc-It Imaging System (UVP, CA, USA) after adding the enhanced chemiluminescence detection kit (Affinity, KF003) to the membranes. The integrated density of each blot was measured using ImageJ software.
Transmission electron microscopy
The ultrastructure of NPSCs was examined with TEM after 48-h compression treatment with or without CoCl2 and then compared with the control group. All cells were collected into a pellet and fixed with 2.5% glutaraldehyde (Sinopharm, 30,092,436). The samples were then post-fixed for 2 h with 1% osmium tetroxide (Sinopharm, Alfa-012103), followed by dehydration with graded ethanol (Sinopharm, 10,009,218). After infiltration and embedding with epon 812 (Sinopharm, 30,081,682), the pellets were sliced into ultrathin sections (Leica, German) and examined by Tecnai G2 20 TWIN (FEI, USA).
Cell immunofluorescence staining
After treatment, the cells were rinsed with PBS, fixed with 4% paraformaldehyde (Servicebio, G1101) and then permeabilized with 0.3% Triton X-100 (Solarbio, T8200) for 15 min. The heterogenetic antigen was blocked with 10% goat serum (Boster, AR1009). Slides were incubated with antibodies of LC3B (1:200; Sigma-Aldrich, L7543) at 4°C overnight. The conjugated secondary antibody (donkey anti-rabbit IgG: 1:500; Abcam, ab150064) were combined with the labeled cells at room temperature for 1 h. DAPI was used for nucleus staining. Then we took images using an inversion fluorescence microscope and quantified LC3 puncta as number per cell with ImageJ software.
Cell Transfection
With AdV-mRFP-GFP-LC3 (Hanbio, HB-AP210 0001), the autophagy flux was assessed. Colocalization of both GFP and RFP fluorescence indicates an autophagosome, while the RFP punctum without GFP indicates an autolysosome. The transfection efficiency was determined by fluorescence microscopy. Images of multiple cells from 3 independent experiments were imaged by fluorescence microscopy. The number of puncta per cell was quantified from the original confocal images.
NPSCs were transfected with small interfering RNAs (siRNA; RiboBio, Guangzhou, China) targeting rat Atg7 (5′-GCAUCAUCUUUGAAGUGAA-3′), Bnip3 (5′-CCAACAGAGCTGAAATAGA-3′), Hmox1 (5′-GGGTGACAGAAGAGGCTAA-3′) or Slc2a1 (5′-CAACGAGCATCTTCGAGAA-3′) using Lipofectamine RNAiMAX Transfection Reagent (Invitrogen, 13,778,150) reagent. A negative control (NC) siRNA (5′-AUGAAGTGAAUUGCUCAA-3′) was used as control. After 12-h transfection, the supernatant was replaced with the culture medium. NPSCs were transfected with Lentivirus (Lv)-HIF1A-GFP (the Genechem Company, Shanghai, China) at a multiplicity of infection (MOI) of 60 and Ad-RFP-LC3 (MOI = 300; Hanbio, China) for 8 h, respectively. The Lv-NC-GFP was served as negative control. Before further experiments, the efficacy of the gene knockdown and expression level of HIF1A was measured by qRT-PCR and western blot analysis.
qRT-PCR
The total RNA was extracted with Trizol (Invitrogen, 15,596,018). Then the RNA was reverse transcribed into cDNA with PrimeScript RT Master Mix Kit (TaKaRa, RR036A). The Real-time polymerase chain reactions (RT-PCRs) were conducted with the ABI StepOnePlus Real-Time PCR System (Applied Biosystems, CA, USA) and the SYBR Premix Ex Taq (TaKaRa, RR420A). The mRNA levels were normalized to the amounts of the house-keeping gene, Actb. The primers were designed as follows:
Hif1α: 5′‐TGTGAACCCATTCCTCATCCA‐3′, 5′‐GGCTCATAACCCATCAACTCA‐3′; Atg7: 5′‐GTGTACGATCCCTGTAACCTAACCC‐3′; 5′‐CGAAAGCAGAGAACTTCAACAGACT‐3′; Hmox1: 5′-GCATGTCCCAGGATTTGTCC-3′, 5′-GGTTCTGCTTGTTTCGCTCT-3′; Bnip3: 5′-GGTCAAGTCGGCCAGAAAAT-3′, 5′-TTGTCAGACGCCTTCCAATG-3′; Slc2a1: 5′-CTTATTGCCCAGGTGTTCGG-3′, 5′-TGCCGACCCTCTTCTTTCAT-3′; Actb: 5′‐CGTTGACATCCGTAAAGACCTC‐3′, 5′‐TAGGAGCCAGGGCAGTAATCT‐3′.
TUNEL staining
The apoptotic cells were detected by One Step TUNEL Apoptosis Assay Kit (Beyotime, C1090) following the manufacturer’s instructions. After incubated with the TUNEL regent in the dark for 1 h at 37°C, cells were stained with DAPI. Apoptotic cells showed red fluorescence. Images of multiple cells from 3 independent experiments were obtained with a microscope.
Label-free proteomics
Briefly, a total of 100 μg protein was taken from each group by dithiothreitol (DTT) reduction and iodoacetamide (IAA) alkylation, then digested with trypsin at a ratio of 1:50 overnight at 37°C. The digested peptides were subsequently desalted, dried, and resuspended in 0.1% formic acid (FA) to 1 μg/μL, and the peptides were analyzed on a nano-scale liquid chromatographic tandem mass spectrometry (nLC-MS/MS) system (Easy-nLC 1200, Thermo Scientific) coupled to a Q-Exactive (Thermo Scientific). The desalted peptides were separated on a 15-cm long C18 column with an inner diameter of 100 μm (3 M, USA) using a gradient of buffer A (Ultrapure water, 0.1% FA H2O, 2% Acetonitrile) and buffer B (0.1% FA, 70% Acetonitrile) at a flow rate of 300 nL/min. The scanning mode of mass spectrometry is data-dependent acquisition mode (DDA) and the precursors from 350 to 1600 m/z were scanned for MS/MS. Three biological replicates of each sample were performed.
Bioinformatics analysis
The raw mass-spectrometric (MS) data were analyzed using MaxQuant 1.6.10 to perform spectra match of peptides or proteins in Uniprot database. The false discovery rates (FDR) for peptide and protein identifications were set to 1%. The maximum allowed missed cleavage was set as two, and at least two unique peptide matches were required for each protein. The differentially expressed proteins (DEPs) were defined as follows: the ratio cutoff of their expression level between CMP+HX and CMP group that were 1.2 (upregulated) or 0.8 (downregulated), and the cutoff of p-value for three biological replicates of each sample was 0.05. The functional enrichment analysis for DEPs was carried out via the R package clusterProfiler [Citation87] and the protein-protein interaction (PPI) network was generated using the database STRING v11 and the software Cytoscape 3.7.2.
In vivo model of IVD degeneration in rat caudal discs
An experimental model of IDD was designed similarly as previously described [Citation58]. Sprague-Dawley rats (8- to 12-weeks old, skeletally mature) were instrumented with the compression-loading apparatus. Briefly, under general anesthesia by intraperitoneal injection of 3.5% chloral hydrate (10 mL/kg; Sinopharm, 30,037,516), carbon fiber rings were attached to caudal vertebra C8 and C10, using sterile 0.8-mm Kirschner wires. Axial loading was applied using four 0.50-N/mm calibrated springs installed over each rod. The shape variable (∆L) of each spring was calculated according to the equation list below to set the pressure as 1.3 MPa. The time of operation was less than 30 min per animal. Sham animals had surgically attached rings and were kept under identical conditions but did not wear the loading apparatus and did not experience any loading except small magnitudes and durations during measurements of mechanical properties.
Cell labeling
NPSCs were stained with 1,1-dioctadecyl-3,3,3,3-tetramethyl indotricarbocyanine Iodide (DiR Iodide, 10 μg/mL; AAT Bioquest, AAT-22,070) as previously described [Citation88]. Cells were then resuspended in PBS at a density of 2 × 10⁶ cells/mL and then kept on ice before transplantation.
NPSC intra-disc transplantation in vivo
One week after the operation (with or without compression on caudal discs), SD rats (8- to 12-weeks old, n=20 per group) were randomly divided into seven groups: (A) Lv-HIF1A-NPSC group: NPSCs overexpressing HIF1A (1×10⁴ cells) labeled with DiR Iodide were transplanted into the C8/9 disc. (B) Lv-NC-NPSC group: Lv-NC-NPSC labeled with DiR Iodide were transplanted into the same disc. (C) NPSC group: Normal NPSCs without transfection labeled with DiR Iodide were transplanted into the same disc. (D) PBS group: Same volume of PBS (5 μL) was injected. (E) Experimental group: The loading apparatus were kept without any injection. (F) Sham Group: The group was subjected to the same procedure as experimental animals but did not experience any loading. (G) Control group: Animals received no treatment. The intra-disc injection was conducted on C8/9 IVD, using a 33-gauge needle (Hamilton, Switzerland). C9/10 disc under compression was served as self-control.
Analyze of disc
X-Ray was conducted at 7 days after operation using the In Vivo Imaging System (Bruker MI, Germany). Near infra-red in-vivo imaging was performed at 1, 3, 7, 14 days after intra-disc transplantation with In Vivo Imaging System (Bruker MI, Germany). Net density of the intensity of each segment was calculated using the Bruker MI analysis program. At 7, 14, 21, 28 days after operation, both the injected and non-injected motion-segments of the two pressurized caudal vertebras were gathered and fixed with 4% paraformaldehyde. Then the tissues were decalcification and sliced into 4 μm sections for histology and immunostaining assays. Images were documented under fluorescent or bright-field microscope (Olympus, IX71, Japan). We used the histological grading system established by Masuda et al. [Citation60] to evaluate the extent of disc degeneration according to multiple pictures of the H&E stained and the Safranin O-Fast Green stained tissue sections in a blinded manner. This system is based on four categories (annulus fibrosus, the border between the annulus fibrosus and nucleus pulposus, cellularity of the nucleus pulposus, and matrix of the nucleus pulposus) of degenerative changes with scores ranging from 1 to 3 points in each category.
Statistical analysis
All data were presented as the mean ± square deviation (unless indicated otherwise). At least 3 independent experiments were conducted, and the data were analyzed using GraphPad Prism (GraphPad Software Inc, CA, USA). Student’s t-tests were performed to analyze the statistical significance between two groups. Statistical significance among multiple groups was determined by multiple comparisons with ANOVA followed by Tukey post hoc tests and multiple comparisons. When analyzing puncta area percentage, the Kruskal-Wallis test was applied, followed by ANOVA and multiple comparisons on the Ranks. *, p < 0.05 was considered statistically significant.
Supplemental Material
Download Zip (15.5 MB)Acknowledgments
I would like to thank Pei Zhang and An-Na Du from The Core Facility and Technical Support, Wuhan Institute of Virology, for her help with producing TEM micrographs.
Disclosure statement
The authors declare that there are no conflicts of interest.
Supplementary material
Supplemental data for this article can be accessed here.
Additional information
Funding
Related Research Data
References
- Dagenais S, Caro J, Haldeman S. A systematic review of low back pain cost of illness studies in the United States and internationally. Spine J. 2008 Jan-Feb;;8(1):8–20.
- Wilson Zingg R, Obesity KR, Disease V. Lumbar disk degeneration: associations of comorbidities in low back pain. PM & R J Inj Funct Rehabilitat. 2017 Apr;;9(4):398–402.
- Sakai D, Andersson GB. Stem cell therapy for intervertebral disc regeneration: obstacles and solutions. Nat Rev Rheumatol. 2015 Apr;;11(4):243–256.
- Feng G, Yang X, Shang H, et al. Multipotential differentiation of human anulus fibrosus cells: an in vitro study. J Bone Joint Surg Am. 2010 Mar;;92(3):675–685.
- Henriksson HB, Svala E, Skioldebrand E, et al. Support of concept that migrating progenitor cells from stem cell niches contribute to normal regeneration of the adult mammal intervertebral disc: a descriptive study in the New Zealand white rabbit. Spine (Phila Pa 1976). 2012; Apr 20 37(9):722–732.
- Shi R, Wang F, Hong X, et al. The presence of stem cells in potential stem cell niches of the intervertebral disc region: an in vitro study on rats. Eur Spine J. 2015 Nov;;24(11):2411–2424.
- Wang F, Shi R, Cai F, et al. Stem cell approaches to intervertebral disc regeneration: obstacles from the disc microenvironment. Stem Cells Dev. 2015; Nov 1 24(21):2479–2495.
- Suzuki S, Fujita N, Hosogane N, et al. Excessive reactive oxygen species are therapeutic targets for intervertebral disc degeneration. Arthritis Res Ther. 2015 Nov ;5(17):316.
- Liu J, Tao H, Wang H, et al. Biological behavior of human nucleus pulposus mesenchymal stem cells in response to changes in the acidic environment during intervertebral disc degeneration. Stem Cells Dev. 2017; Jun 15 26(12):901–911.
- Ma K, Chen S, Li Z, et al. Mechanisms of endogenous repair failure during intervertebral disc degeneration. Osteoarthritis Cartilage. 2019 Jan;;27(1):41–48.
- Roberts S, Evans H, Trivedi J, et al. Histology and pathology of the human intervertebral disc. J Bone Joint Surg Am. 2006 Apr;;88(Suppl 2):10–14.
- Vergroesen PP, Kingma I, Emanuel KS, et al. Mechanics and biology in intervertebral disc degeneration: a vicious circle. Osteoarthritis Cartilage. 2015 Jul;;23(7):1057–1070.
- Setton LA, Chen J. Mechanobiology of the intervertebral disc and relevance to disc degeneration. J Bone Joint Surg Am. 2006 Apr;;88(Suppl 2):52–57.
- Freemont AJ. The cellular pathobiology of the degenerate intervertebral disc and discogenic back pain. Rheumatology (Oxford). 2009 Jan;;48(1):5–10.
- Li Z, Chen S, Chen S, et al. Moderate activation of Wnt/beta-catenin signaling promotes the survival of rat nucleus pulposus cells via regulating apoptosis, autophagy, and senescence. J Cell Biochem. 2019 Aug;;120(8):12519–12533.
- Liang H, Chen S, Huang D, et al. Effect of compression loading on human nucleus pulposus-derived mesenchymal stem cells. Stem Cells Int. 2018;2018:1481243.
- Merceron C, Mangiavini L, Robling A, et al. Loss of HIF-1alpha in the notochord results in cell death and complete disappearance of the nucleus pulposus. PLoS One. 2014;9(10):e110768.
- Semenza GL. Hypoxia-inducible factor 1: oxygen homeostasis and disease pathophysiology. Trends Mol Med. 2001 Aug;7(8):345–350.
- Qureshi-Baig K, Kuhn D, Viry E, et al. Hypoxia-induced autophagy drives colorectal cancer initiation and progression by activating the PRKC/PKC-EZR (ezrin) pathway. Autophagy. 2019 ;27:1–17.
- Blagosklonny MV, Hypoxia MTO. R and autophagy: converging on senescence or quiescence. Autophagy. 2013 Feb 1;9(2):260–262.
- Bellot G, Garcia-Medina R, Gounon P, et al. Hypoxia-induced autophagy is mediated through hypoxia-inducible factor induction of BNIP3 and BNIP3L via their BH3 domains. Mol Cell Biol. 2009 May;29(10):2570–2581.
- Wu H, Chen Q. Hypoxia activation of mitophagy and its role in disease pathogenesis. Antioxid Redox Signal. 2015 Apr 20;22(12):1032–1046.
- Garcia-Prat L, Martinez-Vicente M, Perdiguero E, et al. Autophagy maintains stemness by preventing senescence. Nature. 2016 ; Jan 7 529(7584):37–42.
- Ho TT, Warr MR, Adelman ER, et al. Autophagy maintains the metabolism and function of young and old stem cells. Nature. 2017; Mar 9 543(7644):205–210.
- Chacko SM, Ahmed S, Selvendiran K, et al. Hypoxic preconditioning induces the expression of prosurvival and proangiogenic markers in mesenchymal stem cells. Am J Physiol Cell Physiol. 2010 Dec;;299(6):C1562–70.
- Han YS, Lee JH, Yoon YM, et al. Hypoxia-induced expression of cellular prion protein improves the therapeutic potential of mesenchymal stem cells. Cell Death Dis. 2016 ; Oct 6 7(10):e2395.
- Nerlich AG, Schaaf R, Walchli B, et al. Temporo-spatial distribution of blood vessels in human lumbar intervertebral discs. Eur Spine J. 2007 Apr;;16(4):547–555.
- Pai RR, D’sa B, Raghuveer CV, et al. Neovascularization of nucleus pulposus. A diagnostic feature of intervertebral disc prolapse. Spine (Phila Pa 1976). 1999; Apr 15 24(8):739–741.
- Jiang BH, Zheng JZ, Leung SW, et al. Transactivation and inhibitory domains of hypoxia-inducible factor 1alpha. Modulation of Transcriptional Activity by Oxygen Tension. J Biol Chem. 1997; Aug 1 272(31):19253–19260.
- Maroudas A, Stockwell RA, Nachemson A, et al. Factors involved in the nutrition of the human lumbar intervertebral disc: cellularity and diffusion of glucose in vitro. J Anat. 1975 Sep;;120(Pt 1):113–130.
- Sun H, Qi L, Wang S, et al. Hydrogen sulfide is expressed in the human and the rat cultured nucleus pulposus cells and suppresses apoptosis induced by hypoxia. PLoS One. 2018;13(2):e0192556.
- Jiang LB, Cao L, Ma YQ, et al. TIGAR mediates the inhibitory role of hypoxia on ROS production and apoptosis in rat nucleus pulposus cells. Osteoarthritis Cartilage. 2018 Jan;;26(1):138–148.
- Nasto LA, Robinson AR, Ngo K, et al. Mitochondrial-derived reactive oxygen species (ROS) play a causal role in aging-related intervertebral disc degeneration. J Orthopaedic Res. 2013 Jul;;31(7):1150–1157.
- Marsano A, Medeiros da CCM, Ghanaati S, et al. Spontaneous in vivo chondrogenesis of bone marrow-derived mesenchymal progenitor cells by blocking vascular endothelial growth factor signaling. Stem Cells Transl Med. 2016 Dec;5(12):1730–1738.
- Adesida AB, Mulet-Sierra A, Jomha NM. Hypoxia mediated isolation and expansion enhances the chondrogenic capacity of bone marrow mesenchymal stromal cells. Stem Cell Res Ther. 2012 Mar 2;3(2):9.
- Boos N, Weissbach S, Rohrbach H, et al. Classification of age-related changes in lumbar intervertebral discs: 2002 volvo award in basic science. Spine (Phila Pa 1976). 2002; Dec 1 27(23):2631–2644.
- Pfirrmann CW, Metzdorf A, Zanetti M, et al. Magnetic resonance classification of lumbar intervertebral disc degeneration. Spine (Phila Pa 1976). 2001; Sep 1 26(17):1873–1878.
- Sakai D, Nakamura Y, Nakai T, et al. Exhaustion of nucleus pulposus progenitor cells with ageing and degeneration of the intervertebral disc. Nat Commun. 2012;3:1264.
- Lee JH, Choi SH, Baek MW, et al. CoCl2 induces apoptosis through the mitochondria- and death receptor-mediated pathway in the mouse embryonic stem cells. Mol Cell Biochem. 2013 Jul;379(1–2):133–140.
- Fung FK, Law BY, Lo AC. Lutein attenuates both apoptosis and autophagy upon cobalt (ii) chloride-induced hypoxia in rat muller cells. PLoS One. 2016;11(12):e0167828.
- Johnson WE, Stephan S, Roberts S. The influence of serum, glucose and oxygen on intervertebral disc cell growth in vitro: implications for degenerative disc disease. Arthritis Res Ther. 2008;10(2):R46.
- Bartels EM, Fairbank JC, Winlove CP, et al. Oxygen and lactate concentrations measured in vivo in the intervertebral discs of patients with scoliosis and back pain. Spine (Phila Pa 1976). 1998 Jan 1;23(1):1–7. discussion 8.
- Hutton WC, Elmer WA, Boden SD, et al. The effect of hydrostatic pressure on intervertebral disc metabolism. Spine (Phila Pa 1976). 1999; Aug 1 24(15):1507–1515.
- Chen S, Lv X, Hu B, et al. RIPK1/RIPK3/MLKL-mediated necroptosis contributes to compression-induced rat nucleus pulposus cells death. Apoptosis. 2017 May;22(5):626–638.
- Ding F, Shao ZW, Yang SH, et al. Role of mitochondrial pathway in compression-induced apoptosis of nucleus pulposus cells. Apoptosis. 2012 Jun;17(6):579–590.
- Staab A, Loeffler J, Said HM, et al. Effects of HIF-1 inhibition by chetomin on hypoxia-related transcription and radiosensitivity in HT 1080 human fibrosarcoma cells. BMC Cancer. 2007; Nov 13;7:213.
- Viziteu E, Grandmougin C, Goldschmidt H, et al. Chetomin, targeting HIF-1alpha/p300 complex, exhibits antitumour activity in multiple myeloma. Br J Cancer. 2016 ; Mar 1 114(5):519–523.
- Klionsky DJ, Abdelmohsen K, Abe A, et al. Guidelines for the use and interpretation of assays for monitoring autophagy (3rd edition). Autophagy. 2016;12(1):1–222.
- Han X, Sun S, Sun Y, et al. Small molecule-driven NLRP3 inflammation inhibition via interplay between ubiquitination and autophagy: implications for parkinson disease. Autophagy. 2019 Nov;15(11):1860–1881.
- Wu YT, Tan HL, Shui G, et al. Dual role of 3-methyladenine in modulation of autophagy via different temporal patterns of inhibition on class I and III phosphoinositide 3-kinase. J Biol Chem. 2010; Apr 2 285(14):10850–10861.
- Hou H, Zhang Y, Huang Y, et al. Inhibitors of phosphatidylinositol 3’-kinases promote mitotic cell death in HeLa cells. PLoS One. 2012;7(4):e35665.
- Wang X, Wu R, Liu Y, et al. m(6)A mRNA methylation controls autophagy and adipogenesis by targeting Atg5 and Atg7. Autophagy. 2020 Jul;16(7):1221–1235.
- Atg XJ. 7 in development and disease: panacea or pandora’s box? Protein Cell. 2015 Oct;6(10):722–734.
- Schofield CJ, Ratcliffe PJ. Oxygen sensing by HIF hydroxylases. Nat Rev Mol Cell Biol. 2004 May;5(5):343–354.
- Hull TD, Boddu R, Guo L, et al. Heme oxygenase-1 regulates mitochondrial quality control in the heart. JCI Insight. 2016;1(2):e85817.
- Meyer N, Zielke S, Michaelis JB, et al. AT 101 induces early mitochondrial dysfunction and HMOX1 (heme oxygenase 1) to trigger mitophagic cell death in glioma cells. Autophagy. 2018;14(10):1693–1709.
- Bian Q, Ma L, Jain A, et al. Mechanosignaling activation of TGFbeta maintains intervertebral disc homeostasis. Bone Res. 2017;5:17008.
- Hirata H, Yurube T, Kakutani K, et al. A rat tail temporary static compression model reproduces different stages of intervertebral disc degeneration with decreased notochordal cell phenotype. J Orthopaedic Res. 2014 Mar;32(3):455–463.
- Elliott DM, Yerramalli CS, Beckstein JC, et al. The effect of relative needle diameter in puncture and sham injection animal models of degeneration. Spine (Phila Pa 1976). 2008 ; Mar 15 33(6):588–596.
- Masuda K, Aota Y, Muehleman C, et al. A novel rabbit model of mild, reproducible disc degeneration by an anulus needle puncture: correlation between the degree of disc injury and radiological and histological appearances of disc degeneration. Spine (Phila Pa 1976). 2005; Jan 1 30(1):5–14.
- Sheyn D, Ben-David S, Tawackoli W, et al. Human iPSCs can be differentiated into notochordal cells that reduce intervertebral disc degeneration in a porcine model. Theranostics. 2019;9(25):7506–7524.
- Han B, Wang HC, Li H, et al. Nucleus pulposus mesenchymal stem cells in acidic conditions mimicking degenerative intervertebral discs give better performance than adipose tissue-derived mesenchymal stem cells. Cells Tissues Organs. 2014;199(5–6):342–352.
- Hoogendoorn RJ, Lu ZF, Kroeze RJ, et al. Adipose stem cells for intervertebral disc regeneration: current status and concepts for the future. J Cellular Molecul Med. 2008 Dec;12(6A):2205–2216.
- Cao C, Zou J, Liu X, et al. Bone marrow mesenchymal stem cells slow intervertebral disc degeneration through the NF-kappaB pathway. Spine J. 2015 ; Mar 1 15(3):530–538.
- Fearing BV, Hernandez PA, Setton LA, et al. Mechanotransduction and cell biomechanics of the intervertebral disc. JOR Spine. 2018;1:3.
- Yao Y, Deng Q, Song W, et al. MIF plays a key role in regulating tissue-specific chondro-osteogenic differentiation fate of human cartilage endplate stem cells under hypoxia. Stem Cell Reports. 2016; Aug 9 7(2):249–262.
- Willet SG, Lewis MA, Miao ZF, et al. Regenerative proliferation of differentiated cells by mTORC1-dependent paligenosis. Embo J. 2018 ; Apr 3;37:7.
- Pratsinis H, Papadopoulou A, Neidlinger-Wilke C, et al. Cyclic tensile stress of human annulus fibrosus cells induces MAPK activation: involvement in proinflammatory gene expression. Osteoarthritis Cartilage. 2016 Apr;24(4):679–687.
- Fearing BV, Jing L, Barcellona MN, et al. Mechanosensitive transcriptional coactivators MRTF-A and YAP/TAZ regulate nucleus pulposus cell phenotype through cell shape. FASEB J. 2019 Dec;33(12):14022–14035.
- Li Y, Jiang J, Liu W, et al. microRNA-378 promotes autophagy and inhibits apoptosis in skeletal muscle. Proc Natl Acad Sci U S A. 2018 ; Nov 13 115(46):E10849–E10858.
- Choi H, Merceron C, Mangiavini L, et al. Hypoxia promotes noncanonical autophagy in nucleus pulposus cells independent of MTOR and HIF1A signaling. Autophagy. 2016 Sep;12(9):1631–1646.
- Li B, Sun C, Sun J, et al. Autophagy mediates serum starvation-induced quiescence in nucleus pulposus stem cells by the regulation of P27. Stem Cell Res Ther. 2019 ; Apr 15 10(1):118.
- Sun L, Liu N, Liu SS, et al. Beclin-1-independent autophagy mediates programmed cancer cell death through interplays with endoplasmic reticulum and/or mitochondria in colbat chloride-induced hypoxia. Am J Cancer Res. 2015;5(9):2626–2642.
- Martina JA, Chen Y, Gucek M, et al. MTORC1 functions as a transcriptional regulator of autophagy by preventing nuclear transport of TFEB. Autophagy. 2012 Jun;8(6):903–914.
- Palanisamy K, Tsai TH, Yu TM, et al. RNA-binding protein, human antigen R regulates hypoxia-induced autophagy by targeting ATG7/ATG16L1 expressions and autophagosome formation. J Cell Physiol. 2019 May;234(5):7448–7458.
- Zhu Y, Massen S, Terenzio M, et al. Modulation of serines 17 and 24 in the LC3-interacting region of Bnip3 determines pro-survival mitophagy versus apoptosis. J Biol Chem. 2013; Jan 11 288(2):1099–1113.
- Palikaras K, Lionaki E, Tavernarakis N. Mechanisms of mitophagy in cellular homeostasis, physiology and pathology. Nat Cell Biol. 2018 Sep;20(9):1013–1022.
- Daskalaki I, Gkikas I, Tavernarakis N. Hypoxia and selective autophagy in cancer development and therapy. Front Cell Develop Biol. 2018;6:104.
- Park CW, Hong SM, Kim ES, et al. BNIP3 is degraded by ULK1-dependent autophagy via MTORC1 and AMPK. Autophagy. 2013 Mar;9(3):345–360.
- Ekman M, Uvelius B, Albinsson S, et al. HIF-mediated metabolic switching in bladder outlet obstruction mitigates the relaxing effect of mitochondrial inhibition. Lab Investigat. 2014 May;94(5):557–568.
- Morten KJ, Badder L, Knowles HJ. Differential regulation of HIF-mediated pathways increases mitochondrial metabolism and ATP production in hypoxic osteoclasts. J Pathol. 2013 Apr;229(5):755–764.
- Wan G, Xie W, Liu Z, et al. Hypoxia-induced MIR155 is a potent autophagy inducer by targeting multiple players in the MTOR pathway. Autophagy. 2014 Jan;10(1):70–79.
- Wang W, Wang Y, Deng G, et al. Transplantation of hypoxic-preconditioned bone mesenchymal stem cells retards intervertebral disc degeneration via enhancing implanted cell survival and migration in rats. Stem Cells Int. 2018;2018:7564159.
- Chiang ER, Ma HL, Wang JP, et al. Use of allogeneic hypoxic mesenchymal stem cells for treating disc degeneration in rabbits. J Orthop Res. 2019 Jun;37(6):1440–1450.
- Kurakawa T, Kakutani K, Morita Y, et al. Functional impact of integrin alpha5beta1 on the homeostasis of intervertebral discs: a study of mechanotransduction pathways using a novel dynamic loading organ culture system. Spine J. 2015; Mar 1 15(3):417–426.
- Li Z, Chen S, Ma K, et al. Comparison of different methods for the isolation and purification of rat nucleus pulposus-derived mesenchymal stem cells. Connect Tissue Res. 2019;17:1–9.
- Yu G, Wang LG, Han Y, et al. clusterProfiler: an R package for comparing biological themes among gene clusters. OMICS. 2012 May;16(5):284–287.
- Huang B, Qian J, Ma J, et al. Myocardial transfection of hypoxia-inducible factor-1alpha and co-transplantation of mesenchymal stem cells enhance cardiac repair in rats with experimental myocardial infarction. Stem Cell Res Ther. 2014 ; Feb 7 5(1):22.