
ABSTRACT
Macroautophagy (hereafter referred to as “autophagy”) is a lysosome-mediated degradation process that plays a complex role in cellular stress, either promoting survival or triggering death. Early studies suggest that ferroptosis, an iron-dependent form of regulated cell death, is not related to autophagy. Conversely, recent evidence indicates that the molecular machinery of autophagy facilitates ferroptosis through the selective degradation of anti-ferroptosis regulators. However, the mechanism of autophagy-dependent ferroptosis remains incompletely understood. Here, we examine the early dynamic change in protein expression of autophagic (e.g., MAP1LC3B and SQSTM1) or ferroptotic (e.g., SLC7A11 and GPX4) regulators in 60 human cancer cell lines in response to two classical ferroptosis activators (erastin and RSL3) in the absence or presence of the lysosomal inhibitor chloroquine. Compared to erastin, RSL3 exhibits wider and stronger activity in the upregulation of MAP1LC3B-II or downregulation of SQSTM1 in 80% (48/60) or 63% (38/60) of cell lines, respectively. Both RSL3 and erastin failed to affect SLC7A11 expression, but they led to GPX4 downregulation in 12% (7/60) and 3% (2/60) of cell lines, respectively. Additionally, the intracellular iron exporter SLC40A1/ferroportin-1 was identified as a new substrate for autophagic elimination, and its degradation by SQSTM1 promoted ferroptosis in vitro and in xenograft tumor mouse models. Together, these findings show tumor heterogeneity in autophagy-dependent ferroptosis, which might have different biological behaviors with regard to the dynamic characteristics of cell death.
Abbreviations: ATG: Autophagy-related; CQ: Chloroquine; GPX4: Glutathione peroxidase 4; MAP1LC3B/LC3: Microtubule-associated protein 1 light chain 3 beta: NCOA4: Nuclear Receptor Coactivator 4; ROS: Reactive Oxygen Species; SLC40A1/ferroportin-1: Solute Carrier family 40 Member 1; SLC7A11: Solute Carrier Family 7 Member 11; SQSTM1/p62: Sequestosome 1
Introduction
Macroautophagy (hereafter referred to as “autophagy”) is a conserved cellular pathway characterized by the formation of lipid-related membrane structures (e.g., phagophores, autophagosomes, and autolysosomes) that function to engulf and degrade various cargos (e.g., superfluous proteins, damaged organelles, or invading pathogens), and it plays a major role in human health and disease, including malignant tumors [Citation1–3]. The fine-tuning of this process is orchestrated by a family of autophagy-related (ATG) proteins, which involves a complicated array of protein-protein interactions and various posttranslational modifications [Citation4,Citation5]. In particular, the switch of the ubiquitin-like protein MAP1LC3/LC3 (microtubule-associated protein 1 light chain 3) from MAP1LC3-I (the cytosolic form) to MAP1LC3-II (the membrane-bound form) drives autophagosome formation [Citation6], whereas the autophagy substrate SQSTM1/p62 (sequestosome 1) is one of the major receptors responsible for selective autophagy that functions by interacting simultaneously with cargoes and MAP1LC3 [Citation7]. Consequently, a stressful situation can trigger a protective autophagic response to maintain homeostasis for cell survival [Citation8,Citation9]. However, uncontrolled or impaired autophagy may be harmful to cellular function, leading to death [Citation10,Citation11]. This type of regulated cell death was named autophagy-dependent cell death by the Nomenclature Committee on Cell Death, a key point of the definition being that the components of the autophagy machinery induce cell death [Citation12]. Understanding the phenotype and function of autophagy in survival and death is important for the development of effective anticancer strategies [Citation13].
Cell death occurs in various forms, which display different hallmarks that underly their molecular mechanisms and signal pathways [Citation14]. The recently identified process of ferroptosis, an iron-dependent form of non-apoptotic cell death [Citation15,Citation16], provides an example for exploring the role of autophagy in driving cell death [Citation17]. Although the exact effector molecule for it remains unidentified, ferroptosis can be initiated by the activation of iron accumulation or the inhibition of a specific antioxidant system, which results in lipid peroxidation, the metabolic process of oxidative degradation of lipids [Citation18–20]. Oxidative stress and the resulting lipid peroxidation products (e.g., malondialdehyde [MDA] and 4-hydroxynonenal) are involved in the induction of autophagosome formation [Citation21–23]. An excessive activation of autophagy seems to be an important driver of ferroptosis [Citation17,Citation24,Citation25]. Specifically, certain selective types of autophagy (e.g., ferritinophagy [Citation26–28], lipophagy [Citation29], clockophagy [Citation30,Citation31], and chaperone-mediated autophagy [Citation32]), facilitate ferroptotic cancer cell death through the degradation of ferroptosis repressors (e.g., ferritin, ARNTL/BMAL1 [aryl hydrocarbon receptor nuclear translocator-like], GPX4 [glutathione peroxidase 4], and lipid droplets), regulating iron or lipid metabolism. Moreover, the depletion of key autophagy genes, such as ATG5, ATG7, BECN1, and MAP1LC3B, inhibits ferroptotic cancer cell death [Citation17,Citation33–37]. However, most of the studies showing this focused on the impact of autophagy in the late stage of the process of ferroptosis, and did not explicitly consider the early response to autophagy-dependent ferroptosis. Additionally, the mixed types of cell death associated with autophagy may be more common in the late stage of oxidative damage [Citation38–43], increasing the complexity and uncertainty of interpretation of results.
In the present study, we examined how tumor heterogeneity regulates autophagy-dependent ferroptosis, and its implications for tumor therapy. We also demonstrated that SLC40A1/ferroportin-1 (solute carrier family 40 member 1) was a new autophagic substrate, contributing to ferroptosis resistance. Targeting autophagy-dependent SLC40A1 degradation enhances ferroptosis-mediated tumor suppression in vitro and in vivo.
Results
Relationship between the autophagy markers and ferroptosis regulators in 60 human cancer cell lines
There are two classical ferroptosis activators, namely erastin and RSL3, that function as potential inhibitors of the cystine/glutamate antiporter SLC7A11/xCT/system xc− or the antioxidant enzyme GPX4, respectively [Citation44]. We used western blot analysis to examine the level and frequency of an early change in markers and/or components of the autophagy machinery (e.g., MAP1LC3B and SQSTM1) and ferroptosis (e.g., SLC7A11 and GPX4) in human cancer cell lines following treatment with erastin (20 µM) or RSL3 (0.5 µM) for 3 and 6 h (). We established protein expression profiles for 60 human cancer cell lines, including breast (n = 4), bone (n = 3), bladder (n = 3), central nervous system (n = 3), cervix (n = 2), colon (n = 4), gastric (n = 2), leukemia (n = 2), liver (n = 3), lung (n = 5), melanoma (n = 5), ovarian (n = 11), pancreas (n = 7), prostate (n = 2), and renal (n = 4) cancer cells ().
Figure 1. Protein expression profiles of MAP1LC3B-II, SQSTM1, GPX4, and SLC7A11 in cancer cell lines. (A) Schematic representation of western blot and detection procedures. Sixty cancer cell lines were treated with erastin (20 µM) or RSL3 (0.5 µM) in the absence or presence of chloroquine (CQ, 50 µM) for 3 and 6 h. We collected protein from each cell line in 3 biologically independent samples and mixed them together for western blot analysis. (B) Protein profile of MAP1LC3B-II, SQSTM1, GPX4, and SLC7A11 levels in response to erastin or RSL3 in the indicated cancer cell lines (data are shown in a heat map as the mean of biologically independent samples). The original western blot data are shown in Fig. S1. The relative intensities of the bands from western blots were analyzed and normalized to loading controls using ImageJ software. The cutoffs (P < 0.05) were set to a 25% change in relative intensity compared to the untreated group. Downregulation = relative intensity change of <0.75-fold; upregulation = relative intensity change of >1.25-fold. (C) The frequency assay of the level of MAP1LC3B-II, SQSTM1, GPX4, and SLC7A11 in response to erastin or RSL3 in 60 cancer cell lines (n = 3 biologically independent samples). The cutoffs (P < 0.05) were set to a 25% change in relative intensity compared to the untreated group. Downregulation = relative intensity change of <0.75 fold; upregulation = relative intensity change of >1.25-fold. Yes = changed percentage in 60 cancer cell lines; No = unchanged percentage in 60 cancer cell lines; Yes + No = 100%. (D) The frequency assay of the effects of CQ on the protein level of MAP1LC3B-II, SQSTM1, GPX4, and SLC7A11 in response to erastin or RSL3 in 60 cancer cell lines (n = 3 biologically independent samples). The cutoffs (P < 0.05) were set to a 25% change in relative intensity compared to the untreated group. Downregulation = relative intensity change of <0.75-fold; upregulation = relative intensity change of >1.25-fold. Downregulation + no change + upregulation = 100%
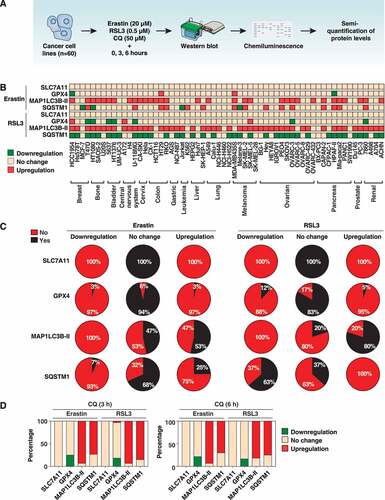
First, all 60 cancer cell lines expressed the MAP1LC3B, SQSTM1, SLC7A11, and GPX4 proteins (Fig. S1). Similarly, an open-access bioinformatic assay of RNA expression data generated in the Human Protein Atlas project (https://www.proteinatlas.org) showed that the basic mRNA expression for MAP1LC3B, SQSTM1, SLC7A11, and GPX4 were, respectively, identified in 100%, 100%, 91%, and 100%, of 65 cancer cell lines. These findings suggest that these genes and proteins are widely expressed in various cancers, regardless of the type of cancer.
Second, the induced change of protein expression of MAP1LC3B-II, SQSTM1, or GPX4 was more visible in response to RSL3, compared to erastin, regardless of tumor types and treatment time (). For example, the level of MAP1LC3B-II was upregulated in 80% and 53% of cell lines in response to RSL3 and erastin, respectively (). RSL3 and erastin did not suppress MAP1LC3B-II production in all cells, indicating that autophagosome formation may not be impaired during the early response to ferroptotic stimulus. It is generally thought that the downregulation of SQSTM1 is a marker, and the consequence, of autophagy activation [Citation45]. However, downregulated SQSTM1 was only observed in 63% and 7% of cell lines following treatment with RSL3 and erastin, respectively (). Whereas the degradation of GPX4 may be a common late event in ferroptosis [Citation32,Citation46–48], our study showed that only 3% and 12% of cell lines presented less GPX4 expression following treatment with erastin and RSL3, respectively. In contrast, 3% and 5% of cell lines were observed to have GPX4 upregulation following treatment with erastin and RSL3, respectively (). Notably, the turnover between the short and long form of the GPX4 protein [Citation49] was observed in certain RSL3-treated cancer cells (Fig. S1), although the mechanism and the function underlying the change of GPX4 size in ferroptosis remain unknown. In parallel, SLC7A11 expression was not changed in the absence or presence of erastin and RSL3 in all cancer cells ().
Third, the single or combined use of chloroquine (CQ) revealed a tumor type-dependent role in the regulation of protein expression of these autophagic or ferroptotic regulators. A fundamental fact is that autophagy is a dynamic process, and monitoring autophagic flux is therefore important to understanding the effects of mutations or drug treatments on autophagy activity [Citation45]. Besides mediating autophagy, MAP1LC3-II and SQSTM1 can be degraded in a lysosome-dependent manner [Citation50,Citation51]. Thus, the lysosomal inhibitor CQ, which is frequently used as an antimalarial agent clinically, can restore MAP1LC3-II and SQSTM1 levels if the cells have an increased autophagic flux [Citation45]. In general, we found that the frequency and levels of erastin- or RSL3-induced MAP1LC3B-II and SQSTM1 (but not GPX4 and SLC7A11) expression were further increased by CQ ().
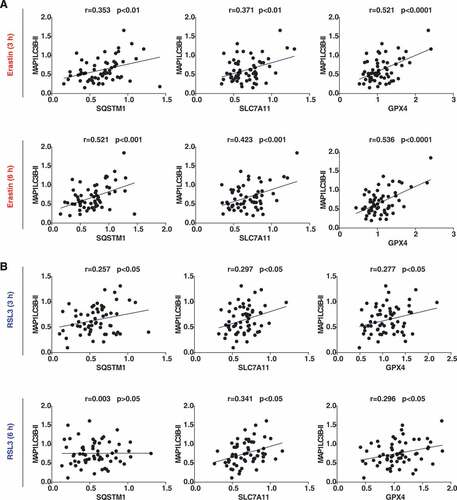
Fourth, we evaluated the relationship between the expression of autophagy markers and ferroptosis regulators after quantifying the intensity of protein bands from western blots (). Within the erastin treatment group, the association of MAP1LC3B-II with SQSTM1 (r = 0.353; P < 0.01), SLC7A11 (r = 0.371; P < 0.01) or GPX4 (r = 0.521; P < 0.0001) was observed at 3 h. Similar relationships were further found between MAP1LC3B-II and SQSTM1 (r = 0.521; P < 0.001), SLC7A11 (r = 0.423; P < 0.001), or GPX4 (r = 0.536; P < 0.0001) groups after cells were treated with erastin for 6 h. Within the RSL3 treatment group, MAP1LC3B-II and SQSTM1 were slightly correlated (r = 0.257; P < 0.05) at 3 h, whereas this relationship was not observed at 6 h (r = 0.003; P > 0.05). Overall, in the early induction of ferroptosis, the protein relationship between MAP1LC3B-II, SLC7A11, and GPX4 was weak.
Figure 2. Relationship between protein level of MAP1LC3B-II with SQSTM1, GPX4, and SLC7A11 in 60 cancer cell lines (n = 3 biologically independent samples). The Pearson correlation coefficient was used to assay the relationship between the indicated two proteins under the indicated conditions after quantifying the intensity of protein bands from western blots
MAP1LC3B-II-inducible cancer cells are sensitive to ferroptosis induction
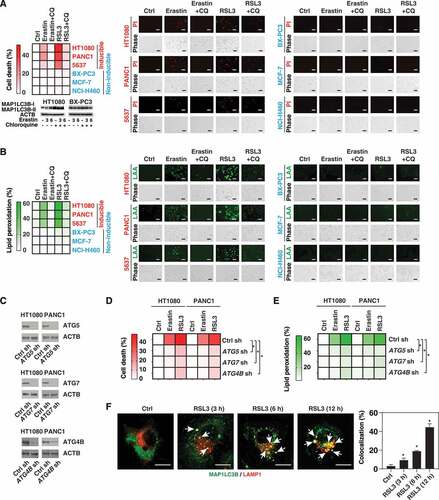
Based on whether cells were induced to produce MAP1LC3B-II in response to erastin or RSL3 ( and ), we divided the cell lines into two groups, namely MAP1LC3B-II–inducible cells (e.g., HT1080, PANC1, and 5637) and MAP1LC3B-II–noninducible cells (e.g., BX-PC3, MCF-7, and NCI-H460). Erastin or RSL3 induced cell death (measured by propidium iodide staining) () and lipid peroxidation (measured by linoleamide alkyne staining) () in MAP1LC3B-II-inducible cells, but not in MAP1LC3B-II-noninducible cells. CQ inhibited erastin- or RSL3-induced cell death () and lipid peroxidation () in HT1080, PANC1, and 5637 cells. Importantly, the knockdown of core autophagy regulators ATG5, ATG7, or ATG4B by shRNA () inhibited cell death () and lipid peroxidation () in HT1080 and PANC1 cells following treatment with erastin or RSL3, indicating that autophagy facilitates ferroptosis. In RSL3-treated PANC1 cells, MAP1LC3B puncta appeared in a time-dependent manner in the cytoplasm and perinuclear region (). RSL3 also caused a time-dependent increase in the colocalization between MAP1LC3B and lysosomes (stained by LAMP1 [lysosomal associated membrane protein 1]) (). These results support previous findings that the components of various cytosolic organelles can be degraded by autophagy during ferroptosis [Citation52].
Figure 3. The role of autophagy in mediating ferroptosis. (A, B) The indicated cancer cell lines were treated with erastin (20 µM) or RSL3 (0.5 µM) in the absence or presence of chloroquine (CQ, 50 µM) for 6 h and then cell death (A) and lipid peroxidation (B) were assayed using propidium iodide (PI) or linoleamide alkyne (LAA) staining, respectively. A representative western blot, PI, or LAA image is shown (bar: 50 μm). Data are shown in a heat map as the mean of biologically independent samples. (C) Western blot analysis of ATG5, ATG7, or ATG4B expression in indicated gene knockdown HT1080 and PANC1 cells. (D, E) Analysis of cell death (D) and lipid peroxidation (E) in the indicated control and autophagy-deficient cells following treatment with erastin (20 µM) or RSL3 (0.5 µM) for 6 h (n = 3 biologically independent samples; *P < 0.05 versus control shRNA group). (F) Analysis of colocalization between MAP1LC3B (shown in green) and LAMP1 (shown in red) in PANC1 cells following treatment with RSL3 (0.5 µM) for 3–12 h (n = 10 random fields; *P < 0.05 versus control group; bar: 15 µm)
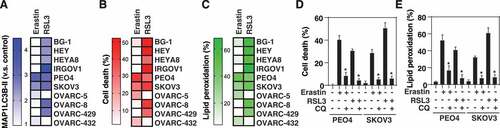
We further tested whether there is a positive relationship between the levels of MAP1LC3B-II, cell death, and lipid peroxidation in 10 ovarian cancer cell lines. In general, the levels of cell death and lipid peroxidation paralleled the MAP1LC3B-II level in ovarian cancer cell lines in response to erastin or RSL3 (). In addition, CQ inhibited erastin- or RSL3-induced cell death and lipid peroxidation in MAP1LC3B-II-inducible ovarian cancer cell lines (PEO4 and SKOV3) (), indicating that ferroptosis may occur in an autophagy-dependent manner.
Figure 4. MAP1LC3B-II–inducible ovarian cancer cell lines are sensitive to ferroptosis. (A-C) Heatmap of the levels of MAP1LC3B-II (A), cell death (B), and lipid peroxidation (C) in 10 ovarian cancer cell lines following treatment with erastin (20 µM) or RSL3 (0.5 µM) for 6 h (data are shown as the mean of 3 biologically independent samples). (D, E) Analysis of cell death (D) and lipid peroxidation (E) in PEO4 and SKOV3 cells following treatment with erastin (20 µM) or RSL3 (0.5 µM) in the absence or presence of chloroquine (CQ, 50 µM) for 6 h (n = 3 biologically independent samples; *P < 0.05 versus erastin or RSL3 group)
Autophagy mediates SLC40A1 degradation during ferroptosis
Because ferroptosis is an iron-dependent form of cell death [Citation53], we investigated the effects of autophagy machinery on the protein expression of iron metabolism-related regulators in HT1080 cells. As a positive control, the knockdown of ATG5 or ATG7 reversed erastin-induced downregulation of FTH1 (ferritin heavy chain 1) (), which is a well-known autophagic substrate that inhibits ferroptosis by storing iron [Citation26–28]. Surprisingly, the protein expression of SLC40A1, the key intracellular iron export protein reported in mammalian cells [Citation54], was also inhibited by erastin (). This erastin-induced SLC40A1 protein downregulation was reversed by the knockdown of ATG5 or ATG7 (). Other iron metabolism-related proteins, such as TFRC (transferrin receptor) and STEAP3 (STEAP3 metalloreductase), were not affected by the knockdown of ATG5 or ATG7 (). Moreover, the pharmacological inhibition of autophagy by CQ or bafilomycin A1 also blocked erastin-induced SLC40A1 protein downregulation (). However, proteasome inhibitors, such as MG132 or carfilzomib, failed to inhibit the downregulation of SLC40A1 by erastin (). These findings suggest that autophagy mediates SLC40A1 degradation during ferroptosis.
Figure 5. Autophagy mediates SLC40A1 degradation during ferroptosis. (A) Analysis of iron metabolism-related protein expression in the indicated HT1080 cells following treatment with erastin (10 µM) for 12 h (n = 3 biologically independent samples; *P < 0.05). (B, C) HT1080 cells were treated with erastin (10 µM) in the absence or presence of the indicated autophagy inhibitors (CQ, 50 μM; bafilomycin A1, 100 nM) or proteasome inhibitors (MG132, 0.5 μM; carfilzomib, 25 nM) for 12 h and then the protein expression of SLC40A1 was assayed (n = 3 biologically independent samples; *P < 0.05). (D) Immunoprecipitation (IP) assay of the interaction between SLC40A1 and the indicated autophagy receptors in HT1080 cells following treatment with erastin (10 µM) for 6 h (n = 3 biologically independent samples; *P < 0.05). (E) Analysis of SLC40A1 protein expression in the indicated HT1080 or PANC1 cells following treatment with erastin (10 µM) for 12 h (n = 3 biologically independent samples; *P < 0.05)
To identify autophagy receptor proteins involved in SLC40A1 degradation, we performed immunoprecipitation experiments in HT1080 cells. This assay showed that SLC40A1 bound to SQSTM1 during erastin-induced ferroptosis (). In contrast, erastin failed to induce the binding of SLC40A1 to other autophagy receptors, such as NBR1 (NBR1 autophagy cargo receptor), CALCOCO2/NDP52 (calcium-binding and coiled-coil domain 2), OPTN (optineurin), and NCOA4 (nuclear receptor coactivator 4) (). The knockdown of SQSTM1 inhibited erastin-induced SLC40A1 protein degradation in HT1080 and PANC1 cells (). These findings suggest that SQSTM1 mediates the autophagic degradation of SLC40A1 caused by erastin.
Inducing autophagic degradation of SLC40A1 overcomes ferroptosis resistance
To determine whether SLC40A1 expression is related to ferroptosis resistance, we produced a PANC1 cell line resistant to ferroptosis (termed PANC1R) by gradually increasing the drug concentration of erastin. Compared with parental cells, PANC1R cells were resistant to erastin-induced cell death (). Of note, the levels of MAP1LC3B and ATG5 were significantly downregulated, whereas the levels of SLC40A1 and SQSTM1 were significantly upregulated, in PANC1R cells (). In contrast, the expression of FTH1 and NCOA4 were mildly changed in PANC1R cells. Thus, the autophagy-mediated SLC40A1 degradation pathway may be impaired in PANC1R cells.
Figure 6. SLC40A1 contributes to ferroptosis resistance. (A) Analysis of erastin-induced cell death in control or erastin-resistant PANC1 cells (PANC1R) (n = 3 biologically independent samples; *P < 0.05 versus PANC1 group). (B) Analysis of the indicated protein expression in PANC1 and PANC1R cells. (C) Analysis of ATG5 and SLC40A1 protein expression in control, ATG5-overexpression, or SLC40A1-knockdown PANC1R cells. (D-F) Indicated PANC1R cells were treated with erastin (20 µM) for 12 and 24 h, and cell death (D), intracellular iron (E), and intracellular lipid peroxidation (F) were assayed (n = 3 biologically independent samples; *P < 0.05). (G) Analysis of SLC40A1 protein expression in control and SLC40A1-knockdown PANC1 cells. (H-J) The indicated PANC1 cells were treated with erastin (20 µM) in the absence or presence of liproxstatin-1 (“Lip1,” 500 nM), deferoxamine (“DFO,” 10 μM), or Z-VAD-FMK (“ZVAD,” 10 μM) for 12 h and then cell death (H), intracellular iron (I), and intracellular lipid peroxidation (J) were assayed (n = 3 biologically independent samples; *P < 0.05 versus erastin alone group)
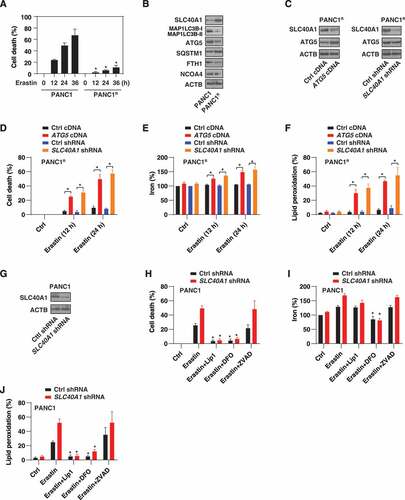
To evaluate the role of autophagy-mediated SLC40A1 degradation in the regulation of ferroptosis, we overexpressed ATG5 in PANC1R cells (). The overexpression of ATG5 restored SLC40A1 degradation () and enhanced erastin-induced cell death (), iron accumulation (), and lipid peroxidation () in PANC1R cells. Similar to the overexpression of ATG5, the knockdown of SLC40A1 by shRNA () also restored the sensitivity of PANC1R cells to the erastin-induced ferroptotic response (-). In parental PANC1 cells, the knockdown of SLC40A1 () further enhanced erastin-induced cell death (), iron accumulation (), and lipid peroxidation (). The ferroptosis inhibitor liproxstatin-1 and iron chelator deferoxamine (but not the apoptosis inhibitor Z-VAD-FMK) inhibited the ferroptotic activity of erastin in SLC40A1-knockdown PANC1 cells (). Collectively, these findings suggest that SLC40A1 is a repressor of ferroptosis.
SLC40A1 inhibits ferroptotic cell death in vivo
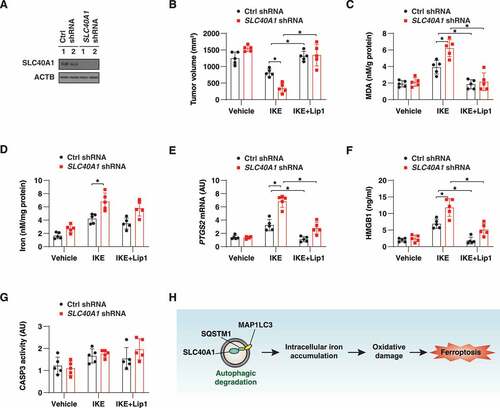
Next, we investigated whether the suppression of SLC40A1 might enhance the anticancer activity of imidazole ketone erastin (IKE), an erastin analog with high metabolic stability in vivo [Citation55]. Control as well as stable SLC40A1-knockdown PANC1 cells were implanted subcutaneously into the right flank of immunodeficient female mice (). One week later, tumor-bearing mice were treated with IKE (40 mg/kg, i.p., once every other day) in the absence or presence of liproxstatin-1 (10 mg/kg, i.p., once every other day). After 3 weeks of treatment, IKE-mediated tumor suppression in the SLC40A1-knockdown group was greater than that in the control group (). This SLC40A1-knockdown-mediated tumor suppression effect was associated with increased levels of intra-tumoral MDA (one of the final products of polyunsaturated fatty acid peroxidation) (), iron (), mRNA expression of PTGS2 (prostaglandin-endoperoxide synthase 2; a marker of ferroptosis in vivo [Citation56]) (), and elevated plasma concentrations of HMGB1 (high mobility group box 1; an alarm signal during regulated cell death, including ferroptotic death [Citation57]) (). In contrast, liproxstatin-1 inhibited the anticancer activity of IKE in control and SLC40A1-knockdown cells (-). However, the knockdown of SLC40A1 or the administration of liproxstatin-1 did not change the activity of CASP3/caspase-3 (a marker of apoptosis) (). These animal studies support the hypothesis that SLC40A1 acts as a negative regulator of IKE-induced ferroptosis in vivo.
Figure 7. Knockdown of SLC40A1 promotes ferroptotic cell death in vivo. (A) Athymic nude mice were injected subcutaneously with control or SLC40A1-knockdown PANC1 cells for 1 week, and then treated with IKE (40 mg/kg, i.p., once every other day) in the absence or presence of liproxstatin-1 (Lip1, 10 mg/kg, i.p., once every other day) at day 7 for 3 weeks. Western blot analysis of SLC40A1 expression in isolated tumors from control shRNA and SLC40A1 shRNA groups at day 21. (B-G) At day 21 after treatment, tumor volume (B), MDA (C), iron (D), and PTGS2 mRNA (E) in isolated tumors and serum HMGB1 (F) were assayed (n = 5 mice/group; *P < 0.05). (G) In parallel, CASP3 activity in isolated tumors was assayed (n = 5 mice/group). (H) Schematic representation of autophagic degradation of SLC40A1 in promoting intracellular iron accumulation and subsequent oxidative damage-mediated ferroptosis
Discussion
Tumor heterogeneity represents an ongoing challenge in cancer treatment [Citation58] – tumor cell lines from different patients have different genetic backgrounds and therapy responses, although they may have the same histopathology. In this study, we describe the protein level relationship between the main autophagy markers and ferroptosis regulators in 60 human cancer cell lines from 15 tissues following treatment with two classical ferroptosis activators. Generally, the basic expression levels of MAP1LC3B, SQSTM1, SLC7A11 and GPX4 are ubiquitous in these cell lines. In contrast, the upregulation of MAP1LC3B-II or the downregulation of SQSTM1 are more common than changes in the expression of SLC7A11 and GPX4 in the early stages of ferroptosis. Although the upregulation of GPX4 might also occur in some cases, the downregulation of GPX4 appeared to occur in an autophagy-dependent or -independent manner, indicating that complex modulation mechanisms are involved in the regulation of GPX4 levels during ferroptosis [Citation36]. CQ, which in many cases causes significant upregulation of MAP1LC3B-II, instead appeared to play a context-dependent role in the regulation of SQSTM1 and GPX4 levels during ferroptosis. Thus, autophagy may have multiple subroutine types to modulate ferroptotic cancer cell death [Citation52].
Recently, there has been a growing interest in the study of the mechanism and implication of ferroptosis in human disease, including cancer [Citation59]. However, cancer cells have the ability to activate different signaling pathways to shape the cell death response in a context-dependent manner [Citation60]. For example, the original concept of ferroptosis was linked to oncogenic RAS mutations causing the death of cancer cells [Citation15]. Later studies showed that both RAS-dependent and -independent pathways can lead to ferroptotic cancer cell death [Citation61]. Similarly, TP53 (tumor protein p53; a tumor suppressor) also plays a dual role in regulating ferroptosis sensitivity [Citation62,Citation63]. In established tumors, increased autophagy usually promotes survival during tumor therapy [Citation13]. However, cancer cells can use autophagy machinery to trigger ferroptotic cell death [Citation52]. Our current research indicates that monitoring the early autophagic response can predict the sensitivity to subsequent ferroptotic cell death. In particular, in 10 different ovarian cancer cell lines, we observed that a high expression of MAP1LC3B-II is positively correlated with ferroptosis sensitivity. Overall, these findings may open up new ways to use autophagic pathways to inhibit tumor development.
Our study highlights that SLC40A1 is a previously unidentified autophagic substrate that limits ferroptosis (). SLC40A1 is a transmembrane protein that transports iron from the inside of the cell to the outside [Citation54]. SLC40A1 emerges as a critical regulator of tumor growth and progression in multiple cancer types by regulating iron homeostasis [Citation64]. SLC40A1 can be regulated at many different levels, including transcription, posttranscription, and posttranslational modification levels [Citation54]. For example, the degradation of SLC40A1 protein by the ubiquitin-proteasome system is important for its endocytosis in macrophages [Citation65]. We demonstrate that autophagy, but not the proteasome, is required for SLC40A1 degradation during ferroptotic cancer cell death. Subsequent immunoprecipitation and RNAi experiments identify that SQSTM1, as an autophagy receptor, can recognize and drive the degradation of SLC40A1 during ferroptosis. Although the structural basis for the autophagic degradation of SLC40A1 remains unknown, the development of acquired resistance to erastin is related to the impaired autophagy-dependent degradation of SLC40A1. Consequently, inducing the autophagic degradation of SLC40A1 restores the drug sensitivity of ferroptosis-resistant cancer cells. In the xenograft tumor mouse models, genetically inhibiting SLC40A1 enhances the tumor suppression effect of ferroptosis therapy. These findings are consistent with those of other studies, emphasizing the importance of autophagy-mediated iron accumulation in the initiation of ferroptosis [Citation26–28].
In summary, we provide a relative integrated view of the autophagy response in the early stage of ferroptotic death in multiple different cancer cell lines. We show that the protein profile of autophagy markers or ferroptosis regulators are changed by erastin and RSL3 in a tumor- or cell type-dependent manner. With these findings, we hope to provide new information for further identification and characterization of tumor heterogeneity in targeted therapeutics, and advance our understanding of the mechanism and regulation of autophagy-dependent ferroptosis. Given the known link between oxidative stress and tumorigenesis [Citation66,Citation67], it is even more important to map the pathological role of autophagy-dependent ferroptosis in tumor formation and development [Citation68,Citation69]. In addition, establishing tools for real-time monitoring of the specific autophagy response in ferroptotic death in situ is definitely critical for understanding the dynamic behavior of the autophagy-ferroptosis system.
Materials and methods
Reagents
Erastin (S7242), RSL3 (S8155), CQ (S4430), liproxstatin-1 (S7699), IKE (S8877), Z-VAD-FMK (S7023), bafilomycin A1 (S1413), MG132 (S2619), carfilzomib (S2853), and deferoxamine (S5742) were obtained from Selleck Chemicals. The antibodies to MAP1LC3B (3868), ATG5 (12,994), ATG7 (8558), ATG4B (5299), FTH1 (4393), TFRC (13,113), OPTN (70,928), NCOA4 (66,849), CALCOCO2 (60,732), LAMP1 (15,665), and ACTB (3700) were obtained from Cell Signaling Technology. The antibodies to SLC7A11 (ab175186), STEAP3 (ab249009), NBR1 (ab126175), and GPX4 (ab125066) were obtained from Abcam. The antibody to SQSTM1 (sc-28359) was obtained from Santa Cruz Biotechnology. The antibody to SLC40A1 (NBP1-21502) was obtained from NOVUS.
Cell culture
All cell lines were obtained from the American Type Culture Collection (ATCC) and cultured in Dulbecco’s Modified Eagle’s Medium (Thermo Fisher Scientific, 11,995,073) or Roswell Park Memorial Institute 1640 Medium (Thermo Fisher Scientific, A1049101) supplemented with 10% heat-inactivated fetal bovine serum (Thermo Fisher Scientific, A3840001) and 1% penicillin and streptomycin (Thermo Fisher Scientific, 15,070–063) at 37°C, 95% humidity, and 5% CO2. Cell line identity was validated by short tandem repeat profiling, and routine mycoplasma testing was negative for contamination.
Cell death assay
A Countess II FL Automated Cell Counter (Thermo Fisher Scientific) was used to assay the percentages of dead cells after cell staining with ready-to-use propidium iodide (Thermo Fisher Scientific, R37108) for 15–30 min.
RNAi and gene transfection
Human ATG5 cDNA (SC128244) was obtained from OriGene Technologies Inc. Human ATG5-shRNA (sequence: CCGGCCTGAACAGAATCATCCTTAACTCGAGTTAAGGATGATTCTGTTCAGGTTTTTTG), human ATG7 shRNA (sequence: CCGGGCCTGCTGAGGAGCTCTCCATCTCGAGATGGAGAGCTCCTCAGCAGGCTTTTT), human ATG4B shRNA (sequence: CCGGGAAGCTTGCTGTCTTCGATACCTCGAGGTATCGAAGACAGCAAGCTTCTTTTTG), human SQSTM1 shRNA (sequence: CCGGCCTCTGGGCATTGAAGTTGATCTCGAGATCAACTTCAATGCCCAGAGGTTTTT), and human SLC40A1 shRNA (sequence: CCGGCCTGTGTGGAATCATCCTGATCTCGAGATCAGGATGATTCCACACAGGTTTTTG) were obtained from Sigma-Aldrich. Transfection with shRNA or cDNA was performed with Lipofectamine 3000 (Invitrogen, L3000-015) according to the manufacturer’s instructions. Cells stably expressing the shRNA were selected with 1.0 μg/ml puromycin (Sigma-Aldrich, P8833) over a period of 2 weeks.
qPCR analysis
Total RNA was extracted and purified from cultured cells using the RNeasy Plus Mini Kit (QIAGEN, 74,136). One μg of total RNA from each sample was reverse-transcribed into cDNA using the iScript cDNA synthesis kit (Bio-Rad, 170–8891) in a volume of 20 μl; cDNA from cell samples was amplified. Quantitative real-time PCR was performed using SsoFast EvaGreen Supermix (Bio-Rad, 172–5204) on the C1000 Touch Thermocycler CFX96 Real-Time System (Bio-Rad) according to the manufacturer’s protocol. Analysis was performed using Bio-Rad CFX Manager software (Bio-Rad). The following primers were used: PTGS2 (5ʹ-CGGTGAAACTCTGGCTAGACAG-3ʹ and 5ʹ-GCAAACCGTAGATGCTCAGGGA-3ʹ), RNA18S (5ʹ-CTACCACATCCAAGGAAGCA-3ʹ and 5ʹ-TTTTTCGTCACTACCTCCCCG-3ʹ). The gene expression was calculated via the 2−ΔΔCt method and normalized to RNA18S [Citation70].
Western blot
Cells were washed with 4- phosphate-buffered saline (PBS; Sigma-Aldrich, P5493) buffer and then lysed in Cell Lysis Buffer (Cell Signaling Technology, 9803) with a protease and phosphatase inhibitor single-use cocktail (Thermo Fisher Scientific, 78,442) on ice for 30 min. Protein was quantified using a bicinchoninic acid (BCA) assay (Thermo Fisher Scientific, UG23225), and 15 μg of each sample was resolved on 4%-12% Criterion XT Bis-Tris gels (Bio-Rad, 3,450,124) in XT MES running buffer (Bio-Rad, 1,610,789) and transferred to polyvinylidene fluoride membranes (Bio-Rad, 1,620,233) using the Trans-Blot Turbo Transfer Pack and System. Membranes were blocked with Tris-buffered saline containing 0.1% Tween 20 detergent (TBST; Cell Signaling Technology, 9997) and 5% skim milk (Cell Signaling Technology, 9999) for 1 h, and incubated overnight at 4°C with the indicated primary antibodies (1:500–1:1000). Following 3 washes in TBST, membranes were incubated with goat anti-rabbit or anti-mouse IgG horseradish peroxidase secondary antibody (1:5000; Cell Signaling Technology, 7074S, 7076S) at room temperature for 1 h and washed. SuperSignal West Pico Chemiluminescent Substrate (Thermo Fisher Scientific, 34,080) or Super Signal West Femto Maximum Sensitivity Substrate (Thermo Fisher Scientific, 34,095) were applied, and blots were analyzed using the ChemiDoc Touch Imaging System (Bio-Rad) and Image Lab Software (Bio-Rad). The relative intensities of the bands of western blots from multiple regions were automatically analyzed and normalized to a loading control using ImageJ software (NIH). Then the density value was statistically analyzed to guide the classification of upregulation or downregulation of protein expression with a cutoff value of 25% (P < 0.05).
Immunoprecipitation analysis
Cells were lysed at 4°C in ice-cold radioimmunoprecipitation assay buffer (Millipore, 20–188) and cell lysates were cleared by a brief centrifugation (12,000 g, 10 min). Concentrations of proteins in the supernatant were determined by BCA assay. Prior to immunoprecipitation, samples containing equal amounts of proteins were pre-cleared with protein A/G Sepharose beads (4°C, 3 h) from Abcam (ab193262) and subsequently incubated with various irrelevant IgG or specific antibodies (2 µg/ml) in the presence of protein A/G Sepharose beads for 2 h or overnight at 4°C with gentle shaking [Citation71]. Following incubation, protein A/G Sepharose beads were washed extensively with PBS and proteins were eluted by boiling 2 times in sodium dodecyl sulfate (SDS) sample buffer before SDS-polyacrylamide gel electrophoresis.
Lipid peroxidation assay
The relative MDA concentration in tumor tissue lysates was assessed using a Lipid Peroxidation (MDA) Assay Kit (Sigma-Aldrich, MAK085). Briefly, MDA in the sample reacted with thiobarbituric acid (TBA) to generate an MDA-TBA adduct. The MDA-TBA adduct can be easily quantified colorimetrically (OD = 532 nm). In addition, a linoleamide alkyne (Thermo Fisher Scientific, C10446) staining kit was used to detect lipid peroxidation in cells. In brief, cells were incubated with 50 μM of linoleamide alkyne for 1–2 h at 37°C, then fixed with 4% formaldehyde for 15 min at room temperature. The cells were next washed 3 times with PBS, permeabilized with 0.05% Triton X-100 (Cell Signaling Technology, 39,487) for 10 min, and blocked with 1% bovine serum albumin (BSA; Cell Signaling Technology, 9998) for 30 min. Then, the cells were washed and the click reaction was performed with 5 μM Alexa Fluor 488 azide (Thermo Fisher Scientific, A10266) for 30 min. Finally, the cells were washed 1 time with 1% BSA and 2 times with PBS, and then imaged on a EVOS Cell Imaging System (Thermo Fisher Scientific). The signal intensity was quantified using ImageJ software (n = 10 random fields).
Iron assay
The relative Fe2+ concentration in cells or tissues was assessed using an Iron Assay Kit (Sigma-Aldrich, MAK025). Briefly, cells or tissues were homogenized in 4–10 volumes of iron assay buffer, and the samples were centrifuged at 16,000 × g for 10 min to remove insoluble materials, followed by collection of the supernatants. To measure ferrous iron, we added 50 µL samples to sample wells in a 96-well plate and brought the volume to 100 µL per well with 5 µL of assay buffer. After incubation of the reaction at 37°C for 30 min, the absorbance at 593 nm was measured using a microplate reader. The relative level of Fe2+ in all groups was calculated and normalized to protein concentration. The control group was assigned a value of 100%, and the treatment group was then calculated relative to the control group.
HMGB1 assay
Plasma HMGB1 was assayed using an ELISA kit from Sino-Test Corporation (326054329) according to the manufacturer’s protocol.
Immunofluorescence analysis
Cells were cultured on glass coverslips and fixed in 3% formaldehyde for 30 min at room temperature prior to detergent extraction with 0.1% Triton X-100 for 10 min at 25°C. Coverslips were saturated with 2% BSA in PBS for 1 h at room temperature and processed for immunofluorescence with primary antibodies (MAP1LC3B [1:200] and LAMP1 [1:200]), followed by Alexa Fluor 488- or Cy3-conjugated secondary antibodies (1:500; Thermo Fisher Scientific, A32731, A10521). Images were taken with a ZEISS LSM 800 confocal microscope (ZEISS). The signal intensity was quantified using ImageJ software (n = 10 random fields).
Animal model
We conducted all animal care and experiments in accordance with the Association for Assessment and Accreditation of Laboratory Animal Care guidelines and with approval from our institutional animal care and use committee. To generate murine subcutaneous tumors, 5 × 10⁶ PANC1 cells (ATCC, CRL-1469) in 100 μl PBS were injected subcutaneously into the right of the dorsal midline in 6- to 8-week-old athymic nude female mice. Once the tumors reached 60–80 mm3 at day 7, mice were randomly allocated into groups and then treated with IKE (40 mg/kg, i.p., once every other day) in the absence or presence of liproxstatin-1 (10 mg/kg, i.p., once every other day) at day 7 for 3 weeks. Tumors were measured twice weekly and volumes were calculated using the formula length × width2 × π/6.
Statistical analysis
Data are presented as mean ± SD except where otherwise indicated. Unpaired Student’s t tests were used to compare the means of two groups. A one-way or two-way ANOVA was used for comparison between the different groups. A P value of <0.05 was considered statistically significant. The exact value of n within the figures is indicated in the figure legends.
Supplemental Material
Download PDF (472.7 KB)Acknowledgments
We thank Dave Primm (Department of Surgery, University of Texas Southwestern Medical Center) for his critical reading of the manuscript. D.T. is supported by a grant from the American Cancer Society (Research Scholar Grant RSG-16-014-01-CDD). X.W. is supported by a grant from the National Natural Science Foundation of China (81970494). J.L. is supported by a grant from the Third Xiangya Hospital of Central South University (JY201707). D.J.K. is supported by a grant from the National Institutes of Health (GM131919).
Disclosure statement
No potential conflicts of interest were disclosed.
Supplemental material
Supplemental data for this article can be accessed here.
Additional information
Funding
References
- Klionsky DJ, Emr SD. Autophagy as a regulated pathway of cellular degradation. Science. 2000;290:1717–1721.
- Levine B, Kroemer G. Biological functions of autophagy genes: a disease perspective. Cell. 2019;176:11–42.
- Li J, Chen X, Kang R, et al. Regulation and function of autophagy in pancreatic cancer. Autophagy. 2020;1–22. 10.1080/15548627.2020.1847462
- Xie Y, Kang R, Sun X, et al. Posttranslational modification of autophagy-related proteins in macroautophagy. Autophagy. 2015;11:28–45.
- Dikic I, Elazar Z. Mechanism and medical implications of mammalian autophagy. Nat Rev Mol Cell Biol. 2018;19:349–364.
- Kabeya Y, Mizushima N, Ueno T, et al. LC3, a mammalian homologue of yeast Apg8p, is localized in autophagosome membranes after processing. Embo J. 2000;19:5720–5728.
- Gatica D, Lahiri V, Klionsky DJ. Cargo recognition and degradation by selective autophagy. Nat Cell Biol. 2018;20:233–242.
- Kroemer G, Marino G, Levine B. Autophagy and the integrated stress response. Mol Cell. 2010;40:280–293.
- Murrow L, Debnath J. Autophagy as a stress-response and quality-control mechanism: implications for cell injury and human disease. Annu Rev Pathol. 2013;8:105–137.
- Denton D, Kumar S. Autophagy-dependent cell death. Cell Death Differ. 2019;26:605–616.
- Bialik S, Dasari SK, Kimchi A. Autophagy-dependent cell death - where, how and why a cell eats itself to death. J Cell Sci. 2018;131(18):131.
- Galluzzi L, Vitale I, Aaronson SA, et al. Molecular mechanisms of cell death: recommendations of the Nomenclature Committee on Cell Death 2018. Cell Death Differ. 2018;25:486–541.
- Levy JMM, Towers CG, Thorburn A. Targeting autophagy in cancer. Nat Rev Cancer. 2017;17:528–542.
- Tang D, Kang R, Berghe TV, et al. The molecular machinery of regulated cell death. Cell Res. 2019;29:347–364.
- Dixon SJ, Lemberg KM, Lamprecht MR, et al. Ferroptosis: an iron-dependent form of nonapoptotic cell death. Cell. 2012;149:1060–1072.
- Tang D, Kroemer G. Ferroptosis. Curr Biol. 2020;30:R1292–R1297
- Zhou B, Liu J, Kang R, et al. Ferroptosis is a type of autophagy-dependent cell death. Semin Cancer Biol. 2019;66:89–100.
- Stockwell BR, Friedmann Angeli JP, Bayir H, et al. Ferroptosis: a regulated cell death nexus linking metabolism, redox biology, and disease. Cell. 2017;171:273–285.
- Tang D, Chen X, Kang R, et al. Ferroptosis: molecular mechanisms and health implications. Cell Res. 2020. DOI:10.1038/s41422-020-00441-1
- Kuang F, Liu J, Tang D, et al. Oxidative damage and antioxidant defense in ferroptosis. Front Cell Dev Biol. 2020;8:586578.
- Haberzettl P, Hill BG. Oxidized lipids activate autophagy in a JNK-dependent manner by stimulating the endoplasmic reticulum stress response. Redox Biol. 2013;1:56–64.
- Filomeni G, De Zio D, Cecconi F. Oxidative stress and autophagy: the clash between damage and metabolic needs. Cell Death Differ. 2015;22:377–388.
- Xie Y, Li J, Kang R, et al. Interplay between lipid metabolism and autophagy. Front Cell Dev Biol. 2020;8:431.
- Liu J, Kuang F, Kroemer G, et al. Autophagy-dependent ferroptosis: machinery and regulation. Cell Chem Biol. 2020;27(4):420–435.
- Kang R, Tang D. Autophagy and ferroptosis - what’s the connection? Curr Pathobiol Rep. 2017;5:153–159.
- Gao M, Monian P, Pan Q, et al. Ferroptosis is an autophagic cell death process. Cell Res. 2016;26:1021–1032.
- Hou W, Xie Y, Song X, et al. Autophagy promotes ferroptosis by degradation of ferritin. Autophagy. 2016;12:1425–1428.
- Zhang Z, Yao Z, Wang L, et al. Activation of ferritinophagy is required for the RNA-binding protein ELAVL1/HuR to regulate ferroptosis in hepatic stellate cells. Autophagy. 2018;14:2083–2103.
- Bai Y, Meng L, Han L, et al. Lipid storage and lipophagy regulates ferroptosis. Biochem Biophys Res Commun. 2018;508:997–1003
- Yang M, Chen P, Liu J, et al. Clockophagy is a novel selective autophagy process favoring ferroptosis. Sci Adv. 2019;5:eaaw2238.
- Liu J, Yang M, Kang R, et al. Autophagic degradation of the circadian clock regulator promotes ferroptosis. Autophagy. 2019;15:2033–2035.
- Wu Z, Geng Y, Lu X, et al. Chaperone-mediated autophagy is involved in the execution of ferroptosis. Proc Natl Acad Sci U S A. 2019;116:2996–3005.
- Song X, Zhu S, Chen P, et al. AMPK-mediated BECN1 phosphorylation promotes ferroptosis by directly blocking system Xc(-) activity. Curr Biol. 2018;28:2388–99 e5.
- Li C, Zhang Y, Liu J, et al. Mitochondrial DNA stress triggers autophagy-dependent ferroptotic death. Autophagy. 2020;1–13. DOI:10.1080/15548627.2020.1739447
- Kang R, Zhu S, Zeh HJ, et al. BECN1 is a new driver of ferroptosis. Autophagy. 2018;14:2173–2175.
- Liu Y, Wang Y, Liu J, et al. Interplay between MTOR and GPX4 signaling modulates autophagy-dependent ferroptotic cancer cell death. Cancer Gene Ther. 2020; 10.1038/s41417-020-0182-y
- Park E, Chung SW. ROS-mediated autophagy increases intracellular iron levels and ferroptosis by ferritin and transferrin receptor regulation. Cell Death Dis. 2019;10:822.
- Chen Y, McMillan-Ward E, Kong J, et al. Oxidative stress induces autophagic cell death independent of apoptosis in transformed and cancer cells. Cell Death Differ. 2008;15:171–182.
- Ott M, Gogvadze V, Orrenius S, et al. Mitochondria, oxidative stress and cell death. Apoptosis. 2007;12:913–922.
- Shindo R, Kakehashi H, Okumura K, et al. Critical contribution of oxidative stress to TNFalpha-induced necroptosis downstream of RIPK1 activation. Biochem Biophys Res Commun. 2013;436:212–216.
- Chen X, Xu S, Zhao C, et al. Role of TLR4/NADPH oxidase 4 pathway in promoting cell death through autophagy and ferroptosis during heart failure. Biochem Biophys Res Commun. 2019;516:37–43.
- Zhang Z, Guo M, Li Y, et al. RNA-binding protein ZFP36/TTP protects against ferroptosis by regulating autophagy signaling pathway in hepatic stellate cells. Autophagy. 2020;16:1482–1505
- Han D, Jiang L, Gu X, et al. SIRT3 deficiency is resistant to autophagy-dependent ferroptosis by inhibiting the AMPK/mTOR pathway and promoting GPX4 levels. J Cell Physiol. 2020;235:8839–8851.
- Xie Y, Hou W, Song X, et al. Ferroptosis: process and function. Cell Death Differ. 2016;23:369–379.
- Klionsky DJ, Abdelmohsen K, Abe A, et al. Guidelines for the use and interpretation of assays for monitoring autophagy (3rd ed). Autophagy. 2016;12:1–222.
- Shimada K, Skouta R, Kaplan A, et al. Global survey of cell death mechanisms reveals metabolic regulation of ferroptosis. Nat Chem Biol. 2016;12:497–503.
- Muller T, Dewitz C, Schmitz J, et al. Necroptosis and ferroptosis are alternative cell death pathways that operate in acute kidney failure. Cell Mol Life Sci. 2017;74:3631–3645.
- Zhu S, Zhang Q, Sun X, et al. HSPA5 regulates ferroptotic cell death in cancer cells. Cancer Res. 2017;77:2064–2077.
- Liang H, Yoo SE, Na R, et al. Short form glutathione peroxidase 4 is the essential isoform required for survival and somatic mitochondrial functions. J Biol Chem. 2009;284:30836–30844.
- Pankiv S, Clausen TH, Lamark T, et al. p62/SQSTM1 binds directly to Atg8/LC3 to facilitate degradation of ubiquitinated protein aggregates by autophagy. J Biol Chem. 2007;282:24131–24145.
- Mizushima N, Yoshimori T. How to interpret LC3 immunoblotting. Autophagy. 2007;3:542–545.
- Liu J, Kuang F, Kroemer G, et al. Autophagy-dependent ferroptosis: machinery and regulation. Cell Chem Biol. 2020;27:420–435.
- Chen X, Yu C, Kang R, et al. Iron metabolism in ferroptosis. Front Cell Dev Biol. 2020;8:590226.
- Ward DM, Kaplan J. Ferroportin-mediated iron transport: expression and regulation. Biochim Biophys Acta. 2012;1823:1426–1433.
- Zhang Y, Tan H, Daniels JD, et al. Imidazole ketone erastin induces ferroptosis and slows tumor growth in a mouse lymphoma model. Cell Chem Biol. 2019;26:623–33 e9.
- Yang WS, SriRamaratnam R, Welsch ME, et al. Regulation of ferroptotic cancer cell death by GPX4. Cell. 2014;156:317–331.
- Wen Q, Liu J, Kang R, et al. The release and activity of HMGB1 in ferroptosis. Biochem Biophys Res Commun. 2019;510:278–283.
- Dagogo-Jack I, Shaw AT. Tumour heterogeneity and resistance to cancer therapies. Nat Rev Clin Oncol. 2018;15:81–94.
- Chen X, Kang R, Kroemer G, et al. Broadening horizons: the role of ferroptosis in cancer. Nat Rev Clin Oncol. 2020; 10.1038/s41571-020-00462–0
- Chen X, Li J, Kang R, et al. Ferroptosis: machinery and regulation. Autophagy. 2020;1–28. 10.1080/15548627.2020.1810918
- Yu Y, Xie Y, Cao L, et al. The ferroptosis inducer erastin enhances sensitivity of acute myeloid leukemia cells to chemotherapeutic agents. Mol Cell Oncol. 2015;2:e1054549.
- Xie Y, Zhu S, Song X, et al. The tumor suppressor p53 limits ferroptosis by blocking DPP4 activity. Cell Rep. 2017;20:1692–1704.
- Jiang L, Kon N, Li T, et al. Ferroptosis as a p53-mediated activity during tumour suppression. Nature. 2015;520:57–62.
- Manz DH, Blanchette NL, Paul BT, et al. Iron and cancer: recent insights. Ann N Y Acad Sci. 2016;1368:149–161.
- Qiao B, Sugianto P, Fung E, et al. Hepcidin-induced endocytosis of ferroportin is dependent on ferroportin ubiquitination. Cell Metab. 2012;15:918–924.
- Klaunig JE, Kamendulis LM, Hocevar BA. Oxidative stress and oxidative damage in carcinogenesis. Toxicol Pathol. 2010;38:96–109.
- Dai E, Han L, Liu J, et al. Ferroptotic damage promotes pancreatic tumorigenesis through a TMEM173/STING-dependent DNA sensor pathway. Nat Commun. 2020;11:6339.
- Dai E, Han L, Liu J, et al. Autophagy-dependent ferroptosis drives tumor-associated macrophage polarization via release and uptake of oncogenic KRAS protein. Autophagy. 2020;16:2069–2083
- Xie Y, Kuang F, Liu J, et al. DUSP1 blocks autophagy-dependent ferroptosis in pancreatic cancer. J pancreatol. 2020;3:154–160.
- Deng W, Zhu S, Zeng L, et al. The circadian clock controls immune checkpoint pathway in sepsis. Cell Rep. 2018;24:366–378.
- Tang D, Kang R, Livesey KM, et al. Endogenous HMGB1 regulates autophagy. J Cell Biol. 2010;190:881–892.