
ABSTRACT
Genotoxic insult causes nuclear and mitochondrial DNA damages with macroautophagy/autophagy induction. The role of mitochondrial DNA (mtDNA) damage in the requirement of autophagy for nuclear DNA (nDNA) stability is unclear. Using site-specific DNA damage approaches, we show that specific nDNA damage alone does not require autophagy for repair unless in the presence of mtDNA damage. We provide evidence that after IR exposure-induced mtDNA and nDNA damages, autophagy suppression causes non-apoptotic mitochondrial permeability, by which mitochondrial ENDOG (endonuclease G) is released and translocated to nuclei to sustain nDNA damage in a TET (tet methylcytosine dioxygenase)-dependent manner. Furthermore, blocking lysosome function is sufficient to increase the amount of mtDNA leakage to the cytosol, accompanied by ENDOG-free mitochondrial puncta formation with concurrent ENDOG nuclear accumulation. We proposed that autophagy eliminates the mitochondria specified by mtDNA damage-driven mitochondrial permeability to prevent ENDOG-mediated genome instability. Finally, we showed that HBx, a hepatitis B viral protein capable of suppressing autophagy, also causes mitochondrial permeability-dependent ENDOG mis-localization in nuclei and is linked to hepatitis B virus (HBV)-mediated hepatocellular carcinoma development.
Abbreviations: 3-MA: 3-methyladenine; 5-hmC: 5-hydroxymethylcytosine; ACTB: actin beta; ATG5: autophagy related 5; ATM: ATM serine/threonine kinase; DFFB/CAD: DNA fragmentation factor subunit beta; cmtDNA: cytosolic mitochondrial DNA; ConA: concanamycin A; CQ: chloroquine; CsA: cyclosporin A; Dox: doxycycline; DSB: double-strand break; ENDOG: endonuclease G; GFP: green fluorescent protein; Gy: gray; H2AX: H2A.X variant histone; HBV: hepatitis B virus; HBx: hepatitis B virus X protein; HCC: hepatocellular carcinoma; I-PpoI: intron-encoded endonuclease; IR: ionizing radiation; MAP1LC3/LC3: microtubule associated protein 1 light chain 3; MOMP: mitochondrial outer membrane permeability; mPTP: mitochondrial permeability transition pore; mtDNA: mitochondrial DNA; nDNA: nuclear DNA; 4-OHT: 4-hydroxytamoxifen; rDNA: ribosomal DNA; ROS: reactive oxygen species; SQSTM1/p62: sequestosome 1; TET: tet methylcytosine dioxygenase; TFAM: transcription factor A, mitochondrial; TOMM20: translocase of outer mitochondrial membrane 20; VDAC: voltage dependent anion channel.
Introduction
The mammalian genomes are comprised of nuclear DNA (nDNA) and hundreds of copies of mitochondrial DNA (mtDNA), which are all susceptible to genotoxic injuries. DNA repair signaling and autophagy are both stimulated upon DNA damages. In response to the repairable dosage of genotoxicity, autophagy plays an essential role in DNA repair for cell survival [Citation1]. Molecular processes, including the recycle of building blocks, degradation of pro-apoptotic proteins, cell cycle arrest, counteracting the proteolysis of DNA damage response molecules, and promoting the DNA repair processes, have been proposed for the function of autophagy in repairing sub-lethal DNA damage [Citation1,Citation2]. Many studies have shown that ρ0 (mtDNA deficient) cells are resistant to high oxidative stress-induced cell death [Citation3,Citation4], suggesting the importance of mtDNA in mediating stress-induced toxicity. In this study, we raised the question of whether mtDNA damage makes autophagy essential for maintaining nDNA stability.
To address this question, we did nDNA damages separated from mtDNA damages. Because human genome contains more than 400 copies of ribosomal DNA (rDNA) genes organized in nucleoli, rDNA site-specific lesions were generated by controlling the nuclear translocation of a restriction enzyme, intron-encoded endonuclease (I-PpoI) that recognizes a 15-nucleotide sequence in rDNA genes, to have about 30 double-strand breaks (DSBs) per cells [Citation5,Citation6]. Conversely, specific mtDNA damage was generated by expressing TFAM (transcription factor A, mitochondrial)-KillerRed, in which TFAM is a mtDNA packaging protein. Upon light exposure, TFAM-KillerRed-induced reactive oxygen species (ROS) specifically damages mtDNA. Through the combination of two site-specific DNA damage approaches, our data indicate that the necessity of autophagy for nDNA repair is determined by the concurrent presence of mtDNA damage-inducedmitochondrial permeability.
Mitochondrial pores that mediate permeability are located in the inner and outer membrane. In the inner membrane, permeability transition pore (mPTP) opens upon membrane depolarization, ROS, and Ca+2 influx, which are insufficient to trigger a whole-cell level of apoptosis [Citation7–11]. In the outer membrane, VDAC (voltage dependent anion channel) oligomerization and BAK1 (BCL2 antagonist/killer 1)-BAX (BCL2 associated X, apoptosis regulator)-mediated macro-pore contribute to mitochondrial outer membrane permeability (MOMP) toward apoptosis, which can be blocked by BCL2 (BCL2 apoptosis regulator) or BCL2L1/BCL-xL (BCL2 like 1) [Citation12–14]. It has been shown that the application of a sub-lethal amount of anti-apoptotic BCL2 inhibitor can cause MOMP in a small population of mitochondria, leading to caspase-dependent nDNA damage in the absence of apoptosis [Citation15,Citation16]. In a Parkinson model by SNCA/ααsynuclein-induced dopaminergic neuron toxicity, the release of ENDOG from mitochondria is responsible for DNA damage in the nuclear genome [Citation17]. In this study, we further used a reparable level of ionizing radiation (IR) that damages mtDNA and nDNA to understand the molecular events affecting nDNA repair when autophagy is blocked. Our results demonstrated that a moderate level of mtDNA damage-induced mitochondrial permeability did not result in caspase-dependent nDNA damage but the leakage of ENDOG, which nuclear translocation cooperates with TET2 to sustain nDNA lesions in the absence of autophagy.
Finally, we accessed the nuclear mis-localization of ENDOG in a pathological context involving compromised autophagy. Hepatitis virus B (HBV) infection is a risk factor in the development of hepatocellular carcinoma (HCC). HBx protein encoded by the X gene of HBV is the major factor promoting HCC [Citation18]. HBx has been reported to damage mitochondria and suppresses lysosome function [Citation19,Citation20]. Herein, the relevance of HBV-induced HCC to ENDOG in nuclei was examined. Our results reveal that HBx induces mPTP-dependent nuclear translocation of ENDOG. Moreover, the amount of nuclear ENDOG is markedly increased in liver tumors of HBx transgenic mice and clinical samples of HBV-associated HCC. Thus, aberrant mitochondrial permeability by compromised autophagy is involved in HBV-mediated pathogenesis.
Results
Mitochondrial damage causes nuclear DNA repair dependent on autophagy
To determine whether autophagy is essential for repairing DNA lesions occurring in nuclei, we expressed tamoxifen-inducible I-PpoI, an endonuclease recognizing the sequence (5ʹ-CTCTCTTAAGGTAGC-3ʹ) at rDNA genes and a site at chromosome 1, in HeLa cells. The addition of 4-hydroxytamoxifen (4-OHT) allows the nuclear translocation of I-PpoI to generate multiple double-strand breaks (DSBs) in the nuclei without generating mitochondrial DNA damage [Citation5]. As expected, incubation of cells with 4-OHT for 4 h induced γH2AX (H2A.X variant histone) signal in peri-nucleolar regions with concurrent green fluorescence protein (GFP)-MAP1LC3/LC3 (microtubule associated protein 1 light chain 3) puncta formation of autophagy induction ()). After washing out 4-OHT to terminate I-PpoI translocation for 9 h, we observed the resolution of the I-PpoI-induced γH2AX foci signals, indicating the ongoing DNA repair of preexisted lesions by 4-OHT-induced nuclear translocated I-PpoI ()). Since ATG5 (autophagy related 5) is an essential molecule for LC3 lipidation in autophagy induction [Citation21], cells are depleted of ATG5 by siRNA transfection to block autophagosome formation. The results showed that ATG5 knockdown had little effect on the diminishing pattern of γH2AX foci ()). The western blot also showed that 4-OHT treatment increased the amounts of phospho-ATM (ataxia telangiectasia mutated), γH2AX and LC3-II, and ATG5 knockdown did not affect the changes of DNA damage signals during 4-OHT withdrawal ()). The presence of chloroquine (CQ), which blocks autophagy flux by inhibiting lysosome fusion with autophagosome [Citation22], during 4-OHT withdrawal also did not affect the recovery from I-PpoI-induced DNA damage ()). These results suggest that DNA damage-induced autophagy is not necessarily essential for the recovery from a moderate level of site-specific nDNA damage.
Figure 1. DNA damage-induced autophagy is not necessarily essential for the repair of a moderate level of site-specific nDNA damage. (A) A schematic diagram for the induction of I-PpoI-induced rDNA damage and repair during recovery from 4-OHT withdrawal. Images of γH2AX IF staining and GFP-LC3 puncta in HeLa cells co-transfected with pLKO-HA-I-PpoI-ER and pGFP-LC3 after recovery from the 4-OHT (1 μM, 4 h) treatment at the indicated time points. scale bar: 20 μm. (B) Analysis of ATG5 knockdown on the repair of I-PpoI-induced DNA damage. representative images of γH2AX IF staining during recovery from 4-OHT-induced rDNA damage in cells with and without siATG5 RNA transfection, scale bar: 20 μm. right shows relative γH2AX IF staining intensity by ImageJ quantification (n ≥ 100). data are presented as mean ± SEM from three independent experiments (n.s: not significant). inset shows ATG5 knockdown by western blot. (C) Western blot analysis of γH2AX, p-ATM, LC3-I, LC3-II, and ACTB/β-actin in HeLa cells transfected with siControl or siATG5 RNA together with pLKO-HA-I-PpoI-ER after recovery from the 4-OHT (1 μM, 4 h) treatment at the indicated time points. (D) The effect of CQ treatment (50 μM) on the repair of I-PpoI-induced DNA damage. representative images of γH2AX IF staining during recovery from 4-OHT-induced rDNA damage in cells with CQ or vehicle treatment, scale bar: 20 μm. right shows relative γH2AX IF staining intensity by imageJ quantification (n ≥ 100). data are presented as mean ± SEM from three independent experiments (n.s: not significant)
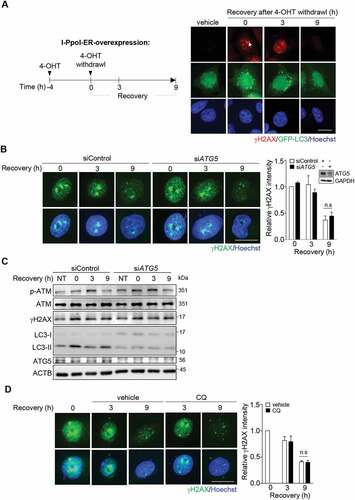
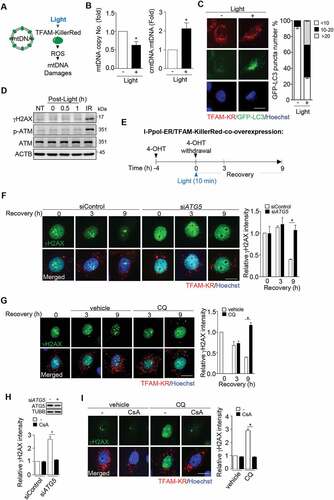
Next, we tested whether the presence of mitochondrial DNA (mtDNA) damages affect the role of autophagy in the repair of I-PpoI-induced DNA lesions. Since TFAM is a specific mitochondrial DNA binding protein [Citation23–25], we expressed TFAM-KillerRed (TFAM-KD) fusion protein to allow site-specific mitochondrial DNA damages by light-induced ROS from the fused KillerRed ()). As expected, light exposure for 10 min resulted in a significant reduction in mtDNA copy number with an increase of cytosolic mtDNA (cmtDNA) ()). This condition gave a clear induction of autophagy as indicated by GFP-LC3 puncta formation without increasing γH2AX and phospho-ATM (p-ATM) ()). Nor was γH2AX focus observed in the nuclei of TFAM-KR expressing cells regardless of ATG5 knockdown or treatment with CQ (Fig. S1A and B). We then combined the expression of I-PpoI with TFAM-KR to examine the changes of I-PpoI-induced DNA damage in nuclei after 4-OHT withdrawal ()). In control cells, TFAM-KR-mediated mtDNA damage by light did not affect the resolution of I-PpoI-induced γH2AX. As a contrast, in ATG5 knockdown and CQ-treated cells, γH2AX signal was expanded instead of diminishing ()). Similar results were found in p-ATM IF staining in ATG5 knockdown cells (Fig. S1C). Altogether, we conclude that mtDNA damage determines the requirement of autophagy for nDNA stability. Presumably, damaged mtDNA is released from the matrix through mPTP opening dependent on cyclophilin D binding to matrix-side of mPTP, which is inhibited by cyclosporin A (CsA) [Citation26,Citation27]. We then tested the effect of CsA on DNA repair in I-PpoI and TFAM-KillerRed co-expressing cells with ATG5 knockdown or CQ treatment. Remarkably, the addition of CsA significantly prevented the expansion of DNA damage signal by ATG5 knockdown or CQ treatment ()). Accordingly, we proposed that autophagy has a function in preventing the expansion of nDNA lesions through mtDNA damage-induced mPTP opening.
Figure 2. mtDNA damage determines the effect of autophagy suppression on nDNA repair. (A) Light-induced mtDNA damage in TFAM-KillerRed expression cells. HeLa cells transfected with pTFAM-KillerRed (pTFAM-KR) were exposed to light for 10 min to induce site-specific ROS and mtDNA damage. (B) After recovery for 30 min from light exposure, cells were harvested for determination of the levels of cytosolic mtDNA (cmtDNA) and total mtDNA by qPCR. The primer set of MT-RNR2/16S was used for cmt- and total mtDNA. left shows mtDNA copy number normalized by genomic ACTB/β-actin. right shows the cmtDNA normalized to total mtDNA. All data are expressed relative to that in cells without light exposure and presented as mean ± SEM from three independent experiments (* P < 0.05). (C) representative images of cells transfected with pTFAM-KR and pGFP-LC3. cells with and without light exposure were observed by fluorescence microscope and quantitated for GFP-LC3 puncta in TFAM-KR positive cells (n ≥ 100). Data are presented as mean ± SEM from three independent experiments. Scale bar: 20 μm. (D) Western blot analysis of γH2AX and phospho-ATM in TFAM-KillerRed-overexpressing HeLa cells during recovery from the light exposure. Cells exposed to IR (5 Gy) were used as a positive control for the analysis of DNA damage signals. (E) Schematic diagram of I-PpoI-induced rDNA damage in the presence of light-mediated mtDNA damage. cells were co-transfected with pLKO-HA-I-PpoI-ER and pTFAM-KillerRed and treated with 4-OHT (1 μM) for 4 h. upon withdrawal from 4-OHT treatment, cells were exposed to light for 10 min and recovery for γH2AX evaluation. (F) Effect of ATG5 knockdown on I-PpoI-induced rDNA damage in the presence of light-induced mtDNA damage. representative images of γH2AX IF staining during withdrawal from 4-OHT-induced rDNA damage with light-induced mtDNA damage in cells with and without siATG5 RNA transfection, scale bar: 20 μm. right shows relative γH2AX IF staining intensity by imageJ quantification (n ≥ 100). Data are presented as mean ± SEM from three independent experiments (* P < 0.05). (G) Effect of CQ on I-PpoI-induced nDNA damage in the presence of mtDNA damage. cells were recovered from 4-OHT withdrawal and light exposure in the medium with/without CQ (50 μM). Images of TFAM-KillerRed and γH2AX IF staining of cells are shown, scale bar: 20 μm. right shows relative γH2AX IF intensity determined using ImageJ (n ≥ 100). Data are presented as mean ± SEM from three independent experiments (* P < 0.05). (H) Effect of CsA on nDNA damage. ATG5-knockdown cells were treated with cyclosporin A (CsA, 10 μM) during recovery from I-PpoI-induced rDNA damage with light-induced mtDNA damage. γH2AX IF intensity was quantified using ImageJ (n ≥ 100). Data are presented as mean ± SEM from three independent experiments (* P < 0.05). Inset shows ATG5 knockdown by western blot. (I) Effect of Cyclosporin A in CQ-treated cells. left shows representative images, scale bar: 20 μm. right shows relative γH2AX IF intensity by imageJ quantification (n ≥ 100). Data are presented as mean ± SEM from three independent experiments (* P < 0.05)
Non-apoptotic mitochondrial permeability controls the repair of IR-induced nDNA damage
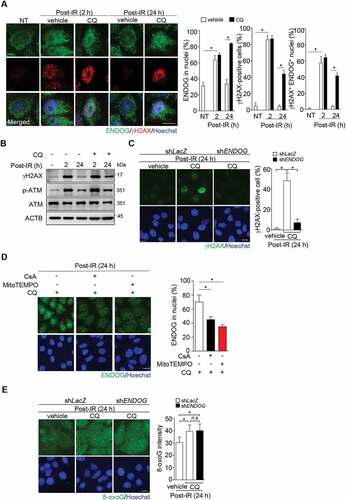
W further examined the role of autophagy in recovery from nDNA and mtDNA damage by low-dose of ionizing radiation (IR). Cells with and without ATG5 knockdown were subjected to IR (5 Gy). γH2AX IF staining showed that IR-induced nDNA damage diminished at 24 h in control cells but sustained in ATG5 knockdown cells ()). The involvement of mPTP opening in sustaining nDNA damage in autophagy-defective cells was then tested. The addition of CsA during recovery from IR prevented nDNA lesions sustained in ATG5 knockdown cells ()). The comet tail analysis confirmed that ATG5 knockdown prevented the recovery from IR-induced nDNA damage, which was reversed by CSA treatment (Fig. S2A). Since ROS is involved in mPTP opening [Citation28], we also treated these cells with MitoTEMPO, a mitochondrial ROS scavenger, and observed similar effect on preventing nDNA lesions as CsA treatment (Fig. S2B).
Figure 3. Non-apoptotic mitochondrial permeability controls the recovery of nDNA damage from IR. cells were exposed to IR (5 Gy) and recovered at the indicated time. (A) The requirement of autophagy for recovery from nDNA damage. Representative images of γH2AX IF staining. The bar graph shows the percentage of γH2AX foci positive cells (n ≥ 100). Data are presented as mean ± SEM from three independent experiments (* P < 0.05). Scale bar: 20 μm. inset shows ATG5 knockdown by western blot. (B) Mitochondrial permeability on nDNA damage. cells were recovered with or without cyclosporin A (CsA, 10 μM, for the last 4 h) for 24 h. left: γH2AX IF images, scale bar: 20 μm. right: the percentage of γH2AX foci positive cells in siATG5 cells with or without CsA treatment (n ≥ 100) from three independent experiments (mean ± SEM, * P < 0.05). (C) IR-induced mtDNA damage. Cells were harvested for cytosolic and total DNA extraction. The levels of cytosolic mtDNA (cmtDNA) and total mtDNA were measured by qPCR. The primer set of MT-RNR2/16S was used for cmt- and total mtDNA. The cmtDNA was normalized to total mtDNA in pellet, and was expressed relative to that in non-treated (NT) control. Data are presented as mean ± SEM from three independent experiments (* P < 0.05). (D) Quantification of cmtDNA released from mitochondria. Cells transfected with siControl and siATG5 RNA were non-treated (NT) or treated with IR exposure (5 Gy) with or without CsA (10 μM) pretreatment for 2 h for cytosolic mtDNA and total mtDNA determination. The cmtDNA was normalized to total mtDNA and was expressed relative to that in non-treated (NT) cells transfected with siControl. Data are presented as mean ± SEM from three independent experiments (* P < 0.05). (E) Non-apoptotic involvement. In siATG5 transfected cells, zVADfmk (50 μM), a pan-caspase inhibitor, was added to the medium after IR. The cells were fixed for γH2AX IF staining with Hoechst. left shows representative images. scale bar: 20 μm. right shows the percentage of γH2AX foci positive cells (n ≥ 100). Data are presented as mean ± SEM from three independent experiments (n.s: not significant)
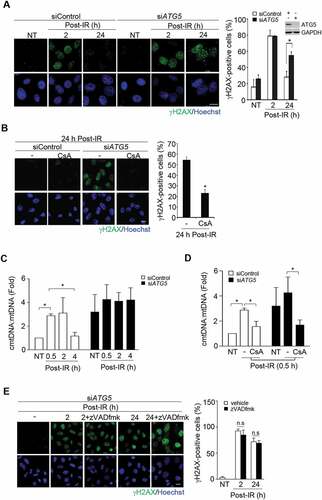
The extent of mtDNA damage after IR exposure was assessed by measuring the change of cytosolic mtDNA (cmtDNA) relative to total mtDNA. The level of cmtDNAs was increased at 0.5–2 h post-IR exposure and declined in control cells, whereas in ATG5-knockdown cells, the level of cmtDNAs remained elevated ()). The basal level of cmtDNA was higher in ATG5 knockdown cells probably due to the suppression of basal level of mitophagy. CsA treatment suppressed the release of cmtDNAs in both control and ATG5 knockdown cells, suggesting the release of cmtDNAs through mPTP ()). Given the increased mtDNA in the cytosol during recovery from IR, we suspected the association of MOMP with autophagy-regulated nDNA repair. It has been established that BAX-BAK1-mediated macropore formation leads to the release of CYCS/cytochrome c for CASP3 (caspase 3) activation, which in turn stimulates caspase-activated DNase (CAD) for nDNA cleavage in apoptotic cells [Citation29]. Accordingly, we examined the contribution of caspase to nDNA damage in ATG5 knockdown cells. Treatment of cells with a general caspase inhibitor, zVADfmk, did not affect DNA damage sustained in ATG5 knockdown cells, excluding the participation of caspase-activated DNase ()). BCL2L1/BCL-xL overexpression overcame the requirement of autophagy for recovery from IR-induced nDNA damage (Fig. S2C). Since BCL2 or BCL2L1 is capable of blocking VDAC on the mitochondrial outer membrane [Citation30,Citation31], these results suggest that non-apoptotic MOMP is involved in sustaining nDNA damage when autophagy is suppressed.
ENDOG sustains nDNA damage in autophagy defective cells
Next, we wanted to identify the mitochondrial factor released by MOMP that sustains nDNA damage. Since mitochondrial ENDOG translocation to nuclei has been shown to cause nDNA damage [Citation32–35], we tested the effect of ENDOG knockdown on persistent nDNA damage in IR-irradiated ATG5 knockdown cells. The results showed that ATG5 knockdown cells depleted of ENDOG no longer had nDNA damage sustained at 24 h recovery from IR ()). To verify whether the catalytic function of ENDOG is needed to sustain DNA damage, wild-type and catalytic-dead ENDOG-GFP were expressed (Fig. S3A). The results confirmed that the catalytic function of ENDOG is responsible for persistent DNA damage in autophagy defective cells.
Figure 4. ENDOG released from mitochondria sustains nDNA damage. (A) The role of ENDOG in nDNA damage. Cells infected with lentivirus of the shRNA of ENDOG for γH2AX IF staining at the time recovery from IR. Left: representative images of γH2AX IF staining, scale bar: 20 μm. Right: the percentage of γH2AX foci positive cells in cells with and without ENDOG knockdown (n ≥ 100) from three independent experiments (mean ± SEM, ** P < 0.01). Inset shows ATG5 and ENDOG knockdown by western blot. (B) nuclear localization of ENDOG. ENDOG IF staining before and after recovery from IR. Left: the representative images of ENDOG IF staining, scale bar: 20 μm. The percentage of cells (n ≥ 100 cells) with ENDOG in nuclei was quantitated and shown in the bar graph. Data are presented as mean ± SEM from three independent experiments (* P < 0.05). (C) Effect of 3-Methyladenine (3-MA) on IR (5 Gy)-induced nDNA damage. representative images of γH2AX and ENDOG IF staining during recovery from IR for 2 h or 24 h in cells with or without 3-MA treatment, or 3-MA coupled with CsA treatment, scale bar: 20 μm. The bar graphs show the percentage of γH2AX foci positive cells and the percentage of cells with ENDOG in nuclei, respectively in cells with or without 3-MA treatment (n ≥ 100) from three independent experiments (mean ± SEM, * P < 0.05). (D) Western blot of ENDOG in cells with or without CQ (50 μM) treatment for 24 h. GAPDH was used as internal control
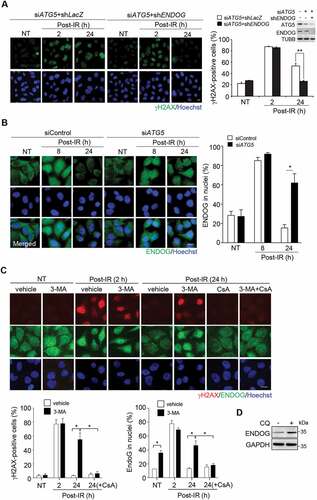
We further examined the subcellular location of ENDOG in response to IR exposure in control and ATG5 knockdown cells by IF staining. At 8 h post-recovery from IR, ENDOG was detected in nuclei of control and ATG5 knockdown cells. Likely, DNA damage leads to the translocation of ENDOG from mitochondria to nuclei. However, at 24 h post-recovery, ENDOG was no longer detected in nuclei of control cells, while retained in nuclei of ATG5 knockdown cells ()). Like ATG5 knockdown, blocking autophagy by treating cells with 3-methyladenine (3-MA), the inhibitor of class III phosphatidylinositol 3-kinase (PtdIns3K) [Citation36], also sustained nDNA damage after recovery from IR with ENDOG nuclear accumulation, which was reversed by CSA treatment ()). Since blocking autophagy by CQ treatment was able to increase cellular level of ENDOG ()), we hypothesized that ENDOG released from mitochondria is eliminated by autophagy; in the absence of autophagy, ENDOG might continue to leak out from mitochondria without autophagy-mediated clearance, thus accumulating in nuclei.
Mitochondrial stress without clearance drives ENDOG nuclear translocation
Like ATG5 knockdown, inhibition of autophagy flux by CQ treatment also sustained nDNA damage after recovery from IR with nuclear accumulation of ENDOG ()). Western blot confirmed the increases in γH2AX and p-ATM ()). Furthermore, nDNA damage in CQ-treated cells was abolished by ENDOG knockdown ()). Besides, CsA or MitoTEMPO treatment prevented the nuclear accumulation of ENDOG in CQ-treated cells ()), suggesting that mPTP and mitochondrial ROS can drive ENDOG translocation. Since ENDOG knockdown did not reduce oxidative stress ()), it is more likely that ENDOG acts downstream of ROS to sustain nDNA damage when autophagy is blocked.
Figure 5. Blocking lysosome function sustains nDNA damage via ENDOG. Cells recovered from IR exposure (5 Gy) were incubated with or without CQ (50 μM). (A) ENDOG localization and nDNA damage in the presence of CQ. representative images of ENDOG and γH2AX IF staining acquired by LSM700 confocal microscopy, scale bar: 20 μm. The bar graphs show the percentages of cells positive for ENDOG in nuclei, γH2AX, and ENDOG and γH2AX-double positive, respectively (n ≥ 100). Data are presented as mean ± SEM from three independent experiments (* P < 0.05). (B) Western blot analysis of γH2AX and phospho-ATM in cells during recovery with or without CQ treatment. β-actin was used as internal control. (C) The role of ENDOG in sustaining nDNA damage in the presence of CQ. Cells were transduced with lentiviral shRNA of ENDOG followed by IR exposure (5 Gy) and recovery for 24 h. Left: representative images of γH2AX IF staining, scale bar: 20 μm. right: the percentage of γH2AX foci positive cells with and without ENDOG knockdown (n ≥ 100) from three independent experiments (mean ± SEM, * P < 0.05). (D) The requirement of mitochondrial oxidative stress for ENDOG nuclear translocation. After IR (5 Gy), cells were treated with CQ for 24 h in combination with MitoTEMPO (20 μM). representative images of ENDOG IF staining, scale bar: 20 μm. The bar graphs show the percentages of cells with ENDOG in nuclei (n ≥ 100). Data are presented as mean ± SEM from three independent experiments (* P < 0.05). (E) The effect of ENDOG knockdown on oxidative stress. cells with and without ENDOG knockdown by shRNA were treated with CQ (50 μM) after recovery from IR for 8-oxoG IF staining. Left shows representative images. scale bar: 20 μm. right shows bar graph of the 8-oxoG intensity quantified by ImageJ (n ≥ 100) from three independent experiments. (* P < 0.05, n.s: not significant)
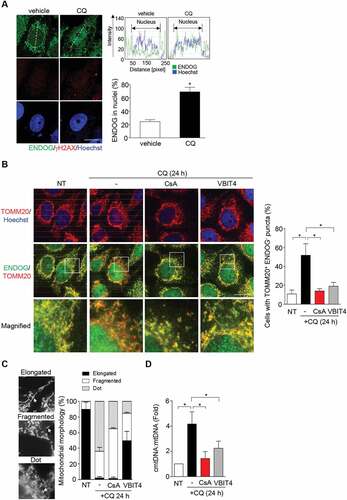
Unlike ATG5 knockdown that requires DNA damage to cause ENDOG nuclear accumulation, we found that CQ treatment for 24 h on its own already increased nuclear accumulation of ENDOG without inducing γH2AX signal ). We reasoned that CQ-treated cells have higher mitochondrial stress than ATG5 knockdown cells, thus increasing mitochondrial permeability without IR exposure. It should be emphasized that this CQ treatment did not lead to obvious apoptosis as indicated by little ANXA5/annexin V staining (data not shown). To understand how CQ treatment affects ENDOG distribution, we performed IF co-staining of TOMM20 (translocase of outer mitochondrial membrane 20) and ENDOG. The results showed that in CQ-treated cells, prominent amounts of mitochondrial puncta were observed. Remarkably, these mitochondrial puncta lacked ENDOG IF staining ()). CsA treatment caused these mitochondrial puncta to become ENDOG-positive. Co-treatment with VBIT-4, an inhibitor of VDAC1, also increased ENDOG-positive mitochondrial puncta. Thus, CQ treatment indeed stimulates a population of mitochondria with mPTP opening and MOMP to mediate the release of ENDOG ()). The assessment of mitochondrial morphology by TOMM20 IF staining revealed that CQ treatment significantly reduced the amount of elongated mitochondria with a concurrent increases of mitochondria in fragmented and dot morphology ()). CSA or VBIT-4 treatment reduced the amounts of mitochondria in dot structure. Notably, VBIT4 but not CSA treatment increased the level of elongated mitochondria. Apparently, the inhibition of VDAC1 on the outer membrane has a more profound influence on mitochondrial tubular network than that of mPTP in the inner membrane. A recent study has demonstrated that mtDNA released from nucleoid to intermembrane space stimulates the higher-order oligomerization of VDAC1 to enlarge the pore size [Citation37]. Along this line of evidence, we then asked whether CQ treatment indeed increases mtDNA damage and leakage to cause MOMP. To this end, we measured the level of cmtDNA in response to CQ treatment. The results showed that CQ treatment significantly increased the level of cmtDNA, which was reversed by CsA or VBIT-4 co-treatment (). Treatment of cells with concanamycin A (ConA), an inhibitor of lysosomal ATPase [Citation38,Citation39], also increased cmtDNA and sustained nDNA damage after recovery from IR (Fig. S4A and B).
Figure 6. Chloroquine induces mtDNA release and ENDOG-free mitochondria puncta. (A) Nuclear localization of ENDOG by CQ treatment without DNA damage. Cells were fixed for ENDOG and γH2AX IF staining. Images were acquired using LSM700 confocal microscopy (Zeiss), scale bar: 20 μm. The nuclear localization of ENDOG was analyzed using ZEN software. The bar graphs show the percentage of cells with ENDOG positive in nuclei from three independent experiments (mean ± SEM, * P < 0.05). (B-D) CQ treatment increases mitochondrial puncta free of ENDOG and mtDNA release. Cell were treated with CQ for 20 h followed by CsA (10 μM) addition for another 4 h or with VBIT4 (10 μM) co-incubation for 24 h. (B) Cells were subjected to IF co-staining of ENDOG and TOMM20. Left shows the representative images with the magnified view in the white box of merged ENDOG/TOMM20 shown below. Right shows quantification of the percentage of cells with TOMM20 puncta lacking ENDOG. Data are presented as mean ± SEM from three independent experiments (* P < 0.05). (C) Representative images of different mitochondrial morphology (left) and the quantification of mitochondrial morphology (right). Data are presented as mean ± SEM from three independent experiments. (D) Quantification of cytosolic mtDNA (cmtDNA) levels. Data are presented as mean ± SEM from three independent experiments (* P < 0.05)
TET is required for nuclear ENDOG in generating nDNA damage
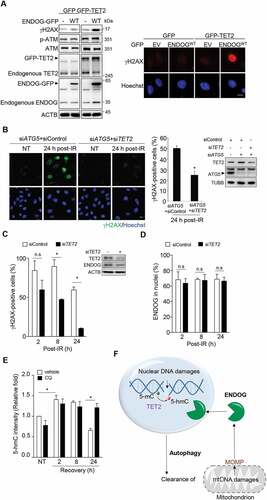
The results mentioned above indicate that ENDOG nuclear mis-location by itself did not give rise to the γH2AX foci signal. Additional molecular event after IR-induced DNA damage may be required for ENDOG to sustain DNA lesions in nuclei. ENDOG has been reported as an endonuclease preferentially cleaves 5-hydroxymethylcytosine (5-hmC) on DNAs [Citation40]. A number of TETs, methylcytosine dioxygenases, are responsible for catalyzing 5-mC conversion to 5-hmC in mammalian cells. We then asked whether TET-mediated 5-hmC by IR exposure is the priming event for nuclear ENDOG in DNA cleavage. The major TET in HeLa cells is TET2. TET2 knockdown by siRNA transfection confirmed its contribution to 5-hmC modification in HeLa cells (Fig. S5A). We further tested whether enforced ENDOG expression in nuclei is sufficient to cause nDNA damage. To this end, ENDOG-GFP was overexpressed to give nuclear distribution, which did not cause an obvious increase in γH2AX foci (Fig. S5B). Co-expression with TET2-GFP caused a striking increase in nDNA damage by ENDOG-GFP as revealed by IF and western blot of γH2AX ()). We then tested whether nDNA damage sustained in ATG5 knockdown cell is TET2-dependent. To this end, control and TET2 siRNA were separately transfected into ATG5 knockdown cells for assessing nDNA damage after recovery from IR. The γH2AX IF staining clearly showed that TET2 knockdown significantly reduced nDNA damage ()), indicating that ENDOG-mediated DNA cleavage is TET2-dependent in ATG5 knockdown cells. Similar results were observed in cells treated with CQ during recovery from IR ()). It should be mentioned that nuclear translocation of ENDOG by CQ treatment was unaffected by TET2 knockdown during recovery from IR () and S5C). To know whether 5-hmC is increased by IR-induced DNA damage, we then performed 5-hmC IF staining in these cells. The results showed that 5-hmC intensity in nuclei was increased by IR exposure in TET2-dependent manner. In addition, DNA damage sustained in CQ-treated cells was accompanied by an increase in 5-hmC modification () and S5D). Gathering all these data, we propose that in autophagy defective cells, nDNA damage stimulates 5-hmC modification to allow the nuclear translocated ENDOG, which generates additional DNA breaks in the nuclear genome ()). A previous report has shown that TET2 is recruited to the laser-micro-irradiated line in the nuclear genome, where 5-hmC is increased and is critical for DNA repair [Citation41]. In agreement, we also found that TET2 knockdown caused IR-induced nDNA damage unrepaired in control cell (Fig. S5E). Therefore, the question is why nDNA damage was still repaired in TET2/ATG5 knockdown cells. We found that the level of TET2 was indeed highly up-regulated by ATG5 knockdown ()), which led to the level of endogenous TET2 brought down by TET2 siRNA transfection similar to that in control cells without TET2 siRNA transfection. Likely, this amount of TET2 remaining in these ATG5 knockdown cells was still sufficient to be recruited to DNA damage sites for nDNA repair. However, the total change in 5-hmC modification was probably insufficient for ENDOG cleavage, thus preventing the secondary damage.
Figure 7. TET-mediated signal allows ENDOG-mediated nDNA cleavage. (A) Effect of TET2 and ENDOG overexpression on nDNA damage. Cells were transfected with GFP or TET2-GFP in combination with ENDOG-GFP plasmids. Left: western blot analysis of γH2AX, phospho-ATM, TET2, and ENDOG. right: representative IF images of γH2AX in cells. (B-E) cells were transfected with siRNA of control or TET2 for IR for γH2AX IF staining. (B) The requirement of TET2 for sustaining DNA damage in ATG5 knockdown cells. left: representative images, scale bar: 20 μm. Middle: the percentage of γH2AX foci positive cells (n ≥ 100) from three independent experiments (mean ± SEM, * P < 0.05). right: the western blot of ATG5 and TET2. (C-E) Effect of TET2 knockdown in CQ-treated cells. Cells recovered from IR were incubated with CQ (50 μM) and fixed for (C) γH2AX and (D) ENDOG IF staining. The bar graph shows the quantification of cells positive for γH2AX and ENDOG in nuclei, respectively. Cells (n ≥ 100) were analyzed (mean±SEM from three independent experiments,* P < 0.05). The western blotting shows the TET2 knockdown efficiency and ENDOG protein level. (E) Relative 5-hmC IF intensity of cells. Cells (n ≥ 100) were counted from three independent experiments (mean ± SEM,* P < 0.05). (F) A proposed model for the role of autophagy in DNA repair
Nuclear translocation of ENDOG in HBV-induced hepatocellular carcinoma
Finally, we assessed the correlation of nuclear mis-localization of ENDOG with HBx-induced tumorigenesis. HBx expression exerts multiple cellular stresses including suppression of lysosome activity, disturbance of mitochondrial dynamics, and induction of DNA damages [Citation19,Citation42,Citation43]. Here, we used Huh7, a human hepatoma cell line, stably expressing HBx under the control of the Tet-on promoter for doxycycline-induced HBx expression. After 2 to 3 days of induction, ENDOG protein levels were up-regulated with increasing expression of HBx ()). It is known that SQSTM1/p62 (sequestosome 1), an autophagosome receptor protein capable of simultaneous binding to ubiquitinated proteins and LC3-II, targets ubiquitinated proteins to lysosome for degradation [Citation44], and the decrease in lysosome activity leads to SQSTM1 accumulation. The levels of SQSTM1 and LC3-II were both elevated after HBx induction at day 2 of HBx induction. Although the level of SQSTM1 was declined at day 3, LC3-II remained elevated. IF co-staining of ENDOG and γH2AX was performed in these cells. Along with induction, the levels of ENDOG in nuclei and γH2AX foci were increased ()). Blocking mPTP by CsA treatment for 8 h was sufficient to reduce ENDOG in the nuclei with HBx induction ()). Thus, the expression of HBx can cause mPTP-dependent translocation of ENDOG to nuclei.
Figure 8. The association of nuclear translocation of ENDOG with HBV-induced hepatocellular carcinoma. (A-C) HBx induces nuclear translocation of ENDOG. Huh7 cells harboring HBx under the control of the tet-on promoter were incubated with doxycycline (Dox, 1 μg/ml). (A) cells were harvested for western blot analysis using ENDOG and HBx antibodies. (B) IF staining of ENDOG and γH2AX. Left: representative images, scale bar: 20 μm. right: the percentage of cells with ENDOG in nuclei and cells with double-positive in nuclear ENDOG and γH2AX (n ≥ 100) from three independent experiments (mean ± SEM,* P < 0.05). (C) Effect of CsA on ENDOG in nuclei. At day 3 with dox treatment, cells were incubated with cyclosporin A (CsA, 10 μM) for 8 h for IF staining of ENDOG. left: representative images, scale bar: 20 μm. right: the percentage of cells positive for ENDOG in nuclei (n ≥ 100) from three independent experiments (mean ± SEM, * P < 0.05). (D,E) The correlation of nuclear ENDOG in HBx-induced HCC. IHC staining of ENDOG and γH2AX in liver tissues of B6 mice and non-tumor/tumor parts of liver tissues of HBx transgenic mice. The inset at the right bottom shows the enlarged image in the red box, scale bar: 50 μm. Graphs show nuclei positive in ENDOG and γH2AX signal from three independent tissue sections from three different pairs of mice (mean ± SEM, * P < 0.05). (F) The increase of SQSTM1 accumulation in HBx-induced HCC. IHC staining of SQSTM1 in liver tissues of B6 mice and non-tumor/tumor parts of liver tissues of HBx transgenic mice, scale bar: 50 μm. The bar graphs show the relative SQSTM1 intensity from three independent tissue sections from three different pairs of mice (mean ± SEM, * P < 0.05). (G) nuclear ENDOG in tumor of HBV-associated HCC patient. IHC staining of ENDOG in liver tissue sections from an HBV-associated HCC human patient. The inset at the right bottom shows the enlarged image in the red box, scale bar: 50 μm. nuclei positive in ENDOG signal were counted as mean ± SEM (* P < 0.05). (H) A schema of the HBx-mPTP-ENDOG pathway in promoting genome instability in HCC development
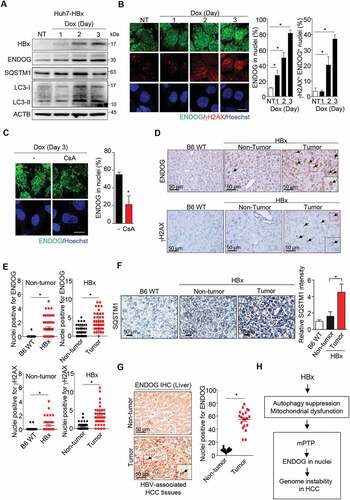
Furthermore, we performed immunohistochemistry (IHC) staining to examine ENDOG in the liver tissues of HBx transgenic mice that developed HCC starting from 13 months old [Citation45,Citation46]. Consistent with in vitro experimental data, the ENDOG signal was increased in liver tissues of HBx transgenic mice. The comparison of non-tumor and tumor liver tissues of HBx transgenic mice showed that levels of ENDOG in nuclei were significantly higher in the tumor parts accompanied by higher levels of γH2AX IHC staining ()). Consistently, IHC staining of SQSTM1 was also increased in liver tissues of HBx mice, supporting autophagy impairment in these tissues. The intensity of SQSTM1 was more pronounced in tumor parts than non-tumor parts ()). Finally, we examined ENDOG in clinical tissues from one randomly chosen HBV-associated HCC patient. In agreement, more nuclear ENDOG was detected in tumor than non-tumor parts of liver tissue of the patient. ()). Altogether, these analyses suggest that the function of HBx in mitochondrial damage and autophagy blockage promotes nuclear translocation of ENDOG via mPTP, which would increase a load of genome instability during HBV-induced HCC development ()).
Discussion
By employing rDNA-specific damage, we showed that autophagy is not essential for processing nDNA lesions. Data from IR damage experiments suggest that autophagy suppression unleashes the release of ENDOG from mtDNA damage-induced mitochondrial permeability, thereby imposing secondary damage to nDNA. In this study, the treatment with CsA that blocks mPTP in the inner membrane or with MitoTEMPO that reduces mitochondrial ROS can restore nDNA repair in the absence of autophagy. Since knockdown of ENDOG prevented nDNA damage sustained in autophagy defective cells without reducing oxidative stress, it is likely that ENDOG is more directly involved in nDNA damage and mitochondrial ROS due to mPTP opening [Citation9,Citation28]. Given that ENDOG is a mitochondrial nuclease residing in the intermembrane space, our data evoked another question of why CsA that blocks mPTP in the inner membrane could prevent ENDOG nuclear accumulation. As suggested by the recent report showing the pore enlargement of VDAC1 by mtDNA binding [Citation37], our explanation is that mPTP opening is required for damaged mtDNA released from nucleoid to the intermembrane space, where mtDNA further stimulates MOMP to cause the leak of ENDOG. Since we did not find the involvement of caspase activation in our experimental conditions, the release of ENDOG is unlikely due to outer membrane rupture. Here, we proposed that the increased mtDNA damage causes non-apoptotic MOMP in a small population of mitochondria. Without autophagy for elimination of damaged mitochondria or released ENDOG, the released ENDOG translocated into nuclei generates secondary nDNA damage.
In this study, CQ treatment without IR pre-exposure already caused ENDOG nuclear translocation with concurrent increases in ENDOG-free mitochondrial puncta and mtDNA leakage into the cytosol, which was abolished by treatment with CsA or VDAC1 inhibitor (VBIT4). According to these results, we hypothesized that a subtle population of mitochondria with non-apoptotic MOMP is constantly segregated from the mitochondrial network for autophagy-mediated elimination. The loss of lysosome function causes this poor-quality of mitochondria in puncta forms to release mtDNA and ENDOG via VDAC on the outer membrane.
Intriguingly, we found that the nuclear translocation of ENDOG by CQ treatment did not generate γH2AX signal. It has been shown that in mammalian cells, ENDOG prefers 5-hmC-modified DNA as a substrate to generate a break that facilitates DNA recombination [Citation40]. Therefore, epigenetic regulation is a critical factor determining chromatin DNA accessibility to ENDOG. We found that TET2 knockdown was able to prevent ENDOG-mediated secondary nDNA damage after IR exposure. Since IR-exposure did markedly increase 5-hmC modification in the nuclear genome, our data suggest that IR pre-exposure indeed primes chromatin DNA more susceptible to ENDOG cleavage by TET2-mediated 5-hmC modification of nDNA. In support of this notion, we further showed that overexpression of ENDOG that caused its nuclear distribution was unable to induce nDNA damage unless co-expression with TET2. Nevertheless, it remains to verify whether in autophagy defective cells, TET2-mediated signals other than DNA-damage-induced TET2-mediated 5-hmC modification is also involved in the susceptibility of nDNA to ENDOG.
Although CQ treatment is sufficient to cause ENDOG nuclear translocation, we found that CQ treatment did not affect I-PpoI-induced rDNA damage, in which γH2AX signal diminished in 9 h after removal of 4-OHT. There are two possibilities to account for the discrepancy. One is that CQ treatment for 9 h is insufficient to cause ENDOG nuclear translocation, because CQ-induced ENDOG nuclear translocation was not observed until after 16 h of treatment (data not shown). Another factor is that the intensity of I-PpoI-induced DNA damage has been estimated close to 0.8 Gy of IR [Citation5], which was unable to significantly increase 5-hmC modification as compared to that by 5 Gy IR exposure used in this study (data not shown). Thus, a sufficient amount of ENDOG nuclear translocation with DNA damage-induced TET-mediated DNA modification act in concert to perturb nDNA repair in autophagy defective cells.
Nuclear translocation of ENDOG has been associated with the progression of several degenerative disorders including muscle atrophy and cerebral ischemia [Citation47,Citation48]. Consistent with the lysosome inhibitory function of HBx [Citation19], this study revealed mPTP-dependent nuclear translocation of ENDOG by HBx expression in Huh7 cells. Moreover, DNA damage and nuclear ENDOG were markedly increased with HBx induction. We did not test whether ENDOG knockdown can mitigate HBx-induced γH2AX foci because of the additional effect of HBx in inhibiting DNA repair [Citation43]. Using HBx-induced HCC mice, our data demonstrated the correlation between the amount of ENDOG in nuclei with γH2AX signal in tumor parts of the liver. In HBV-associated HCC patients, we also found an elevation of nuclear ENDOG in tumor part of liver tissues. Compelling evidence has suggested that compromised autophagy leads to genome instability and tumor transformation [Citation49]. Our data provide new insights that mitochondrial permeability by compromised autophagy is one of the factors driving genome evolution in HBV-induced HCC development. Accordingly, specific inhibition of MOMP might be the option in mitigating HCC progression.
Materials and methods
Chemicals
The following chemicals were used: chloroquine diphosphate salt (Sigma Aldrich, C6628), 4-hydroxythamoxifen (Sigma Aldrich, H7904), cyclosporin A (Sigma Aldrich, C1832), VBIT4 (MedChemExpress, HY-129,122), MitoTEMPO (Sigma Aldrich, SML0737), doxycycline hyclate (Sigma Aldrich, D9891), Z-VAD-FMK (Sigma Aldrich, V116), 3-Methyladenine (Sigma Aldrich, M9281), concanamycin A (Sigma Aldrich, C9705), puromycin (Sigma Aldrich, P8833), Hoechst 33,342 (Invitrogen, H1399).
Cell culture and IR irradiation
HeLa cells and Huh7 cells were cultured in DMEM medium supplemented with 10% fetal bovine serum (for Huh7 cells, tetracycline-free FBS was used) and 1% P.S.G. (penicillin, streptomycin, and glutamine) at 37°C at 5% CO2. For IR-irradiation, cells were subjected to 5 gray (5 Gy) of gamma ray. To establish Huh7-tet-on HBx cell line, Huh7 cells were infected by lentiviral supernatant from 293 T cells that were transfected with pLVX-Puro-HBx and Lenti-X Packaging Single Shots (VSV-G). These cells were selected in the medium containing 2 μg/ml puromycin and clones were expanded and verified by doxycycline-inducible expression of HBx using western blotting.
Eukaryotic expression constructs
TFAM-Killer-Red was constructed by inserting cDNA of TFAM to pMF1754-KillerRed expression vector. To generate pLVX-Puro-HBx vector, PCR-amplified DNA fragment containing a full-length of HBx was digested with BamHI and EcoRI and was inserted to BamHI and EcoRI sites of pLVX-Puro (Clontech, 632,164) vector. The expression vector of pEGFP-ENDOG plasmids was kindly provided by Soon Ji Yoo (Kyung Hee University, South Korea). Site-directed mutagenesis was introduced to histidine 141 to generate catalytic-dead mutant of GFP-ENDOG (ENDOGH141A). pGFP-LC3 plasmid was from Ruey-Hwa Chen (Academia Sinica, Taipei, Taiwan). pLKO-HA-I-PpoI-ER expression plasmid was provided by Michael B. Kastan (St. Jude Children’s Research Hospital, USA).
I-PpoI- and TFAM-Killer-Red-induced DNA damage
Cells were transfected with pLKO-HA-I-PpoI-ER plasmid using Turbofect reagent according to the manufacturer’s protocol (Fermentas, R0532). After overnight, cells were treated with 4-OHT (1 μM) for 4 h to induce nuclear translocation of I-PpoI. To terminate nuclear translocation of I-PpoI, cells were washed with PBS (137 mM NaCl, 2.7 mM KCl, 10 mM Na2HPO4, 1.8 mM KH2PO4, pH 7.4) and replenished with fresh medium. Cells were transfected with TFAM-Killer-Red plasmid overnight followed by exposure to ambient light for 10 min. Cells after treatment were fixed for γH2AX IF staining to evaluate DNA damage signal.
siRNA and shRNA transfection
For siRNA transfections, cells were seeded in 60-mm tissue culture dish at 40–50% confluency and the day after transfected with 150 pmoles siRNA using Lipofectamine 2000 (Life Technologies, 11,668,019) according to the manufacturer’s protocol. siRNA sequence: ATG5 siRNA 5ʹ-GUGAGAUAUGGUUUGAAUA-3ʹ (Sigma Aldrich, SASI_H01_00173156), TET2 siRNA 5ʹ-GGCUCUUACUCUCAAAUCATT-3ʹ (Ambion, s29443), ON-TARGETplus Non-targeting Control siRNAs #2 5ʹ-UGGUUUACAUGUUGUGUGA-3ʹ (Dharmacon, D00181002). ENDOG knockdown was performed by lentiviral infection of the shRNA of ENDOG (RNAi Core, TRCN0000039646). After the infection for 3 days, cells were selected in the medium containing 1 μg/ml puromycin for 6 days.
The immunofluorescence (IF) staining and confocal microscopy
After fixation by 4% paraformaldehyde in PBS, the cells were permeabilized with 0.3% Triton X-100 (J.T.Baker, X198-07) for 10 min followed by blocking with 3% BSA (Bionovas Biotechnology, AA0530-0100) in 0.1% Triton X-100 for 1 h at room temperature. Primary and secondary Alexa-Fluor-conjugated antibodies were diluted in 3% BSA in TBST (20 mM Tris, pH 7.4, 150 mM NaCl, 0.1% Tween 20 [Sigma Aldrich, P2287]). Primary antibody incubation was carried out overnight at 4°C. After 3 × 5 min washes, secondary antibody and Hoechst 33,342 were incubated for 1 h at room temperature. Antibodies and dilution: mouse anti-γH2AX (Merck Millipore, 05–636) 1:500; mouse anti-8 hydroxyguanosine (Abcam, ab62623) 1:1000; rabbit anti-ENDOG/endonuclease G (ProSci, 3035) 1:300; rabbit anti-5-hydroxymethylcytosine (ACTIVE MOTIF, 39,769) 1:500; mouse anti-TOMM20 (Abcam, ab56783) 1:200; rabbit anti-ATM (phospho-Ser1981) (GeneTex, GTX132146); FITC-conjugated goat anti-mouse IgG (Sigma Aldrich, F9006) 1:100; FITC-conjugated goat anti-rabbit IgG (Sigma Aldrich, F9887) 1:100; TRITC-conjugated goat anti-mouse IgG (Sigma Aldrich, T5393) 1:200. Images were acquired in a Carl Zeiss AxioObserver A1 or confocal microscopy Zeiss LSM700 with the 63× oil objective. Quantification was done by automatic acquisition of images using the ImageJ software.
Mitochondrial DNA copy number
Cells were collected with total DNA lysis buffer for genomic DNA extraction according to the instruction manual (Genomic DNA Purification Kit; Promega, A1125). Genomic DNA (100 ng) was used for quantitative PCR (qPCR) analysis (StepOne, ABI, Inc.) with the primer complementary to mitochondrial DNA sequence (mt-tRNA). The ΔCT value of mt-tRNA was normalized with the value of ACTB/β-actin (actin beta). The primer sequences for qPCR are shown as follows:
mt tRNA forward: 5ʹ-CACCCAAGAACAGGGTTTGT-3ʹ
mt tRNA reverse: 5ʹ-TGGCCATGGGTATGTTGTTA-3ʹ
ACTB forward: 5ʹ-GCGGGAAATCGTGCGTGACATT-3ʹ
ACTB reverse: 5ʹ-GATGGAGTTGAAGGTAGTTTCGTG-3ʹ
Cytosolic mtDNA quantification
Cells (2x10⁶) were lysed with 170 μl digitonin buffer (150 mM NaCl, 50 mM HEPES, pH 7.4, 25 μg/ml digitonin [Merck Millipore, 300,410]), followed by rotation at room temperature for 10 min and centrifugation at 16,000 × g for 25 min at 4 oC. The supernatant (cmtDNA) was used for qPCR. The remaining pellet was resuspended in DNA lysis buffer for genomic DNA extraction according to the instruction manual (Promega, A1125). The DNA pellet was resuspended in 340 μl of TE buffer, subjected to qPCR analysis (StepOne, ABI, Inc.). The cmtDNA detected in the supernatant was normalized to the total mtDNA in the pellet. The primer sequences for qPCR are shown as follows:
MT-RNR2/mtrRNA 16S forward: 5ʹ-GCCTTCCCCCGTAAATGATA-3ʹ
MT-RNR2/mtrRNA 16S reverse: 5ʹ-TTATGCGATTACCGGGCTCT-3ʹ
Western blot analysis
Cell pellets were collected and lysed in RIPA buffer (50 mM Tris, pH 7.4, 150 mM NaCl, 1% Nonidet P-40 [Sigma Aldrich, I3021], 0.25% sodium deoxycholate [Sigma Aldrich, D6750], 5 mM EDTA, pH 8.0, 1 mM EGTA, pH 8.0, protease inhibitors [Sigma Aldrich, P8340] and phosphatase inhibitors [1 mM sodium fluoride, 10 mM sodium pyrophosphate, 2 mM sodium orthovanadate]). Samples were denatured at 95°C for 5 min. Proteins were separated on 7–12% Bis-Tris acrylamide gels. After separation, proteins were transferred to polyvinylidene difluoride membranes (Merck Millipore, PK-NEF1005) followed by blocking with 5% milk in TBS-Tween 20. Primary antibodies are shown as follows: ENDOG (rabbit anti-ENDOG; Sigma Aldrich, SAB3500213), ATG5 (rabbit anti-ATG5; Novus Biological, NB110-53,818), LC3 (rabbit anti-LC3; Novus Biologicals, NB100-2331), SQSTM1/p62 (rabbit anti-SQSTM1; GeneTex, GTX100685), ATM p-S1981 (rabbit anti-ATM p-S1981; GeneTex, GTX132146), ATM (rabbit anti-ATM; Cell Signaling Technology, 2873), γH2AX (rabbit anti-γH2AX; Abcam, ab2893), TET2 (rabbit anti-TET2;, GeneTex, GTX124205), BCL2L1/BCL-xL (rabbit anti-BCL2L1; Cell Signaling Technology, 2764), GAPDH (mouse anti-GAPDH; GeneTex, GTX627408), ACTB/β-actin (mouse anti-αCTB; Sigma Aldrich, A5441), TUBB/β-tubulin (mouse anti-TUBB; Sigma Aldrich, T4026), HBx (mouse anti-HBx; a gift from Ning-Shao Xia, National Institute of Diagnostics and Vaccine Development in Infectious Diseases, School of Public Health, Xiamen University, Xiamen, China) and horseradish peroxidase-conjugated goat anti-rabbit IgG (Sigma Aldrich, AP132P), goat anti-mouse IgG (Santa Cruz Biotechnology, sc-2005) as secondary antibodies. Blots were probed with HRP-conjugated secondary antibodies and developed with ECL Western blotting Detection Reagent (Merck Millipore, WBLUF0500).
Mice and HCC development
Generation of the A106 HBx transgenic (HBx-TG) mice were described previously [Citation50]. The albumin-HBx transgenic mice were generated using the pronucleus microinjection of C57 BL/6 fertilized eggs. All the mice used in this study are males. All of the mice have a pure C57 BL/6 background and were bred/housed in a specific pathogen-free (SPF) facility with a 12 h light/12 h dark cycle at constant temperature (20–22°C). For the hepatocellular carcinoma (HCC) carcinogenesis, the HBx-TG mice were sacrificed at 16-month old to analyze their tumor burden and pathology. The animal protocol was approved by the Institutional Animal Care and Use Committee (IACUC) of National Yang-Ming University.
Immunohistochemistry staining
Immunohistochemistry was performed on paraffin-embedded mouse liver tissue sections. The tissue sessions were dewaxed and rehydrated using the standard protocol of xylene-ethanol procedure. Antigen retrieval was performed by boiling tissues for 20 min in sodium citrate buffer (10 mM sodium citrate, 0.05% Tween 20, pH 6.0), followed by ENDOG staining or 15 min in Tris-EDTA buffer (10 mM Tris-Base, 1 mM EDTA solution, 0.05% Tween 20, pH 9.0) for γH2AX staining using a microwave. Blocking was performed in TBS (20 mM Tris-Base, 0.8% NaCl, pH 7.6) with 10% normal goat serum (Vector Laboratories, S-1000) and 1% BSA at room temperature for 2 h and incubated with primary antibodies (anti-ENDOG 1:500, Sigma Aldrich, SAB3500213; anti-γH2AX 1:200, GeneTex, GTX127340; anti-SQSTM1/p62 1:1000, GeneTex, GTX100685) at 4°C overnight. Afterward, sections were incubated with 0.3% H2O2 in TBS at room temperature for 15 min to inhibit the endogenous peroxidase activity. HRP-conjugated secondary antibody diluted in TBS with 1% BSA was added for 1 h of incubation at room temperature. Sections were rinsed in TBS and then developed using 3,3ʹ-diaminobenzidine chromogen (DAB) with counterstaining using hematoxylin.
Human samples
The paraffin sections of the tumor and non-tumorous part of an HBV-related hepatocellular carcinoma were retrieved from the database of Department of Pathology, National Taiwan University Hospital. ENDOG expression was detected by immunohistochemical staining using a Ventana BenchMark ULTRA stainer (Ventana, Oro Valley, AZ, USA). Antigen retrieval was performed by incubating slides in CC1 solution for 16 min at 100°C. Then, the slides were incubated with an anti-ENDOG antibody at 1:100 dilution for 18 min at room temperature. The slides were then incubated with a polymer-HRP reagent (OptiView DAB IHC detection kit; Ventana, 760–700). The peroxidase activity was visualized using a diaminobenzidine tetrahydrochloride solution. The sections were counterstained with hematoxylin.
Statistical analysis
All values are presented as mean ± SEM. Statistical analysis of the results from three independent experiments was performed by a two-sample t-test for comparison of two groups or two-way analysis of variance (ANOVA) with Tukey’s honest significant difference (HSD) post-hoc tests for multiple-comparisons. The P-value less than 0.05 was considered as statistically significant.
Supplemental Material
Download Zip (2.8 MB)Acknowledgments
We thank the National RNAi Core Facility, Academia Sinica for ENDOG shRNA plasmids, Ruey-Hwa Chen (Academia Sinica, Taiwan) for pGFP-LC3, Soon Ji Yoo (Kyung Hee University, South Korea) for pEGFP-ENDOG, Michael B. Kastan (St. Jude Children’s Research Hospital, USA) for pLKO-HA-I-PpoI-ER, and Li-Lung Juan (Genome Research Center, Academia Sinica, Taiwan) for GFP-TET2. TC is supported by PhD fellowship from National Taiwan University and Ministry of Science and Technology, Taiwan. This research is supported by grants from Ministry of Science and Technology, Taiwan ((MOST 109-2326-B-002-004) and (MOST 109-2634-F-002-043)), and National Taiwan University grant (NTU-109L901402D).
Disclosure statement
The authors declare that they have no conflict of interest.
Supplementary material
Supplemental data for this article can be accessed here.
Additional information
Funding
Related Research Data
References
- Vessoni AT, Filippi-Chiela EC, Menck CF, et al. Autophagy and genomic integrity. Cell Death Differ. 2013;20(11):1444–54 .
- Hewitt G, Korolchuk VI. Repair, reuse, recycle: the expanding role of autophagy in genome maintenance. Trends Cell Biol. 2017;27(5):340–351.
- Chen H, Wang J, Liu Z, et al. Mitochondrial DNA depletion causes decreased ROS production and resistance to apoptosis. Int J Mol Med. 2016;38(4):1039–46 .
- Chandel NS, Schumacker PT. Cells depleted of mitochondrial DNA (rho0) yield insight into physiological mechanisms. FEBS Lett. 1999;454(3):173–6.
- Berkovich E, Monnat RJ Jr., Kastan MB. Roles of ATM and NBS1 in chromatin structure modulation and DNA double-strand break repair. Nat Cell Biol. 2007;9(6):683–90.
- Flick KE, Jurica MS, Monnat Jr, RJ, et al. DNA binding and cleavage by the nuclear intron-encoded homing endonuclease I-PpoI. Nature. 1998;394(6688):96–101 .
- Webster KA. Mitochondrial membrane permeabilization and cell death during myocardial infarction: roles of calcium and reactive oxygen species. Future Cardiol. 2012;8(6):863–84.
- Bonora M, Pinton P. The mitochondrial permeability transition pore and cancer: molecular mechanisms involved in cell death. Front Oncol. 2014;4:302.
- Kalogeris T, Bao Y, Korthuis RJ. Mitochondrial reactive oxygen species: a double edged sword in ischemia/reperfusion vs preconditioning. Redox Biol. 2014;2:702–14.
- Bernardi P. The mitochondrial permeability transition pore: a mystery solved? Front Physiol. 2013;4:95.
- Seidlmayer LK, Juettner VV, Kettlewell S, et al. Distinct mPTP activation mechanisms in ischaemia-reperfusion: contributions of Ca2+, ROS, pH, and inorganic polyphosphate. Cardiovasc Res. 2015;106(2):237–48 .
- Chipuk JE, Bouchier-Hayes L, Green DR. Mitochondrial outer membrane permeabilization during apoptosis: the innocent bystander scenario. Cell Death Differ. 2006;13(8):1396–402.
- Shore GC. Apoptosis: it’s BAK to VDAC. EMBO Rep. 2009;10(12):1311–3.
- Camara AKS, Zhou Y, Wen PC, et al. Mitochondrial VDAC1: A key gatekeeper as potential therapeutic target. Front Physiol. 2017;8:460.
- Brunelle JK, Letai A. Control of mitochondrial apoptosis by the Bcl-2 family. J Cell Sci. 2009;122(Pt 4):437–41.
- Ichim G, Lopez J, Ahmed SU, et al. Limited mitochondrial permeabilization causes DNA damage and genomic instability in the absence of cell death. Mol Cell. 2015;57(5):860–872.
- Buttner S, Habernig L, Broeskamp F, et al. Endonuclease G mediates alpha-synuclein cytotoxicity during Parkinson’s disease. Embo J. 2013;32(23):3041–54 .
- Neuveut C, Wei Y, Buendia MA. Mechanisms of HBV-related hepatocarcinogenesis. J Hepatol. 2010;52(4):594–604.
- Liu B, Fang M, Hu Y, et al. Hepatitis B virus X protein inhibits autophagic degradation by impairing lysosomal maturation. Autophagy. 2014;10(3):416–30.
- Lee YI, Hwang JM, Im JH, et al. Human hepatitis B virus-X protein alters mitochondrial function and physiology in human liver cells. J Biol Chem. 2004;279(15):15460–71.
- Hanada T, Noda NN, Satomi Y, et al. The Atg12-Atg5 conjugate has a novel E3-like activity for protein lipidation in autophagy. J Biol Chem. 2007;282(52):37298–302 .
- Mauthe M, Orhon I, Rocchi C, et al. Chloroquine inhibits autophagic flux by decreasing autophagosome-lysosome fusion. Autophagy. 2018;14(8):1435–1455 .
- Kang D, Kim SH, Hamasaki N. Mitochondrial transcription factor A (TFAM): roles in maintenance of mtDNA and cellular functions. Mitochondrion. 2007;7(1–2):39–44.
- Kaufman BA, Durisic N, Mativetsky JM, et al. The mitochondrial transcription factor TFAM coordinates the assembly of multiple DNA molecules into nucleoid-like structures. Mol Biol Cell. 2007;18(9):3225–36 .
- Bogenhagen DF, Rousseau D, Burke S. The layered structure of human mitochondrial DNA nucleoids. J Biol Chem. 2008;283(6):3665–75.
- Fischer G, Wittmann-Liebold B, Lang K, et al. Cyclophilin and peptidyl-prolyl cis-trans isomerase are probably identical proteins. Nature. 1989;337(6206):476–8 .
- Porter GA Jr., Beutner G. Cyclophilin D, somehow a master regulator of mitochondrial function. Biomolecules. 2018;8:4.
- Halestrap AP, Woodfield KY, Connern CP. Oxidative stress, thiol reagents, and membrane potential modulate the mitochondrial permeability transition by affecting nucleotide binding to the adenine nucleotide translocase. J Biol Chem. 1997;272(6):3346–54.
- McIlroy D, Sakahira H, Talanian RV, et al. Involvement of caspase 3-activated DNase in internucleosomal DNA cleavage induced by diverse apoptotic stimuli. Oncogene. 1999;18(31):4401–8.
- Yang J, Liu X, Bhalla K, et al. Prevention of apoptosis by Bcl-2: release of cytochrome c from mitochondria blocked. Science. 1997;275(5303):1129–32 .
- Wang X. The expanding role of mitochondria in apoptosis. Genes Dev. 2001;15(22):2922–33.
- Bajt ML, Cover C, Lemasters JJ, et al. Nuclear translocation of endonuclease G and apoptosis-inducing factor during acetaminophen-induced liver cell injury. Toxicol Sci. 2006;94(1):217–25 .
- Bahi N, Zhang J, Llovera M, et al. Switch from caspase-dependent to caspase-independent death during heart development: essential role of endonuclease G in ischemia-induced DNA processing of differentiated cardiomyocytes. J Biol Chem. 2006;281(32):22943–52 .
- Li LY, Luo X, Wang X. Endonuclease G is an apoptotic DNase when released from mitochondria. Nature. 2001;412(6842):95–9.
- van Loo G, Schotte P, van Gurp M, et al. Endonuclease G: a mitochondrial protein released in apoptosis and involved in caspase-independent DNA degradation. Cell Death Differ. 2001;8(12):1136–42 .
- Seglen PO, Gordon PB. 3-Methyladenine: specific inhibitor of autophagic/lysosomal protein degradation in isolated rat hepatocytes. Proc Natl Acad Sci U S A. 1982;79(6):1889–92.
- Kim J, Gupta R, Blanco LP, et al. VDAC oligomers form mitochondrial pores to release mtDNA fragments and promote lupus-like disease. Science. 2019;366(6472):1531–1536 .
- Huss M, Ingenhorst G, König S, et al. Concanamycin A, the specific inhibitor of V-ATPases, binds to the V(o) subunit c. J Biol Chem. 2002;277(43):40544–8 .
- Drose S, Bindseil KU, Bowman EJ, et al. Inhibitory effect of modified bafilomycins and concanamycins on P- and V-type adenosinetriphosphatases. Biochemistry. 1993;32(15):3902–6 .
- Robertson AB, Robertson J, Fusser M, et al. Endonuclease G preferentially cleaves 5-hydroxymethylcytosine-modified DNA creating a substrate for recombination. Nucleic Acids Res. 2014;42(21):13280–93 .
- Kafer GR, Li X, Horii T, et al. 5-Hydroxymethylcytosine marks sites of DNA damage and promotes genome stability. Cell Rep. 2016;14(6):1283–1292 .
- Kim SJ, Khan M, Quan J, et al. Hepatitis B virus disrupts mitochondrial dynamics: induces fission and mitophagy to attenuate apoptosis. PLoS Pathog. 2013;9(12):e1003722.
- Becker SA, Lee TH, Butel JS, et al. Hepatitis B virus X protein interferes with cellular DNA repair. J Virol. 1998;72(1):266–72 .
- Myeku N, Figueiredo-Pereira ME. Dynamics of the degradation of ubiquitinated proteins by proteasomes and autophagy: association with sequestosome 1/p62. J Biol Chem. 2011;286(25):22426–40.
- Yang MH, Chen M, Mo HH, et al. Utilizing experimental mouse model to identify effectors of Hepatocellular Carcinoma induced by HBx antigen. Cancers (Basel. 2020;12(2). DOI:10.3390/cancers12020409.
- Wu YF, Fu SL, Kao CH, et al. Chemopreventive effect of silymarin on liver pathology in HBV X protein transgenic mice. Cancer Res. 2008;68(6):2033–42.
- Dupont-Versteegden EE, Strotman BA, Gurley CM, et al. Nuclear translocation of EndoG at the initiation of disuse muscle atrophy and apoptosis is specific to myonuclei. Am J Physiol Regul Integr Comp Physiol. 2006;291(6):R1730–40 .
- Lee BI, Lee DJ, Cho KJ, et al. Early nuclear translocation of endonuclease G and subsequent DNA fragmentation after transient focal cerebral ischemia in mice. Neurosci Lett. 2005;386(1):23–7 .
- Mathew R, Kongara S, Beaudoin B, et al. Autophagy suppresses tumor progression by limiting chromosomal instability. Genes Dev. 2007;21(11):1367–81.
- Wu BK, Li CC, Chen HJ, et al. Blocking of G1/S transition and cell death in the regenerating liver of Hepatitis B virus X protein transgenic mice. Biochem Biophys Res Commun. 2006;340(3):916–28.