
ABSTRACT
Dysfunctional organelles and defective turnover of organelles are engaged in multiple human diseases, but are elusive to image with conventional organelle probes. To overcome this, we developed intra-mitochondrial CLICK to assess mitophagy (IMCLAM), using a pair of conventional ΔΨm probes, where each probe alone fails to track dysfunctional mitochondria. The in situ formed optical triad is stably trapped in mitochondria without resorting to ΔΨm. Utilizing an acidity-responsive ΔΨm probe, IMCLAM enabled fluorescence-on detection of mitophagy by sensing pH acidification upon delivery of mitochondria into lysosomes. Moreover, we applied IMCLAM to assay mitophagy induced by pharmacological compounds in living cells and wild-type zebrafish embryos. Thus, IMCLAM offers a simplified tool to study mitochondria and mitophagy and provide a basis for screening mitophagy-inducing compounds. Abbreviations: CCCP, carbonyl cyanide m-chlorophenylhydrazone; IMCLAM, intra-mitochondrial CLICK to assess mitophagy; ROX, X-rhodamine; SPAAC, stain-promoted azide-alkyne Click Chemistry; TPP, triphenylphosphonium.
Graph abstract
Introduction
Dysfunctional organelles have a causal role in diverse pathological disorders [Citation1–3] and are attractive targets for therapeutic intervention [Citation4–6]. For instance, mitochondria are bioenergetic and cell signaling organelles featuring negative electropotential across the membrane (ΔΨm) critical for organelle functions [Citation7]. ΔΨm decline promotes numerous cellular events including oxidative stress, inflammation, and mitophagy by which dysfunctional mitochondria could be eliminated by lysosomes [Citation8]. In addition, defects in mitophagy have been linked to multiple diseases such as Parkinson disease [Citation9,Citation10]. Currently, small molecules that could promote mitophagy are actively pursued as potential therapeutics for neurological disorders and aging-related diseases [Citation11]. As such, methods capable of tracking dysfunctional mitochondria and mitophagy are of significance for biology and drug development.
Although widely used to pinpoint organelles, recombinant protein technology is restricted to a handful of fluorescent protein tags with optical read-out largely irrelevant to organelle status. Alternatively, mitochondria are routinely imaged with synthetic probes, constituted mostly by cationic fluorophores and dyes conjugated to a lipophilic cation [Citation12]. These traditional ΔΨm probes are electrophoretically enriched in mitochondria but readily dissipate from mitochondria upon loss of ΔΨm. To prevent probe leakage from stressed mitochondria and image mitophagy, we sought to develop a probe-to-probe ligation approach to tag mitochondria with dual optical reporters: one to monitor the local milieu and the other to pinpoint the host organelles.
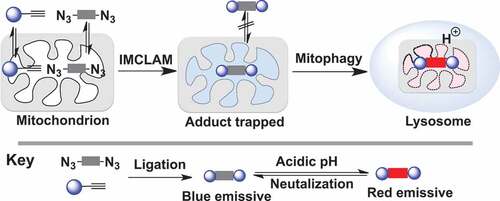
Bioorthogonal chemistry has been applied to diverse biological systems spanning from biomolecules to whole animals [Citation13]. Taking advantage of stain-promoted azide-alkyne click chemistry (SPAAC) [Citation14], we herein report intra-mitochondrial CLICK for assessing mitophagy (IMCLAM) by combining two conventional ΔΨm-probes, whereby each probe alone is incompetent to track depolarized mitochondria. IMCLAM yields an optical triad that is restricted in mitochondria irrespective of ΔΨm changes (). Utilizing an acidity-activatable probe and a pH-inert reference probe, IMCLAM enables signal-on detection of mitophagy by red fluorescence generated upon delivery of mitochondria into acidic lysosomes. This was further employed to image mitophagy induced by pharmacological compounds in living cells and zebrafish embryos ().
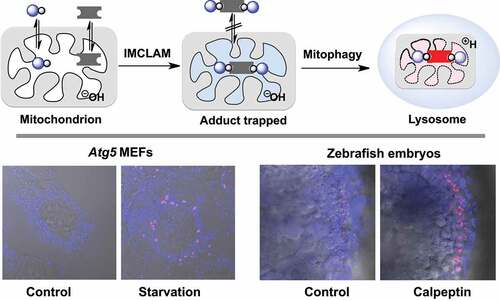
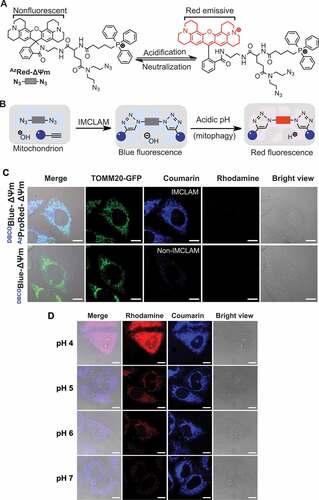
Figure 1. Schematic for fluorescence-on detection of mitophagy by IMCLAM. Intra-organelle bioorthogonal ligation of a pair of ΔΨm-probes gives an optical triad stably trapped in mitochondria. Delivery of mitochondria into lysosomes in mitophagy gives rise to acidity-triggered red fluorescence of the triad restricted in mitochondria
Results and discussion
IMCLAM for optical tracking of depolarized mitochondria
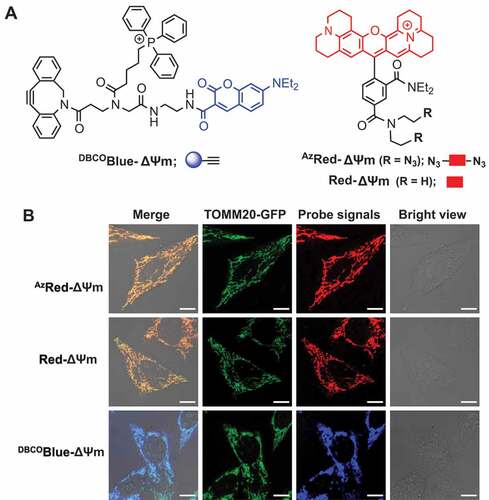
As a proof of concept for IMCLAM (), we first wished to develop two probes that: 1) selectively accumulate in mitochondria, 2) exhibit distinct fluorescence to define their subcellular distribution, and 3) contain bioorthogonal handles for SPAAC. Because cationic rhodamine and triphenylphosphonium (TPP) effectively ferry diverse cargos into mitochondria [Citation15–17], we hence synthesized AzRed-ΔΨm and DBCOBlue-ΔΨm ( and S1A). The former is a red emissive cationic X-rhodamine (ROX) bearing a bis(2ʹ-azidoethyl)amide moiety, while the latter contains TPP, coumarin and dibenzocyclooctyne (DBCO) for ligation with azide. Because diffusion coefficients decrease with increasing molecular mass and to achieve an adduct trappable in organelles, AzRed-ΔΨm was designed to contain two azido groups for conjugation with two equivalents of DBCOBlue-ΔΨm. As the control, we synthesized Red-ΔΨm that is a structural analog of AzRed-ΔΨm and lacks an azide moiety required for SPAAC ( and S1A). AzRed-ΔΨm readily combined with DBCOBlue-ΔΨm in vitro to afford the desired optical triad as a mixture of three regioisomers, as determined by HPLC analysis and high-resolution mass spectrometry (Fig. S1B-D).
To verify probe selectivity for mitochondria, HeLa cells expressing TOMM20-GFP were incubated with DBCOBlue-ΔΨm, AzRed-ΔΨm or Red-ΔΨm, respectively. Confocal fluorescence microscopy revealed stringent probe colocalization with TOMM20-GFP, a constitutive membrane protein of mitochondria (). This proves selective accumulation of the tested probes in mitochondria.
Figure 2. Probe selectivity for mitochondria. (A) Chemical structure of AzRed-ΔΨm, Red-ΔΨm and DBCOBlue-ΔΨm. (B) Selective probe accumulation in mitochondria. TOMM20-GFP+ HeLa cells were stained with AzRed-ΔΨm (0.3 μM), Red-ΔΨm (0.3 μM), or DBCOBlue-ΔΨm (2.0 μM) in DMEM for 1 h, washed with PBS three times at 37°C, and then visualized by confocal microscopy. Scale bars: 10 μm
To find out whether IMCLAM could afford adducts trappable in ΔΨm-abolished mitochondria, TOMM20-GFP+ HeLa cells were first cultured for 1 h with AzRed-ΔΨm or Red-ΔΨm in DMEM at 37°C. The cells were then washed three times with PBS to remove unloaded dye from the cytosol and medium. The second dye was then loaded by maintaining the cells for 1.5 h in DMEM spiked with DBCOBlue-ΔΨm (IMCLAM) or no addition (controls). These cells were washed with phosphate-buffered saline (PBS), and then maintained in DMEM containing CCCP (carbonyl cyanide m-chlorophenylhydrazone) to dissipate ΔΨm [Citation18]. CCCP caused complete loss of mitochondria-associated fluorescence in AzRed-ΔΨm+ or Red-ΔΨm+ cells (), a common feature of classical ΔΨm-probes. Similar results were also obtained from Red-ΔΨm+/DBCOBlue-ΔΨm+ cells, consistent with the incapability of azide-free Red-ΔΨm to react with DBCOBlue-ΔΨm. To our delight, intense red fluorescence was identified to colocalize with TOMM20-GFP in cells stained with DBCOBlue-ΔΨm/AzRed-ΔΨm after CCCP treatment ( and ), reflecting genesis of an optical adduct retained in depolarized mitochondria. Next, HeLa cells were treated with AzRed-ΔΨm followed by varying doses of DBCOBlue-ΔΨm. After depleting ΔΨm with CCCP, these cells exhibited dose-dependent mitochondrial retention of the former on the latter (Fig. S2), further supporting IMCLAM.
We noticed bright coumarin signals in DBCOBlue-ΔΨm+ cells and DBCOBlue-ΔΨm+/Red-ΔΨm+ cells; however, such signals were absent in AzRed-ΔΨm+/DBCOBlue-ΔΨm+ cells (). Consistently, flow cytometry analysis revealed that intracellular fluorescence of DBCOBlue-ΔΨm dramatically declined as a function of AzRed-ΔΨm concentration, but are largely unaffected by Red-ΔΨm (Fig. S3A-C). This loss is due to intra-molecular fluorescence resonance energy transfer (FRET) of the triad (). Consistently, the triad synthesized in vitro, relative to DBCOBlue-ΔΨm and AzRed-ΔΨm, exhibited significantly enhanced rhodamine fluorescence emission at the expense of coumarin fluorescence (Fig. S3D and S3E), confirming IMCLAM-conferred intramolecular FRET.
Figure 3. IMCLAM enables fluorescence tagging of ΔΨm-dissipated mitochondria. (A) Illustration for IMCLAM conferred retention of red fluorescence in mitochondria and blue signal loss. (B) Retention of red fluorescence in depolarized mitochondria via IMCLAM. HeLa cells were incubated at 37°C for 1 h in DMEM supplemented with AzRed-ΔΨm (0.3 μM) or Red-ΔΨm (0.3 μM), washed with PBS three times and then cultured in DMEM spiked with DBCOBlue-ΔΨm (2 μM) for 1 h. The cells were washed with PBS three times, and then maintained in DMEM containing CCCP (25 μM) for 1 h before analysis (without washing). (C) Tagging of depolarized mitochondria. TOMM20-GFP+ cells prestained with AzRed-ΔΨm/DBCOBlue-ΔΨm were incubated for 1 h in DMEM supplemented with CCCP (25 μM) and then analyzed without washing for intracellular fluorescence. (D) Plots of fluorescence of coumarin, rhodamine, and GFP measured along the line shown in merged image. This reveals colocalization of rhodamine with TOMM20-GFP. (E) IMCLAM suppresses coumarin fluorescence in mitochondria. DBCOBlue-ΔΨm+ HeLa cells were incubated with AzRed-ΔΨm (0.3 μM) or Red-ΔΨm (0.3 μM) in DMEM at 37°C for 1 h. The cells were washed with PBS three times and then imaged by confocal microscopy. Scale bars: 10 μm
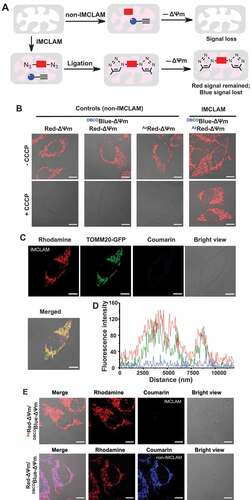
We proceeded to rule out the possibility that optical triad formed beyond mitochondria could contribute to fluorescence in ΔΨm-abolished mitochondria. We treated TOMM20-GFP+ HeLa cells with the triad synthesized in vitro. This gave no detectable fluorescence in cells (Fig. S4A), showing incapability of extracellularly spiked adduct to target mitochondria, likely due to low diffusivity of high molecular weight probe across plasma membranes. ΔΨm-probes are permeable to plasma membrane, but incompetent to target depolarized mitochondria. Therefore, HeLa cells were stressed with CCCP to depolarize mitochondria, and then cultured with AzRed-ΔΨm/DBCOBlue-ΔΨm. Again, no fluorescence could be observed in mitochondria (Fig. S4B), showing that the optical triad formed in cytosol (if any) is incompetent to accumulate in depolarized mitochondria. Together, these findings support organelle-restricted IMCLAM as the underlying mechanism for fluorescence tagging of depolarized mitochondria. In addition, our method is applicable to additional cell lines including MCF-7, B16F10 and Raw 264.7 macrophages (Fig. S5), indicating the generality of IMCLAM to track depolarized mitochondria.
IBLCP for Fluorescence-on Detection of Mitophagy
After validating IMCLAM to tag ΔΨm-abolished mitochondria, we were keen to find out whether IMCLAM could detect mitophagy, a process pertinent to multiple diseases [Citation9,Citation10]. To date, genetic methods encoding fluorescent protein-fused biomarkers of autophagosomes or mitochondria have been employed to study autophagy or mitophagy [Citation19–21]. Albeit widely used, these proteinic indicators are prone to self-aggregation or autophagy-independent protein aggregates, giving rise to false-positive signals [Citation22,Citation23]. Recently, mitophagy was visualized with sophisticated chemical probes prone to self-assembly in mitochondria or form covalent linkage with mitochondrial proteins [Citation24–29]. Alternative to these approaches, we aimed to develop dual-color tracking of mitophagy with conventional organelle probes capable of reporting local milieu.
Mitophagy is a catabolic process by which excess or dysfunctional mitochondria are delivered into lysosomes for turnover. In this process, the alkaline lumen of mitochondria (pH□8) is switched to acidic pH due to delivery of mitochondria into acidic lysosomes (pH□4-5). To sense mitochondrial pH plummeting in mitophagy with IMCLAM, we synthesized AzProRed-ΔΨm, a trifunctional probe containing TPP, bis(2ʹ-azidoethyl) moiety, and ROX-lactam activatable to acidic pH (). ROX-lactam is the derivative of X-rhodamine with intramolecular lactam suitable for signal-on imaging of acidic lysosomes [Citation30,Citation31]. AzProRed-ΔΨm and its adduct with DBCOBlue-ΔΨm are nonfluorescent at neutral-to-alkaline pH, but exhibit intense red fluorescence in acidic media (Fig. S6), which is consistent with protonation mediated fluorogenic isomerization of ROX-lactam ().
We then stained TOMM20-GFP+ HeLa cells with DBCOBlue-ΔΨm, either alone or combined with AzProRed-ΔΨm. Subsequent CCCP treatment abolished blue fluorescence in DBCOBlue-ΔΨm+ cells whereas robust blue signals survived in cells co-stained with AzProRed-ΔΨm and DBCOBlue-ΔΨm, showing IMCLAM-conferred fluorescence tagging of depolarized mitochondria ( and ). To verify pH responsiveness of IMCLAM, AzProRed-ΔΨm+/DBCOBlue-ΔΨm+ cells were fixed with paraformaldehyde and then maintained in buffer of varied pH values (pH 4–7). As expected, intracellular red fluorescence emerged in acidic pH and intensified as pH decreased (). Together, these results showed the feasibility of IMCLAM to prime mitochondria with an acidity-reporting fluorogen.
Figure 4. IMCLAM tags mitochondria with an acidity-reporting fluorogen. (A) Protonation triggered fluorogenic isomerization of ROX-lactam. (B) Schematic for signal-on detection of mitophagy by IMCLAM. Ligation of DBCOBlue-ΔΨm with AzProRed-ΔΨm gives an optical triad suitable for imaging mitophagy. (C) IMCLAM retains coumarin fluorescence in CCCP-stressed mitochondria. HeLa cells were stained with DBCOBlue-ΔΨm (3.0 μM) or DBCOBlue-ΔΨm (3.0 μM) in DMEM at 37°C for 1 h, washed with PBS three times, and then cultured for 1 h in DMEM spiked with AzProRed-ΔΨm (2 μM). These cells were washed with PBS three times and then maintained in DMEM containing CCCP (25 μM) for 1 h. The cells were imaged by confocal microscopy without washing. (D) Acidity-triggered red fluorescence in IMCLAM+ cells. DBCOBlue-ΔΨm+/AzProRed-ΔΨm+ HeLa cells were maintained for 1 h in buffer of varied pH as indicated, and then imaged by confocal microscopy. Scale bars, 10 μm
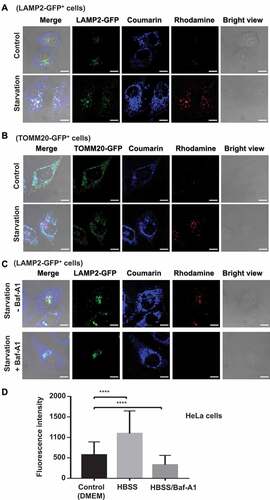
To ascertain its specificity for mitophagy, we operated IMCLAM with AzProRed-ΔΨm in TOMM20-GFP+ HeLa cells as well as in HeLa cells expressing LAMP2-GFP specific for lysosomes. These cells were then starved in Hanks’ balanced salt solution (HBSS) free of amino acids for 6 h to induce mitophagy. Control cells exhibited coumarin- and TOMM20-positive deposits, confirming probe accumulation in mitochondrial, whereas starved cells displayed rhodamine- and LAMP-positive deposits ( and ), indicative of IMCLAM+ mitochondria in lysosomes. Bafilomycin A1 (Baf-A1) is a potent inhibitor of V-ATPase and effectively neutralizes lysosomes [Citation32]. Treatment of starved cells with Baf-A1 resulted in loss of red fluorescence ( and ), proving lysosomal acidity triggered red fluorescence. In parallel, we applied IMCLAM to track mitophagy over starvation time. We identified red signals that formed at 45 min post-starvation and increased as a function of starvation time (Fig. S7). Consistently, starvation-induced mitophagy was independently confirmed attenuation of LC3-I by western blotting and enhanced fluorescence ratio of red fluorescent protein (RFP) over GFP in RFP-GFP-LC3+ HeLa cells (Fig. S8). Collectively, these data verify lysosomal acidity-triggered red fluorescence in mitophagic IMCLAM+ cells.
Figure 5. Fluorescence-on detection of mitophagy with IMCLAM. LAMP2-GFP+ HeLa cells (A) or TOMM20-GFP+ HeLa cells (B) were cultivated with DBCOBlue-ΔΨm (3 μM) in DMEM for 1.5 h and then cultured with AzProRed-ΔΨm (2 μM) in DMEM for 1 h. The cells were rinsed with DMEM three times and then maintained for 6 h in HBSS (starvation) before confocal microscopy analysis. IMCLAM+ cells cultured in DMEM were used as the controls. (C) Lysosomal acidity-triggered red fluorescence in IMCLAM+ cells. LAMP2-GFP+ HeLa cells prestained sequentially with DBCOBlue-ΔΨm and AzProRed-ΔΨm were maintained for 6 h in HBSS or HBSS spiked with Baf-A1 (50 nM). The cells were then analyzed by confocal microscopy. Scale bars: 10 μm. (D) HeLa cells were starved in HBSS spiked without or with Baf-A1 and then analyzed by flow cytometry without washing, using cells cultured in DMEM as the control. mean ± SD, n = 8000. ****, P < 0.0001 (t test)
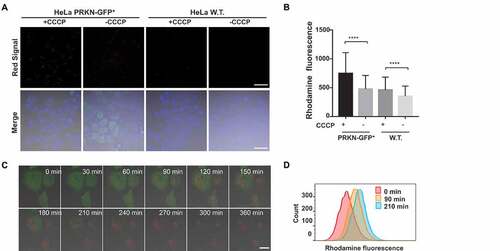
We next applied IMCLAM to discern mitophagy in HeLa cells expressing PRKN/Parkin-GFP as compared to wild type HeLa cells that exhibit low levels of mitophagy due to the lack of PRKN [Citation33]. We identified significantly enforced rhodamine signals induced by CCCP in PRKN-GFP+ cells over wild type HeLa cells, as determined by confocal microscopy and flow cytometry ( and ). This enhancement is consistent with the role of PRKN in promoting mitophagy [Citation33]. We then examined IMCLAM for time-course study of mitophagy in PRKN-GFP+ HeLa cells. We observed the rise of red fluorescence over time in CCCP-treated cells and concurrent loss of PRKN-GFP signals due to degradation of PRKN-GFP by mitophagy ( and ). These data support the utility of IMCLAM for real-time imaging of mitophagy.
Figure 6. Real time imaging of mitophagy in PRKN-expressing cells by IMCLAM. (A/B) Enforced mitophagy in PRKN-GFP+ cells induced by CCCP. HeLa cells and PRKN-GFP+ HeLa cells were independently incubated with AzProRed-ΔΨm (2 μM) in DMEM for 1.5 h and then washed with PBS three times. The cells were further incubated with DBCOBlue-ΔΨm (3 μM) in DMEM for 1 h. These IMCLAM+ cells were washed with PBS three times and then incubated with CCCP (10 μM) in DMEM for 6 h. These cells were analyzed without washing by confocal microscopy (A) or flow cytometry (B), mean ± SD, n = 8000. ****, P < 0.0001 (t test). (C/D) Real-time imaging of mitophagy in PRKN-GFP+ HeLa cells induced by CCCP. The aforementioned IMCLAM+ cells were washed with PBS three times and then cultured in DMEM containing CCCP (10 μM) for varied periods of time. The cells were analyzed without washing by confocal microscopy (C) or flow cytometry (D) at indicated time points. Flow cytometric assays were performed using λex = 565 nm and λem = 590–620 nm for rhodamine fluorescence. Scale bars: 10 μm
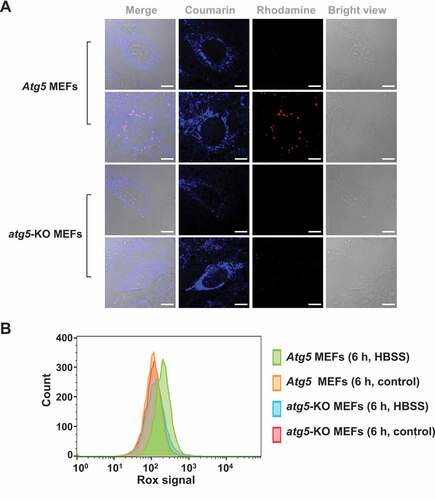
To further validate mitophagy-mediated fluorescence activation, we tested IMCLAM in Atg5 mouse embryonic fibroblasts (MEFs) and atg5-knockout (atg5-KO) MEFs. Upon culturing in mitophagy-inducing medium, Atg5 MEFs exhibited dots of bright red fluorescence; however, such signals were barely detected in atg5-KO cells (). Because cells deficient in Atg5 are defective in autophagosome formation, an essential step for mitophagy [Citation34], the formation of red fluorescence in starved Atg5 MEFs over atg5-KO cells reflects mitophagy. These results prove the utility of IMCLAM for mitophagy detection by red fluorescence generated upon delivery of mitochondria into lysosomes.
Figure 7. Atg5 dependent turn-on red fluorescence in IMCLAM+ MEF cells in mitophagy. Atg5 MEFs or atg5-KO MEF cells were cultivated for 1 h with AzProRed-ΔΨm (2 μM), washed with PBS three times and then cultured in DMEM with DBCOBlue-ΔΨm (3 μM) for 1.5 h. The cells were maintained for 6 h in HBSS deficient in amino acids. Atg5 MEFs and atg5-KO MEFs cultured in DMEM were used as the controls. These cells were washed with PBS three times and then analyzed by confocal microscopy (A) and flow cytometry (B). Scale bars: 10 μm
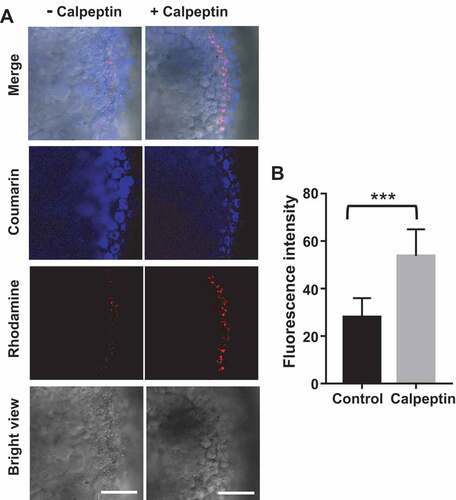
After validating IMCLAM for mitophagy detection, we were keen to determine its capability to distinguish mitophagy inducers. As mitophagy is deregulated in multiple diseases [Citation35], small molecule inducers of mitophagy are of therapeutic potentials [Citation11]. Rapamycin is an immunosuppressing medicine shown to boost autophagy and alleviate mitochondrial dysfunction [Citation36–39], whereas etoposide is an anti-cancer drug reported to cause mitochondrial dysfunction [Citation40,Citation41]. We thus implemented IMCLAM to discern mitophagy in PRKN-GFP+ HeLa cells induced by rapamycin, etoposide, together with representative mitochondrial stressors including CCCP, rotenone (an inhibitor of NADH oxidase) [Citation42], and oligomycin (an inhibitor of ATP synthase). IMCLAM revealed the highest levels of mitophagy caused by CCCP whereas no obvious mitophagy could be detected in cells treated with etoposide, rapamycin, oligomycin, or rotenone (). These findings showed that CCCP is a potent inducer of mitophagy among these pharmacological compounds tested. We then explored whether IMCLAM could be used for in vivo detection of mitophagy by investigating the effect of calpeptin on zebrafish. Calpeptin is a cell-permeable peptide inhibitor of calpain and is a potent inducer of autophagy in zebrafish [Citation43]. As shown in , calpeptin caused bright red fluorescence in zebrafish embryos, reflecting upregulated mitophagy. This is in line with previous report on calpeptin-induced mitophagy in GFP-LC3-expressing zebrafish [Citation43], verifying the potential of IMCLAM to identify mitophagy-inducing pharmacological compounds for mitophagy-oriented therapy. Compared with methods using transgenic cell lines or transgenic animals [Citation19–21,Citation43], IMCLAM harnesses two simple small molecule probes to achieve signal-on detection of mitophagy in living cells and wild type zebrafish with great simplicity.
Figure 8. Detection of small molecule-induced mitophagy in live cells with IMCLAM. LAMP2-GFP+ HeLa cells prestained with AzProRed-ΔΨm/DBCOBlue-ΔΨm were cultivated with CCCP (10 μM), etoposide (10 μM), rapamycin (10 μM), rotenone (10 μM), oligomycin (10 μM), Baf-A1 (50 nM, inhibitor of mitophagy), or no addition (control) for 6 h in DMEM. These cells were analyzed without washing by confocal microscopy (A) and flow cytometry for intracellular fluorescence of rhodamine and PRKN-GFP, mean ± SD, n = 8000, ****, P < 0.0001 (t test). Scale bars: 10 μm
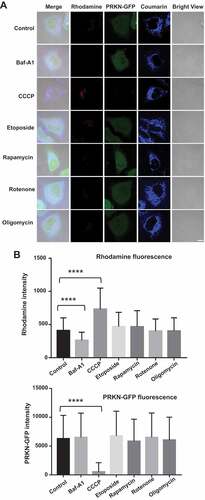
Figure 9. IMCLAM discerns calpeptin-induced mitophagy in zebrafish (A). Zebrafish embryos at 2 d post-fertilization in Holt buffer were incubated for 1 h with AzProRed-ΔΨm (8 μM), and then with DBCOBlue-ΔΨm (12 μM) for 1.5 h. These embryos were exposed to calpeptin (50 μM) or no addition for 24 h and then imaged by confocal fluorescence microscopy. Scale bars: 60 μm. (B) Quantification of the rhodamine fluorescence associated with embryos, mean ± SD, n = 10. ***, P = 0.0001 (t test)
Finally, we evaluated cytotoxicity and photostability of IMCLAM. HeLa cells stained with AzRed-ΔΨm or AzProRed-ΔΨm, either alone or in combination with DBCOBlue-ΔΨm, were maintained in DMEM for 0–96 h. In contrast to individual probes that are largely nontoxic, IMCLAM leads to ~25% decrease in cell proliferation at 48 h post-incubation. However, such retardation largely disappeared at 48–96 h post-incubation, showing attenuated long-term cytotoxicity of IMCLAM (Fig. S9A-C). We next investigated the mitochondrial toxicity caused by IMCLAM, and observed no obvious alterations in mitochondrial oxygen consumption rates (Fig. S9D). In addition, IMCLAM was shown to be of no detrimental effect on viability of zebrafish embryos and development of these embryos into zebrafish (Fig. S9E and S9F). At last, we investigated photostability of IMCLAM. We observed relatively constant fluorescence of AzRed-ΔΨm and its adduct with DBCOBlue-ΔΨm upon continuous laser illumination for 3 h both in vitro and in live cells (Fig. S9G-K). The high photostability and low cytotoxicity of IMCLAM are beneficial for optical tracking of mitophagy.
Historically, mitochondrial SPAAC has been employed to assess ΔΨm by mass spectrometry analysis of the levels of adducts formed in situ [Citation44]. In addition, imaging of pH-elevated lysosomes was achieved via SPAAC of a pH sensor with an abiotic monosaccharide transported into lysosomes by a sugar-sorting pathway [Citation45]. On the basis of these approaches, we coined IMCLAM for dual-color tracking of mitophagy with a pair of ΔΨm probes, which significantly expands the scope of conventional probes in biology. We considered that, with the aid of myriad available fluorescent biosensors, IMCLAM could be adaptable to sense other biochemical cues in stressed organelles such as reactive oxygen species as well as pH fluctuation.
Conclusion
In summary, we developed an organelle-restricted chemical ligation that could be used for optical tracking of stressed mitochondria, fluorescence-on imaging of mitophagy, and discerning mitophagy-inducing pharmacological compounds in live cells and zebrafish with simplicity. Utilizing two conventional ΔΨm probes that accumulate in mitochondria and then combine in situ to afford an optical adduct stably trapped in mitochondria independent of ΔΨm, this approach enables signal-on mitophagy detection via red fluorescence triggered upon delivery of mitochondria into lysosomes. Expanding the scope of classical imaging agents prone to dissipation from dysfunctional organelles, IMCLAM offers a powerful tool to study mitochondria and mitophagy in biology and might provide a simplified basis for screening mitophagy-inducing compounds for treatment of neurological disorders and aging.
Materials and Methods
Cell lines, plasmids and reagents
HeLa (CCL-2™), B16F10 (CRL-6475™), (CCL-185) and MCF-7 (HTB-22™) were obtained from American Type Culture Collection. LAMP2-GFP+ HeLa and TOMM20-GFP+ HeLa cells were prepared following reported procedure [Citation46,Citation47]. MEF Atg5 and MEF atg5-KO cells were gifts from Professor Shengcai Lin at Xiamen University. All cell lines were maintained in Dulbecco’s modified Eagle’s medium (DMEM; GIBCO, C11995500CP) supplemented with 10% fetal bovine serum (Thermo, A3160901), 2 mM L-glutamine (Millipore, TMS-002-C), 100 IU penicillin (Gibco, 15,140,122), and 100 mg/mL streptomycin (Sangon, A610494-0050) at 37°C in a humidified incubator under 5% CO2, unless specified. Bafilomycin A1, (Baf-A1; S1413), rapamycin (S1039) and oligomycin (S1478) were purchased from Selleck. Rhodamine 123 (C0221) and 5-ROX (D0405) were purchased from Bioluminor, Xiamen. Cy7 dye (C849890) was purchased from Macklin. Bis(2-azidoethyl)amine was synthesized following a reported procedure [Citation48]. Anti-LC3A/B (D3U4C; 12,741) antibody and ACTB/β-actin (8H10D10; 3700) antibody were from Cell Signaling Technology. All other chemicals were purchased from Sigma unless specified.
PRKN-GFP expressing and RFP-GFP-LC3-expressing plasmid were used for producing PRKN-GFP and RFP-LC3-GFP recombinant lentiviruses, respectively. Full-length cDNA of PRKN was cloned into BamHI and XhoI sites of the lentiviral vector pBOB-GFP using the ExoIII-assisted ligase-free cloning method. RFP-LC3-GFP expressing plasmid was a gift from Professor Shengcai Lin, Xiamen University. pMDLg, pRSV-REWV, pVSV-G and pBOB-CMV vector were gifts from Professor Jiahuai Han, Xiamen University. Recombinant lentiviruses were generated in 293 T cells (ATCC® ACS-4500™) in the presence of helper plasmids (pMDLg, pRSV-REWV and pVSV-G) using a Lipofectamine 2000 reagent (Invitrogen, 11,668–019). All interferon-stimulated genes (ISGs) were amplified from a human cDNA library and cloned into a pBOB-CMV vector. All plasmids were verified by DNA sequencing. Expression of PRKN-GFP expressing and RFP-LC3-GFP was validated by GFP/RFP fluorescence or western blot.
Microscopy
The fluorescence spectra were performed on SpectraMax M5 (Molecular Device). Confocal fluorescence microscopy imaging was performed on Zeiss LSM 780–2 using the following filters: λex = 488 nm/λem = 499–553 nm for Rhodamine 123 and GFP, λex = 561 nm/λem = 570–620 nm for ROX, and λex = 405 nm/λem = 410–490 nm for Coumarin. Images of merged fluorescence were processed using ZEN 2 (blue edition). Graph was generated by GraphPad Prism7 and origin 9.0 software. Flow cytometry analysis was performed on BD Fortessa. The fluorescence emission intensity of CM was recorded by BV421 filter (430–470 nm) using excitation wavelength of 405 nm while that of ROX was recorded by PE-Texas Red (590–630 nm) using excitation wavelength of 561 nm. The fluorescence of TOMM20-GFP was detected by FITC filter (515–545 nm) using excitation wavelength of 488 nm. 10,000 cells were gated under identical conditions, analyzed and the data were processed by FlowJo V10. All the cells analyzed by confocal microscopy were seeded in 35 mm glass-bottom cell culture dishes.
In vitro SPAAC of AzRed-ΔΨm and DBCOBlue-ΔΨm (Fig. S1B).
To a flask containing CH3OH (0.2 mL) were added AzRed-ΔΨm (14.0 mg, 0.02 mmol) and DBCOBlue-ΔΨm (37.0 mg, 0.04 mmol). The reaction solution was stirred for 0.5 h at room temperature. The mixture was analyzed by HPLC using CH3CN (Energy Chemical, A011968)/H2O (0.01% TFA) as the eluent. The reaction solution was further concentrated and the residue was purified with Al2O3 (GENERAL-REAGENT, G21116A) chromatography using CH2Cl2 (Sinopharm Chemical Reagent Co., 80,047,318)/MeOH (30:1) as the eluent to afford the optical triad (46.0 mg, 90%) as a mixture of three isomers (). HRMS (ES+) calculated for C159H165N20O15P23+ (M3+) m/z = 2656.2222/3 = 885.4074, found 885.4080.
In vitro SPAAC of AzProRed-ΔΨm and DBCOBlue-ΔΨm (Fig. S1C).
To CH3OH (0.2 mL) were added AzProRed-ΔΨm (23.0 mg, 0.02 mmol) and DBCOBlue-ΔΨm (37.0 mg, 0.04 mmol). The reaction solution was stirred for 0.5 h at room temperature and then concentrated in vacuo. The residue was purified with Al2O3 chromatography using CH2Cl2/MeOH (15:1) to afford the optical triad as mixture of three isomers (54.0 mg, 88%). HRMS (ES+) calculated for C184H190N22O17P33+ (M3+) m/z = 3072.3876/3 = 1024.1292, found 1024.1364.
pH titration
AzProRed-ΔΨm was added to a serial of phosphate buffered saline (PBS, 137.0 mM NaCl, 2.7 mM KCl, 10 mM Na2HPO4, 2.0 mM KH2PO4) of pH 4.0, 4.5, 5.0, 5.5, 6.0, 6.5, 7.0, 7.5, 8.0, 8.5, or 9.0 containing dimethyl sulfoxide (DMSO; Sigma, D5879-1 L), 30% v/v) to a final concentration of 10 μM. Fluorescence spectra were recorded using λex = 580 nm. In parallel, the adduct of AzProRed-ΔΨm and DBCOBlue-ΔΨm was added to PBS (10 mM) containing 30% DMSO (pH: 4.0, 4.5, 5.0, 5.5, 6.0, 6.5, 7.0, 7.5, 8.0, 8.5, 9.0) to a final concentration of 10 μM. Fluorescence spectra were recorded using λex = 430 nm. pH titration curves of the adduct were plotted using fluorescence emission of ROX (I610 nm) and that of coumarin (I475 nm) over pH.
Intramolecular FRET of the adduct from AzRed-ΔΨm and DBCOBlue-ΔΨm in vitro
AzRed-ΔΨm (5 µM), DBCOBlue-ΔΨm (10 µM) and their adducts (5 µM) were respectively added to PBS (10 mM, pH 7.5) containing 30% DMSO. Fluorescence spectra were recorded using λex = 430 nm.
Optical properties of probes and their cognate parent dyes
DBCOBlue-ΔΨm, coumarin, AzRed-ΔΨm, and Red-ΔΨm were added to PBS buffer (10 mM, pH 7.5) containing DMSO (30% v/v) to a final concentration of 10 μM. The solutions were analyzed for UV-vis absorbance and fluorescence emission (λex = 590 nm for AzRed-ΔΨm and Red-ΔΨm, λex = 430 nm for DBCOBlue-ΔΨm and coumarin).
Probe selectivity for mitochondria
TOMM20-GFP+ HeLa cells were cultured with AzRed-ΔΨm (0.3 μM) for 1 h, Red-ΔΨm (0.3 μM) for 1 h, or DBCOBlue-ΔΨm (2 μM) for 1.5 h in DMEM. The cells were washed with PBS three times at 37°C, maintained in fresh DMEM and then analyzed by confocal fluorescence microscopy. In parallel, HeLa cells were cultured in DMEM containing AzRed-ΔΨm (0.3 μM) for 1 h, or in DMEM containing Red-ΔΨm (0.3 μM) for 1 h, or DMEM containing DBCOBlue-ΔΨm (2 μM) for 1.5 h. These cells were washed with PBS and then maintained for 20 min in DMEM containing rhodamine 123 (1 μM). The cells were washed with PBS and then analyzed by confocal fluorescence microscopy.
Tagging of stressed mitochondria with IMCLAM
TOMM20-GFP+ HeLa cells were cultured for 1 h in DMEM containing AzRed-ΔΨm (0.3 μM), or in DMEM containing Red-ΔΨm (0.3 μM). The cells were washed with PBS three times and then cultured for 1.5 h in fresh DMEM or DMEM containing DBCOBlue-ΔΨm (2 μM). These cells were washed with PBS at 37°C three times and then maintained in DMEM containing CCCP (25 μM) for 1 h. The resultant cells were analyzed by confocal fluorescence microscopy without washing (to maintain the levels of CCCP during analysis).
Dose-dependent mitochondrial staining with IMCLAM
HeLa cells were cultured for 1 h in DMEM containing Red-ΔΨm (0.3 μM), or in DMEM containing AZRed-ΔΨm (0.3 μM). These cells were washed with PBS three times and then cultured for 1.5 h in DMEM containing DBCOBlue-ΔΨm (0, 0.5, 1, 2, 4 μM). The cells were washed with PBS, and then incubated with CCCP (25 μM) for 1 h in DMEM. The cells were analyzed by confocal microscopy without washing. For flow cytometry analysis, the cells seeded in 12-well cell culture plates were subjected to IMCLAM using the same procedure as above. The cells were harvested and maintained in DMEM containing CCCP (25 μM) and then analyzed by flow cytometry.
Intra-molecular FRET via IMCLAM in mitochondria
HeLa cells were cultured for 1.5 h in DMEM containing DBCOBlue-ΔΨm (2 μM) and then washed with PBS at 37°C. The cells were cultured for 1 h in DMEM containing AZRed-ΔΨm (0.3 μM), or in DMEM containing Red-ΔΨm (0.3 μM). These cells were washed with PBS three times, and then analyzed by confocal fluorescence microscopy. For flow cytometry analysis, HeLa cells seeded in 12-well cell culture plates were cultured in DMEM containing DBCOBlue-ΔΨm (2 μM) for 1.5 h, and then washed with PBS three times. The cells were further maintained for 1 h in DMEM containing AZRed-ΔΨm (0, 0.05, 0.1, 0.2, 0.3, or 0.6 μM) or in DMEM containing Red-ΔΨm (0, 0.05, 0.1, 0.2, 0.3, 0.6 μM). The cells were harvested and analyzed by flow cytometry.
Incapability of in vitro-synthesized optical triad to stain mitochondia
TOMM20-GFP+ HeLa cells were incubated in DMEM supplemented with the adducts of AzRed-ΔΨm/DBCOBlue-ΔΨm (0.3 μM) synthesized in vitro for 2.5 h. The cells were washed with PBS and then analyzed by confocal fluorescence microscopy.
Incapability of optical adduct formed extra-mitochondrially to tag stressed mitochondria
DMEM used herein was supplemented with CCCP (25 μM) (designated as CCCP+ DMEM) to ensure the loss of ΔΨm. HeLa cells were incubated in CCCP+ DMEM for 0.5 h, and then for 1 h in CCCP+ DMEM containing AzRed-ΔΨm (0.3 μM). The cells were washed with PBS at 37°C and then cultured for 1.5 h in CCCP+ DMEM containing DBCOBlue-ΔΨm (2 μM). The cells were washed with PBS, maintained in CCCP+ DMEM for 1 h, and then analyzed by confocal fluorescence microscopy. For control assay, HeLa cells were incubated for 1 h in CCCP-free DMEM containing AzRed-ΔΨm (0.3 μM), washed with PBS, and then further incubated for 1.5 h in CCCP-free DMEM containing DBCOBlue-ΔΨm (2 μM). The cells were washed with PBS, maintained in CCCP+ DMEM for 1 h, and then analyzed by confocal fluorescence microscopy.
IMCLAM for additional cell lines
B16F10, MCF-7 or MEF cells were cultured for 1 h in DMEM containing AzRed-ΔΨm (0.3 μM). The cells were washed with PBS three times and then cultured for 1.5 h in fresh DMEM or DMEM containing DBCOBlue-ΔΨm (2 μM). The cells were washed with PBS three times at 37°C, and then maintained in DMEM containing CCCP (25 μM) for 1 h. The cells were analyzed by confocal microscopy without washing.
Fluorescence tagging of stressed mitochondria via IMCLAM
HeLa cells were cultured for 1 h in fresh DMEM or in DMEM containing DBCOBlue-ΔΨm (3 μM). The cells were washed with PBS and then cultured for 1.5 h in DMEM containing AzProRed-ΔΨm (2 μM). The cells were washed with PBS at 37°C and then maintained in DMEM containing CCCP (25 μM) for 1 h and then visualized by confocal microscopy without washing.
pH profile of IMCLAM in live cells
HeLa cell were cultured for 1 h in DMEM containing AZProRed-ΔΨm (2 μM). The cells were then cultured for 1.5 h in DMEM containing DBCOBlue-ΔΨm (3 μM) and washed with PBS at 37°C. The cells were further incubated for 10 min in 4% formaldehyde at 37°C. The fixed cells were further washed twice with PBS and then maintained in high K+ buffer (30 mM NaCl, 120 mM KCl, 1 mM CaCl2, 0.5 mM MgSO4, 1 mM NaH2PO4, 5 mM glucose [Sigma, G5764], 20 mM HEPES [Sigma, H3375], 20 mM NaOAc [Sigma, S2889]) of various pH values (4–8). The cells were analyzed by confocal fluorescence microscopy.
Detection of mitophagy with IMCLAM
LAMP2-GFP+ HeLa cells or TOMM20-GFP+ HeLa cells were cultured for 1.0 h in DMEM containing AzProRed-ΔΨm (2 μM). These cells were washed with PBS at 37°C and then cultured for 1.5 h in DMEM containing DBCOBlue-ΔΨm (3 μM). The cells were further washed with PBS, and then maintained for 6 h in Hanks’ Balanced Salt Solution (HBSS; with calcium and magnesium) or DMEM (control). The cells were then visualized by confocal microscopy. Effects of Baf-A1 on mitophagy: LAMP2-GFP+ HeLa cells were cultured for 1.0 h in DMEM containing AzProRed-ΔΨm (2 μM). The cells were washed with PBS and then cultured for 1.5 h in DMEM containing DBCOBlue-ΔΨm (3 μM). The cells were washed with PBS and then maintained for 6 h in HBSS or HBSS containing Baf-A1 (50 nM). The cells were then analyzed by confocal fluorescence microscopy. For flow cytometry analysis, HeLa cells were cultured with AzProRed-ΔΨm and DBCOBlue-ΔΨm as above in 12-well plate. The cells were then treated with HBSS, HBSS containing 50 nm BFA or DMEM (control) for 6 h. The cells were harvested and rhodamine fluorescent signal of 8000 cells were analyzed by flow cytometry.
Time course analysis on starvation-induced mitophagy
LAMP2-GFP+ HeLa cells were cultured in DMEM supplemented with AzProRed-ΔΨm (2 μM) for 1 h. The cells were washed with PBS at 37°C, and then cultured for 1.5 h in DMEM supplemented with DBCOBlue-ΔΨm (3 μM). The cells were washed with PBS three times and placed in a hot chamber of a confocal fluorescence microscopy maintained at 37°C in an atmosphere of 5% CO2. After replacing DMEM with HBSS, the cells were visualized by confocal fluorescence microscopy at 0 min, 45 min, 90 min, 135 min, 180 min, 225 min post-incubation in HBSS. For flow cytometry analysis, HeLa cells seeded in 12-well cell culture plate were cultured in DMEM containing AZProRed-ΔΨm (2 μM) for 1 h, and then washed with PBS three times. The cells were further maintained for 1.5 h in DMEM containing DBCOBlue-ΔΨm (3 μM). The cells were further incubated with 6 h DMEM (0 h HBSS), 4 h DMEM then 2 h HBSS, 3 h DMEM then 3 h HBSS or 6 h HBSS. The cells were harvested and analyzed by flow cytometry.
Selectivity of IMCLAM for mitophagy
Atg5 MEFs and Atg5-KO MEF cells were respectively cultured for 1 h in DMEM containing AzProRed-ΔΨm (2 μM). The cells were then washed with PBS at 37°C and then cultured for 1.5 h in DMEM containing DBCOBlue-ΔΨm (3 μM). The cells were washed with PBS three times, maintained for 6 h in HBSS or in DMEM (control), and then analyzed by confocal fluorescence microscopy or flow cytometry.
Western blotting analysis of mitophagy in starved HeLa cells
HeLa cells were cultured for 6 h in nutrient-rich medium (DMEM containing 10% fetal calf serum) or starvation conditions (HBSS). For control assay, atg5-KO MEF cells were cultured in DMEM containing 10% fetal calf serum for 6 h. These cells were then lysed and the proteins resolved by SDS-PAGE. Endogenous LC3-I/II and ACTB were detected by immune-blotting. SDS lysis buffer of atg5-KO MEF cells were used to indicate the position of LC3-I.
Analysis of mitophagy in starved RFP-LC3-GFP HeLa cells
HeLa cells were cultured in nutrient-rich medium (DMEM containing 10% fetal calf serum) or incubated for 6 h in starvation conditions (HBSS). Cells were then analyzed by confocal fluorescence microscopy. Red point, green point and yellow point of each cell in the confocal image were manually counted. Red dot and yellow dot of each cell in the confocal image were manually counted.
Imaging of mitophagy in PRKN-expressing cells by IMCLAM
PRKN-GFP+ HeLa cells and wild type HeLa were respectively cultured for 1.0 h in DMEM containing AzProRed-ΔΨm (2 μM). The cells were then washed with PBS at 37°C and then cultured for 1.5 h in DMEM containing DBCOBlue-ΔΨm (3 μM). The cells were washed with PBS three times and then cultured with or without 10 μM CCCP in DMEM for 6 h, and then analyzed by confocal fluorescence microscopy or flow cytometry.
Real time imaging of mitophagy in PRKN-GFP+ HeLa cells induced by CCCP
PRKN-GFP+ HeLa cells were cultured for 1.0 h in DMEM containing AzProRed-ΔΨm (2 μM), washed, and then further cultured for 1.5 h in DMEM containing DBCOBlue-ΔΨm (3 μM). The cells were washed with PBS and placed in a hot chamber of a confocal fluorescence microscopy maintained at 37°C in an atmosphere of 5% CO2. After replacing media with DMEM containing 10 μM CCCP, the cells were visualized by confocal fluorescence microscopy at 0, 30, 60, 90, 120, 150, 180, 210, 240, 270, 300 and 360 min post-incubation. The cells mentioned above were also analyzed by flow cytometry at different time points.
Detection of small molecule-induced mitophagy in live cells with IMCLAM
PRKN-GFP+ HeLa cells were cultured in DMEM supplemented with AzProRed-ΔΨm (2 μM) for 1.0 h. The cells were washed with PBS at 37°C and then cultured for 1.5 h in DMEM supplemented with DBCOBlue-ΔΨm (3 μM). The cells were then cultured in DMEM supplemented with 10 μM CCCP (Sigma, C2759-100 M), 10 μM etoposide (Sigma, E1383-25 MG), 10 μM rapamycin (Selleck, S1039-5 mg), 10 μM rotenone (Santa Cruz Biotechnology, sc-203,242), 10 μM oligomycin (Selleck, S1478), 50 nM Baf-A1 (MCE, HY-100,558), or no addition for 6 h in DMEM. The cells were analyzed by confocal microscopy or flow cytometry.
Imaging of calpeptin-induced mitophagy in zebrafish
Zebrafish embryos at 2 d post-fertilization were placed in Holt buffer containing 1-phenyl-2-thiourea (PTU; TCI Shanghai, BCBW4842) in 12-well plates. The embryos were maintained for 1 h in Holt buffer containing AzProRed-ΔΨm (8 μM), washed with water three times, and then maintained for 1.5 h in Holt buffer containing DBCOBlue-ΔΨm (12 μM). The embryos were washed with water and then maintained in Holt buffer containing calpeptin (50 μM) pre-dissolved in DMSO or no addition. Yolk sac of the zebrafish was visualized by upright multiphoton confocal microscopy (Olympus FV1000MPE-B).
Cytotoxicity assay
HeLa cells were cultured for 1 h in DMEM containing AzRed-ΔΨm (0.3 μM), washed, and then further cultured for 1.5 h in DMEM containing DBCOBlue-ΔΨm (2 μM). For IMCLAM, HeLa cells were cultured for 1 h in DMEM containing AzProRed-ΔΨm (2 μM), washed with PBS and cultured for 1.5 h in DMEM containing DBCOBlue-ΔΨm (3 μM). These cell samples were washed with PBS three times and then further cultured in fresh DMEM for 0 h, 12 h, 24 h, or 48 h. The resultant cells were determined for cell viability by cell count kit 8 (MCE, hy-k0301) assay.
Long-term effect of IMCLAM on cell proliferation
HeLa cells were treated with DMSO, AzRed-ΔΨm (0.3 μM, 1 h), DBCOBlue-ΔΨm (2 μM, 1.5 h), AzRed-ΔΨm (0.3 μM, 1 h)/DBCOBlue-ΔΨm (2 μM, 1.5 h) or AzProRed-ΔΨm (2 μM, 1 h)/DBCOBlue-ΔΨm (3 μM, 1.5 h) respectively, and then washed with PBS three times. HeLa cells with different treatments were seeded into the wells of the 96-well plate at densities of 4,000 cells in 200 μl cell culture media at 48 h. The cell number and cell viability at 48, 54, 60, 72, 84 and 96 h post-treatment were determined by cell count kit 8 assay.
Effects of IMCLAM on mitochondrial oxygen consumption
Oxygen consumption rates (OCR) were measured by using Seahorse XFe96 analyzer (Agilent Technologies, CA, USA). HeLa cells were plated onto XFe96 assay plates and used for seahorse assay next day. The cells were treated with DMSO, AzRed-ΔΨm (0.3 μM, 1 h), DBCOBlue-ΔΨm (2 μM, 1.5 h), AzRed-ΔΨm (0.3 μM, 1 h)/DBCOBlue-ΔΨm (2 μM, 1.5 h) or AzProRed-ΔΨm (2 μM, 1 h)/DBCOBlue-ΔΨm (3 μM, 1.5 h). The cells were washed with PBS at 37°C and then maintained in Seahorse XF media (pH = 7.4, containing 1 mM sodium pyruvate, 2 mM glutamine and 10 mM glucose) at 37°C without CO2 for an hour prior to the assay. Cells were treated sequentially with 1.5 μM oligomycin, 0.5 μM FCCP, and 0.5 μM rotenone/antimycin A (Santa Cruz Biotechnology, sc-202,467) for measuring proton leak, maximum respiration, and non-mitochondrial respiration, respectively.
Effects of IMCLAM on zebrafish embryo viability and development
Zebrafish embryos at 2 d post-fertilization were incubated with DMSO (1:1000, 2.5 h), AzRed-ΔΨm (1.2 μM, 1 h), DBCOBlue-ΔΨm (12 μM, 1.5 h), AzRed-ΔΨm (8 μM, 1 h)/DBCOBlue-ΔΨm (12 μM, 1.5 h) or AzProRed-ΔΨm (8 μM, 1 h)/DBCOBlue-ΔΨm (12 μM, 1.5 h) respectively. Seventeen embryos from each treatment were collected in 6-well plates, washed three times with fresh water and counted the number of zebrafish every day until two weeks. The zebrafish were then imaged on a stereo-microscope with camera on the fifteenth day.
Photostability
Photostability of AzRed-ΔΨm, DBCOBlue-ΔΨm and their optical adducts in vitro. AzRed-ΔΨm, DBCOBlue-ΔΨm, the adducts of DBCOBlue-ΔΨm/AzRed-ΔΨm and Cy7 were respectively dissolved in PBS buffer (10 mM, pH 7.5) containing DMSO (30% v/v) to a final concentration of 2 μM. These samples were subjected to under constant Laser irradiation for 3 h and recorded for fluorescence emission using λem = 430 nm for DBCOBlue-ΔΨm, λem = 590 nm for AzRed-ΔΨm and the optical adducts, and λem = 750 nm for Cy7. Photostability in live cells. HeLa cells were incubated with AzRed-ΔΨm (0.3 μM) for 1 h, washed with PBS and then incubated with DBCOBlue-ΔΨm (2 μM) for 1.5 h at 37°C under 5% CO2 in DMEM supplemented with 10% fetal bovine serum. The culturing media were removed and replaced with fresh medium. Then cells were then irradiated under constant laser for 1 h. During irradiation, the cells were imaged at every other 5 min with a confocal fluorescence microscope (λex = 561 nm for ROX). The intracellular rhodamine fluorescence of confocal microscopic images was quantified by Zen blue.
Supporting information
available on synthesis and characterization of the compounds, cell cytotoxicity, Images of western blotting, cell imaging on FRET, and cytotoxicity etc.
Supplemental Material
Download Zip (22.4 MB)Acknowledgments
This work was supported by grants from NSF China (91854106, 21775130). Professor J. Han was supported by NSFC (81788101. 81630042), and Research Unit of Cellular Stress, Chinese Academy of Medical Sciences (2019RU054). We thank Professor Ronald E. Viola at University of Toledo for helpful discussion.
Disclosure statement
The authors declare no competing financial interests.
Supplementary material
Supplemental data for this article can be accessed here.
Additional information
Funding
Related Research Data
References
- Suomalainen A, Battersby BJ. Mitochondrial diseases: the contribution of organelle stress responses to pathology. Nat Rev Mol Cell Biol. 2018;19(2):77–92.
- Lin JH, Walter P, Yen TS. Endoplasmic reticulum stress in disease pathogenesis. Annu Rev Pathol. 2008;3(1):399–425.
- Platt FM, d’Azzo A, Davidson BL, Neufeld EF, Tifft CJ. Lysosomal storage diseases. Nat Rev Dis Primers. 2018;4(1):27.
- Bonam SR, Wang F, Muller S. Lysosomes as a therapeutic target. Nat Rev Drug Discov. 2019;18:923–948.
- Bonora M, Wieckowski MR, Sinclair DA, et al. Targeting mitochondria for cardiovascular disorders: therapeutic potential and obstacles. Nat Rev Cardiol. 2019;16:33–55.
- Murphy MP, Hartley RC. Mitochondria as a therapeutic target for common pathologies. Nat Rev Drug Discov. 2018;17:865–886.
- Sherratt HS. Mitochondria: structure and function. Rev Neurol. 1991;147:417–430.
- Green DR, Galluzzi L, Kroemer G. Mitochondria and the autophagy-inflammation-cell death axis in organismal aging. Science. 2011;333(6046):1109–1112.
- Cai Q, Jeong YY. Mitophagy in Alzheimer’s disease and other age-related neurodegenerative diseases. Cells. 2020;(1):150–178.
- Liu J, Liu W, Li R, et al. Mitophagy in Parkinson’s disease: from pathogenesis to treatment. Cells. 2019;8(7):712–731.
- Andreux PA, Houtkooper RH, Auwerx J. Pharmacological approaches to restore mitochondrial function. Nat Rev Drug Discov. 2013;12:465–483.
- Chazotte B. Labeling mitochondria with rhodamine 123. Cold Spring Harbor Protocols. 2011;2011(7):892–894.
- Jewett JC, Bertozzi CR. Cu-free click cycloaddition reactions in chemical biology. Chem Soc Rev. 2010;39(4):1272–1279.
- Jewett JC, Sletten EM, Bertozzi CR. Rapid Cu-free click chemistry with readily synthesized biarylazacyclooctynones. J Am Chem Soc. 2010;132(11):3688–3690.
- Wisnovsky S, Lei EK, Jean SR, et al. Mitochondrial chemical biology: new probes elucidate the secrets of the powerhouse of the cell. Cell Chem Biol. 2016;23(8):917–927.
- Asin-Cayuela J, Manas AR, James AM, et al. Fine-tuning the hydrophobicity of a mitochondria-targeted antioxidant. FEBS Lett. 2004;571(1–3):9–16.
- Wu S, Song Y, Li Z, et al. Covalent labeling of mitochondria with a photostable fluorescent thiol-reactive rhodamine-based probe. Anal Methods. 2012;4(6):1699.
- Heytler PG. uncoupling of oxidative phosphorylation by carbonyl cyanide phenylhydrazones. I. Some characteristics of m-Cl-CCP action on mitochondria and chloroplasts. Biochem. 1963;2(2):357–361.
- Mizushima N, Yoshimori T, Levine B. Methods in mammalian autophagy research. Cell. 2010;140(3):313–326.
- Katayama H, Kogure T, Mizushima N, et al. A sensitive and quantitative technique for detecting autophagic events based on lysosomal delivery. Chem Biol. 2011;18(8):1042–1052.
- Rosado CJ, Mijaljica D, Hatzinisiriou I, et al. Rosella: a fluorescent pH-biosensor for reporting vacuolar turnover of cytosol and organelles in yeast. Autophagy. 2008;4(2):205–213.
- Kuma A, Matsui M, Mizushima N. LC3, an autophagosome marker, can be incorporated into protein aggregates independent of autophagy: caution in the interpretation of LC3 localization. Autophagy. 2007;3(4):323–328.
- Katayama H, Hama H, Nagasawa K, et al. Visualizing and modulating mitophagy for therapeutic studies of neurodegeneration. Cell. 2020;181(1176–87):e16. .
- Li X, Hu Y, Li X, et al. Mitochondria-immobilized near-infrared ratiometric fluorescent pH probe to evaluate cellular mitophagy. Anal Chem. 2019;91(17):11409–11416.
- Zou X, Shi Y, Zhu R, et al. Organelle-redirected chameleon sensor-enabled live cell imaging of mitochondrial DNA. Anal Chem. 2019;91(24):15899–15907.
- Zou Z, Yan Q, Ai S, et al. Real-time visualizing mitophagy-specific viscosity dynamic by mitochondria-anchored molecular rotor. Anal Chem. 2019;91(13):8574–8581. .
- Hu F, Cai X, Manghnani PN, et al. Multicolor monitoring of cellular organelles by single wavelength excitation to visualize the mitophagy process. Chem Sci. 2018;9(10):2756–2761.
- Lee MH, Park N, Yi C, et al. Mitochondria-immobilized pH-sensitive off-on fluorescent probe. J Am Chem Soc. 2014;136(40):14136–14142. .
- Iwashita H, Torii S, Nagahora N, et al. Live cell imaging of mitochondrial autophagy with a novel fluorescent small molecule. ACS Chem Biol. 2017;12(10):2546–2551. .
- Xue Z, Zhao H, Liu J, et al. Imaging lysosomal pH alteration in stressed cells with a sensitive ratiometric fluorescence sensor. ACS Sens. 2017;2(3):436–442.
- Xue Z, Zhao H, Liu J, et al. Responsive hetero-organelle partition conferred fluorogenic sensing of mitochondrial depolarization. Chem Sci. 2017;8(3):1915–1921.
- Yoshimori T, Yamamoto A, Moriyama Y, et al. Bafilomycin A1, a specific inhibitor of vacuolar-type H(+)-ATPase, inhibits acidification and protein degradation in lysosomes of cultured cells. J Biol Chem. 1991;266(26):17707–17712.
- Correia-Melo C, Ichim G, Tait S, et al. Depletion of mitochondria in mammalian cells through enforced mitophagy. Nat Protocols. 2017;12(1):183–194.
- Mizushima N, Yamamoto A, Hatano M, et al. Dissection of autophagosome formation using Apg5-deficient mouse embryonic stem cells. J Biol Chem. 2001;152:657–668.
- Nunnari J, Suomalainen A. Mitochondria: in sickness and in health. Cell. 2012;148(6):1145–1159.
- Harrison DE, Strong R, Sharp ZD, et al. Rapamycin fed late in life extends lifespan in genetically heterogeneous mice. Nature. 2009;460(7253):392–395. .
- Alvers AL, Wood MS, Hu D, et al. Autophagy is required for extension of yeast chronological life span by rapamycin. Autophagy. 2009;5(6):847–849.
- Graziotto JJ, Cao K, Collins FS, et al. Rapamycin activates autophagy in Hutchinson-Gilford progeria syndrome: implications for normal aging and age-dependent neurodegenerative disorders. Autophagy. 2012;8(1):147–151.
- Li Q, Gao S, Kang Z, et al. Rapamycin enhances mitophagy and attenuates apoptosis after spinal ischemia-reperfusion injury. Front Neurosci. 2018;12:865.
- Bang M, Kim DG, Gonzales EL, et al. Etoposide induces mitochondrial dysfunction and cellular senescence in primary cultured rat astrocytes. Biomol Ther. 2019;27(6):530–539.
- Custodio JB, Cardoso CM, Madeira VM, et al. Mitochondrial permeability transition induced by the anticancer drug etoposide. T Toxic vitro. 2001;15(4–5):265–270.
- Li N, Ragheb K, Lawler G, et al. Mitochondrial complex I inhibitor rotenone induces apoptosis through enhancing mitochondrial reactive oxygen species production. J Biol Chem. 2003;278(10):8516–8525. .
- He C, Bartholomew CR, Zhou W, et al. Assaying autophagic activity in transgenic GFP-Lc3 and GFP-gabarap zebrafish embryos. Autophagy. 2009;5(4):520–526.
- Logan A, Pell VR, Shaffer KJ, et al. Assessing the mitochondrial membrane potential in cells and in vivo using targeted click chemistry and mass spectrometry. Cell Metab. 2016;23(2):379–385. .
- Xue Z, Zhang E, Liu J, et al. Bioorthogonal conjugation directed by a sugar-sorting pathway for continual tracking of stressed organelles. Angew Chem Int Ed. 2018;57(32):10096–10101.
- Xue Z, Zhao H, Liu J, et al. Defining cancer cell bioenergetic profiles using a dual organelle-oriented chemosensor responsive to pH values and electropotential changes. Anal Chem. 2017;89:7795–7801.
- Addanki S, Sotos JF. Observations on intramitochondrial ph and ion transport by the 5, 5-dimethyl 2, 4-oxazolidinedione (dmo) method. Ann N Y Acad Sci. 1969;147(19 Ion Transpor):756–804.
- Kumar S, Ranjan N, Kellish P, et al. Multivalency in the recognition and antagonism of a HIV TAR RNA–TAT assembly using an aminoglycoside benzimidazole scaffold. . Organic & Biomolecular Chemistry. 2016;14(6):2052–2056.