
ABSTRACT
Autophagic pathways are regulated mechanisms that play important roles in lysosome-mediated cellular degradation. Yet, the contribution of different autophagic pathways in lysosomal targeting, and characterization of the extent and specificity in their degradome remains largely uncharacterized. By undertaking a multiplex quantitative mass spectrometry approach, we have previously analyzed the lysosomal proteome during chaperone-mediated autophagy (CMA)-stimulated conditions in cancer cells. Here, we have extended our multiplex quantitative mass spectrometry and bioinformatics analysis on the proteome from isolated lysosomes to gain a comprehensive view of the temporal enriched lysosomal content upon non-macroautophagy-activated conditions. In parallel, we describe the functional dependency of LAMP2A on, and to what degree the presence of KFERQ-like motifs in proteins influences, their lysosomal targeting. These findings establish a framework for a better understanding of the degradome mediated by autophagic pathways beyond macroautophagy, and present characterization of the impact of LAMP2A in lysosomal targeting in cancer cells.
Abbreviations: CMA: chaperone-mediated autophagy; ER: endoplasmic reticulum; EIF4A1: eukaryotic translation initiation factor 4A1; eMI: endosomal microautophagy; FC: fold change; GO: gene ontology; ISR: integrated stress response; LAMP2A: lysosomal associated membrane protein 2A; MA: macroautophagy; MI: microautophagy; MS: mass spectrometry; PCA: principal component analysis; TAX1BP1: Tax1 binding protein 1.
Autophagic pathways coexist in cells to act in a synchronized, sequential or compensatory manner, with distinct molecular and regulatory machinery, hence diverge in their delivery mechanism of the cargo material [Citation1–3]. Beyond the variety of cellular components that can actively be delivered into lysosomes by different autophagy pathways, non-macroautophagy (MA) pathways, such as microautophagy (MI) and chaperone-mediated autophagy (CMA), are proposed to contribute to the lysosomal targeting of a select subset of proteins [Citation4–8]. Yet, most global proteomic studies using mammalian cells have so far focused on the effect of MA in lysosomal degradation upon the shortage of amino acids [Citation9,Citation10]. Accordingly, despite the established involvement in both basal and stress response induced proteolysis, to date, the specific contribution of autophagic pathways other than MA in lysosomal targeting and a comprehensive characterization of the extent and selectivity for their degradome remains mainly uncharacterized in mammalian cells. In addition, it is well known that the deficiency of various nutrients and different types of starvation conditions, including amino acid, serum or glucose starvation, can induce specific autophagy-mediated lysosomal degradation at different levels [Citation11,Citation12]. In fact, comparisons of the transcriptional profiles induced by distinct conditions of nutrient deprivation uncovered that amino acid and glucose scarcity display divergent effects on mammalian cells [Citation13]. While glucose is one of the principal energy sources for cancer cells [Citation14], little is known to what extent glucose starvation affects the lysosomal proteome by the non-MA pathways, and whether MI or CMA display cargo and/or spatiotemporal selectivity in cancer cells remains undefined.
To characterize the CMA-mediated lysosomal degradome, we previously performed a quantitative multiplexed proteomic analysis of isolated lysosomes from triple negative breast SUM159 cancer cells grown under control conditions compared to when treated with the small molecule receptor tyrosine kinase inhibitor AC220 (quizartinib), known to selectively block cellular glucose uptake without profoundly affecting the glutamine metabolism [Citation5,Citation15]. Cells were simultaneously treated with the specific and potent autophagy inhibitor, Spautin-1 [Citation16,Citation17], to eliminate the contribution from the MA and to simultaneously stimulate other lysosomal proteolytic pathways of CMA and MI [Citation4–6]. Further, depletion of LAMP2A (lysosomal associated membrane protein 2A), enabled us to distinguish the lysosomal proteome impacted by CMA from MI, and led to the identification of proteins of select cellular pathways affected by CMA. Further, we were able to experimentally validate the CMA-dependent degradation of key proteins primarily at the level of translation initiation [Citation6]. While our initial study presented a reliable system for proteome analysis of lysosomal content and led to the identification of novel CMA substrates, a large portion of the lysosomal enriched proteins were shown to be unaffected by LAMP2A depletion and a general characterization of this degradome remained undescribed. In addition, delineation of whether lysosomal enriched proteins displayed any cargo and/or spatiotemporal selectivity was not investigated.
Here, we included the analysis of the multiplexed-proteomic data from isolated lysosomes at the treatment condition of 16 h allowing us to simultaneously compare it to that of previously presented 36 h. Thus, we extended our quantitative investigation to gain a deeper view on the content of the lysosomal proteome and changes across time during glucose deprivation-induced starvation conditions in cancer cells when MA is inhibited. Lysosomal fractions were isolated from cells by differential large-scale multi-layered density gradient centrifugations and analyzed by western blotting. Data were previously shown for control, 16 h (early), 36 h (late) and 36 h (late) + siLAMP2A treated sample sets as in Hao and Kacal et al. [Citation6]. Accordingly, to effectively remove potential skew in the multiplexed mass spectrometry (MS) data , the tandem mass tags (TMT) signal normalization of all sample sets, now including the 16 h samples, and distribution normalization based on total protein using the Quantile method was done as previously [Citation6]. This was followed by the comparison of the sample groups by principal component analysis (PCA), which further verified a well-separation between the treated sample groups (16 h vs 36 h) (), in addition to the control and LAMP2A knockdown sample sets that were presented in Hao and Kacal et al. [Citation6].
Figure 1. Quantitative proteomic analysis of temporal lysosomal degradome. (A) Score plot of principal components analysis (PCA) in 3D of untreated control (Ctrl), AC220 + Spautin-1 treated early (16 h) and late (36 h) conditions, as well as when LAMP2A was knocked down in AC220 + Spautin-1 treated 36 h. PC1, PC2 and PC3: principal component 1, principal component 2 and principal component 3. Each dot represents one sample of biological replicates. (B) Flow chart of all lysosomal enriched detected proteins, indicating their “early” or “late” accumulation. The number of proteins of Non-continuous, Continuous, and late accumulation, are shown. Further LAMP2A-dependent proteins are depicted for both early and late group. (C) Lysosomal enrichment of proteins in early and late lysosomal fraction sample sets of SUM159 cancer cells grouped as Non-continuous, Continuous and Only late degradome. (D) Relative lysosomal enrichment of indicated proteins. ***p < 0.001; ns, non-significant, one-way ANOVA test with multiple comparisons. (E) Comparison of log transformed length of proteins enriched at early and late lysosomes, ***p < 0.001, unpaired t-test. (F) Subcellular localization of Early and Late lysosomal proteome and the percentage of proteins relative to the total quantified proteome. (G) Reactome pathway enrichment analysis. Dot plot of enriched pathways is indicated as the ratio of the differentially expressed gene number to the total gene number in a certain annotation. The size and color of the dots represent the gene ratio and the range of p values, respectively. (H) Lysosomal enrichment scores, fold over the control, for all individual proteins enriched in the pathways indicated are shown for early and late lysosomal proteome. The enrichment fold change cut off value of 2 FC is plotted as a black dashed line for all graphs
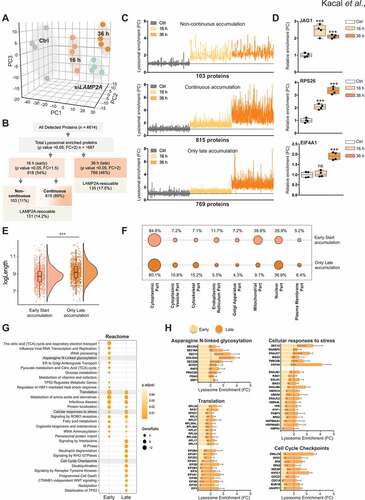
While the proteomic analysis yielded quantifications of 1687 proteins with a significant lysosomal enrichment scores (p value <0.05 with >2-fold change (FC)) corresponding to 36.5% of the total detected proteins at 36 h following glucose deprivation response (), our previous study predominantly focused on the lysosomal proteome that was further affected by LAMP2A depletion [Citation6]. To characterize the remaining proteome and to understand if the enriched proteins display a temporal lysosomal targeting, we broadened our analyses of their lysosomal enrichment at 16 h. We reasoned that lysosomal targeting of proteins might be temporally transformative, thus very unlikely to display a 2-fold enrichment already at 16 h. Indeed, when the same enrichment criterion of >2 FC was employed to 16 h as of 36 h, only 93 proteins showed significant lysosomal accumulation. This suggested us that while proteins reach a 2-fold lysosomal enrichment at later phases of starvation, the strict fold value may not reflect and allow the detection of their earlier targeting to the lysosomes. Thus, by lowering the fold enrichment value, we would be able to catch their potential sequential enrichment. Accordingly, the analysis of 16 h samples was done using a FC of ≥1.5 with adjusted p value <0.05 compared to the control samples. This revealed that out of the total lysosomal enriched proteome at 36 h, 54% of proteins indeed had started to show a lysosomal enrichment already at 16 h with at least 1.5 FC, while the remaining 46% did not display lysosomal enrichment until 36 h (), indicating clear differences in lysosomal targeting dynamics with the duration of the starvation stress. Accordingly, by comparing the lysosomal proteome across time, we were able to divide proteins into three different categories; a) proteins that showed a significant (p value <0.05, FC≥1.5) enrichment compared to control but no substantial further lysosomal accumulation comparing 16 h to 36 h, which we referred to as “non-continuous proteome”, b) proteins that had started to display a significant (p value <0.05, FC≥1.5) lysosomal enrichment at 16 h but further accumulated in lysosomes time-dependently showing a FC>2 at 36 h, referred to as “continuous proteome”, and c) proteins that displayed no significant enrichment at 16 h but reached a 2-fold or more increase (p value <0.05) levels only at 36 h, referred to as “only late proteome” (). We then plotted the lysosomal enrichment for each of the three groups () with a proof-of-concept example of a representative protein per category (). This revealed that only a portion (11%) of the enriched proteins displayed a non-continuous characteristic, while most (89%) proteins showed a continual lysosomal enrichment. While this supports the well-established hypothesis that nutrient starvation induces an augmented lysosomal targeting, our data also demonstrate that a significant amount of the total lysosomal enriched proteins were targeted to lysosomes only at late phases of glucose starvation. In fact, EIF4A1 (eukaryotic translation initiation factor 4A1), which was identified as a bona fide CMA substrate previously [Citation6], was among the only late enriched proteome ().
In order to investigate factors that might influence the temporal dynamics of lysosomal enriched proteome, we considered proteins that belong to the “non-continuous” and “continuous” as “Early” due to their significant lysosomal levels detected already at 16 h, while 36 h enriched proteome as “Late”, for further analysis. Among the previously tested protein sequence-based features, the protein length is suggested to display one of the best scores to correlate with protein solubility and stability [Citation18], of which smaller proteins are indicated to be more soluble. Hence, we examined the protein sequence length of the proteome and found that the content of the early and the late targeted proteins slightly differ in terms of protein size, with a tendency of larger proteins to be more present in the late lysosomal proteome (). Further, by the distribution-based cellular localization Gene Ontology (GO) terms, we investigated whether the subcellular localization of proteins might influence their targeting rate. We compared the protein distribution annotated to the GO term Cytoplasmic part (GO:0044444) including subgroups of cytoplasmic vesicle (GO:0044433) and cytoskeletal part (GO:0044430), determined as cellular part excluding and compared to the plasma membrane (GO:0044459) and nucleus (GO:0044428), but including other subcellular structures. While no marked difference was observed between the cytoplasm (84.8% vs 80.1%) and plasma membrane annotated proteins (5.2% vs 6.4%) in the early or late proteome (), proteins associated to the constituent part of the nucleus showed a higher lysosomal enrichment at late response (). Further cluster analysis of the recorded protein profiles revealed that proteins associated to endoplasmic reticulum (ER) (GO:0044432), Golgi apparatus (GO:0044431) and mitochondria (GO:0044429) were targeted for lysosomes primarily earlier upon glucose starvation response (). These findings suggest that proteins associated to certain functional organelles, including ribosomes, known to consist of smaller proteins [Citation19], could be preferably targeted earlier, while proteins related to other organelles, such as nucleus showed delayed lysosomal targeting dynamics.
Next, to provide biological context to the enriched early and late lysosomal proteome, we defined cellular processes by performing biological function analyses using the Reactome database. In this analysis, the dot plot enrichment map revealed a clear partitioning of significantly overrepresented pathways (p value <0.05), affected in a temporally ordered fashion (). Among the top enriched pathways, at the early starvation response, were multiple integrated stress response (ISR) related processes, including RNA processing, translation, viral infection (Influenza viral RNA transcriptional and replication) and heat shock protein response proteins. Various metabolic processes were also among the majority of the pathways mapped, followed by glycosylation and ER-to-Golgi transport mechanisms (). Notably, while glucose availability controls many of the metabolic and biosynthetic pathways among the highly enriched terms, our analysis revealed that proteins linked to diverse metabolic processes were targeted to lysosomes at different starvation phases. While glucose, pyruvate and vitamin metabolism represented rather early targeted processes, amino acid and fatty acids metabolic pathways displayed a distribution between both early and late enrichment, whereas late starvation phase was governed mostly by nuclear events, signal transduction and cell death processes ().
Beyond demonstrating the distribution of distinct biological pathways at early or late phases of glucose starvation, the dot plot enrichment also showed the gene ratio, proportion of proteins belonging to the assigned pathways over the total number of proteins analyzed, as dot size (). This revealed that for some pathways, such as the Peroxisomal protein import and Cellular responses to stress, the fraction of proteins was higher and more significantly enriched at different time points. In addition, while the pathway analysis provided valuable information on the most significant enriched processes, it did not highlight the individual protein identities. Thus, in order to reveal distinct proteins annotated to significant terms in the analyzed lysosomal proteomes, we dissected some of the pathways. The early (Asparagine N-linked glycosylation), late (Cell Cycle Checkpoints) or the overlapping distribution of Translation and Cellular responses to stress pathways between the early and late proteome were further recapitulated based on their lysosomal enrichment as visualized by bar graphs (). This visualization displayed distinct and different lysosomal enrichment scores for individual proteins in indicated biological processes. Further, it also revealed that within the same cellular processes that display both an early and late response, select proteins were targeted for lysosome at distinct phases of glucose starvation. For example, within the Translation process, ribosomal proteins (RPs) were predominantly enriched earlier compared to proteins of eukaryotic initiation factors (EIFs) that enriched later (). This is, in complete agreement with the experimentally validated EIF4A1 protein from our previous study [Citation6].
Combined, these analyses suggest an extensive accumulation and coincidence of a large number of proteins related to stress adaptive mechanisms and the ISR, as well as energy and metabolism in the induced lysosomal proteome. These findings provide evidence that beyond trying to restore cellular homeostasis by activating a network of ISR, cancer cells target regulators of processes dispensable during starvation, such as translation. Moreover, cancer cells seem to simultaneously implement adaptations by shutting down anabolic metabolism processes uniquely affected by the specific nutrient starvation, related to glucose. This constitutes a coherent response to the nature of starvation condition as the glucose-regulated protein family consists of a set of stress-inducible proteins localized in the ER [Citation20]. Collectively, while supporting the well-established hypothesis that nutrient starvation induces a cellular response to alleviate stress by engaging expanded lysosomal degradation, our data demonstrate the significance of autophagy-lysosome proteolysis beyond MA in regulating fundamental cellular stress and adaptation responses.
Further, our data present a view of a starvation duration-dependent lysosomal enrichment of proteins involved in biological processes in a selective fashion manner. Proteins associated to different biological functions were targeted temporally based on the intensity of the stress induced by glucose deprivation. For example, the targeting of proteins related to ER earlier might be due to the consequence of the blockage of glycosylation, a form of post-translational modifications that require glucose availability. Accordingly, glucose deprivation induces ER stress and misfolded proteins in the ER are counteracted by the unfolded protein response, followed by their increased targeting to the lysosomes. In line with this, the pathway analysis revealed that N-linked glycosylation as one of the top hits.
The presence of KFERQ-like motif and the impact of LAMP2A in lysosomal targeting of proteins during glucose starvation response
As mentioned above, our previous study focused on the portion of the lysosomal enriched proteome that was significantly affected by the LAMP2A depletion, a key and rate-limiting regulator of CMA. This was mainly to identify the CMA targetome based on their LAMP2A dependency for lysosomal targeting [Citation6]. Of particular interest to this study was therefore to more thoroughly analyze the relevance of LAMP2A in general and to assess the influence and prevalence of proteins harboring KFERQ-like motifs in lysosomal targeting. Previous proteomic analysis comparing the lysosomal compartments of wild-type and lamp2a knockout cells, were performed using mice liver subproteome [Citation21]. Additionally, a study reported a computational in silico analysis of KFERQ-like motifs in proteomes across multiple species [Citation22]. However, no broad experimental validation of the prevalence and abundance of proteins with KFERQ-like motifs and their actual LAMP2A dependency for lysosomal targeting, during glucose starvation, had been investigated in human cancer cells. To this end, we provide here two parallel assessments of the lysosomal enriched proteome detected by MS. Since CMA is specific for targeting of proteins containing a five-amino-acid motif with the consensus sequence biochemically related to KFERQ in a LAMP2A-dependent manner, we first analyzed sequences of all lysosomal enriched proteins in early and late proteome groups to reveal their predicted prevalence of KFERQ-like motifs, including both canonical and putative motifs (). The latter is CMA recognition motif(s) that can be generated by post-translational modifications which changes the biophysical properties of amino acids [Citation23]. Based on this search, 50% of the early enriched proteins showed canonical KFERQ-like motif(s), out of which half (25%) displayed only one canonical motif, and the remaining half featured multiple canonical motifs in their amino acid sequences (). In the late enriched proteome, a slight increase (63%) on the total number of proteins containing one (25%) or multi (38%) canonical KFERQ-like motif was observed. This increase may be due to that a KFERQ-dependent lysosome enrichment is primarily predicted to occur during prolonged starvation response, similar to what has been shown using a KFERQ-tagged fluorescent biosensor [Citation24]. A slight difference was detected between the early (45%) and late (33%) enriched proteome including proteins with putative CMA motifs (), while the remaining 5% (early) and 4% (late) of the total proteome lacked any predicted canonical or putative CMA motifs. This analysis revealed that there is a high prevalence of predicted KFERQ-like motifs in proteins significantly enriched in the lysosomes following glucose starvation, including the experimentally validated EIF4A1, EIF4H and DDX3X proteins, where the functionality of CMA motifs was investigated by mutational studies previously [Citation6].
Figure 2. Prediction of KFERQ-like motifs on lysosomal degradome and validation of their LAMP2A dependency. (A) Pie graphs showing the percentage of all enriched proteins in the early and late lysosomal proteome harboring predicted types of KFERQ-like motifs. (B) Pie graphs of LAMP2A-dependent degradome showing the percentage of proteins with indicated types of KFERQ-like motifs. Motif frequency in the total and temporal distribution of the proteome is presented. (C) Western blot analysis of the indicated proteins in lysosomal fractions from control, AC220 + Spautin-1 treated (36 h) conditions, as well as AC220 + Spautin-1 (36 h) with the presence of either LAMP2A or VPS4A/B siRNA treated samples. (D) Relative lysosomal enrichment of EIF4A1 and TAX1BP1 proteins as determined by MS. ns, non-significant, **p < 0.01, ***p < 0.001; unpaired t-test. (E) Table summary of indicated proteins with their predicted canonical CMA motifs. (F) Relative lysosomal enrichment of indicated non-LAMP2A-rescuable proteins as analyzed by MS. ns, non-significant, ***p < 0.001; unpaired t-test. (G) Western blot data from lysosomal fractions from the experimental conditions as in (C) analyzed for LAMP2A, VPS4, and indicated non-LAMP2A-rescuable proteins: ACBD3, VCIP135, and RNF213
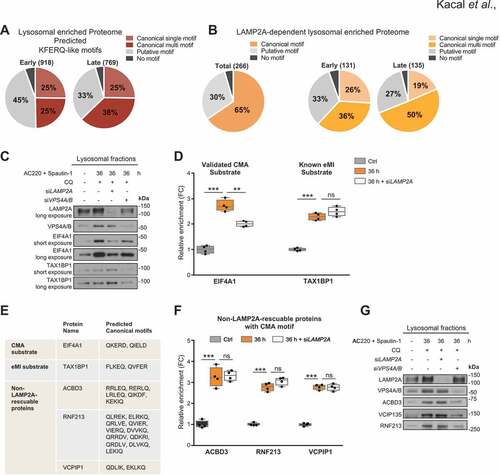
Secondly, we performed CMA motif search on the experimentally validated LAMP2A affected degradome and assessed the impact of LAMP2A to shape the early and late lysosomal proteomes (), thus the effect of LAMP2A depletion might enable us to distinguish the lysosomal proteome impacted by CMA from MI and other non-MA mediated lysosomal degradative pathways. This assessments revealed that while a large fraction of proteins were predicted to display canonical CMA motifs (), in line with the notion of a frequent KFERQ-like motifs in the human proteome [Citation22], when the lysosomal enrichment of these proteins was validated for their LAMP2A dependency, only 16% (266) proteins were found to display significant (p value <0.05), with ≥20% reduced lysosomal scores upon LAMP2A depletion as described before [Citation6] (). Further analysis revealed that 52% of the total proteome was either non-significant (p value >0.05) or affected statistically significantly by LAMP2A depletion, albeit less than 20%, hence considered as non-significant based on the used cut off criteria. Whereas, 32% of proteins were enriched in the lysosomes independently of LAMP2A.
Notably, out of the non-LAMP2A-dependent proteome, 53% harbor canonical CMA motif(s). This implies that a portion of proteins predicted to have a KFERQ-like motifs were not significantly affected by LAMP2A depletion for their lysosomal targeting during glucose starvation. However, it is well known that not all proteins bearing the CMA recognition motif is constantly targeted by CMA, but may need additional stimuli [Citation25]. Our data further suggest that the existence of a CMA motif in a protein is not mutually exclusive of targeting proteins for lysosomes by other means than CMA. Therefore, it is important to consider that KFERQ-like motifs containing protein internalization can occur by MI [Citation26], especially by HSPA8/Hsc70-driven endosomal microautophagy (eMI) in a LAMP2A-independent manner upon our treatment condition. As these proteins can be directed to the endosomal membrane by eMI in an ESCRT-I and -III dependent mechanism, it is also possible that eMI compensates for the reduced CMA upon LAMP2A depletion.
To investigate the involvement of eMI for KFERQ-like motif protein internalization upon our treatment condition, we set up several lysosomal fractionation experiments from treated SUM159 cells following siRNA-mediated knockdown of either LAMP2A or VPS4A/B (key genes regulating eMI). First, we validated the knockdown efficiency of LAMP2A and VPS4A/B siRNA in isolated lysosomal fractions (). Further, we tested whether known substrate for eMI, TAX1BP1 (Tax1 binding protein 1) [Citation8], was present in the lysosomal fractions () and identified in lysosomal enriched proteome from the MS analysis following treatment condition (). This was followed by investigation whether its enrichment into lysosomes were affected by silencing of LAMP2A or VPS4A/B. Compared to the known CMA substrate EIF4A1, which shows a LAMP2A dependency as previously reported, the eMI substrate TAX1BP1 was not significantly affected by LAMP2A depletion ( and ), while its lysosomal localization was markedly affected by VPS4A/B silencing (). Of note, TAX1BP1 was identified as a non-LAMP2A-rescuable protein harboring a KFERQ-like motif in our study, which displays 2 canonical (FLKEQ, QVFER) and 6 putative (LKIEK, KDKLK, DKLKK, QRTFL, EKVKK, KEKFK, KELKR) CMA motifs ().
To experimentally validate the non-LAMP2A-dependent but canonical CMA motif containing lysosomal enriched proteome, proteins displaying varying number of KFERQ-like motifs were chosen for further investigation, including ACBD3/GCP60 (acyl-CoA binding domain containing 3) displaying 5 canonical CMA motifs, RNF213 (ring finger protein 213) containing 11 canonical CMA motifs and VCPIP1/VCIP135 (valosin containing protein interacting protein 1) that harbors 2 canonical CMA motifs (). Beyond canonical motifs, these proteins also harbor multiple putative CMA motifs. We first interrogated the proteomic data for the 3 non-LAMP2A-dependent proteins in isolated fractions upon control, treated samples and the effect of LAMP2A silencing (). Further, we studied their lysosomal enrichment and if changes in the lysosomes abundance of these proteins were affected by VPS4A/B silencing (). As seen by immunoblotting, all three proteins displayed increased levels in the lysosomes following 36 h of treatment compared to the control, while knockdown of LAMP2A had no effects on their lysosomal quantities (). In marked contrast, significant reduction in lysosomal level of these proteins was detected upon VPS4A/B depletion even under treatment conditions (). These data indicate that ACBD3, RNF213 and VCPIP1 proteins are primarily targeted by eMI and their lysosomal enrichment upon glucose starvation conditions is dependent on the presence of ESCRT III–VPS4A/B complex proteins.
Quantitative proteomic analysis of LAMP2A-dependent lysosomal enriched proteome
We then turned our attention to the LAMP2A-dependent lysosomal enriched proteome. Our broaden analyses showed that out of the total LAMP2A-rescuable proteins, 49% (131) belonged to the early and 51% (135) to the late enriched proteome, which indicates temporal substrate targetability by CMA with the duration of the stress. In addition, out of this proteome 65% displayed one or more canonical, while 30% contained putative KFERQ-like motif(s) (). Among the canonical motif containing proteins only 9% featured just one canonical, while 91% had a mixture of multiple canonical with putative motifs. Surprisingly, we detected that a small portion of proteins (5%) lacking any KFERQ-like motif (both canonical or putative) still was dependent on LAMP2A for their lysosomal localization (). This revealed that not all proteins dependent on the presence of LAMP2A for lysosomal targeting harbors CMA motifs. The full list of the MS validated LAMP2A-dependent lysosomal enriched proteome is presented as a heat map with depicted protein name and categorization based on KFERQ-like motifs predictions ( and Table S1).
Figure 3. Characterization of the LAMP2A-dependent proteome. (A) Heat map representation of the full list of all LAMP2A-dependent proteins shown in four biological replicates. Proteins are grouped based on their type of single canonical, multi canonical, putative or no KFERQ-like motif. Box plot comparison of (B) number of canonical motifs/protein or (C) protein length of all LAMP2A-dependent proteome, with degradation dynamics. Wilcoxon rank-sum test was performed and p values are presented in the box plots. Linear regression model for the correlation between (D) number of all motifs/protein and protein length or (E) number of canonical motifs/protein and protein length, respectively. Adjusted R square and p values are presented in the plots. Proteins containing single or multiple motifs are indicated by dark and light orange colors, respectively. (F) Temporal distribution of biological pathway enrichment Reactome analysis of LAMP2A-dependent degradome. (G) Distribution of biological pathway enrichment Reactome analysis of LAMP2A-independent and -dependent lysosomal degradome. Dot plot of enriched pathways is indicated as the ratio of the differentially expressed gene number to the total gene number in a certain annotation. The size and color of the dots represent the gene ratio and the range of p values, respectively
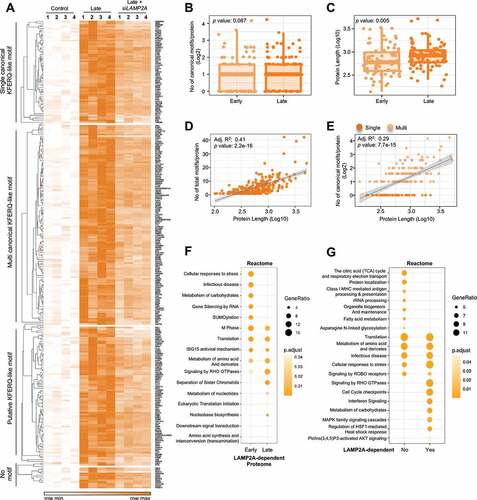
While, mutational validation of the importance of the predicted KFERQ-like motifs remains to be investigated, our data uncovered that proteins with single canonical motifs were more present at early lysosomal content whereas proteins with multi canonical motifs were enriched later ( and ). While it is likely that multi KFERQ-motif-containing proteins would be expected to demonstrate an early lysosomal enrichment given the higher likelihood of motifs to be recognized, the proportions of proteins with multi KFERQ-like motifs was markedly increased at late response both in the predicted and MS validated proteome. These findings verify that the increment number of CMA motifs in a protein does not accelerate the rate of lysosomal enrichment either by MI or CMA [Citation23]. Moreover, comparing the early and late LAMP2A-dependent lysosome proteome, we observed a concomitant decrease in the proportion of proteins with putative, with a slight increase of proteins featuring canonical CMA motifs in the late proteome ( and ). This may suggest that proteins with canonical KFERQ-like motifs are more likely to be targeted to the lysosome at prolonged stress conditions. However, we did not observe significant temporal difference when we compared the number of canonical motifs per proteins for LAMP2A-dependent early and late proteome ().
Given the higher number of probabilities for amino acid compositions required to create KFERQ-like motifs, we postulated that the frequency of motif abundance might simply be due to the length of a protein. First, we observed that protein length for the LAMP2A-dependent early and late proteome differed significantly (), which coincides with the observation shown in . Further, we analyzed the possible relation between the number of total motifs (including both predicted canonical and putative motifs) per protein and protein length by using linear regression model. This revealed a correlation coefficient of 0.41, indicating a significant positive correlation between the total number of motifs per protein and protein length (). However, although we observed a positive correlation of total possibilities to harbor multiple motifs in longer proteins, protein length seems not to play an important feature for the occurrence of a strict canonical motif (). Taken together, these data suggest that even though longer proteins may contain more potential CMA motifs, the amino acid length of KFERQ-like motif-containing proteins seems not to influence their enrichment rate.
Lastly, to analyze the biological importance of the LAMP2A-rescuable proteins, we performed two biological function analyses using the Reactome database. First, we analyzed whether the enrichment dynamics of LAMP2A-rescuable proteins had any association with specific cellular processes by comparing the early and late proteome (), which uncovered temporal differences in biological processes within the LAMP2A-dependent proteome. For instance, while the broad Translation process was covered both within the early and late proteome, indicating that proteins belonging the translation pathways were targeted to the lysosomes at continuous manner, proteins govern by the specific process of the Eukaryotic translation initiation was shown to enrich in the lysosomes at late phases (). Secondly, we compared if the total LAMP2A-dependent vs independent proteome might differ based on biological function distribution (). Interestingly, our observations suggest that majority of the proteins associated with pathways and events involved in the starvation induced ISR, including translation, metabolism of amino acid, infection disease and cellular response to stress were targeted to the lysosomes independently of LAMP2A. Different proteins albeit belonging to these response pathways were equally enriched in the lysosomes. This coincided with the rationale that starvation is a frequent and serious threat that needs to be coped immediately, and may not be selective to any specific autophagy-lysosome pathway, as CMA requires de novo synthesis of the receptor. Further our analysis showed that while mitochondrial, ER, and Golgi processes, as well as protein localization on organelle biogenesis and maintenance events are LAMP2A-independent, many cellular signaling events seems to be dependent on LAMP2A for their lysosomal enrichment. This strengthens the notion that functionally related proteins may be regulated selectively by CMA [Citation6,Citation22]. These findings further suggest that the decision for substrate selection and recognition in a given cell may rather depend on the distinct function that protein exerts during the condition CMA is activated upon, and a selectivity of LAMP2A in target choice. Thus, our observations indicate that the critical decision for select protein targeting lies on the distinct protein function, and that compensatory mechanisms regulating not only the accessibility of KFERQ-like motifs but also specific target recognition exists.
In conclusion, this study presents a comprehensive, novel and integrated analysis of the dynamic changes of the temporal lysosomal proteome in response to glucose starvation and establishes a framework for a better understanding of lysosomal targeting of proteins when MA is inhibited, and lay the ground for characterization of the importance of LAMP2A in shaping the lysosomal proteome in cancer cells. Beyond providing a novel link between target selectivity with the duration of the stress, importantly our findings reveal that recognition and targetability of proteins harboring KFERQ-like motifs are mainly determined by their biological functions and dispensability during the stress condition. Our analyses further show a novel link between the targeting dynamics of LAMP2A-dependent proteins with specific cellular processes, revealing a discernment of LAMP2A in target choice.
Materials and methods
LC-MS/MS and data generation
8-plex tandem mass tags (TMTs) isobaric-based labeling and LC-MS/MS data for 16 h samples were generated simultaneously as with the previously described control, 36 h and 36 h + siLAMP2A isolated lysosomal fraction samples in four experimental replicates, using the breast cancer cell line, SUM159 [Citation6].
Bioinformatics analysis
The full raw data were first log2 transformed and then batched cleaned by applying the limma package to fitting a linear model [Citation27]. For distribution normalization based on total protein, the quadruplicate data from different sample group sets were normalized using the Quantile method [Citation27]. The quality of normalized data was checked by PCA analysis using stats package in R. For generation of “Non-continuous”, “Continuous”, and “Late” lysosomal enriched protein lists, the FC and statistical significance (p value <0.05) between different sample groups were calculated over the control individually using the limma package [Citation27]. Proteins with adjusted p value <0.05 and a positive FC of >1.5 over the control for 16 h and a positive FC of >2 over the control for 36 h were considered for further analysis. For the analysis of LAMP2A siRNA-treated samples, proteins in addition to a 2-fold enrichment upon treatment with adjusted p value <0.05 over the control, that also displayed at least 20% reduced lysosomal accumulation upon LAMP2A depletion with adjusted p value <0.05 were considered as LAMP2A-dependent. The “Non-continuous” lysosomal enriched proteins are the proteins that are both enriched in 16 h versus control and 36 h versus control lists with the FC ratio between 36 h versus control and 16 h versus control <1.3, whereas the “Continuous” lysosomal enriched proteins with the FC ratio >1.3. The “Late” lysosomal enriched proteins are significantly enriched in the 36 h versus control list, but not in the 16 h versus control list. For the non-LAMP2A-dependent proteome, proteins from the total lysosomal enriched proteins that display no FC (1 – <1.01) regardless of their adjusted p values in 36 h versus 36 h + siLAMP2A list were considered. KFERQ-like motifs were retrieved from KFERQ finder V0.8 [Citation22]. Linear regression model was performed to investigate the association between the protein length and the number of motifs using lm function in R-3.6.2. Functional profiles and Reactome pathway analyses were analyzed and visualized using clusterProfiler V3.12.0 and the compare Cluster function was used for comparing between groups [Citation28].
Lysosomal fractionation and enrichment
The lysosomal fractionation from SUM159 cells was performed according to the manufacturer of the Lysosome Isolation Kit (Sigma-Aldrich, LYSISO1) as previously described [Citation6]. The lower percent fractions were used. Fractions were subjected for western blotting using different antibody markers for detection of enrichment of lysosomes and subcellular cross contamination.
Lysosome fractions from untreated control, AC220 + Spautin-1 treated (36 h), or treated with or without LAMP2A or VPS4A/B siRNA samples were mixed with SDS sample buffer (62 mM Tris-HCl, pH 6.8, 0.05% w:v bromophenol blue, 4% v:v glycerol, 2% w:v SDS, 5% β-mercaptoethanol final concentration). The combination treatment of 2 µM AC220 (Selleckchem, S1526) and 20 µM Spautin-1 (Sigma-Aldrich, SML0440) was used in the presence of a lysosomal inhibitor, CQ (25 µM; Sigma-Aldrich, C6628) as previously described [Citation6]. Equal amounts for each sample was subjected to SDS-PAGE and transferred onto nitrocellulose membranes for immunoblotting. Total protein loading is visualized by Ponceau S Red staining.
siRNAs
siRNAs for VPS4A/B were purchased from Shanghai Gene Pharma Co, Ltd. The transfection was performed with 20 nM siRNA using Lipofactemine 2000 Reagent (Invitrogen, 11668019) according to the manufacturer’s instructions. The siRNA knockdown efficiency was analyzed by western blotting at 72–96 h post-transfection. The following siRNAs were used:
VPS4A sense 5ʹ-CCGAGAAGCUGAAGGAUUATT-3ʹ
VPS4A antisense 5ʹ-UAAUCCUUCAGCUUCUCGGTT-3ʹ
VPS4B sense 5ʹ-CCAAAGAAGCACUGAAAGATT-3ʹ
VPS4B antisense 5ʹ-UCUUUCAGUGCUUCUUUGGTT-3ʹ
Antibodies
Western blotting was performed as previously described [Citation6]. The following primary antibodies were used for western blotting: anti-ACBD3 (Santa Cruz Biotechnology, sc-101277), anti-EIF4A1 (Abcam, ab31217), anti-LAMP2A (Abcam, ab18528), anti-RNF213 (Santa Cruz Biotechnology, sc-293391), anti-TAX1BP1 (Sigma-Aldrich, HPA024432), anti-VCIP135 (Cell Signaling Technology, 88,153), anti-VPS4 (Sigma-Aldrich, SAB4200025). The following secondary antibodies were used: Goat anti-mouse IgG, (H + L) secondary antibody, HRP (Thermo Fisher Scientific, 31,430) and goat anti-rabbit IgG, (H + L) secondary antibody, HRP (Thermo Fisher Scientific, 31,460). All antibodies were diluted according to the manufacturer’s recommendation.
Statistical analyses
All graphs and plots were analyzed and prepared by using Prism7 and R. For multiple comparisons, one-way ANOVA test was used. For early and late proteome comparisons, unpaired t-test was used for the data shows normal distribution and Wilcoxon rank-sum test was used for the data that does not follow a normal distribution. To investigate the relations lm function in R-3.6.2 was used. Data are presented as mean ± S.D. ns, not significant, **p < 0.01, ***p < 0.001.
Supplemental Material
Download ()Acknowledgments
This work was supported by grants from Karolinska Institutet, the Swedish Research Council (VR), Ragnar Söderberg Foundation and Swedish Cancer Society (Cancerfonden). We thank Dr. Mandy Rettel and Dr. Frank Stein at the Proteomics Core Facility, EMBL Heidelberg, Germany, for the Mass Spec analysis.
Disclosure statement
The authors declare no conflict of interest and no financial disclosure.
Supplementary material
Supplemental data for this article can be accessed here.
Additional information
Funding
References
- Mizushima N, Komatsu M. Autophagy: renovation of cells and tissues. Cell. 2011 Nov 11;147(4):728–741.
- Tekirdag K, Cuervo AM. Chaperone-mediated autophagy and endosomal microautophagy: joint by a chaperone. J Biol Chem. 2018 Apr 13;293(15):5414–5424.
- Orenstein SJ, Cuervo AM. Chaperone-mediated autophagy: molecular mechanisms and physiological relevance. Semin Cell Dev Biol. 2010 Sep;21(7):719–726.
- Vakifahmetoglu-Norberg H, Kim M, Xia HG, et al. Chaperone-mediated autophagy degrades mutant p53. Genes Dev. 2013 Aug 1;27(15):1718–1730.
- Xia HG, Najafov A, Geng J, et al. Degradation of HK2 by chaperone-mediated autophagy promotes metabolic catastrophe and cell death. J Cell Biol. 2015 Aug 31;210(5):705–716.
- Hao Y, Kacal M, Ouchida AT, et al. Targetome analysis of chaperone-mediated autophagy in cancer cells. Autophagy. 2019 Mar 1;15(9):1558–1571.
- Park C, Suh Y, Cuervo AM. Regulated degradation of Chk1 by chaperone-mediated autophagy in response to DNA damage. Nat Commun. 2015 Apr 16;6:6823. .
- Mejlvang J, Olsvik H, Svenning S, et al. Starvation induces rapid degradation of selective autophagy receptors by endosomal microautophagy. J Cell Biol. 2018 Oct 1;217(10):3640–3655.
- Kristensen AR, Schandorff S, Hoyer-Hansen M, et al. Ordered organelle degradation during starvation-induced autophagy. Mol Cell Proteomics. 2008 Dec 7;(12):2419–2428. DOI:10.1074/mcp.M800184-MCP200
- Gretzmeier C, Eiselein S, Johnson GR, et al. Degradation of protein translation machinery by amino acid starvation-induced macroautophagy. Autophagy. 2017 Jun 3;13(6):1064–1075.
- He C, Klionsky DJ. Regulation mechanisms and signaling pathways of autophagy. Annu Rev Genet. 2009;43:67–93.
- Kroemer G, Marino G, Levine B. Autophagy and the integrated stress response. Mol Cell. 2010 Oct 22;40(2):280–293.
- Peng T, Golub TR, Sabatini DM. The immunosuppressant rapamycin mimics a starvation-like signal distinct from amino acid and glucose deprivation. Mol Cell Biol. 2002 Aug;22(15):5575–5584.
- Vander Heiden MG, DeBerardinis RJ. Understanding the intersections between metabolism and cancer biology. Cell. 2017 Feb 9;168(4):657–669.
- Gallipoli P, Giotopoulos G, Tzelepis K, et al. Glutaminolysis is a metabolic dependency in FLT3(ITD) acute myeloid leukemia unmasked by FLT3 tyrosine kinase inhibition. Blood. 2018 Apr 12;131(15):1639–1653.
- Liu J, Xia H, Kim M, et al. Beclin1 controls the levels of p53 by regulating the deubiquitination activity of USP10 and USP13. Cell. 2011 Sep 30;147(1):223–234.
- Vakifahmetoglu-Norberg H, Xia HG, Yuan J. Pharmacologic agents targeting autophagy. J Clin Invest. 2015 Jan;125(1):5–13.
- Niwa T, Ying BW, Saito K, et al. Bimodal protein solubility distribution revealed by an aggregation analysis of the entire ensemble of Escherichia coli proteins. Proc Natl Acad Sci U S A. 2009 Mar 17;106(11):4201–4206.
- Wang T, Tang H. The physical characteristics of human proteins in different biological functions. PLoS One. 2017;12(5):e0176234.
- Lee AS. Mammalian stress response: induction of the glucose-regulated protein family. Curr Opin Cell Biol. 1992 Apr;4(2):267–273. DOI:10.1016/0955-0674(92)90042-B
- Schneider JL, Suh Y, Cuervo AM. Deficient chaperone-mediated autophagy in liver leads to metabolic dysregulation. Cell Metab. 2014 Sep 2;20(3):417–432.
- Kirchner P, Bourdenx M, Madrigal-Matute J, et al. Proteome-wide analysis of chaperone-mediated autophagy targeting motifs. PLoS Biol. 2019 May;17(5):e3000301. .
- Dice JF. Peptide sequences that target cytosolic proteins for lysosomal proteolysis. Trends Biochem Sci. 1990 Aug;15(8):305–309.
- Mukherjee A, Patel B, Koga H, et al. Selective endosomal microautophagy is starvation-inducible in drosophila. Autophagy. 2016 Nov;12(11):1984–1999. .
- Kaushik S, Cuervo AM. The coming of age of chaperone-mediated autophagy. Nat Rev Mol Cell Biol. 2018 Apr 6;19(6):365–381.
- Sahu R, Kaushik S, Clement CC, et al. Microautophagy of cytosolic proteins by late endosomes. Dev Cell. 2011 Jan 18;20(1):131–139.
- Ritchie ME, Phipson B, Wu D, et al. limma powers differential expression analyses for RNA-sequencing and microarray studies. Nucleic Acids Res. 2015 Apr 20;43(7):e47.
- Yu G, He QY. ReactomePA: an R/Bioconductor package for reactome pathway analysis and visualization. Mol Biosyst. 2016 Feb;12(2):477–479.