
ABSTRACT
Alzheimer disease (AD) is the most prevalent neurodegenerative disorder leading to dementia in the elderly. Unfortunately, no cure for AD is available to date. Increasing evidence has proved the roles of misfolded protein aggregation due to impairment of the macroautophagy/autophagy-lysosomal pathway (ALP) in the pathogenesis of AD, and thus making TFEB (transcription factor EB), which orchestrates ALP, as a promising target for treating AD. As a complementary therapy, acupuncture or electroacupuncture (EA) has been commonly used for treating human diseases. Although the beneficial effects of acupuncture for AD have been primarily studied both pre-clinically and clinically, the real efficacy of acupuncture on AD remains inconclusive and the underlying mechanisms are largely unexplored. In this study, we demonstrated the cognitive-enhancing effect of three-needle EA (TNEA) in an animal model of AD with beta-amyloid (Aβ) pathology (5xFAD). TNEA reduced APP (amyloid beta (A4) precursor protein), C-terminal fragments (CTFs) of APP and Aβ load, and inhibited glial cell activation in the prefrontal cortex and hippocampus of 5xFAD. Mechanistically, TNEA activated TFEB via inhibiting the AKT-MAPK1-MTORC1 pathway, thus promoting ALP in the brains. Therefore, TNEA represents a promising acupuncture therapy for AD, via a novel mechanism involving TFEB activation.
Abbreviations Aβ: β-amyloid; AD: Alzheimer disease; AIF1/IBA1: allograft inflammatory factor 1; AKT1: thymoma viral proto-oncogene 1; ALP: autophagy-lysosomal pathway; APP: amyloid beta (A4) precursor protein; BACE1: beta-site APP cleaving enzyme 1; CQ: chloroquine; CTFs: C-terminal fragments; CTSD: cathepsin D; EA: electroacupuncture; FC: fear conditioning; GFAP: glial fibrillary acidic protein; HI: hippocampus; LAMP1: lysosomal-associated membrane protein 1; MAP1LC3B/LC3B: microtubule-associated protein 1 light chain 3 beta; MAPK1/ERK2: mitogen-activated protein kinase 1; MAPT: microtubule-associated protein tau; MTORC1: mechanistic target of rapamycin kinase complex 1; MWM: Morris water maze; NFT: neurofibrillary tangles; PFC: prefrontal cortex; PSEN1: presenilin 1; SQSTM1/p62: sequestosome 1; TFEB: transcription factor EB; TNEA: three-needle electroacupuncture
Introduction
Alzheimer disease (AD) is the most prevalent neurodegenerative disorder with clinical symptoms including memory loss and impaired cognition. At present, amyloid-β (Aβ) and MAPT/tau (microtubule-associated protein tau) proteins are still the most acknowledged pathological hallmarks of AD, which form the structures termed senile plaques (SPs) and neurofibrillary tangles (NFTs) in the brain [Citation1,Citation2]. Current drugs for AD can only relieve the symptoms. Tremendous efforts are being devoted to AD research, aiming to find new pathological mechanisms and develop disease-modifying drugs [Citation1,Citation2].
The autophagy-lysosomal pathway (ALP) is a cellular process for degrading misfolded, aggregated proteins and damaged organelles via lysosomes. ALP is a complicated mechanism regulated by multiple signaling pathways and factors, of which the TFEB (transcription factor EB) has been characterized as a master regulator [Citation3,Citation4]. Inactive TFEB locates in the cytoplasm, where it is phosphorylated by its negative regulators such as MTOR (mechanistic target of rapamycin kinase) complex 1 (MTORC1), MAPK1/ERK2 (mitogen-activated protein kinase 1), AKT (AKT serine/threonine kinase 1). Various stresses, such as starvation and lysosomal dysfunction, can dephosphorylate TFEB, thus promoting its nuclear translocation [Citation5]. In the nucleus, TFEB selectively binds to a specific promoter motif named CLEAR element rich in genes controlling autophagy and lysosomal biogenesis. By such, TFEB positively regulates the whole ALP process [Citation6]. An increasing number of studies have indicated the roles of TFEB and ALP impairment in the development of neurodegenerative diseases including AD [Citation7–9]. Therefore, targeting TFEB may represent a promising strategy for the prevention and treatment of AD.
Acupuncture and electroacupuncture (EA) have been commonly used as a complementary therapy by TCM practitioners in China for the treatment of various neurodegenerative disorders [Citation10]. For AD, several clinical studies have suggested that acupuncture may improve the cognitive function and other clinical status of AD patients without obvious side effects [Citation11,Citation12]. However, efficacy of acupuncture/EA in animal models of AD, and the underlying mechanisms remain largely unexplored [Citation13,Citation14]. “Three-needle Acupuncture for Intelligence” is a commonly practiced acupuncture therapy for cognition-related disorders in South China [Citation15]. Previously, we demonstrated the cognition-enhancing effects of three-needle electroacupuncture (TNEA) (at GV24 and bilateral GB13 acupoints) in a rat model of AD [Citation16]. In this study, we hypothesize that TNEA may inhibit Aβ pathology and thus attenuate cognitive impairment in AD by enhancing TFEB-mediated ALP, by using a better AD-associated animal model, the 5xFAD transgenic mice. Behaviorally, TNEA significantly improved the spatial learning and fear memory of 5xFAD mice. Molecularly, TNEA reduced amyloid precursor protein (APP), its C-terminal fragments (CTFs) and Aβ load, and inhibited glial cell activation in the prefrontal cortex (PFC) and hippocampus (HI) of 5xFAD. Meanwhile, TNEA significantly inhibited MTORC1, AKT and MAPK1 to activate TFEB, thus promoting ALP in the brains. In summary, we demonstrated, for the first time, that TNEA ameliorates Aβ pathology involving TFEB activation, which may be developed as a safe alternative therapy for AD.
Results
TNEA improved spatial learning memory and contextual fear memory in 5xFAD mice
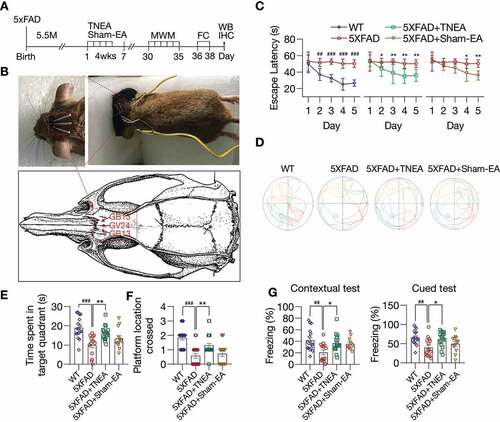
To determine the protective effects of TNEA in AD, 5.5-month-old male 5XFAD mice were treated with TNEA or Sham-EA for 4 weeks, then Morris water maze (MWM) and fear conditioning (FC) were used to evaluate spatial learning memory and contextual fear memory respectively (). In MWM, the escape latency was significantly increased in 5XFAD mice compared to wild-type (WT) from training day 2 to 5 (). TNEA treatment significantly reduced the escape latency in 5XFAD mice from training day 2 to 5 (). However, Sham-EA treatment showed only significant reduction of escape latency in training day 4 and 5 (). For probe trial, the time spent in the target quadrant and the number of platforms crossed was significantly increased for mice treated with TNEA, but not Sham-EA (D–F). We next applied the contextual FC (contextual test) and cued FC (cued test) to examine hippocampus-dependent associative learning and memory. In both contextual and cued test, the freezing time of 5XFAD mice significantly decreased compared with that of wild-type (WT) mice. However, TNEA, but not Sham-EA treatment significantly restored the freezing index in 5XFAD mice (). Together, these results indicate that TNEA ameliorates spatial learning memory and contextual fear memory in 5XFAD mice.
Figure 1. TNEA treatment improved spatial learning memory and contextual fear memory in 5XFAD mice. (A) Experimental procedures. EA: electroacupuncture; MWM: Morris water maze; FC: fear conditioning; WB: western blotting; IHC: immunohistochemistry. (B) EA treatment demonstrating the position of acupoints (GV24 and bilateral GB13), insertion of needles and connection to an electrical stimulator. (C-F) Morris water maze. (C) Representative moving patterns of mice in each group. (D) Quantification of escape latencies (mean ± SEM) in each group (male, n = 12–17). #p < 0.05, ##p < 0.01, ###p < 0.001 vs. wild-type (WT); *p < 0.05, **p < 0.01 vs. 5XFAD; 2-way ANOVA with Bonferroni multiple comparison test. (E) Quantification of times spent in the target quadrant (mean ± SEM, male, n = 12–17) during the probe trial. (F) Quantification of number of platform crossed (mean ± SEM, male, n = 12–17) during probe trial. ###p < 0.001 vs. WT, **p < 0.01 vs. 5XFAD analyzed by one‐way ANOVA. (G) Fear conditioning. The percentage of freezing in contextual and cued test was quantified (mean ± SEM, male, n = 12–17). ##p < 0.01 vs. WT, *p < 0.05 vs. 5XFAD analyzed by one-way ANOVA
TNEA promoted the degradation of APP/Aβ and inhibits microglia activation in 5xFAD mice brains
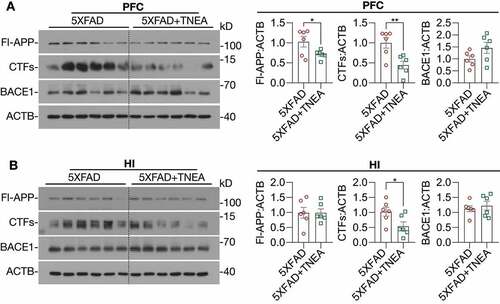
After confirming the cognitive-enhancing effects of TNEA in 5xFAD mice, we hypothesized that these improvements may be contributed by the reduction of APP/Aβ pathology induced by TNEA. The overexpression of full-length (Fl)-APP and CTFs in the PFC and HI of 5xFAD mice, compared with that of the WT mice, was confirmed by western blots (Fig. S1). For sham-EA group, no significant reduction of Fl-APP was observed in the PFC and HI (Fig. S2) of 5xFAD mice treated with sham-EA, which was consistent with the results showing no memory improvement in 5xFAD mice treated with sham-EA (E-G). In contrast, we found that TNEA treatment significantly reduced the levels of Fl-APP and CTFs in the PFC () and HI (). Notably, TNEA did not affect the expression of BACE1 (beta-site APP cleaving enzyme 1) in the PFC () and HI (), indicating that TNEA may promote the lysosomal degradation of APP and CTFs, without affecting the amyloidogenic processing of APP.
Figure 2. TNEA treatment promoted the degradation of beta-amyloid precursor protein (APP) fragments in 5XFAD mice brains. Representative western blots showed the levels of full-length APP (Fl-APP), carboxy-terminal fragments (CTFs) and BACE1/β-secretase 1 in the prefrontal cortex (PFC) (A) and hippocampus (HI) (B) of mice brains. Data were quantified as mean ± SEM (male, n = 6). *p < 0.05, **p < 0.01 vs. 5XFAD group analyzed by Unpaired t test
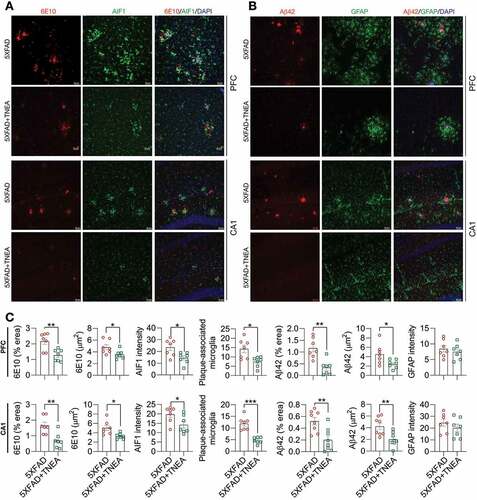
Neuroinflammation, which is mainly characterized by the activation of microglia and astrocytes, has been recognized as a common pathological feature of AD [Citation17]. Aβ oligomers and fibrils have been shown to activate microglia and astrocytes in animal models of AD [Citation18,Citation19]. Therefore, we determined whether TNEA reduces Aβ load and inhibits the accompanying neuroinflammation in 5XFAD mice. We co-stained Aβ with AIF1/IBA1 (allograft inflammatory factor 1; a microglia marker) or GFAP (glial fibrillary acidic protein; an astrocyte marker) in the PFC and hippocampal CA1 respectively to determine whether TNEA reduces Aβ load and inhibits glial activation. The results demonstrate that TNEA significantly reduced the Aβ positive area and plaque size (stained by 6E10 antibody and an Aβ1-42-specific antibody, respectively) in PFC and CA1 regions (, A and B). Meanwhile, both the total and Aβ-associated AIF1 intensity was significantly decreased in PFC and CA1 regions of 5xFAD mice treated with TNEA (). However, no significant changes in GFAP intensity were found in PFC and CA1 regions of 5xFAD mice treated with TNEA (). Together, these results indicate that TNEA treatment promotes the degradation of APP, CTFs and Aβ, and inhibits microglia activation in 5xFAD mice brains.
Figure 3. TNEA treatment reduced Aβ load and inhibits microglia activation in 5XFAD mice brains. (A) Representative immunohistochemistry images of AIF1/IBA1 (green), Aβ (6E10, red) and DAPI (blue) in prefrontal cortex (PFC) and hippocampal CA1 of 7-month-old 5XFAD mice after EA treatment (scale bar: 50 μm). (B) Representative immunohistochemistry images of GFAP (green), Aβ1-42 (red) and DAPI (blue) in PFC and hippocampal CA1 of 7-month-old 5XFAD mice after EA (scale bar: 50 μm). (C) Aβ area, Aβ size, AIF1/IBA1 intensity, plaque associated microglia and GFAP intensity in PFC and CA1 were quantified as mean ± SEM (male, n = 7–8). *p < 0.05, **p < 0 .01 and ***p < 0.001 vs. 5XFAD group analyzed by Unpaired t test
TNEA activated TFEB and promoted lysosomal biogenesis in 5xFAD mice brains
Impaired autophagy flux due to sustained induction of autophagy but defective lysosomal clearance has been demonstrated in postmortem brain tissues from AD patients [Citation20] and in 5xFAD mice brains [Citation21]. On the other hand, APP, CTFs and Aβ were reported to be efficiently degraded by TFEB-mediated ALP [Citation22,Citation23]. Therefore, we wondered if the degradation of APP, CTFs and Aβ in 5xFAD mice induced by TNEA involves TFEB activation and ALP enhancement, by determining the levels of total, cytosolic/nuclear and phosphorylated TFEB, and TFEB-targeting ALP markers including MAP1LC3B/LC3B, SQSTM1/p62 (sequestosome 1), CTSD (cathepsin D) and LAMP1 (lysosomal-associated membrane protein 1).
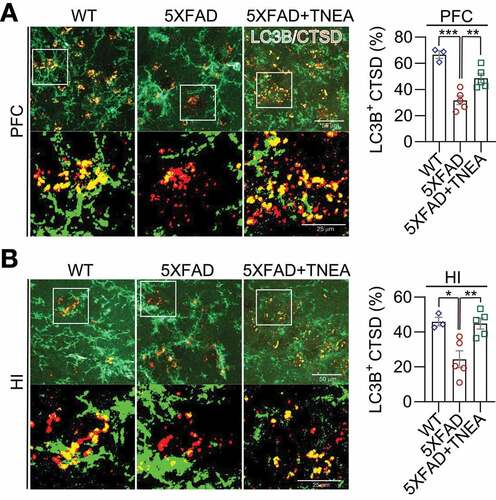
LC3B is the most widely used marker for autophagy assays [Citation6]. The conversion of LC3B-I to lipidated LC3B-II can indicate the formation of autophagosomes (APs). After lipidation, LC3B-II is degraded by lysosomal hydrolases [Citation24]. In addition, the level of insoluble SQSTM1 aggregates is widely used as an index of autophagic degradation [Citation6]. To determine the effects of TNEA on autophagy markers, the levels of LC3B and SQSTM1 were determined in Triton X-100 (TX-100)-soluble and -insoluble (SDS soluble) lysates from PFC and HI tissues separately, according to the guidelines [Citation6]. The results showed no significant change in the levels of LC3B-II and SQSTM1 in the TX-100 soluble fractions between 5XFAD and 5XFAD+TNEA group and B). However, both LC3B-II and SQSTM1 were significantly reduced in the TX-100-insoluble fractions in 5XFAD+TNEA group ( and C). To determine the effects of TNEA on autophagy flux, 5XFAD mice were co-treated with/without chloroquine (CQ) to block lysosomes and then treated with TNEA. Compared to the CQ alone group, TNEA+CQ group did not further increase the levels of LC3B-II in the TX-100 soluble fractions in the PFC and HI of 5XFAD mice ( and B). However, TNEA treatment failed to degrade the insoluble LC3B-II and SQSTM1 in the PFC and HI of 5XFAD mice co-treated with CQ ( and D). To further confirm whether TNEA promotes the formation of autolysosomes (ALs), we determined the colocalization of LC3B and CTSD in the PFC and HI regions of WT, 5XFAD and 5XFAD+TNEA groups. The percentage of ALs and lysosomes alone can be quantified as the area of CTSD which is positive and negative for LC3B (LC3B+ and LC3B−) respectively [Citation20]. As shown in , the area of LC3B+ CTSD was significantly decreased in the PFC () and HI () of 5XFAD mice compared to that of age-matched WT mice, and restored by TNEA treatment. The results indicate that the conversion of APs to ALs is impaired in 5XFAD mice brains, which can be restored by TNEA treatment.
Figure 4. TNEA treatment increased TFEB expression and activated autophagy-lysosomal pathway in 5XFAD mice brains. (A) Representative western blots showed the levels of autophagy markers (LC3B and SQSTM1) in the TX-100 soluble and insoluble fractions from the prefrontal cortex (PFC) and hippocampus (HI) of mice brains. (B, C) Data were quantified as mean ± SEM (male, n = 6). *p < 0.05, **p < 0.01 and ***p < 0.001 vs. 5XFAD group analyzed by Unpaired t test. (D) Representative western blots showed the levels of TFEB and lysosome markers (LAMP1 and CTSD) in the PFC and HI of mice brains. (E) Data were quantified as mean ± SEM (male, n = 6). *p < 0.05 and **p < 0.01 vs. 5XFAD group analyzed by Unpaired t test
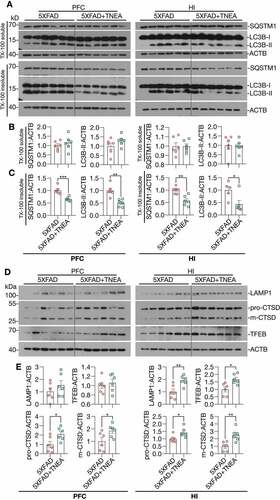
Figure 5. TNEA-induced autophagy-lysosomal pathway in 5XFAD mice brains was blocked by chloroquine. 5XFAD mice were intraperitoneally injected with vehicle (PBS) or chloroquine (CQ, 50 mg/kg/day) 4 days before the last TNEA treatment. (A, C) Representative western blots showed the levels of autophagy markers (LC3B and SQSTM1 in the SDS soluble (A) and insoluble fractions (C) in the prefrontal cortex (PFC) and hippocampus (HI) of mice brains. SE, short exposure; LE, long exposure. (B, D) Data were quantified as mean ± SEM (male, n = 6) and analyzed by Unpaired t test. No statistical significance (p > 0.05) vs. CQ alone group. (E) Representative western blots showed the levels of LAMP1 in the HI and PFC of 5XFAD mice treated with/without CQ. (F) Data were quantified as mean ± SEM (male, n = 6) and analyzed by Unpaired t test. *p < 0.05 and ***p < 0.001 vs. TNEA group
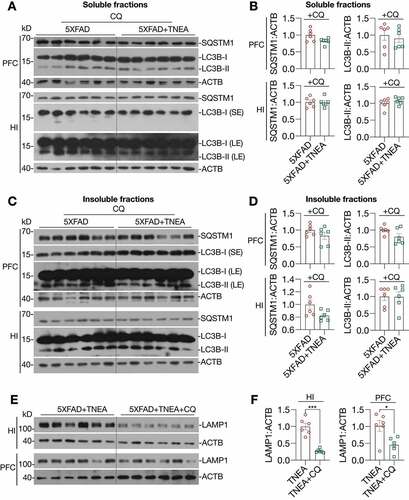
Figure 6. TNEA treatment promoted the formation of autolysosomes in 5XFAD mice brains. Representative fluorescent images of LC3B (green) and CTSD (red) in the prefrontal cortex (PFC) (A) and hippocampal (HI) CA1 (B) of mice from wild-type (WT), 5XFAD and 5XFAD+TNEA groups. Original magnification: 60×, scale bar: 50 μm. Corresponding zoom-in images (scale bar: 25 μm) were processed using ImageJ to demonstrate the colocalization. The area of LC3B-positive CTSD was quantified as mean ± SEM (male, n = 3 to 5) and analyzed by one‐way ANOVA. *p < 0.05, **p < 0 .01 and ***p < 0.001 vs. 5XFAD group
For lysosomal markers, we found that TNEA treatment increased the levels of the pro- and mature forms of CTSD and LAMP1 in the HI of 5xFAD mice ( and E). Similar changes of lysosomal markers in the PFC were found by TNEA treatment, except for LAMP1 which showed an increasing trend, but not statistically significant due to big variations ( and E). However, TNEA-induced increase in LAMP1 was significantly blocked in the HI and PFC of 5xFAD mice co-treated with CQ and F). Together, these data indicate that TNEA treatment may not affect the induction of autophagy, but mainly promoting lysosomal biogenesis for degrading insoluble SQSTM1 and APP/Aβ.
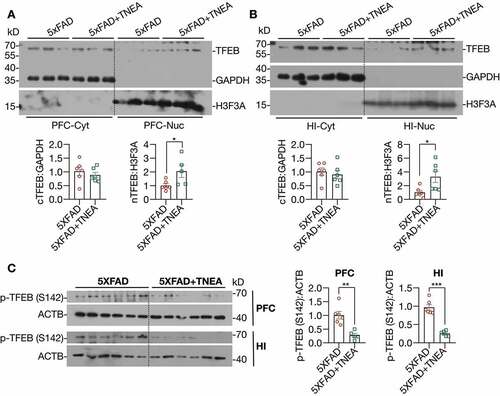
Next, we determined whether TNEA promotes lysosomal biogenesis by activating TFEB. Firstly, we found that TNEA treatment significantly increased the levels of total TFEB in the HI of 5xFAD mice ( and E). The activation of TFEB is controlled by a series of kinases and phosphatases, which phosphorylate or dephosphorylate TFEB to control its cellular localization [Citation5]. To determine whether TNEA activates TFEB in 5xFAD mice brains, we determined the cytosolic/nuclear levels of TFEB. The results show that TNEA treatment indeed significantly increased the levels of nuclear TFEB, without affecting its cytosolic levels, in the PFC (, Fig. S3) and HI of 5xFAD mice (, Fig. S3). Furthermore, the phosphorylation of TFEB at serine 142 (S142), a key phosphorylation site controlled by MTORC1 and MAPK1 [Citation5], was significantly reduced by TNEA treatment (). All these data suggest that TNEA treatment activates TFEB to promote lysosomal biogenesis in 5xFAD mice brains.
Figure 7. TNEA treatment promoted the dephosphorylation and nuclear translocation of TFEB in 5XFAD mice brains. (A, B) Representative western blots and quantification showed the levels of the cytosolic (Cyt) and nuclear (Nuc) TFEB in the prefrontal cortex (PFC) and hippocampus (HI) of mice brains. GAPDH and H3F3A were used as cytosolic and nuclear loading controls respectively. Data were quantified as mean ± SEM (male, n = 6). *p < 0.05, vs. 5XFAD group analyzed by Unpaired t test. Another batch of blots was shown in Figure S2. (C) Representative western blots and quantification showed the levels of phosphorylated (p-) TFEB (S142) in the PFC and HI of mice brains. Data were quantified as mean ± SEM (male, n = 6). **p < 0.01 and ***p < 0.001 vs. 5XFAD group analyzed by unpaired t test
TFEB-induced lysosomal activation was required for memory improvement and APP/Aβ degradation induced by TNEA
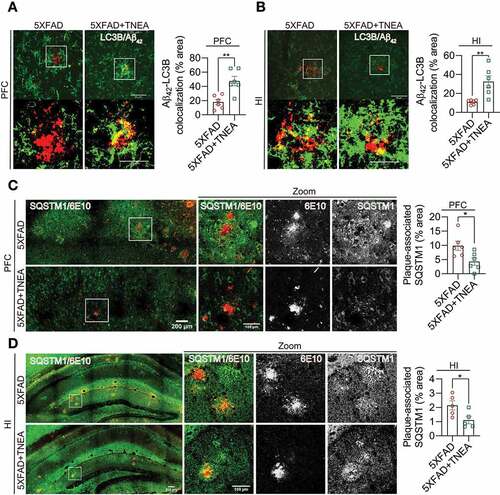
To delineate whether TNEA-induced APP/Aβ degradation is associated with ALP, the colocalization of APP/Aβ with ALP markers (LC3B, SQSTM1 and LAMP1) were determined in the PFC and HI regions of 5XFAD mice treated with/without TNEA. For autophagy markers, we found that LC3B accumulated around Aβ1-42, but showed low colocalization with Aβ1-42 in the PFC () and HI () regions of 5XFAD mice. In contrast, TNEA treatment significantly reduced the area of Aβ plaques and increased the colocalization of LC3B with remaining Aβ1-42 ( and B). Meanwhile, we found that SQSTM1 formed large puncta and aggregates, and colocalized with APP (stained by 6E10) in PFC () and HI () of 5XFAD mice. TNEA treatment significantly reduced the area of APP and decreased APP-associated SQSTM1 ( and D). These results indicate that TNEA treatment restored the defective autophagy cargos/substrates recognition by LC3B-positive APs and enhanced their degradation in 5XFAD mice brains.
Figure 8. TNEA treatment restored the defective recognition and degradation of autophagy substrates in 5XFAD mice brains. (A, B) Representative fluorescent images of LC3B (green) and Aβ42 (red) in prefrontal cortex (PFC) (A) and hippocampal (HI) CA1 (B) of mice from 5XFAD and 5XFAD+TNEA groups. Original magnification: 60×, scale bar: 50 μm. Corresponding zoom-in images (scale bar: 25 μm) were processed using ImageJ to demonstrate the colocalization. The area of LC3B and Aβ42 colocalization was quantified as mean ± SEM (male, n = 6) and analyzed by unpaired t test. **p < 0 .01 vs. 5XFAD group. (C, D) Representative fluorescence images of SQSTM1 (green) and APP/Aβ (6E10, red) in PFC (C) and CA1 (D) of mice from 5XFAD and 5XFAD+TNEA groups. Original magnification: 20×, scale bar: 200 μm. Corresponding zoom-in images (scale bar: 100 μm) were processed using ImageJ to demonstrate the colocalization. The area of plaque-associated SQSTM1 was quantified as mean ± SEM (male, n = 5 to 6) and analyzed by unpaired t test. *p < 0 .05 vs. 5XFAD group
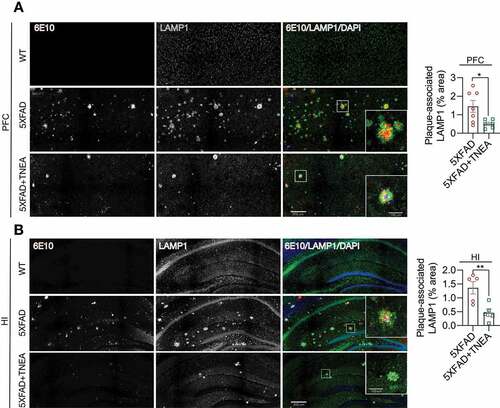
The colocalization of APP/Aβ with LAMP1 in the brains of 5XFAD mice [Citation25,Citation26] and postmortem AD patients [Citation27] has been considered as a key feature of dystrophic neurites which accumulate defective lysosomes. In our study, diffused LAMP1 staining in PFC and HI was observed in WT mice (). In comparison, LAMP1 accumulated around and colocalized with APP (stained by 6E10) in PFC and HI of 5XFAD mice (), which was consistent with previous findings [Citation25,Citation26]. TNEA treatment significantly reduced the area of 6E10-positive plaques, accompanied with reduced area of plaque-associated LAMP1 ( and B). Together with the results showing that TNEA increased the total levels of LAMP1 in the brains of 5XFAD mice ( and E), it is reasonable to speculate that TNEA promotes the synthesis of new lysosomes but reduces defective plaque-associated lysosomes in 5XFAD mice brains.
Figure 9. TNEA treatment reduced Aβ plaque-associated LAMP1 in 5XFAD mice brains. Representative fluorescent images of LAMP1 (green), APP/Aβ (6E10, red) and DAPI (blue) in the prefrontal cortex (PFC) (A) and hippocampal (HI) CA1 (B) of mice from WT, 5XFAD and 5XFAD+TNEA groups. Original magnification: 20×, scale bar: 200 μm. Corresponding zoom-in images (scale bar: 100 μm) were processed using ImageJ to demonstrate the colocalization. The area of plaque-associated LAMP1 was quantified as mean ± SEM (male, n = 5 to 6) and analyzed by unpaired t test. *p < 0 .05 and **p < 0.01 vs. 5XFAD group
Next, we determined whether lysosomal activity is required for APP/Aβ degradation and memory improvement induced by TNEA. We found that the reduction of Fl-APP by TNEA treatment was completely blocked in PFC of 5XFAD mice co-treated with the lysosomal inhibitor CQ ( and B). Meanwhile, the improved spatial learning memory () and fear memory () induced by TNEA was also blocked in 5XFAD mice co-treated with CQ.
Figure 10. TFEB-induced lysosomal activation was required for memory improvement and APP/CTFs degradation induced by TNEA in 5XFAD mice. (A) Representative western blots showed the levels of full-length APP (Fl-APP) in the hippocampus of mice brains. (B) Data were quantified as mean ± SEM (n = 4) and analyzed by one-way ANOVA. **p < 0.01 and ***p < 0.001 vs. 5XFAD +TNEA group. (C) Morris water maze. Quantification of times spent in the target quadrant and number of platform crossed (mean ± SEM, n = 8–11) during probe trial. *p < 0.05 and **p < 0 .01 vs. 5XFAD+TNEA group analyzed by one‐way ANOVA. (D) Fear conditioning. The percentage of freezing in contextual and cued test was quantified (mean ± SEM, n = 8–11). *p < 0.05, **p < 0.01 and ***p < 0.001 vs. 5XFAD+TNEA group analyzed by one‐way ANOVA. (E) Representative western blots showed the levels of full-length APP and carboxy-terminal fragments (CTFs) in the hippocampus of mice brains. (F) Relative levels of CTFs were quantified as mean ± SEM (male, n = 3). (G) Morris water maze. Quantification of number of platform crossed (mean ± SEM, n = 4–6) during probe trial. *p < 0.05 vs. sh-Scramble +TNEA group analyzed by one-way ANOVA

Finally, we determined the specific roles of TFEB in TNEA-induced APP/Aβ degradation and memory improvement. For this, AAV-sh-Scramble and AAV-sh-Tfeb were bilaterally injected in to the hippocampal CA1 regions. Intense GFP signals were observed in the hippocampus, confirming the efficient delivery of shRNAs (Fig. S4A). However, we found that hippocampal injection of AAV-sh-Tfeb, but not the AAV-sh-Scramble caused high mortality rates in mice (Fig. S4B). The knockdown of TFEB in the hippocampus from surviving mice was confirmed by western blots (Fig. S4C). Notably, TNEA treatment significantly reduced the level of CTFs in the hippocampus of 5XFAD mice injected with AAV-sh-Scramble, but not of mice injected with AAV-sh-Tfeb ( and F). Meanwhile, the improved spatial learning memory induced by TNEA was also blocked in mice injected with AAV-sh-Tfeb (). These results indicate that TFEB is indeed required for TNEA-induced degradation of CTFs and memory improvement.
TNEA inhibited the upstream kinases of TFEB in 5xFAD mice brains
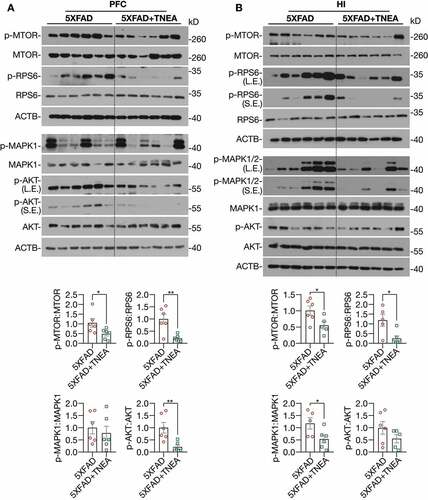
At last, to address how TFEB is activated by TNEA treatment in 5XFAD mice brains, we determined the upstream kinases of TFEB including MTORC1, MAPK1, and AKT. Interestingly, we found that the phosphorylation of MTOR and its substrate ribosomal protein S6 (RPS6) were significantly reduced in both the PFC () and HI () of 5XFAD mice treated with TNEA, indicating that TNEA inhibits MTORC1 activity in both regions. However, the effects of TNEA on MAPK1 and AKT phosphorylation were different in PFC and HI. The phosphorylation of AKT was significantly decreased in PFC, but not in HI (); while the phosphorylation of MAPK1 was significantly decreased in HI, but not in PFC by TNEA treatment (). Together, the results indicate that TNEA may regulate multiple upstream kinases to activate TFEB in 5XFAD mice brains.
Figure 11. TNEA treatment inhibited MTORC1, AKT and MAPK1 in 5XFAD mice brains. Representative western blots and quantification showed the levels of phosphorylated (p-) and total MTOR, RPS6, AKT and MAPK1 in the prefrontal cortex (PFC) (A) and hippocampus (HI) (B) of mice brains. Data were quantified as mean ± SEM (male, n = 6). *p < 0.05 and **p < 0.01 vs. 5XFAD group respectively analyzed by unpaired t test
Discussion
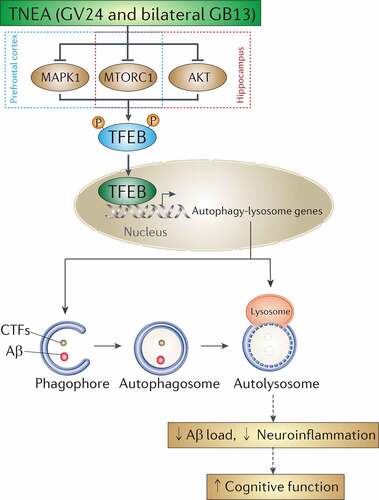
Dysfunction of the TFEB-mediated autophagy-lysosomal pathway plays important roles in the pathogenesis of neurodegenerative disorders [Citation9]. Particularly for AD, the levels of nuclear TFEB were reportedly reduced in the hippocampus of AD patients [Citation28], and a significant decrease in the expression of TFEB and its target lysosomal genes and proteins, including CTSB, CTSD and CTSS was observed in monocytes and lymphocytes from AD patients when compared with those from age-matched healthy controls [Citation29]. The imbalance between sustained induction of autophagy and defective lysosomal clearance, which causes the impeded autophagy flux, may explain the robust autophagic pathology and neuritic dystrophy in AD [Citation20]. Increasing studies have proved that overexpression of TFEB and small-molecule TFEB activators can attenuate APP/Aβ and MAPT/Tau pathology in AD animal models [Citation22,Citation23,Citation30–34], thus proposing TFEB as a promising drug target for AD. In this study, we demonstrated TNEA, a non-pharmacological therapy using electroacupuncture, also can ameliorate APP/Aβ pathology and improve memory in an AD animal model. Importantly, we revealed for the first time a novel mechanism of TNEA for treating AD involving the activation of TFEB (). TNEA treatment inhibits several kinases including MTORC1, MAPK1 and AKT. Reduced activity of these kinases correlates with increased TFEB nuclear translocation in the PFC and HI. Activated TFEB transcriptionally upregulates the ALP to degrade APP, CTFs and Aβ, thus inhibiting Aβ-induced neuroinflammation and cognitive impairment ().
Figure 12. A mechanistic model showed that TNEA attenuates cognitive impairment in AD involving the activation of TFEB. EA (GV24 and bilateral GB13) treatment inhibits MTORC1 and MAPK1 in the prefrontal cortex, and inhibits MTORC1 and AKT in the hippocampus respectively, thus promoting the dephosphorylation and nuclear translocation and of TFEB to transcriptionally upregulate the autophagy-lysosomal pathway, which is essential for the degradation of Aβ and carboxy-terminal fragments (CTFs)
TNEA is a new therapy combining the clinical practice of “Three-needle Acupuncture for Intelligence” [Citation15] and the advantage of electroacupuncture. Previously we showed that TNEA improved learning and memory in a rat model of AD injected with Aβ1-40 and D-galactose, probably via altering cerebral glucose metabolism [Citation16]. In this study we further confirmed the cognitive-enhancing effects of TNEA using 5xFAD mice, which models the AD-associated Aβ pathology. For the selection of Sham-EA, we used the same acupoints but with shallow insertion and no electrical stimulation. The negative results of the Sham-EA on memory improvement () and APP degradation (Fig. S2) indicate that the effects are actually triggered by the real EA treatment. We then demonstrated that TNEA treatment promoted the degradation of APP, CTFs and Aβ, accompanied with reduced microglia activation in 5xFAD mice brains (). One explanation could be that TNEA promotes the degradation Aβ, thus inhibiting Aβ-induced microglia activation. However, further studies are warranted to examine whether TNEA inhibit microglia activation and neuroinflammation by other mechanisms independently of TFEB-mediated autophagic degradation of Aβ.
In the PFC and HI of 5XFAD mice, we found that large puncta of LC3B (), SQSTM1 () and LAMP1 () accumulated around or colocalized with APP/Aβ plaques, which may reflect the defects in autophagy cargo recognition, delivery to lysosomes and lysosomal activity as reported previously [Citation20,Citation25,Citation26]. The reduced number of ALs in 5XFAD mice compared to that of WT mice further indicates the impaired autophagy flux in 5XFAD mice (). In contrast, TNEA treatment promoted the degradation of APP/Aβ-associated SQSTM1, restored the number of ALs and reduced plaques-associated LAMP1. Notably, TNEA did not significantly affect the induction of autophagy (), but mainly promoted the formation of ALs () and lysosomal biogenesis (). Inhibition of lysosomes by CQ treatment blocked TNEA-induced increase in CTSD and LAMP1 (), degradation of APP () and memory improvement (). Considering the excessive induction of autophagy but defective lysosomal clearance in AD [Citation20], a reasonable explanation for our results could be that TNEA-induced TFEB activation mainly promotes lysosomal biogenesis and activity to enhance degradation, but not the induction of autophagy. Importantly, we showed that
TFEB is required for memory improvement and APP/Aβ degradation induced by TNEA (). The mechanism of TFEB activation induced by TNEA is most likely mediated by inhibiting its upstream kinases including MTORC1, MAPK1, and AKT. However, it is necessary to overexpress the active forms of these kinases in target brain regions in future experiments to validate this possibility. Furthermore, it is also important to examine whether TNEA also activates TFE3, another transcription factor sharing similar functions as TFEB [Citation35]. Finally, more in-depth studies should be designed to delineate whether different acupoints (GV24 and bilateral GB13 in our case) act synergically or specifically on TFEB and TFE3 to exert neuroprotective effects in AD.
In summary, we developed a novel TNEA therapy which activates TFEB-mediated lysosomal biogenesis to attenuate Aβ pathology and improve memory in an AD animal model. Compared to small-molecule pharmacological activators of TFEB, TNEA-induced TFEB activation may be advantageous by avoiding their undesired side effects, thus representing an alternative safe therapy for AD.
Materials and methods
Reagents and antibodies
Chloroquine (C6628), anti-SQSTM1/p62 (P0067) and anti-phospho-TFEB (Ser142; ABE1971) were purchased from Sigma-Aldrich. Anti-H3F3A/histone H3 (D1H2; 4499), anti-PSEN1 (5643), anti-phospho-MTOR (Ser2448; 2971), anti-MTOR (2983), anti-phospho-AKT (S473), anti-AKT (9272), and anti-phospho-RPS6KB1/p70S6K (Thr389; 9234) antibodies were purchased from Cell Signaling Technology. Anti-TUBB/β-tubulin (H-235; sc-9104), anti-GAPDH (G-9; sc-365,062), and anti-ACTB/β-actin (sc-47,778) were purchased from Santa Cruz Biotechnology. Anti-LC3B (NB100-2220; used for WB) antibody was purchased from Novus Biologicals. Anti-LC3B (M152-3; used for IHC) was purchased from MBL International. Anti-TFEB (A303-673A) was purchased from Bethyl Laboratories. Anti-GFAP (NBP1-05197), Anti-APP (51–2700), Alexa Fluor® 488 goat anti-mouse IgG (A-11,001), and Alexa Fluor® 594 goat anti-rabbit IgG (A-11,012) were purchased from Thermo Fisher Scientific. Anti-β-amyloid (6E10; 803,017) was purchased from Biolegend. Anti-β-amyloid 1–42 (AB5078P) was purchased from Millipore. Anti-AIF1/IBA1 (019–19,741) was purchase from Wako. Anti-BACE1 (ab108394), anti-CTSD (ab75852) and anti-LAMP1 (ab24170) antibodies were purchased from Abcam. HRP-conjugated goat anti-mouse (115–035-003) and goat anti-rabbit (111–035-003) secondary antibodies were purchased from Jackson ImmunoResearch.
Animals
Male 5xFAD mice (Jackson Laboratory, 008730) were obtained from Shenzhen Center for Disease Control and Prevention (Shenzhen, China) and maintained at 23 ± 2°C and 60 ± 15% relative humidity with free access to feed and water. 5xFAD male mice were inbred with wild-type (WT, C57/BL6) female mice to produce heterozygous offspring. Offspring were genotyped to select mice with gene mutations (App KM670/671NL [Swedish], App I716V [Florida], App V717I [London], Psen1 M146L [A > C], Psen1 L286V). All animal care and experimental procedures were approved by Animals Care and Use Committee of Guangzhou University of Traditional Chinese Medicine.
Electroacupuncture (EA) and chloroquine treatment
For EA stimulation, 5.5-month-old 5XFAD mice were to EA treatment at GV24 and bilateral GB13 acupoints according to the protocols described in our previous study [Citation16]. GV24 is located 1.3 mm directly above the midpoint of the mouse’s eyes, while GB13 is located 2 mm lateral to GV24, both of which are in the scalp of the frontal pole. Mice were anesthetized with 2% of isoflurane (RWD Life Science, R510-22) and positioned on a stereotaxic frame (RWD Life Science, 71,000). The skin around the acupoints was cleaned with alcohol swabs, and stainless steel needles (diameter 0.16 mm, length 1.7 cm) were inserted into GV24 and bilateral GB13 acupoints, at a depth of 10 mm. Needle handles were connected to an electrical stimulator (Master8, AMPI, Israel) and electrical stimulation pulses were applied for 15 min (0.3 mA, 2 Hz). EA treatment was performed 5 times per week for 4 weeks. For Sham-EA, the needles were inserted into the skin at the surface of the acupoints (GV24 and bilateral GB13) and no electrical stimulation was performed. For chloroquine (CQ) treatment, 5XFAD mice were intraperitoneally injected with vehicle (PBS; Beyotime Biotechnology, ST447) or CQ (50 mg/kg/day) 4 days before the last TNEA treatment and then subjected to behavior tests and biochemical analysis.
AAV-sh-Tfeb hippocampal injection
The mouse Tfeb shRNA sequence (CCGGCGGCAGTACTATGACTATGAT -CTCGAGATCATAGTCATAGTACTGCCGTTTTTG) is synthesized according to our previous study [Citation30]. The non-fused viral constructs AAV-U6-shRNA(Scramble)-CMV-EGFP-SV40pA (4.16E+12vg/ml) and AAV-U6-shRNA(Tfeb)-CMV-EGFP-SV40pA (2.13E+12vg/ml) were prepared by BrainVTA (Wuhan) Co., Ltd. (Wuhan, China). 5XFAD mice (8-month-old, male, n = 40) were anesthetized using isoflurane (3–5% for induction and 1% for maintenance) in 100% oxygen (500 ml/min). The viral constructs were bilaterally injected into hippocampal CA1 regions with the stereotactic coordinates of −2.06 mm anteroposterior, ±1.50 mm mediolateral to the bregma, and 1.4 mm below the dura [Citation36]. In pilot experiments, we found that hippocampal injection of AAV-sh-Tfeb, but not the AAV-sh-Scramble caused high mortality rates in the mice. Then the optimal viral volume of AAV-sh-Tfeb (with efficient TFEB KD and minimum mortality) for each mouse was set to 2 µL. The stereotactic injection was performed using a 23-mm glass micropipette (OD 1.14 mm, ID 0.53 mm, with manual needle tip) attached to a 4.2-µL Drummond syringe (Drummond Scientific Company, 3–000-207). The injection rate was 4 nL/s. To prevent backflow after injection, the micropipette was retained in situ for 5 min and then withdrawn slowly from the brain. The injection of AAV-sh-Tfeb (or Scramble) was performed 2 weeks before TNEA treatment, followed by behavior tests and biochemical analysis.
Morris water maze
Morris water maze (MWM) was used to measure the hippocampus-dependent spatial memory, as described before [Citation37]. All behavioral tests were performed during an active period of animals’ light cycle (07:00–19:00). Video analysis system (Shanghai Jiliang Software Technology Co., Ltd., Shanghai, China) was used to observe and record the swimming pattern of each mouse. The pool was filled with water (21 ± 1°C). An escape platform (4.5 cm in diameter) was placed in the pool and the top of the platform was 1.5 cm below the water surface. Mice were trained for 5 days with 4 trials/day (60 s/trial, 30 min inter-trial intervals). If the animal could not find the platform within 60 s, they were placed on the platform for 10 s. After 5 days of training, the hidden platform in the target quadrant was removed. On the sixth day, a probe test was administered. During the probe test, the platform was removed from the pool, and the mouse was allowed to swim freely for 1 min.
Fear conditioning
Fear conditioning was conducted to assess the fear memory reconsolidation of 5xFAD mice after treatment according to the original protocol [Citation38,Citation39]. On the first day, mice were allowed to habituate the platform for 193 s followed by three repeated footshock cycles (30 s) at 30 s intervals, each starting with a cue tone (28 s, 2000 Hz, 80 dB) and ending with a foot shock (1.0 mA, 2 s). On the second day, mice were placed into novel environment to explore for 3 min by a cue tone (3 min, 2000 Hz, 80 dB). After 2 h of cue test, subjects are returned to the training context but experience no tones or shocks. The percentage of freezing during a specified time is reported.
Immunohistochemistry
Anesthetized mice were perfused with 70 ml of ice-cold PBS followed by 20 ml of 4% paraformaldehyde (PFA) in PBS and tissues were fixed in 4% PFA at 4°C for overnight. Frozen brain blocks were cut into 40-μm-thick sections on a microtome (HM 525, Leica Biosystems). Sections were permeabilized with 0.3% Triton X-100 (Beyotime Biotech., ST795) and 5% donkey serum (Jackson ImmunoResearch Inc., 102,974) in PBS and incubated with primary antibodies at 4°C overnight. After washing with PBS 3 times, samples were incubated with Alexa Fluor-conjugated secondary antibodies (1:1500, Thermo Fisher Scientific, A11008, A11012, A11001 and A11005) for 1.5 h at room temperature. After nuclear staining with DAPI, the slices were mounted and visualized using a Nikon A1R confocal microscope equipped with NIS-Elements Viewer 4.50 (Nikon Instruments Inc.). Fluorescence images were processed using Adobe Photoshop CS (San Jose, CA, USA), analyzed and quantified using ImageJ (NIH, USA).
Tissue extraction and western blot analysis
Hippocampus (HI) and prefrontal cortex (PFC) were dissected and homogenized in RIPA buffer (1% Trion X-100, 1% sodium deoxycholate [Diamond, A100613-0010], 0.1% SDS) containing protease and phosphatase protease inhibitor mixture [Thermo Fisher Scientific, A32957 and A32955]. Soluble proteins were extracted in Triton buffer (1% Trion X-100, 1% sodium deoxycholate) and insoluble proteins were extracted in SDS buffer (1% sodium deoxycholate, 1% SDS) according to a previous protocol [Citation34]. Lysates were incubated on ice for 30 min and centrifuged at 25,155 x g for 30 min. Then, lysates were estimated for protein concentration (BCA assay; Beyotime Biotechnology, P0009). Equal amounts of protein were resolved on 8–15% SDS-polyacrylamide gels, and transferred onto PVDF membranes (GE Amersham, 10,600,023). The membranes were blocked with 5% nonfat milk, incubated overnight with primary antibodies and then with the respective secondary antibodies for 2 h at room temperature. Signal intensities were detected by using ECL kits (Thermo Fisher Scientific, 32,106 and 34,580) and quantified using ImageJ software.
Statistical Analysis
All data were expressed as mean ± SEM. All statistical analysis was performed using GraphPad Prism 8.0.1. Two-way ANOVA was used in behavioral analysis by Bonferroni post hoc test. Data from two groups were analyzed by Unpaired t test, and data from three or more groups were analyzed by one-way ANOVA with Dunnett’s multiple comparison test. Outliers were identified using ROUT method with Q = 1%. A probability value of p < 0.05, p < 0.01, and p < 0.001 was considered to be statistically significant.
Supplemental Material
Download MS Word (1.1 MB)Disclosure statement
The authors declare that they have no competing financial interests.
Supplementary material
Supplemental data for this article can be accessed here.
Additional information
Funding
Related Research Data
References
- Li C, Gotz J. Tau-based therapies in neurodegeneration: opportunities and challenges. Nat Rev Drug Discov. 2017;16(12):863–883.
- Mullard A. Alzheimer amyloid hypothesis lives on. Nat Rev Drug Discov. 2016;16(1):3–5.
- Settembre C, Di Malta C, Polito VA, et al. TFEB links autophagy to lysosomal biogenesis. Science. 2011;332(6036):1429–1433.
- Sardiello M, Palmieri M, di Ronza A, et al. A gene network regulating lysosomal biogenesis and function. Science. 2009;325(5939):473–477.
- Puertollano R, Ferguson SM, Brugarolas J, et al. The complex relationship between TFEB transcription factor phosphorylation and subcellular localization. Embo J. 2018;37(11):e98804.
- Klionsky DJ, Abdelmohsen K, Abe A, et al. Guidelines for the use and interpretation of assays for monitoring autophagy (3rd edition). Autophagy. 2016;12(1):1–222.
- Boland B, Yu WH, Corti O, et al. Promoting the clearance of neurotoxic proteins in neurodegenerative disorders of ageing. Nat Rev Drug Discov. 2018;17(9):660–688.
- Martini-Stoica H, Xu Y, Ballabio A, et al. The autophagy-lysosomal pathway in neurodegeneration: A TFEB perspective. Trends Neurosci. 2016;39(4):221–234.
- Song JX, Liu J, Jiang Y, et al. Transcription factor EB: an emerging drug target for neurodegenerative disorders. Drug Discov Today. 2021;26(1):164–172.
- Guo X, Ma T. Effects of acupuncture on neurological disease in clinical- and animal-based research. Front Integr Neurosci. 2019;13:47.
- Jia Y, Zhang X, Yu J, et al. Acupuncture for patients with mild to moderate Alzheimer’s disease: a randomized controlled trial. BMC Complement Altern Med. 2017;17(1):556.
- Zhou J, Peng W, Xu M, et al. The effectiveness and safety of acupuncture for patients with Alzheimer disease: a systematic review and meta-analysis of randomized controlled trials. Medicine (Baltimore). 2015;94(22):e933.
- Park S, Lee JH, Yang EJ. Effects of acupuncture on Alzheimer’s disease in animal-based research. Evid Based Complement Alternat Med. 2017;2017:6512520.
- Zeng BY, Salvage S, Jenner P. Effect and mechanism of acupuncture on Alzheimer’s disease. Int Rev Neurobiol. 2013;111:181–195.
- Sun W, Li M, Lin T, et al. Effect of acupuncture at 3-points for intelligence on vascular dementia: protocol for a systematic review and meta-analysis of randomized controlled trials. Medicine (Baltimore). 2018;97(42):e12892.
- Cui S, Xu M, Huang J, et al. Cerebral responses to acupuncture at GV24 and bilateral GB13 in rat models of Alzheimer’s disease. Behav Neurol. 2018;2018:8740284.
- Heneka MT, Carson MJ, El Khoury J, et al. Neuroinflammation in Alzheimer’s disease. Lancet Neurol. 2015;14(4):388–405.
- El Khoury JB, Moore KJ, Means TK, et al. CD36 mediates the innate host response to beta-amyloid. J Exp Med. 2003;197(12):1657–1666.
- Furman JL, Sama DM, Gant JC, et al. Targeting astrocytes ameliorates neurologic changes in a mouse model of Alzheimer’s disease. J Neurosci. 2012;32(46):16129–16140.
- Bordi M, Berg MJ, Mohan PS, et al. Autophagy flux in CA1 neurons of Alzheimer hippocampus: increased induction overburdens failing lysosomes to propel neuritic dystrophy. Autophagy. 2016;12(12):2467–2483.
- Yang C, Cai CZ, Song JX, et al. NRBF2 is involved in the autophagic degradation process of APP-CTFs in Alzheimer disease models. Autophagy. 2017;13(12):2028–2040.
- Xiao Q, Yan P, Ma X, et al. Neuronal-targeted TFEB accelerates lysosomal degradation of APP, reducing abeta generation and amyloid plaque pathogenesis. J Neurosci. 2015;35(35):12137–12151.
- Xiao Q, Yan P, Ma X, et al. Enhancing astrocytic lysosome biogenesis facilitates Abeta clearance and attenuates amyloid plaque pathogenesis. J Neurosci. 2014;34(29):9607–9620.
- Tanida I, Minematsu-Ikeguchi N, Ueno T, et al. Lysosomal turnover, but not a cellular level, of endogenous LC3 is a marker for autophagy. Autophagy. 2005;1(2):84–91.
- Gowrishankar S, Yuan P, Wu Y, et al. Massive accumulation of luminal protease-deficient axonal lysosomes at Alzheimer’s disease amyloid plaques. Proc Natl Acad Sci U S A. 2015;112(28):E3699–708.
- Zhong L, Xu Y, Zhuo R, et al. Soluble TREM2 ameliorates pathological phenotypes by modulating microglial functions in an Alzheimer’s disease model. Nat Commun. 2019;10(1):1365.
- Hassiotis S, Manavis J, Blumbergs PC, et al. Lysosomal LAMP1 immunoreactivity exists in both diffuse and neuritic amyloid plaques in the human hippocampus. Eur J Neurosci. 2018;47(9):1043–1053.
- Wang H, Wang R, Xu S, et al. Transcription factor EB Is selectively reduced in the nuclear fractions of Alzheimer’s and amyotrophic lateral sclerosis brains. Neurosci J. 2016;2016:4732837.
- Tiribuzi R, Crispoltoni L, Porcellati S, et al. miR128 up-regulation correlates with impaired amyloid beta(1-42) degradation in monocytes from patients with sporadic Alzheimer’s disease. Neurobiol Aging. 2014;35(2):345–356.
- Song JX, Malampati S, Zeng Y, et al. A small molecule transcription factor EB activator ameliorates beta-amyloid precursor protein and Tau pathology in Alzheimer’s disease models. Aging Cell. 2020;19(2):e13069.
- Xu Y, Du S, Marsh JA, et al. TFEB regulates lysosomal exocytosis of tau and its loss of function exacerbates tau pathology and spreading. Mol Psychiatry. 2020. [Online ahead of print.]. DOI:10.1038/s41380-020-0738-0.
- Martini-Stoica H, Cole AL, Swartzlander DB, et al. TFEB enhances astroglial uptake of extracellular tau species and reduces tau spreading. J Exp Med. 2018;215(9):2355–2377.
- Chandra S, Jana M, Pahan K. Aspirin induces lysosomal biogenesis and attenuates amyloid plaque pathology in a mouse model of Alzheimer’s disease via PPARalpha. J Neurosci. 2018;38(30):6682–6699.
- Polito VA, Li H, Martini-Stoica H, et al. Selective clearance of aberrant tau proteins and rescue of neurotoxicity by transcription factor EB. EMBO Mol Med. 2014;6(9):1142–1160.
- Raben N, Puertollano R. TFEB and TFE3: linking lysosomes to cellular adaptation to stress. Annu Rev Cell Dev Biol. 2016;32:255–278.
- Paxinos G, B.J. Franklin K. The mouse brain in stereotaxic coordinates. 2nd ed. San Diego, USA: Academic Press; 2001.
- Kang S, Ha S, Park H, et al. Effects of a dehydroevodiamine-derivative on synaptic destabilization and memory impairment in the 5xFAD, Alzheimer’s disease mouse model. Front Behav Neurosci. 2018;12:273.
- Saxe MD, Battaglia F, Wang JW, et al. Ablation of hippocampal neurogenesis impairs contextual fear conditioning and synaptic plasticity in the dentate gyrus. Proc Natl Acad Sci U S A. 2006;103(46):17501–17506.
- Paylor R, Tracy R, Wehner J, et al. DBA/2 and C57BL/6 mice differ in contextual fear but not auditory fear conditioning. Behav Neurosci. 1994;108(4):810–817.