
ABSTRACT
Macrophage autophagy is a highly anti-atherogenic process that promotes the catabolism of cytosolic lipid droplets (LDs) to maintain cellular lipid homeostasis. Selective autophagy relies on tags such as ubiquitin and a set of selectivity factors including selective autophagy receptors (SARs) to label specific cargo for degradation. Originally described in yeast cells, “lipophagy” refers to the degradation of LDs by autophagy. Yet, how LDs are targeted for autophagy is poorly defined. Here, we employed mass spectrometry to identify lipophagy factors within the macrophage foam cell LD proteome. In addition to structural proteins (e.g., PLIN2), metabolic enzymes (e.g., ACSL) and neutral lipases (e.g., PNPLA2), we found the association of proteins related to the ubiquitination machinery (e.g., AUP1) and autophagy (e.g., HMGB, YWHA/14-3-3 proteins). The functional role of candidate lipophagy factors (a total of 91) was tested using a custom siRNA array combined with high-content cholesterol efflux assays. We observed that knocking down several of these genes, including Hmgb1, Hmgb2, Hspa5, and Scarb2, significantly reduced cholesterol efflux, and SARs SQSTM1/p62, NBR1 and OPTN localized to LDs, suggesting a role for these in lipophagy. Using yeast lipophagy assays, we established a genetic requirement for several candidate lipophagy factors in lipophagy, including HSPA5, UBE2G2 and AUP1. Our study is the first to systematically identify several LD-associated proteins of the lipophagy machinery, a finding with important biological and therapeutic implications. Targeting these to selectively enhance lipophagy to promote cholesterol efflux in foam cells may represent a novel strategy to treat atherosclerosis.
Abbreviations: ADGRL3: adhesion G protein-coupled receptor L3; agLDL: aggregated low density lipoprotein; AMPK: AMP-activated protein kinase; APOA1: apolipoprotein A1; ATG: autophagy related; AUP1: AUP1 lipid droplet regulating VLDL assembly factor; BMDM: bone-marrow derived macrophages; BNIP3L: BCL2/adenovirus E1B interacting protein 3-like; BSA: bovine serum albumin; CALCOCO2: calcium binding and coiled-coil domain 2; CIRBP: cold inducible RNA binding protein; COLGALT1: collagen beta(1-O)galactosyltransferase 1; CORO1A: coronin 1A; DMA: deletion mutant array; Faa4: long chain fatty acyl-CoA synthetase; FBS: fetal bovine serum; FUS: fused in sarcoma; HMGB1: high mobility group box 1; HMGB2: high mobility group box 2: HSP90AA1: heat shock protein 90: alpha (cytosolic): class A member 1; HSPA5: heat shock protein family A (Hsp70) member 5; HSPA8: heat shock protein 8; HSPB1: heat shock protein 1; HSPH1: heat shock 105kDa/110kDa protein 1; LDAH: lipid droplet associated hydrolase; LIPA: lysosomal acid lipase A; LIR: LC3-interacting region; MACROH2A1: macroH2A.1 histone; MAP1LC3: microtubule-associated protein 1 light chain 3; MCOLN1: mucolipin 1; NBR1: NBR1, autophagy cargo receptor; NPC2: NPC intracellular cholesterol transporter 2; OPTN: optineurin; P/S: penicillin-streptomycin; PLIN2: perilipin 2; PLIN3: perilipin 3; PNPLA2: patatin like phospholipase domain containing 2; RAB: RAB, member RAS oncogene family; RBBP7, retinoblastoma binding protein 7, chromatin remodeling factor; SAR: selective autophagy receptor; SCARB2: scavenger receptor class B, member 2; SGA: synthetic genetic array; SQSTM1: sequestosome 1; TAX1BP1: Tax1 (human T cell leukemia virus type I) binding protein 1; TFEB: transcription factor EB; TOLLIP: toll interacting protein; UBE2G2: ubiquitin conjugating enzyme E2 G2; UVRAG: UV radiation resistance associated gene; VDAC2: voltage dependent anion channel 2; VIM: vimentin
Introduction
Lipid droplets (LDs) are ubiquitous organelles specialized in neutral lipid storage and hydrolysis. Originating in the endoplasmic reticulum, LDs are comprised of a core of neutral lipids (cholesterol esters, triglycerides) surrounded by a phospholipid monolayer and several LD-associated proteins. The perilipin (PLIN) family are the most abundant structural proteins present on the surface of LDs. While PLIN1 (perilipin 1) is primarily expressed in adipocytes, PLIN2 (perilipin 2) and PLIN3 (perilipin 3) are ubiquitously expressed [Citation1]. LDs also acquire a host of enzymes that regulate LD metabolism. Among these are neutral lipases such as LIPE (lipase E, hormone sensitive type) and CES1 (carboxylesterase 1) that mediate the hydrolysis of LD-associated neutral lipid, acting on the LD surface in situ. More recently, degradation of LDs by autophagy (lipophagy) was shown to play a vital role in the mobilization of fatty acids and cholesterol for energy production and cholesterol efflux, respectively [Citation2,Citation3].
Autophagy is the cellular process by which cytoplasmic organelles are degraded by lysosomes [Citation4]. Conserved among eukaryotes, the fundamental mechanism of autophagy involves several proteins encoded by AuTophaGy-related (ATG) genes discovered in the early 1990s in yeast [Citation5]. Autophagy in mammalian cells can be subdivided into three distinct pathways: macroautophagy, microautophagy, and chaperone-mediated autophagy [Citation6]. During macroautophagy/autophagy, portions of the cytoplasm are sequestered within double-membrane vesicles called autophagosomes, which fuse with the lysosome for cargo degradation and recycling. In microautophagy, cytoplasmic components are directly engulfed by the lysosome (in mammals) or the vacuole (in plant and fungi). Although traditionally thought of as a nonselective process, various forms of selective autophagy are now documented. The heart of this selectivity lies in the MAP1LC3/LC3 (microtubule associated protein 1 light chain 3)-interacting region (LIR) motif of specific autophagy receptors that target cargo for autophagic degradation [Citation7]. Our work has documented a role for autophagy in LD catabolism in lipid-laden macrophages (foam cells) [Citation2], yet the autophagy receptors that selectively target LDs for lipophagy are unknown.
Here, we employed mass spectrometry to characterize the human macrophage foam cell LD proteome to identify lipophagy selectivity factors. In addition to identifying PLIN2 as the major foam cell LD coat protein and other known LD proteins, we found several proteins related to the ubitiquination machinery and autophagy on LDs. The functional role of these candidate lipophagy selectivity factors (total of 91) in macrophage foam cells was tested using a custom siRNA array combined with high-content cholesterol efflux assays. We observed that knocking down several of these genes, including Map1lc3a (encoding a central protein in the autophagy pathway), Tfeb (transcription factor EB; a regulator of autophagy and lysosome biogenesis) and its downstream lysosomal and autophagy genes Mcoln1 (mucolipin 1; which is involved in lysosome exocytosis) and Uvrag (UV radiation resistance associated gene; involved in initiating autophagy) along with Hmgb1 (high-mobility group box 1) and Hmgb2; autophagy activators), and Scarb2 (scavenger receptor class B, member 2), significantly reduced cholesterol efflux, suggesting a role for these proteins in lipophagy-mediated LD catabolism. Finally, determination of the genetic requirements for vacuolar entry of LDs and LD degradation in yeast reveals an aggrephagy-like mechanism for lipophagy involving Lhs1 (molecular chaperone of the ER lumen) a homolog of mammalian HSPA5 (heat shock protein family A member 5), Ubc7 (ubiquitin-conjugating enzyme), a homolog of mammalian UBE2G2 (ubiquitin conjugating enzyme E2 G2) and Cue1 (ubiquitin binding protein), a homolog of mammalian AUP1 (AUP1 lipid droplet regulating VLDL assembly factor). However, we observed that Cue5 (ubiquitin binding protein), the homolog of TOLLIP (toll interacting protein) in mammals that is typically required for the selective aggrephagy of protein aggregates [Citation8], was not required.
Results
Lipid droplet ubiquitination occurs during lipophagy
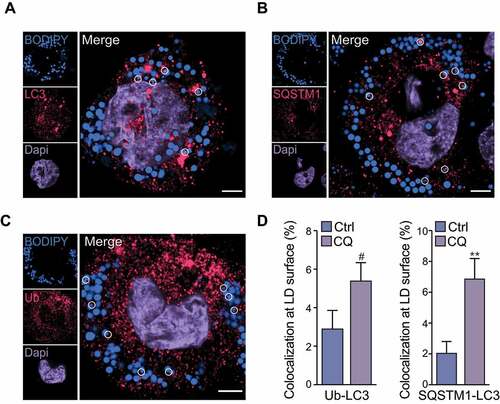
Autophagy is required for LD breakdown in lipid-loaded cells, such as those generated from culture with oleic acid [Citation3]. Similarly, we have previously observed that in contrast to native low density lipoprotein, pathophysiological forms of LDL such as oxidized LDL or aggregated low density lipoprotein (agLDL) trigger macrophage autophagy [Citation2]. As expected, incubation of human THP-1 macrophages with agLDL led to the accumulation of BODIPY-positive LDs (–C). Under these conditions, lipophagy was active and was observed by association of the autophagosome marker LC3 at the LD surface (), along with association of the classical autophagy receptor SQSTM1 (sequestosome 1) that functions in selective autophagy of several organelles (mitochondria in mitophagy, protein aggregates in aggrephagy, peroxisomes in pexophagy), on the surface of these LDs (). Furthermore, LDs were frequently ubiquitinated (), and we observed colocalization of ubiquitin and LC3 or colocalization of SQSTM1 and LC3 on the surface of ~2-3% cytoplasmic BODIPY+ LDs, which increased by 2- to 3-fold following inhibition of autophagy flux using chloroquine (). We also observed a similar recruitment of LC3, SQSTM1 and ubiquitin on LDs that was further increased by inhibiting autophagy flux using chloroquine in oleic acid-loaded THP-1 macrophages (Figure S1). Collectively, these results show active lipophagy in agLDL-loaded and oleic acid-loaded THP-1 macrophage foam cells, whereby ubiquitin, SQSTM1 and LC3 are recruited to the surface of LDs.
Figure 1. LC3, SQSTM1 and ubiquitin localize to lipid droplets in macrophage foam cells. Human THP-1 macrophages were loaded with agLDL (50 μg/mL) for 30 h and equilibrated in BSA (2 mg/mL) overnight. Cells were then fixed and stained for LC3 (A), SQSTM1 (B), ubiquitin (Ub) (C) and BODIPY 493/503 to label neutral lipids. Lipid droplets (LDs) that were colocalized with LC3, SQSTM1 or Ub are circled. At right, quantification of the percent of cellular LDs tagged with Ub and LC3 or Ub and SQSTM1 colocalized at their surface in chloroquine (CQ)-treated cells as compared to control (Ctrl) is shown. Data are expressed as fold-change for the chloroquine treatment relative to untreated from one experiment representative of 3 independent experiments with similar results (mean ± s.e.m). #P < 0.1, **P< 0.005. Representative images are from untreated cells. Scale bar: 5 μm
Identification of putative lipophagy factors on the surface of lipid droplets
To identify putative lipophagy factors, we performed mass spectrometry on isolated LDs from macrophage foam cells. Differentiated human THP-1 macrophages were incubated with agLDL to stimulate LD biogenesis and foam cell formation, and these cells were subsequently treated (or not) with chloroquine to inhibit autophagy (). LDs were isolated by sucrose gradient ultracentrifugation and de-lipidated using cold acetone precipitation and sonication [Citation9] for subsequent mass spectrometry or western blotting, or directly plated onto coated coverslips for microscopy analysis (–D). The purity of LDs was confirmed by enrichment of PLIN2 on LDs relative to the cytoplasm (). Conversely, the cytoplasm was enriched in GAPDH (glyceraldehyde-3-phosphate dehydrogenase), CANX (calnexin) and LAMP1 (lysosomal associated membrane protein 1) as compared to LDs (). The presence of LC3-I on LDs suggests that LC3 was recruited via interactions with a protein containing an LIR motif and that its lipidation to LC3-II occurs in situ on LDs (), as previously suggested [Citation2,Citation3]. Localization of ubiquitin, SQSTM1 and LC3 to the surface of purified LDs was confirmed by immunofluorescence ().
Figure 2. Proteins enriched on lipid droplets following lipophagy inhibition. (A) Schematic for human THP-1 macrophage lipid droplet (LD) isolation. (B) Western Blot analysis of LD and cytoplasmic fractions obtained by sucrose gradient ultracentrifugation. (C, D) Immunostaining of isolated LDs for PLIN2 and Ubiquitin (C), SQSTM1 and LC3 (D), and BODIPY 493/503 to label neutral lipids. (E) Enrichment of proteins at the surface of LDs in foam cells treated with chloroquine (CQ) relative to untreated (Ctrl), with the size of bubbles reflecting relative protein abundance. The number of putative ubiquitin-associated (UBA) and LC3-interacting (LIR) motifs identified in each protein is shown to the right. Scale bar: 1 μm
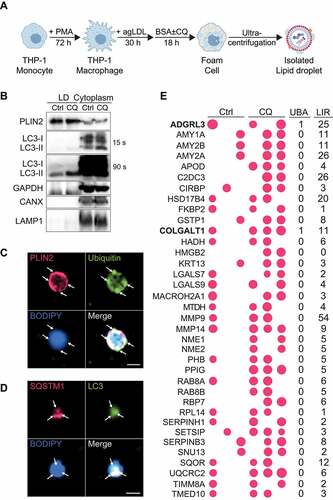
Consistent with other studies aimed at defining the LD proteome [Citation10–18], we observed several structural LD proteins (PLIN2, PLIN3, VIM [vimentin]) along with LD proteins specialized in processes such as lipid transport (FABP4, FABP5 [fatty acid binding proteins 4 and 5]), lipid metabolism (ACSL3, ACSL4 [acyl-CoA synthetase long chain family member 3 and 4]), lipid hydrolysis (LDAH [lipid droplet associated hydrolase], PNPLA2 (patatin like phospholipase domain containing 2), FAF2 (Fas associated factor family member 2), protein quality control (molecular chaperones), vesicular transport (proteins), lysosomal function (CTSB [cathepsin B], NPC2 [NPC intracellular cholesterol transporter 2; an intracellular cholesterol transporter]), ubiquitination (AUP1) and autophagy regulation (CORO1A [coronin 1A], HMGB1) on LDs of both treatment groups (). Novel LD proteins of agLDL-loaded macrophage foam cells included the autophagy regulators: ragulator complex protein LAMTOR5 (late endosomal/lysosomal adaptor, MAPK and MTOR activator 5) and DAP (death associated protein), the cholesterol efflux regulator DSC1 (desmocollin 1), and SCARB2. These were previously implicated in autophagy, cholesterol efflux and lysosomal cholesterol export [Citation19–22] but not localized to LDs.
Table 1. Proteins on human macrophage foam cell lipid droplets (LDs)
We computationally investigated the proteome of chloroquine-treated versus untreated cells to discover protein sequence motifs enriched among proteins detected in cells in which lipophagy was inhibited by blockage of lysosome function. Unbiased sequence motif enrichment analysis revealed the following motifs as being enriched in proteins present on the surface of foam cell LDs following autophagy inhibition: RAB protein motif, ubiquitin motif and YWHA/14-3-3 family of proteins motif (Figure S2). Of note, the ubiquitin motif, being highly conserved among multiple ubiquitin proteins, could have originated from peptides of a single ubiquitin protein. We also investigated the active biological pathways in cells with inhibited lipophagy. Gene ontology [Citation23] enrichment analysis of the LD proteins enriched following chloroquine treatment showed enrichment of pathways that control cellular response to lipid, vesicular trafficking and regulation of autophagy (Table S2).
Proteins selectively enriched on LDs of chloroquine-treated cells included HMGB2 (autophagy activator [Citation24]), RAB8 ([RAB8A, member RAS oncogene family] autophagy-dependent exocytosis [Citation25]), APOD (apolipoprotein D; lysosome function-enhancing antioxidant [Citation24,Citation26]) and cold-shock protein CIRBP (cold inducible RNA binding protein; an autophagy activator [Citation27]) with known roles in autophagy, along with MACROH2A1 (macroH2A.1 histone;, core histone), RBP7 (retinol binding protein 7; retinol metabolism), ADGRL3 (adhesion G protein-coupled receptor L3; neuron guidance) and COLGALT1 (collagen beta(1-O)galactosyltransferase 1) with unknown roles in autophagy (). We queried which of these contained putative LIR motifs, or other domains commonly found in selective autophagy cargo receptors known to date [Citation28], such as ubiquitin-associated (UBA) domains or ubiquitin-interacting motifs (UIM) [Citation29]. Of the 37 proteins enriched on LDs of chloroquine-treated foam cells, none contained a UIM, while several contained predicted LIR motifs and only two proteins, ADGRL3 and COLGALT1, contained predicted UBAs (). With this list in hand, we next asked which of these candidate lipophagy factors may be relevant to LD catabolism in macrophage foam cells.
Knockdown of candidate selective lipophagy factors reduces cholesterol efflux
Lipid-laden macrophages, or foam cells, are a hallmark of atherosclerosis, a chronic sterile inflammatory disease driven by the buildup of cholesterol-rich plaques in the artery wall. Within macrophage foam cells, LD catabolism via lipophagy releases free cholesterol for efflux, a process dependent on ABCA1 (ATP-binding cassette, sub-family A (ABC1), member 1) that pumps cellular cholesterol out to lipid-poor APOA1 (apolipoprotein A1), an extracellular cholesterol acceptor [Citation2]. Bulk RNA-seq data comparing aortic intimal cells from apoe−/− mice fed a high-fat diet for 28 weeks and sorted into foamy or non-foamy macrophages [Citation30] was queried for log2FoldChange of our candidate selective lipophagy genes. In addition to the distinctive expression of genes related to cholesterol and fatty acid transport (Abca1, Lipa [lysosomal acid lipase A], Npc1 [NPC intracellular cholesterol transporter 1], Fabp4 [fatty acid binding protein 4, adipocyte] and Fabp5 [fatty acid binding protein 5, epidermal]) previously reported in these cell populations [Citation30], transcriptome profiling revealed altered expression of candidate lipophagy regulators (). Notably, Mmp14 (matrix metallopeptidase 14 (membrane-inserted)), Npc2, Rab31, Bnip3l (BCL2/adenovirus E1B interacting protein 3-like), Plin2 and Psap (prosaposin) were significantly elevated in foamy macrophages as compared to non-foamy macrophages, while Mmp9 (matrix metallopeptidase 9), Hmgb2, Fus (fused in sarcoma) and Hsp90aa1 (heat shock protein 90, alpha (cytosolic), class A member 1) were reduced (). We also noted reduced expression of Rab8, Ube2g2, Mmp9 (matrix metallopeptidase 9), Tpd52l2 (tumor protein D52-like 2), Phb (prohibitin), Hspa8 (heat shock protein 8), Hspa5, Rab18, Rbbp7 (retinoblastoma binding protein 7, chromatin remodeling factor), Coro1a, Hspb1 (heat shock protein 1), Hmgb1, Ppp1cc (protein phosphatase 1 catalytic subunit gamma), Uvrag, Sqstm1, Macroh2a1 and several YWHA/14-3-3 family of genes in foamy macrophages concomitant with elevated expression of Slc25a5 (solute carrier family 25 (mitochondrial carrier, adenine nucleotide translocator), member 5), Scarb2, Park7 (Parkinson disease (autosomal recessive, early onset) 7), Atg5 (autophagy related 5), Hsph1 (heat shock 105kDa/110kDa protein 1), Hsd17b4 (hydroxysteroid (17-beta) dehydrogenase 4), Nme1 (NME/NM23 nucleoside diphosphate kinase 1) and Tmed10 (transmembrane p24 trafficking protein 10) (). Collectively, bulk RNA-seq of foam cells from mice with advanced atherosclerosis revealed two clusters of candidate lipophagy genes: one with elevated expression in foam cells and another with elevated expression in non-foam cells. This suggests a physiological role for LD-associated candidate lipophagy factors in atherosclerotic foam cells.
Figure 3. Lipophagy candidate genes are dysregulated in atherosclerosis and regulate foam cell cholesterol efflux. (A) Bulk RNA-seq of atherosclerotic foam cells from apoe−/− mice fed a Western diet for 28 weeks. Genes denoted by an asterisk are significantly different between macrophage populations (P < 0.05) and heatmap color values correspond to the relative expression (Z-score-transformed RPKM values) of each gene across the six samples. Data was acquired from Kim et al. [Citation30] (B) Schematic for reverse transfection of mouse peritoneal macrophages. (C) Efflux of 3H-cholesterol (x-axis) from agLDL-loaded mouse peritoneal macrophages transfected with siRNAs against indicated target mouse genes (y-axis) grouped under shared functional annotations: ubiquitination machinery (Ubiquitin), molecular chaperones (Chaperone), lysosome function (Lysosome), Rab proteins (Rab), Autophagy regulators (Autophagy), regulators of neutral lipolysis (Lipolysis), selective autophagy receptors (SARs), response to cell stress (Stress) and other. Data are the mean ± s.e.m. of four independent experiments. #P < 0.1, *P< 0.05, **P< 0.005, ***P< 0.0005
![Figure 3. Lipophagy candidate genes are dysregulated in atherosclerosis and regulate foam cell cholesterol efflux. (A) Bulk RNA-seq of atherosclerotic foam cells from apoe−/− mice fed a Western diet for 28 weeks. Genes denoted by an asterisk are significantly different between macrophage populations (P < 0.05) and heatmap color values correspond to the relative expression (Z-score-transformed RPKM values) of each gene across the six samples. Data was acquired from Kim et al. [Citation30] (B) Schematic for reverse transfection of mouse peritoneal macrophages. (C) Efflux of 3H-cholesterol (x-axis) from agLDL-loaded mouse peritoneal macrophages transfected with siRNAs against indicated target mouse genes (y-axis) grouped under shared functional annotations: ubiquitination machinery (Ubiquitin), molecular chaperones (Chaperone), lysosome function (Lysosome), Rab proteins (Rab), Autophagy regulators (Autophagy), regulators of neutral lipolysis (Lipolysis), selective autophagy receptors (SARs), response to cell stress (Stress) and other. Data are the mean ± s.e.m. of four independent experiments. #P < 0.1, *P< 0.05, **P< 0.005, ***P< 0.0005](/cms/asset/39c69430-e681-406e-9210-50e055519ded/kaup_a_1886839_f0003_oc.jpg)
To directly test the functional role of candidate lipophagy regulators and autophagy receptors (a total of 91) in macrophage foam cells, we employed a custom siRNA array to perform high-throughput cholesterol efflux assays (). Murine thioglycolate-elicited peritoneal macrophages were plated onto siRNA complexes within a 96-well plate (reverse transfection) and incubated with agLDL and 3H-cholesterol to label LD-cholesterol. Seventy-two h post-transfection, cholesterol efflux to APOA1 was quantified for 24 h. Upon knockdown, the gene that most significantly downregulated cholesterol efflux was Map1lc3a, a central protein in the autophagy pathway included as a positive control (). Other known autophagy regulators in the array included the autophagy transcription factor Tfeb and its downstream genes Uvrag and Mcoln1, and Atg5, all of which also reduced cholesterol efflux following gene knockdown (). Additionally, knockdown of the identified LD-associated proteins HMGB1 and HMGB2, molecular chaperones HSP90AA1, HSPB1, HSPA5 and HSPH1, lysosomal proteins NPC2 and SCARB2, neutral lipases LDAH and PNPLA2, and RAB proteins RAB2, RAB5, RAB6, RAB10 and RAB13 all reduced cholesterol efflux (). We also observed that knockdown of CIRBP and the stress granule-associated RNA binding protein FUS, general stress-response proteins [Citation31,Citation32], resulted in impaired cholesterol efflux (). Just below significance were the AUP1 and UBE2G2 genes that both reduced cholesterol efflux in 3 out of 4 experiments ().
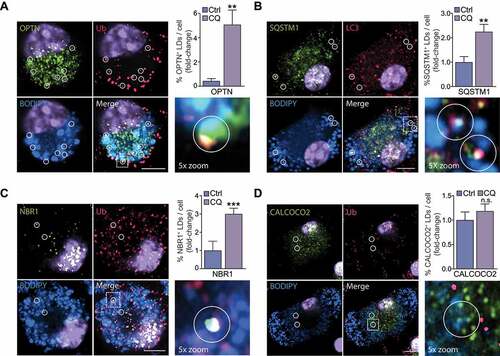
Although autophagy was initially described as a bulk degradation process, it is now recognized that diverse cargoes, including LDs, can undergo selective degradation. While selective autophagy employs a common mechanism, including the “core autophagy machinery”, it also relies on a set of selectivity factors including selective autophagy receptors (SARs) that label specific cargo for selective autophagic degradation and initiate autophagy [Citation8]. In mammalian cells, tags such as ubiquitination prevail in tagging organelles for degradation, as shown above for LDs (). Several ubiquitin-dependent SARs have been identified, including SQSTM1, OPTN (optineurin), NBR1 (NBR1, autophagy cargo receptor), CALCOCO2 (calcium binding and coiled-coil domain 2), BNIP3L, and TAX1BP1 (Tax1 binding protein 1). Of these, we found that silencing OPTN or NBR1, but not BNIP3L or TAX1BP1, significantly reduced cholesterol efflux (). Silencing CALCOCO2 and SQSTM1 also reduced cholesterol efflux, although this did not reach significance (). Given that knockdown of SARs OPTN, NBR1, CALCOCO2 and SQSTM1 reduced cholesterol efflux, we determined which of these colocalize with LDs in foam cells. Immunostaining in bone marrow-derived macrophages (BMDMs) lipid loaded with agLDL revealed the presence of OPTN, NBR1 and SQSTM1 on LDs, while CALCOCO2 was present on small BODIPY-positive puncta devoid of ubiquitin (). Comparison of the number of LDs tagged with SARs in chloroquine-treated cells relative to control revealed a marked increase in OPTN, SQSTM1 and NBR1, but not CALCOCO2, at the surface of LDs upon autophagy inhibition (). Colocalization of ubiquitin and OPTN (Ub-OPTN), ubiquitin and LC3 (Ub-LC3), LC3 and SQSTM1 (LC3-SQSTM1), and ubiquitin and NBR1 (Ub-NBR1) at the surface of LDs, but not ubiquitin and CALCOCO2, specifically increased upon chloroquine treatment (Figure S3). Collectively, these experiments identify several molecular chaperones (HSP90AA1, HSPB1, HSPA5, HSPH1), HMGB1 and HMGB2, lysosomal proteins (NPC2, SCARB2), RAB proteins (RAB2, RAB5, RAB6, RAB10, RAB13), stress proteins (CIRBP, FUS), ubiquitination factors (UBE2G2, AUP1) and SARs (OPTN, NBR1, SQSTM1) as direct and/or indirect regulators of lipophagy.
Figure 4. Selective autophagy receptors (SARs) OPTN, NBR1 and SQSTM1 selectively localize to foam cell lipid droplets (LDs). (A-D) Immunostaining for OPTN (A), SQSTM1 (B), NBR1 (C) or CALCOCO2 (D) in agLDL-loaded mouse bone marrow-derived macrophage foam cells stained with BODIPY 493/503 to label LD neutral lipids, with areas of interest circled. At right, quantification of the percent of cellular LDs tagged with SARs in chloroquine-treated cells (CQ) as compared to control (Ctrl) is shown. Data are expressed as fold-change for the chloroquine treatment relative to untreated from one experiment representative of 3 independent experiments with similar results (mean ± s.e.m). **P< 0.005, ***P< 0.0005. Representative images are from CQ-treated cells. Scale bar: 5 μm
Genetic ablation of selective lipophagy factors in Saccharomyces cerevisiae impairs lipophagy
Microlipophagy studies in yeast have revealed a requirement for the core autophagy machinery (Atg12–Atg5, Atg8, etc.), yet few lipophagy-specific genes have been identified to date [Citation33]. Given that ~90% of core autophagy genes are conserved across eukaryotes, we employed synthetic genetic array (SGA) methodology to incorporate the well-established yeast LD marker Faa4 (long chain fatty acyl-CoA synthetase)-GFP (green fluorescent protein) and Vph1 (V-type proton ATPase subunit a)-mRuby2 into the yeast non-essential deletion mutant array (DMA) library, as previously described [Citation34,Citation35]. The resulting haploid deletion strains were grown in synthetic complete (SC) medium to stationary phase (), a condition that stimulates the incorporation of LDs into the vacuole via microautophagy [Citation36]. Fluorescence microscopy of LDs in wild-type (WT) and atg8∆ cells lacking a core atg gene required for autophagy showed that while LD number and distribution were comparable after 24 h of growth in SC medium after reaching early stationary phase (1 d), the number of vacuolar LDs was significantly reduced in atg8∆ cells after 5 days (5 d) in comparison to WT cells (). These results are consistent with previous findings of the functional impact of ATG8 deletion on lipophagy [Citation33,Citation36–38].
Figure 5. Genetic ablation of selective lipophagy factors impairs lipophagy in yeast. (A) Representative growth curves of WT and atg8Δ strains in SC medium. (B) Activation of lipophagy during stationary phase shown by confocal fluorescence microscopy of Faa4-GFP lipid droplets (LDs) within Vph1-mRuby2 vacuoles. (C) Appearance of the GFP fragment of the Faa4-GFP fusion protein, indicating uptake and degradation of Faa4-GFP in the vacuole. (D) Faa4-GFP cleavage in various yeast stains. (E) LDs internalization into the vacuole at day 5 of stationary phase. (F) Lipophagy quantification. Scale bar: 5 μm
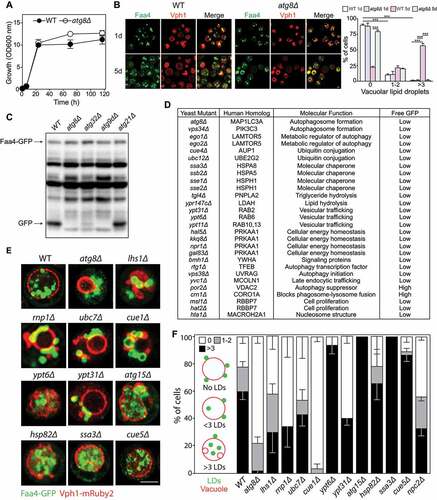
To determine the role of our identified putative selective lipophagy factors in LD autophagy, we first compared the proteolytic processing of Faa4-GFP in the vacuole, as previously described [Citation33], where the appearance of one or two bands at ~27 kDa tracks vacuolar cleavage of Faa4. Cleavage of Faa4-GFP was readily observed in wild-type cells cultured to stationary phase, while this was largely impaired in atg8∆, atg32∆ and atg9∆ strains, as previously described [Citation39] (). No inhibition of Faa4-GFP degradation was observed in the atg21∆ strain lacking Atg21, a protein required for the cytoplasm-to-vacuole targeting pathway [Citation40] (). Comparison of Faa4-GFP cleavage in numerous yeast strains lacking the S. cerevisiae homologs or close functional equivalents of putative selective lipophagy factors identified in macrophages in this study or hypothesized to regulate lipophagy, identified several strains with reduced Faa4-GFP cleavage in ≥3 out of 4 independent experiments ( and Figure S4). Among these were Ssa3, Ssb2, Sse1 and Sse2 (heat shock protein 70 family members), Bmh1 (brain modulosignalin homolog; a YWHA/14-3-3 protein), Ypt31/Ypt8, Ypt6, and Ypt11 (Rab family GTPases), Tgl4 (triacylglycerol lipase 4), Msi1 (subunit of chromatin assembly factor I) and Hat2 (histone acetyltransferase) identified as homologs of RBBP7, Hta1 (histone H2A) identified as a homolog of mammalian MACROH2A1, Ubc12 (Rub1-conjugating enzyme), CUE domain-containing protein Cue4 (ubiquitin binding protein), Rtg1 (ReTroGrade regulation protein 1), Vps38 (member of Vps34 PtdIns3K complex), Yvc1 (vacuolar calcium channel), along with proteins previously reported to regulate autophagy (Atg8, Vps34 [PtdIns3K] and Ego2 (exit from rapamycin-induced growth arrest), which is part of the yeast equivalent of the mammalian Ragulator complex, to which LAMTOR5 [late endosomal/lysosomal adaptor, MAPK and MTOR activator 5] belongs) (). Consistent with a reported role for the energy sensor AMP-activated protein kinase (AMPK) in lipophagy [Citation41], we observed that several strains with deletions in identified genes sharing functional overlap to mammalian AMPK (hal5∆ [Hal5 is a Snf1-related nutrient-responsive protein kinase], kkq8∆ [Kkq8 is a serine/threonine protein kinase], npr1∆ [Npr1 is a protein kinase], gal83∆ [Gal83 is a beta-subunit of the Snf1 kinase complex]) had reduced Faa4-GFP cleavage (). Of the known negative autophagy regulators found to localize on macrophage foam cell LDs (CORO1A, VDAC2 [voltage dependent anion channel 2] and DAP [death associated protein]), we found enhanced Faa4-GFP cleavage in crn1∆ (yeast homolog of CORO1A) and por2∆ (yeast homolog of VDAC2) yeast strains, consistent with a role for CORO1A and VDAC2 in blocking phagosome-lysosome fusion [Citation42] and suppressing autophagy [Citation43], respectively.
Next, we quantified LD entry into vacuoles in a subset of these strains: atg8∆, lhs1∆ (Lhs1 is a homolog of HSPA5), rnp1∆ (Rnp1 is a ribonucleoprotein that shares function with mammalian CIRBP [Citation44]), ubc7∆, ubc12∆, atg8∆, ypt6∆, ypt31∆, atg15∆ (autophagy related protein 15, a phospholipase), hsp82∆ (heat shock protein 82 is an ATP-dependent molecular chaperone), ssa3∆ (Ssa3 is a homolog of HSPA8) and npc2∆ (Niemann-Pick Type C protein involved in sterol transport; is a homolog of NPC2) during stationary phase lipophagy. We also tested cue1∆ and cue5∆ strains; Cue1 and Cue5 are functional homologs of AUP1 and the aggrephagy receptor TOLLIP, respectively. Lipophagy was classified as the average number of cells containing 0 LDs in the vacuole (white bars), 1–2 LDs in the vacuole (gray bars) or more than 3 LDs in the vacuole (>3, black bars) (). By following Faa4-GFP LD entry into Vph1-mRuby2 vacuoles, we observed that LD entry was significantly impaired in the atg8∆, lhs1∆, rnp1∆, ubc7∆, cue1∆, ypt31∆ and npc2∆ strains (). In contrast, LD entry was intact in atg15∆ cells, whereas loss of the vacuolar putative lipase Atg15, a functional ortholog of LIPA that is required for the degradation of autophagic bodies, resulted in accumulation of vacuolar LDs (), as previously reported [Citation33]. Similarly, ypt6∆ and ssa3∆ exhibited impaired LD catabolism, while hsp82∆ and cue5∆ had no impact on lipophagy (). Quantification of vacuolar entry of LDs in these strains confirmed our visual observations (). The possibility that lipophagy or LD catabolism might be altered because of differences in the rates of LD biogenesis were ruled out, given that we noted equivalent amounts of cellular LDs in all strains at 1 d of growth (Figure S5).
Single LDs and clusters of LDs are tagged for autophagic degradation
Because several mediators of aggrephagy, including OPTN, HSPA5, VCP (valosin containing protein) and 14-3-3 proteins were identified on LDs in our study and the LD protein AUP1 was previously shown to induce LD cluster formation [Citation45], we wondered whether LDs targeted for lipophagy in macrophage foam cells were single or LD clusters. Interestingly, we observed several single or cluster-less LDs tagged with LC3 in THP-1 foam cells, as expected based on previous observations made by us and others [Citation2,Citation3], but we also noted several clusters or aggregates of LDs that were tagged with LC3 (). Quantification of LC3+ LDs in agLDL-loaded THP-1 cells treated (or not) with chloroquine to inhibit autophagy showed that the number of LC3+ single LDs and LC3+ LD clusters similarly increased upon autophagy inhibition (), while the proportion of single LDs and LD clusters relative to total LDs tagged with LC3 remained constant in all conditions (). We were surprised to find that LC3+ LDs in clusters represented a significant proportion (~45%) of the total LC3+ LD pool, while most LDs consisted of single or cluster-less LDs (). These observations raised the possibility that single LDs and LD clusters may undergo selective lipophagy, potentially by distinct mechanisms.
Figure 6. Single lipid droplets (LD) and LD clusters are tagged for lipophagy. (A) 3D Rendering of LC3 (green) localization to LDs stained with BODIPY (blue) in THP-1 macrophages loaded with agLDL and subsequently treated or not with chloroquine (CQ) to inhibit autophagy. Scale bar: 10 μm. (B, C) Quantification of LC3+ LDs found as single LDs or on LDs within a LD cluster in cells shown in (A), expressed as a fold-change in CQ-treated cells relative to untreated (B) or as a percent total LC3+ LDs found as single or clusters of LDs (C). (D) Single and clusters of LDs observed by electron microscopy of murine macrophage foam cells (top panel). Lysosome arm-like extensions can be seen directly engulfing LDs (bottom panels). (E) Micrographs of an agLDL-loaded mouse bone marrow-derived macrophage expressing human GFP-LC3 (green) and labeled with monodansylpentane (MDH) to stain LDs (blue) and LysoTracker Red (magenta). i–ii. Zoom of the regions outlined in the main panel. i) Colocalization of a LD, lysosome and GFP-LC3 puncta. ii) Colocalization of a LD and lysosome. Scale bar: 5 μm. (F) Model of lipophagy mechanisms in mammalian macrophage foam cells, where single LDs or LD clusters are tagged for autophagic degradation, possibly beginning with a AUP1-UBE2G2 complex to initiate ubiquitin tagging of LDs for autophagic degradation. Single LDs may be engulfed by classical macroautophagy beginning with formation of autophagosomes at the phagophore assembly site (PAS) at the periphery or surface of LDs. In this scenario, phagophore maturation may be facilitated by RAB2 and RAB6. Alternatively, clusters of LDs exceeding the size of autophagosomes may be degraded through an aggrephagy-like mechanism mediated by SARs OPTN, NBR1 and SQSTM1 and lipophagy factors HSPA5 along with aggrephagy factors HDAC6 and YWHA/14-3-3 proteins to facilitate microlipophagy
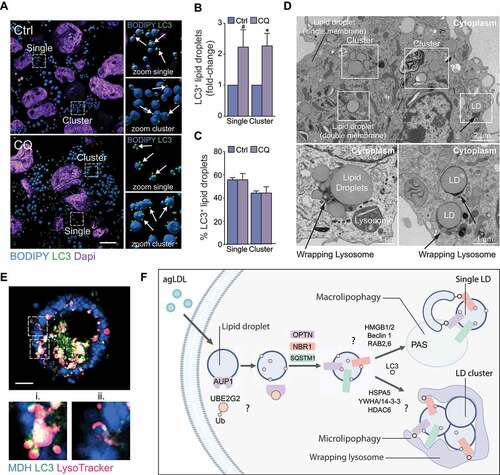
The diameter of autophagosomes is typically 0.5–1.5 µm in size in mammals [Citation46], raising the question of how LD clusters of > 2 µm in size might undergo conventional macroautophagy. We employed electron microscopy to further define the mechanisms of LD sequestration by autophagic vesicles in these foam cells. LDs were clearly identified as circular electron-transparent organelles not surrounded by double membranes that are characteristic of other organelles (). In addition to single LDs surrounded by single membranes and LDs encircled by a double membrane likely depicting engulfment in autophagosomes, we observed several LD clusters in foam cells (). Single LDs as well as LD clusters could be found in association with electron-dense matter surrounding or appearing to engulf the LDs (). These structures surrounding LDs and LD clusters were reminiscent of lysosome “arm-like” extensions previously found to directly engulf autophagy cargo during mammalian microautophagy of mitochondria [Citation47]. To further investigate the potential mechanisms for engulfment LD clusters by lysosomes, we performed live-cell imaging in primary BMDMs isolated from GFP-LC3 transgenic mice, allowing for the visualization of the association of single LDs or LD clusters with GFP-LC3 autophagosomes (macroautophagy) or directly with LysoTracker-positive lysosomes (microautophagy) in real-time. We found that LD clusters surrounded by faint and diffuse GFP-LC3 interacted with LysoTracker Red-positive lysosomes ( ii. and Video S1). The diffuse GFP-LC3 staining at the surface of LDs was distinct from the punctate GFP-LC3 staining of autophagosomes, which were frequently observed juxtaposed to or fusing with lysosomes in this cell ( i. and Video S1), suggesting that LC3-tagged LD clusters may directly be engulfed by lysosomes independent of autophagosome sequestration. Collectively, these data show that single LDs as well as LD clusters are tagged for autophagic degradation and suggest that microlipophagy, in addition to macrolipophagy, may represent an autophagic mechanism to degrade larger single LDs or LD clusters in macrophage foam cells. The proposed model in is largely speculative, based on our observations and those previously made by others (see discussion below).
Discussion
Conventionally thought of as inert fat depots, LDs are now recognized as metabolically active organelles vital to lipid homeostasis and signaling. Comprised of a core of neutral lipids, such as triacylglycerols and sterol esters, LDs are delimited by a phospholipid monolayer surrounded by structural and functional proteins coordinating dynamic interactions of LDs with a variety of cellular organelles [Citation48]. Degradation of LDs can result from the action of cytoplasmic lipases localized to LDs through a process known as neutral lipolysis. In addition, LDs can be degraded by the autophagy pathway. Originally observed in yeast cells in 1979 [Citation49], “lipophagy” refers to the degradation of LDs by autophagy [Citation3]; yet, how LDs are targeted for autophagy remains poorly defined.
Pioneering genetic studies in yeast have identified upwards of 35 ATG genes, among which 17 are part of the core machinery used by all autophagy pathways [Citation7,Citation50]. Additionally, targeted forms of autophagy coordinate the selective recycling of organelles. Selective autophagy relies on tags such as ubiquitin and a set of selectivity factors including SARs to label specific cargo for degradation [Citation8]. Ubiquitin tagging of selective autophagy substrates prevails in mammals, a process that is mediated by E1 ubiquitin-activating and E2 ubiquitin-conjugating enzymes coupled to E3 ubiquitin ligases. SARs that bind to ubiquitin and an Atg8-family protein member (LC3A, LC3B, LC3B2, LC3C, GABARAP [GABA type A receptor-associated protein], GABARAPL1 [GABA type A receptor associated protein like 1] or GABARAPL2) bridge target cargo to nascent autophagosomes. Here, we observed that treatment of macrophages with agLDL or oleic acid, which stimulates LD biogenesis and activates autophagy [Citation2,Citation3], was associated with recruitment of ubiquitin, SQSTM1 and LC3 to LDs ( and Figure S1). This observation is in accordance with a study that found that SQSTM1 was required to bridge LC3 to ubiquitinated LDs in hepatocytes [Citation51], and others localizing SQSTM1 to LDs [Citation52,Citation53], suggesting the selectivity of LD autophagy.
To identify selective lipophagy factors, we employed mass spectrometry and compared the LD proteome of macrophage foam cells cultured under basal conditions or upon autophagy inhibition. Because agLDL is the main physiological pro-atherogenic form of modified LDL in vivo [Citation54], characterization of agLDL-loaded macrophage foam cells was warranted to identify potential lipophagy factors that contribute to autophagy-mediated cholesterol efflux from these cells [Citation2]. As anticipated, the proteome of agLDL-loaded human THP-1 macrophages contained several LD structural proteins and metabolic enzymes, including PLIN2, PLIN3, ACSL3 (acyl-CoA synthetase long chain family member 3) and ACSL4 (). PLIN2 is the major structural protein of macrophage foam cell LDs [Citation2] and its role in lipolysis is two-fold. First, PLIN2 protects LDs against autophagy-mediated catabolism, and conversely loss of PLIN enhances lipophagy [Citation55]. Second, AMPK-dependent phosphorylation of PLIN2 allows its dissociation from LDs, preceding LD catabolism by cytosolic lipases or macroautophagy effectors [Citation56]. The human agLDL-loaded macrophage foam cell LD proteome described herein ( and Supplementary data) closely resembles that recently described for THP-1 macrophages loaded with acetylated LDL, another model modified LDL used to induce LD biogenesis [Citation57].
Intriguingly, we identified several aggresome components on LDs. Aggresomes are inclusion bodies enriched with molecular chaperones, components of the ubiquitin-proteasome system, along with intermediate filaments such as VIM, all of which were identified on foam cell LDs in this study [Citation58]. Specifically, we noted the presence of VIM, numerous molecular chaperones including tubulin-specific chaperones TBCB, TBCD, TBCE, TBCH, TBCQ, TBCZ (TBCs) previously shown to regulate autophagy and protein aggregation, HSPA5 that promotes aggrephagy [Citation59], VCP that promotes substrate degradation via the aggresome-autophagy pathway [Citation60], and finally YWHA/14-3-3 proteins YWHAE (tyrosine 3-monooxygenase/tryptophan 5-monooxygenase activation protein epsilon), YWHAG, YWHAQ and YWHAZ that regulate autophagy [Citation61] and were found to be indispensable for aggresome formation [Citation62]. Recently, Yan et al. reported that HDAC6 (histone deacetylase 6) could regulate LD turnover through SQSTM1-mediated aggresome formation, supporting the notion that selective autophagy may degrade LDs [Citation52] and raising the possibility that HDAC6 (histone deacetylase 6) may regulate the formation of functional aggresomes for LD catabolism in foam cells.
To elucidate the functional role of identified lipophagy selective factors in LD catabolism and cholesterol efflux, we used siRNA to silence the expression of lipophagy candidate genes in foam cells. Knockdown of several autophagy genes (Map1lc3a, Tfeb, Uvrag, Mcoln1 and Atg5) resulted in reduced cholesterol efflux from murine macrophage foam cells (). Additionally, knockdown of Hmgb1 and Hmgb2 encoding the autophagy activators HMGB1 and HGMB2, molecular chaperones HSP90AA1, HSPB1, HSPA5 and HSPH1, lysosomal proteins NPC2 and SCARB2, neutral lipases LDAH and PNPLA2, Rab proteins RAB2, RAB5, RAB6, RAB10 and RAB13, stress response proteins FUS and CIRBP, all found on foam cell LDs in this study, resulted in impaired cholesterol efflux (). HMGB2, CIRBP, RBBP7, SERPINH1 (serine (or cysteine) peptidase inhibitor, clade H, member 1) and MACROH2A1 that were specifically enriched on LDs following autophagy inhibition () all reduced cholesterol efflux following gene silencing (), although ADGRL3 and COLGALT1 that were predicted to contain both ubiquitin-binding and LIR motifs were not found to regulate cholesterol efflux.
Of the lipophagy candidates observed to regulate cholesterol efflux (), some may be regulating efflux by directly regulating lipophagy (i.e., targeting of LDs to lysosomes) or alternatively these may control other aspects of cholesterol mobilization from autolysosomes (for macroautophagy) and/or lysosomes (for macro- and micro-lipophagy). Each of these scenarios, not mutually exclusive, would affect the availability of LD-derived cholesterol for efflux. One example is NPC2 and SCARB2. First, SCARB2 was shown to operate in parallel with NPC proteins to promote lysosome cholesterol export [Citation20]. Second, in addition to its known function in lysosomal cholesterol removal, NPC2’s sterol trafficking functions were shown to be vital for the insertion of ergosterol into the yeast vacuolar membrane, a process required for the formation of vacuolar microdomains that enable microlipophagy in yeast [Citation38]. Presently, it is unclear if mammalian lipophagy can also operate through a microautophagic mechanism. However, other putative lipophagy proteins with known roles in lipid metabolism/trafficking may help facilitate lipophagy through similar means as NPC2.
In our study, numerous small GTPases of the RAB family were found in association with foam cell LDs, including RAB18. Excitement surrounding the discovery of Rab18 as a LD-associated protein that may regulate LD catabolism was dampened by more recent findings that Rab18 is not necessary for LD biogenesis or turnover [Citation63,Citation64]. In our study, silencing Rab18 reduced cholesterol efflux, although this did not reach significance (Table S3). Consistent with others [Citation10], another protein that we identified in association with LDs was AUP1 that regulates polyubiquitylation via its CUE domain and binding to UBE2G2 [Citation65]. Gene silencing of both Aup1 and Ube2g2 reduced cholesterol efflux in 3 out of 4 experiments, despite not reaching statistical significance (). Moreover, we observed that the yeast homologs of AUP1 and UBE2G2, Cue1 and Ubc7 respectively, were required for vacuolar entry of Faa4-GFP (). Interestingly, monoubiquitination of AUP1 was reported to promote LD clustering [Citation45], a phenomenon readily observed in macrophage foam cells by fluorescence microscopy ( and ) and electron microscopy (). LD clusters were also readily observed during time-lapse imaging ( and Video S1), indicating that clusters observed during fluorescence and electron microscopy of fixed cells are unlikely to be an artifact of static images. Moreover, LD clusters were readily observed in real-time employing noninvasive label-free optical nanoscopy in mouse pre-adipocytes and in oleic acid-loaded human HeLa cells [Citation66], further negating the possibility that LD clusters are an artifact of fixed cell microscopy and denoting their presence in other cell types in addition to macrophage foam cells. Based on our findings, it is tempting to speculate that AUP1-mediated clustering of LDs into aggresomes could activate an aggrephagy-like mechanism to promote lipophagy and cholesterol efflux ().
Aggrephagy, mitophagy, xenophagy, along with other types of selective autophagy described to date [Citation8] employ SQSTM1 to target ubiquitin-tagged substrate, as observed here for lipophagy ( and Figure S1). For aggrephagy, additional SARs include OPTN, NBR1 and Cue5/TOLLIP, while mitophagy additionally requires Atg32, BNIP3L, OPTN, CALCOCO2, TAX1BP1, BNIP3 (FUNDC1 [FUN14 domain containing 1]), BCL2L13 (BCL2-like 13) and xenophagy additionally requires LGALS8 (galectin 8), OPTN, CALCOCO2, TAX1BP1 and TECPR1 (tectonin beta-propeller repeat containing 1) [Citation8]. Amongst SARs included in our siRNA array (Optn, Nbr1, Calcoco2, Sqstm1, Bnip3l, Tax1bp1), silencing OPTN, NBR1, CALCOCO2 and SQSTM1, but not BNIP3L or TAX1BP1, reduced cholesterol efflux (). Amongst SARs that regulated cholesterol efflux, OPTN, NBR1 and SQSTM1 but not CALCOCO2 appear specific to lipophagy ( and Figure S3), while Cue5 was not required for yeast lipophagy (). However, whether TOLLIP loss of function in macrophage foam cells impairs lipophagy and cholesterol efflux remains to be tested. Collectively, our study identified LD-associated proteins, including molecular chaperones HSP90AA1, HSPB1, HSPA5, HSPH1, HMGB proteins, lysosomal proteins NPC2 and SCARB2, RAB proteins RAB2, RAB5, RAB6, RAB10, RAB13, ubiquitination factors UBE2G2 and AUP1, SARs OPTN, NBR1 and SQSTM1, that regulate cholesterol efflux in macrophage foam cells.
Our current understanding of microautophagy comes almost exclusively from studies in yeast, but limited evidence for microautophagy in mammalian cells suggests a particular lysosomal wrapping mechanism with similar features to that of yeast autophagy, where “wrapping lysosomes” with an elongated morphology (arm-like extensions or invaginations) engulf cytoplasmic cargo [Citation47]. While we observed ubiquitin tagging of LDs along with binding of SQSTM1, OPTN, NBR1 and LC3, pointing to active selective macro-lipophagy in macrophage foam cells ( and Figure S3), we cannot exclude a possible contribution of microlipophagy to LD catabolism and cholesterol efflux. Indeed, electron microscopy revealed microscopic evidence for microlipophagy in lipid-loaded macrophages, where LDs were observed in close apposition to lysosomes that appear to be engulfing the LDs (). Multispectral live-cell imaging previously showed that, under basal conditions, 10% of cellular LDs in COS-7 cells made contact sites with lysosomes [Citation67]. These LD-lysosome contacts increased nearly twofold following nutrient starvation or oleic acid loading, likely reflecting increased lysosomal digestion of LDs under these autophagy-activating conditions [Citation67]. Diffuse GFP-LC3 on LD clusters distinct from punctate GFP-LC3 on autophagosomes frequently observed fusing with lysosomes suggests that LC3-tagged LD clusters may be directly engulfed by lysosomes free of autophagosomes (). The respective contributions of micro- versus macro-lipophagy to LD catabolism in mammalian cells remain to be determined ().
The role of lipophagy in LD catabolism remains controversial. Both lipophagy and canonical autophagy have been suggested to contribute to lipid mobilization during starvation. In the first report of mammalian lipophagy, Singh et al. convincingly showed the tagging of hepatic LDs by LC3 and enrichment of LDs within autophagosomes, highlighting the selectivity of autophagy-mediated LD catabolism under two metabolic extremes: starvation and high-fat diet feeding [Citation3]. Subsequently, we showed that all forms of atherogenic lipoproteins trigger autophagy in macrophages, leading to autophagy-mediated LD catabolism that was dependent on LIPA [Citation2]. However, autophagy was also shown to sustain classical neutral lipolysis pathways during starvation, independent of lipophagy [Citation68]. A reciprocal relationship between autophagy and LDs also exists, where rather than serving as substrates for lipophagy, LDs themselves control autophagosome biogenesis [Citation69,Citation70]. Other examples of indirect regulation of lipid mobilization by autophagy independent of lipophagy include a role for autophagy in the selective clearance of NCOR1 (nuclear receptor co-repressor 1), which suppresses PPARA/PPARα (peroxisome proliferator activated receptor alpha) activation and thus impairs lipid oxidation [Citation71].
The genetic ease of single-cell microorganisms, development of powerful systems biology methods and the remarkable conservation of protein function across eukaryotes have made budding yeast Saccharomyces cerevisiae an ideal model to perform screens to identify regulatory and structural components of autophagy [Citation40]. When yeast cells enter stationary phase lipophagy becomes active and promotes the mobilization of fatty acids from LDs. Directed studies investigating the genetic requirement for yeast lipophagy have identified several genes involved in this process [Citation33,Citation37,Citation39], including ATG8, ATG32, ATG9 and ATG15. Here, we identify several additional genes that control LD turnover in yeast. First, we observed impaired cleavage of Faa4-GFP, an LD marker that undergoes proteolytic processing in the vacuole upon lipophagy, in atg8∆, atg32∆, atg9∆, ypt6∆, ypt31∆ and ssa3∆ strains while cells lacking the autophagy suppressors Por2 and Crn1 conversely exhibited increased Faa4-GFP cleavage (). Quantification of LD entry into the vacuole revealed reduced entry for atg8Δ (LC3), rnp1Δ (CIRBP), ubc7Δ (UBE2G2), cue1Δ (AUP1) and ypt31Δ (RAB2A), while entry was intact but vacuolar LD catabolism was impaired for ypt6Δ (RAB6) and ssa3Δ (HSPA8) (). However, yeast lipophagy did not show a requirement for Cue5 (TOLLIP), a receptor typically required for aggrephagy [Citation8]. Although future studies are needed to further understand the role of candidate lipophagy proteins, particularly in macrophage foam cells, our study shows a unique requirement for several yeast genes including CUE1, UBC7, CRN1, LHS1, RNP1 and NPC2 in lipophagy. These genes were previously shown to not be required for mitophagy [Citation72], highlighting a non-overlapping role for them in regulating lipophagy but not mitophagy.
Macroautophagy is a complex cellular recycling mechanism involving 6 sequential steps: initiation (activation of the ULK1 [unc-51 like autophagy activating kinase 1]-ULK2 complex), nucleation (requiring BECN1-PIK3C3/Vps34-PIK3R4/Vps35 and others), elongation (requiring two ubiquitination-like systems to conjugate PE to LC3), closure of the phagophores (requires RAB5), maturation of autophagosomes (driven by BECN1, lysosomal membrane proteins (e.g. LAMP1, LAMP2), GTP-binding proteins (e.g. RAB7), the cytoskeleton and lysosomal pH), and finally degradation within the lysosome lumen. The entire process also depends on an autophagic lysosome reformation cycle, whereby functional lysosomes are regenerated from autolysosomes to maintain lysosome homeostasis [Citation73]. Lipid hydrolysis within vacuoles or lysosomes critical for the degradation and recycling of autophagic bodies, with defects in lysosomal hydrolysis and efflux having devastating consequences in humans [Citation74]. Here, we identified factors regulating LD catabolism at various steps of this process: HMGB1 and HMGB2 proteins likely working with BECN1 initiate lipophagy, RAB2A likely regulating lipophagy at the maturation stages along with other RAB proteins such as RAB5 and RAB6A, and HSPA8 likely required at the degradation stage, similarly to LIPA. Further mechanistic studies are needed to understand how our identified lipophagy factors function in relation to each other and with other known players of the macro-/microautophagy pathways.
Whether lipolysis and lipophagy are independent or tandem pathways in macrophage foam cells is unknown. Given that LD composition can differ in various cell types, the importance of each pathway may also vary in different tissues. In macrophages loaded with atherogenic lipid, we showed that neutral and acid lipolysis equally contribute to LD catabolism and cholesterol efflux, while this was not the case in non-foamy macrophages that relied entirely on neutral lipolysis [Citation2]. New insight into lipophagy mechanisms reveals that larger hepatic LDs preferentially depend on neutral lipolysis while small LDs undergo lipophagy, whereby PNPLA2 and lipophagy act sequentially [Citation75]. Notably, macrophage foam cell LDs are significantly smaller in size as compared to those found in other cell types such as hepatocytes and adipocytes, likely due to a reduced capacity to expand because of limited fluidity caused by significant sterol enrichment. How distinct forms of modified LDL or lipid loading activate or regulate lipophagy is not well understood. Several studies have shown that lipoprotein-derived cholesterol can undergo intracellular oxidation within lysosomes, leading to increased reactive oxygen species production [Citation76,Citation77]. The later could in turn lead to autophagy activation through increased proapoptotic oxidative or endoplasmic reticulum stress to trigger autophagy in macrophages [Citation78]. Alternatively, lysosomal stress itself could trigger autophagy. Lysosomal stress by treatment of macrophages with oxidized low density lipoprotein or cholesterol crystals was shown to rapidly induce nuclear translocation of TFEB and transcriptional activation of lysosomal-autophagy genes [Citation79]; a similar mechanism could account for agLDL-mediated autophagy activation.
Finally, PLIN2 turnover appears to have distinct roles in the biogenesis and catabolism of LDs. For example, chaperone-mediated autophagy degradation of PLIN2 was suggested to be a pre-requisite before the onset of lipolysis, allowing for access of cytoplasmic neutral lipases such as PNPLA2 to the LD neutral lipid core [Citation56]. On the other hand, a ubiquitin-proteasome pathway that promotes the degradation of soluble/non-LD-bound PLIN2 could limit LD biogenesis [Citation80]. We propose that AUP1- and UBE2G2-mediated ubiquitination of PLIN2 or other protein substrates on the LD initiates the recruitment of a lipophagy complex comprised of SQSTM1, OPTN and NBR1 enabled by lipophagy factors HSPA5, RAB2A, RAB6A, CIRBP and NPC2 (). An aggrephagy-like mechanism allowing for LD clustering may facilitate lipophagy, possibly through microautophagy, although this remains to be confirmed. That the expression of several lipophagy factors identified herein is dysregulated in macrophages during atherosclerosis development () suggests that alterations in lipophagy flux may be a mechanism contributing to atherogenesis. Whether the activity of lipophagy factors in macrophages can be modulated to enhance lipophagy in metabolic diseases remains to be tested. Stimulating lipophagy to promote reverse cholesterol transport and LD catabolism represents an attractive therapeutic strategy to treat heart disease and other metabolic diseases.
Materials and methods
Cell culture
Human THP-1 monocytes (ATCC, TIB-202™) were cultured in RPMI 1640 medium (Gibco, 11875093) supplemented with 10% fetal bovine serum (FBS), 1% penicillin-streptomycin (P/S) (Gibco, 15140122), 2 mM L-glutamine (Gibco, 25030081) and 1 mM pyruvate (Gibco, 11360070). Monocytes were differentiated using 100 nM phorbol 12-myristate 13-acetate (Sigma, P1585-1 MG) treatment for 72 h. Foam cells were generated by incubation with agLDL (50 µg/mL) for 30 h followed by an equilibration period of 24 h with or without 10 µM chloroquine (Sigma, C6628) in RPMI 1640 medium supplemented with 2 mg/mL fatty acid-free bovine serum albumin (BSA; Sigma, A6003). BMDMs were flushed from the femurs of C57BL/6 N (Charles River Laboratories, 027) or GFP-LC3 transgenic mice (Riken, RBRC00806) and differentiated to macrophages by incubation in DMEM medium (Corning, 10013 CV) supplemented with 10% FBS, 1% P/S, and 20% L929-conditioned medium for 7 days. Peritoneal macrophages were harvested 4 days after intra-peritoneal injection of 3% thioglycolate (BD Difco, B243010), as previously described [Citation81] and cultured in DMEM media supplemented with 10% FBS and 1% P/S.
Lipoprotein and APOAI preparation
LDL was isolated by sequential density ultracentrifugation [Citation82] and LDL was aggregated by vortexing, as previously described [Citation83]. Human recombinant APOA1 was synthesized and purified as previously described [Citation84], and confirmed endotoxin free using the Chromogenic Endotoxin Quant Kit (Pierce, A39552).
LD isolation
LDs were isolated from agLDL-loaded THP-1 macrophages by density ultracentrifugation similar to previously described [Citation9]. Briefly, cells from 7–8 15-cm dishes (20x107 cells/dish) were washed with ice cold 1X PBS (0.137 mM NaCl, 2.68 mM KCl, 10.14 mM Na2HPO4, 1.76 mM KH2PO4 in water), resuspended in 2 mL of hypotonic lysis buffer and incubated on ice for 10 min. Cells were lysed by repetitive passaging trough a 25-G needle, and the lysates were mixed with one third volume of 60% sucrose (Invitrogen, 15503–022) solution for a final sucrose concentration of 20% and transferred to a Beckmann polyallomer tube, overlaid with 5 mL of 5% sucrose solution and 5 mL of hypotonic lysis buffer, then spun at 28,000 x g with a SW40 rotor for 30 min. LDs were recovered by aspirating the top buoyant fraction using an 18-G needle attached to a 3-mL syringe.
Tryptic digestion, mass spectrometry and data analysis
LD fractions were de-lipidated as previously [Citation9], and proteins were dried using SpeedVac and resuspended in 8 M urea (MilliporeSigma, U5378-500 G). Sample protein concentrations were determined using the colorimetric Bio-Rad DC Protein Assay (5000111). Equal amounts of protein were reduced with 10 mM dithiothreitol for 30 min at 56°C with agitation. Proteins were alkylated by incubation at room temperature for 30 min with iodoacetamine (MilliporeSigma, I1149-5 G) with agitation. Urea within the samples was diluted to 2 M using 50 mM ammonium bicarbonate (pH 8). Protein samples were then digested using 0.125 g of trypsin (Worthington Biochemical, LS003740) for 5 µg of protein overnight at 37°C with agitation. Prior to desaltation, peptides were diluted in 0.1% (v:v) formic acid and the pH was adjusted to 3.0 by addition of trifluoroacetic acid. Peptide desalting was completed using in-house made C18 desalting cartridges (Dr. Maisch GmbH, r10.aq.) and samples were dried using a SpeedVac (SAVANT SpeedVac Concentrator).
Peptide mixtures were run using high-performance liquid chromatography-electrospray ionization tandem mass spectrometry (HPLC-ESI-MS/MS). An automated Ekspert NanoLC 400 system (Eksigent) coupled to a LTQ Velos Pro Orbitrap Elite mass spectrometer (ThermoFisher Scientific) equipped with a nanoelectrospray interface operated in positive ion mode. Peptide samples were reconstituted in 0.5% (v:v) formic acid and loaded on a silica column packed with reverse phase Magic C18AQ resins (5 μm; 200 Å pore size; Dr. Maisch GmbH, r25.aq.). Peptide separation was done using an analytical column (75 μm × 10 cm) packed with reverse phase beads (3 μm; 120 Å pore size; Dr. Maisch GmbH, r13.aq.). Peptides were eluded with a solution of 5–25% acetonitrile (v:v) containing 0.1% formic acid (v:v) (JT Baker, 983403) for 120 min at a flow rate of 300 nL/min.
Bioinformatics analyses
MSConvert [Citation85] from the ProteoWizard package was used to convert Thermo RAW files to mzML files [Citation86,Citation87]. The resulting mass spectrometry data files were processed using the Trans-Proteomics Pipeline (TPP version 5.0) [Citation88]. A database search was performed on mzML files to match MS/MS spectra to peptide sequences using the Comet algorithm against the UniProt Swiss-Prot database (downloaded in January 2017; number of protein entries = 20,130) [Citation89,Citation90]. The database search space considered tryptic peptides with a maximum of 2 miscleavages. Carbamidomethylation on cysteine was set as a static modification and methionine oxidation as a variable modification. Mass spectra were searched using a mass tolerance of 20 ppm for precursor ions and a fragment ion bin tolerance of 0.05. The mass spectrometry proteomics data have been deposited to the ProteomeXchange Consortium [Citation91] via the PRIDE [Citation92] partner repository with the dataset identifier PXD017511. The confidence of peptide-spectrum matches was then assessed using PeptideProphet [Citation93] and ProteinProphet [Citation94]. Each experiment was filtered to a protein identification false discovery rate < 1% and only proteins identified with two or more peptides were considered for downstream analyses. For sequence motif discovery analysis, protein sequences were analyzed using the MEME suite (MEME version 4.12.0), a motif-based sequence analysis tool [Citation95]. MEME was used to identify sequence motifs that were overrepresented amongst proteins that were abundant in the chloroquine treated samples versus all proteins identified by mass spectrometry. MEME was set to assume motifs could occur at most one time in a protein sequence and to consider motif length ranging from 6 to 50. All reported motifs obtained an E-value < 10−8 as estimated by MEME. Gene Ontology enrichment analysis of the LD proteins enriched following chloroquine treatment was performed using Ontologizer [Citation96], using the entire set of proteins identified in the treated samples as background. For the bubble chart presented in , protein quantification was performed using normalized spectral counts over the entire experiment. Proteins were defined as abundant on LDs of chloroquine-treated cells if present in 2 or 3 replicates of the LD fraction of chloroquine-treated cells, but in 0 or 1 replicate in the LD fraction of untreated cells.
Western blot
For western blotting of LD and cytoplasmic fractions, LD proteins were precipitated with acetone prior to SDS-PAGE. The cytosolic fraction was re-suspended in 2x Laemmli sample buffer (Bio-Rad, 1610737) and denatured by heating at 95°C for 5 min. The LD fraction was re-suspended in Laemmli sample buffer and sonicated at 60°C for 5 h with vortexing every 10 min. For yeast cell extracts, cells were washed twice with ice-cold PBS, and lysed directly in 2x Laemmli sample buffer (Bio-Rad, 1610737) and boiled at 95°C for 15 min. Samples were electrophoresed on 12% TGX Stain-Free™ FastCast™ Acrylamide gels (Bio-Rad, 1610185) with All Blue Precision marker (Bio-Rad, 1610393). Gels were activated and transferred to 0.22 µm or 0.45 µm PVDF membranes for 10 min using the Trans-Blot Turbo Transfer System (Bio-Rad). Stain-free blots were visualized and imaged to be used for protein normalization. Membranes were then blocked in 5% milk in TBST (19.8 mM Tris base, 150 mM NaCl, 0.1% Tween-20 [Fisher Scientific, BP337-100] in water) or PBST (0.137 mM NaCl, 2.68 mM KCl, 10.14 mM Na2HPO4, 1.76 mM KH2PO4, 0.1% Tween-20 in water) for 1 h, washed thrice with TBST or PBST. Membranes were anti-LC3 (1:1000; MBL, PD014), anti-PLIN2 (1:2000; Fitzgerald, 20 R-2604), anti-LAMP1/lysosomal associated membrane protein 1 (1:1000; Novus Biologicals, NBP2-25155), anti-CANX/calnexin (1:1000; Abcam, ab10286), anti-GFP (1:1000; Novus Biologicals, NB600-308) or anti-GAPDH/glyceraldehyde-3-phosphate dehydrogenase (1:5000; Life Technologies, AM4300). Proteins were detected using an enhanced HRP-based chemiluminescence detection system (HRP-conjugated secondary antibodies from Amersham Biosciences [NA934V, NA931V] and Fitzgerald [43 R-ID039hrp]) and Clarity or Clarity Max Chemiluminescence Reagent from Bio-Rad (1705060, 1705062) using a ChemiDoc XRS+ System (Bio-Rad).
Reverse transfection and cholesterol efflux
Peritoneal macrophages were reverse-transfected in a 96-well plate containing a custom siRNA library (High Throughput Biology Laboratory Services, NYU School of Medicine). 1 × 10⁵ cells/well of thioglycolate-elicited peritoneal macrophages were seeded onto wells of a 96-well plate containing Silencer Pre-designed siRNA (Invitrogen) at a final concentration of 30 nM siRNA. Briefly, siRNA plate containing 450 nmol per well of siRNA were thawed from −80°C and centrifuged at 100 x g for 1 min. RNAiMax (0.5 µL; Invitrogen, 13778150) was diluted in 19.5 µL of OPTI-MEM (Gibco, 31985062), and 20 µL/well was added and allowed to complex with siRNA for 20 min at room temperature. Cells (120 µL, 1 × 10⁵ cells/well) were added in OPTI-MEM, plates were centrifuged at 100 x g for 1 min and incubated at 37°C. Twenty-four h post-transfection, 140 µL of 20% FBS media containing 3H-cholesterol (Perkin Elmer, NET139001MC) and agLDL was added into each well (2.5 µCi/mL 3H-cholesterol; 50 µg/mL agLDL). 30 h post-loading and labeling, media was replaced with 2 mg/mL fatty acid-free BSA in DMEM and cells were equilibrated overnight. Cholesterol efflux to APOA1 (50 µg/mL) was carried out for 24 h, following which supernatants were removed and cells were dissolved in 0.5 N NaOH. Aliquots of supernatants and cell lysates were transferred onto 96-well Lumaplates (Perkin Elmer, 6006633), dried overnight and radioactivity within samples was quantified using the Hydex Sense plate reader (Gamble). Cholesterol efflux was calculated as a percentage of 3H-cholesterol in the supernatant/(3H-cholesterol in the supernatant + 3H-cholesterol in cells)x100%. For each experiment (n = 4), fold-change efflux for each siRNA treatment was calculated relative to the average of control wells (scrambled siRNA).
Fluorescence microscopy
Isolated LDs were seeded on 8-well removable chamber slides (Ibidi, 80841) coated with poly-L-lysine (Sigma, P8920) overnight at 4°C and fixed with 4% paraformaldehyde (Alfa Aesar, 433689 M) for 10 min at room temperature. For immunofluorescence (IF) of macrophage foam cells, cells were washed 3X in 1X PBS and fixed in 4% paraformaldehyde for 10 min at 37°C. Cells were blocked/permeabilized for 30 min at room temperature in 5% BSA (Roche, 03116964001), 0.01% Triton X-100 (Fisher BioReagents, BP151100). Cells were incubated with anti-PLIN2 (1:200; Fitzgerald, 20 R-AP002), anti-LC3 (1:750; MBL, PM036), anti-SQSTM1 (1:500; Abnova, H00008878-M01), anti-ubiquitin (1:250; Novus Biologicals, NB300-130), anti-NBR1 (1:250; Cell Signaling Technology, 9891), anti-CALCOCO2 (GeneTex, GTX115378; 1:1250), anti-OPTN (1:250; ThermoFisher Scientific, 711879) for 2 h at 37°C or overnight at 4°C in wash buffer containing 1% BSA, 0.025% saponin (Sigma, S2149). Alexa Fluor or Alexa Fluor Plus antibody conjugates (1:500–1:1000; Invitrogen, A31570, A31571, A32728, A11073, A21435, A21428, A32732, A32795) were incubated for 1 h at 37°C in wash buffer. Cells were incubated with BODIPY 493/503 (10 µg/mL; Invitrogen, D3922) for 30 min at room temperature where indicated to stain neutral lipids. Cells were counterstained with DAPI (Invitrogen, D1306) for 5 minutes at room temperature. Slides were mounted on #1,5 coverslips (Ibidi, 10811) with DAKO mounting media (Agilent, S302380-2). Images were captured on a Zeiss LSM880 confocal microscope with a 63X objective (NA 1.4) using the appropriate lasers and the Airyscan module. Proteins at the surface of LDs were quantified using Fiji’s Multi-point counter tool from raw images or from Tiff image renderings generated in IMARIS (Bitplane) for quantification of LC3 puncta at the surface of single LDs or LD clusters. For yeast imaging, live strains were imaged on microscope slides in the same SC media that they were grown to stationary phase in. Images were captured on a Zeiss LSM880 confocal microscope with a 63X objective (NA 1.4) using the appropriate lasers and the Airyscan module. For fixed cell imaging, yeast strains were fixed according to the Koshland Lab protocol [Citation97] and stained with 1.0 µg/mL BODIPY 493/503 at 30°C for 30 min for subsequent imaging using the CellVoyager CV1000 Disk Confocal Microscope (Olympus Life Science) with a 100X objective using the appropriate lasers. LD entry into vacuoles in wild-type or mutant strains was quantified using Fiji’s Multi-point counter tool.
Bulk RNA-sequencing
The bulk RNA-seq dataset published by Kim et al. [Citation30] was queried for log2FoldChange of our candidate selective lipophagy genes. Briefly, aortic intimal cells from apoe−/− mice fed a high-fat diet (Test Diet, AIN-76A) for 28 weeks were sorted into foamy and non-foamy macrophages and libraries were prepared from cell lysates using the SMARTer Ultra Low RNA Kit for Illumina Sequencing for subsequent amplification and sequencing on an Illumina HiSeq-3000 using single reads extending 50 bases [Citation30].
Yeast experiments
SGA methodology was employed to incorporate the well-established yeast LD marker Faa4-GFP and vacuole marker Vph1-mRuby2 into the yeast non-essential DMA library (Horizon Discovery, YSC1053). A PCR-mediated gene insertion technique was used to add LD (Faa4-GFP) and vacuolar fluorescent tags (Vph1-mRuby2) into the SGA query strain, as previously described [Citation98]. Query strain mutations were confirmed by PCR analysis. Manipulation of the DMA was performed using a Singer RoToR HDA (Singer Instruments). For high-throughput strain construction, the MATα query strain was mated to the MATa deletion mutant array, and SGA methodology was used with specific chemical selection steps on nourseothricin (MJS Biolynx Inc., JBAB102XL) (Faa4-GFP), hygromycin (Wisent Bioproducts, 450–141-XL) (Vph1-mRuby2) and G418 (Wisent Bioproducts, 400–130-IG) (DMA deletion) to select for final haploid strains with each mutation, as previously described [Citation34,Citation35]. The resulting Faa4-GFP/Vph1-mRuby2 deletion strains were grown in SC medium containing 0.17% yeast nitrogen base with 0.5% ammonium sulfate (Wisent Bioproducts, 800–152-LG), 2% dextrose (Wisent Bioproducts, 600–350-DG) and 0.206% complete amino acid mix (contains % by mass: 4.5% serine [Sigma, S4375)], 4.5% arginine [Sigma, A5006], 4.5% glycine [Sigma, G6761], 1% adenine [Sigma, A9126], 4.5% glutamic acid [Sigma, G1626], 4.5% alanine [Sigma, A7627], 9% leucine [Sigma, L8000], 4.5% histidine [Sigma, H8125], 4.5% glutamine [Sigma, G3126], 4.5% threonine [Sigma, T8625], 4.5% asparagine [Sigma, A8381], 4.5% phenylalanine [Sigma, P2126], 4.5% methionine [Sigma, M9625], 4.5% uracil [Sigma, G0750], 4.5% valine [Sigma, V0500], 4.5% isoleucine [Sigma, I2752], 4.5% proline [Sigma, P0380], 4.5% tryptophan [Sigma, T0254], 4.5% tyrosine [Sigma, T3754], 4.5% aspartic acid [Sigma, A9256], 4.5% lysine [Sigma, L5501], 4.5% cysteine [Sigma, C7880]) at 30°C on a tube rotator at 7 x g to stationary phase to stimulate lipophagy, similarly to as previously described [Citation38]. Day 1 and Day 5 time points were defined as the duration of growth following initial inoculation at OD600 = 0.1. Yeast equivalents of mammalian genes were identified using the Human gene to yeast homolog on the YeastMine program found within the Saccharomyces Genome Database and using the OrthoMCL 2.0b6 program. In cases where no yeast equivalent genes were identified by OrthoMCL 2.0b6 and YeastMine, the literature was used to identify close gene equivalents based on structure, function, and protein motifs.
Electron microscopy
Cholesterol-loaded murine BMDMs were fixed in 1.6% glutaraldehyde prior to postfixation in osmium tetroxide and uranyl acetate en bloc staining as previously [Citation2]. Samples were processed and embedded in Spurr epoxy resin (Sigma, EM0300-1KT), sectioned and counterstained with lead citrate, and digital images were obtained using a JEOL 1230 TEM at 60 kV adapted with a 2000 × 2000 pixel bottom mount CCD digital camera and AMT software.
Live cell microscopy
GFP-LC3 BMDMs were incubated with agLDL (50 µg/mL) for 30 h and equilibrated in fatty acid-free BSA DMEM overnight. Cells were stained with Monodansylpentane (Abcepta, SM1000a) and LysoTracker (Invitrogen, L7528) for 30 min at 37°C. Cells were imaged in fatty acid-free BSA FluoroBright DMEM media (Gibco, A1896701) at 37°C and 5% CO2 on a Zeiss LSM880 confocal microscope with a 63X objective (NA 1.4) using the appropriate lasers and the Airyscan module.
Statistical analyses
Experiments were run in triplicates (or n = 4 in some instances), and all presented values are mean ± SEM. The statistical significance of the differences between groups was determined using the two-tailed unpaired Student’s t-test of the means with Prism V8.3.0 software (GraphPad Software Inc).
Supplemental Material
Download Zip (108.6 MB)Acknowledgments
We thank Skye Green and Chloe van Oostende-Triplet from the uOttawa Cell Biology and Image Acquisition Core Facility for her help with the microscopy analysis and the Proteomics Resource Centre of the uOttawa Institute of Systems Biology for their proteomic services. We thank Elizabeth Walden for her assistance and resourcefulness over the course of the yeast experiments. We thank Chi Yun of the High Throughput Biology Laboratory at the New York University School of Medicine for her assistance in designing a custom small interfering RNA mouse library. We thank Gregory Fairn (St Michael’s Hospital) for providing us with the recombinant human apoA-I plasmid and Peter Liu for providing us with mice expressing GFP-LC3. Illustrations were made using BioRender.
Disclosure statement
There are no conflicts of interest to report.
Supplementary material
Supplemental data for this article can be accessed here.
Additional information
Funding
Related Research Data
References
- Sztalryd C, Brasaemle DL. The perilipin family of lipid droplet proteins: gatekeepers of intracellular lipolysis. Biochim Biophys Acta Mol Cell Biol Lipids. 2017;1862(10 Pt B):1221–1232.
- Ouimet M, Franklin V, Mak E, et al. Autophagy regulates cholesterol efflux from macrophage foam cells via lysosomal acid lipase. Cell Metab. 2011;13(6):655–667.
- Singh R, Kaushik S, Wang Y, et al. Autophagy regulates lipid metabolism. Nature. 2009;458(7242):1131–1135.
- De Duve C, Pressman BC, Gianetto R, et al. Tissue fractionation studies. 6. Intracellular distribution patterns of enzymes in rat-liver tissue. Biochem J. 1955;60(4):604–617.
- Ohsumi Y. Historical landmarks of autophagy research. Cell Res. 2014;24(1):9–23.
- Li WW, Li J, Bao JK. Microautophagy: lesser-known self-eating. Cell Mol Life Sci. 2012;69(7):1125–1136.
- Birgisdottir AB, Lamark T, Johansen T. The LIR motif - crucial for selective autophagy. J Cell Sci. 2013;126(Pt 15):3237–3247.
- Farre JC, Subramani S. Mechanistic insights into selective autophagy pathways: lessons from yeast. Nat Rev Mol Cell Biol. 2016;17(9):537–552.
- Brasaemle DL, Wolins NE. Isolation of lipid droplets from cells by density gradient centrifugation. Curr Protoc Cell Biol. 2016;72:3 15 1–3 15 13.
- Bersuker K, Peterson CWH, To M, et al. A proximity labeling strategy provides insights into the composition and dynamics of lipid droplet proteomes. Dev Cell. 2018;44(1):97–112 e7.
- Brasaemle DL, Dolios G, Shapiro L, et al. Proteomic analysis of proteins associated with lipid droplets of basal and lipolytically stimulated 3T3-L1 adipocytes. J Biol Chem. 2004;279(45):46835–46842.
- D’Aquila T, Sirohi D, Grabowski JM, et al. Characterization of the proteome of cytoplasmic lipid droplets in mouse enterocytes after a dietary fat challenge. PLoS One. 2015;10(5):e0126823.
- Khor VK, Ahrends R, Lin Y, et al. The proteome of cholesteryl-ester-enriched versus triacylglycerol-enriched lipid droplets. PLoS One. 2014;9(8):e105047.
- Kramer DA, Quiroga AD, Lian J, et al. Fasting and refeeding induces changes in the mouse hepatic lipid droplet proteome. J Proteomics. 2018;181:213–224.
- Larsson S, Resjö S, Gomez MF, et al. Characterization of the lipid droplet proteome of a clonal insulin-producing β-cell line (INS-1 832/13). J Proteome Res. 2012;11(2):1264–1273.
- Liu M, Ge R, Liu W, et al. Differential proteomics profiling identifies LDPs and biological functions in high-fat diet-induced fatty livers. J Lipid Res. 2017;58(4):681–694.
- Wang W, Wei S, Li L, et al. Proteomic analysis of murine testes lipid droplets. Sci Rep. 2015;5(1):12070.
- Weibel GL, Joshi MR, Jerome WG, et al. Cytoskeleton disruption in J774 macrophages: consequences for lipid droplet formation and cholesterol flux. Biochim Biophys Acta. 2012;1821(3):464–472.
- Choi HY, Ruel I, Malina A, et al. Desmocollin 1 is abundantly expressed in atherosclerosis and impairs high-density lipoprotein biogenesis. Eur Heart J. 2018;39(14):1194–1202.
- Heybrock S, Kanerva K, Meng Y, et al. Lysosomal integral membrane protein-2 (LIMP-2/SCARB2) is involved in lysosomal cholesterol export. Nat Commun. 2019;10(1):3521.
- Koren I, Reem E, Kimchi A. Autophagy gets a brake: DAP1, a novel mTOR substrate, is activated to suppress the autophagic process. Autophagy. 2010;6(8):1179–1180.
- Martina JA, Chen Y, Gucek M, et al. MTORC1 functions as a transcriptional regulator of autophagy by preventing nuclear transport of TFEB. Autophagy. 2012;8(6):903–914.
- The Gene Ontology, C. Expansion of the Gene Ontology knowledgebase and resources. Nucleic Acids Res. 2017;45(D1):D331–D338.
- An Y, Zhang Z, Shang Y, et al. miR-23b-3p regulates the chemoresistance of gastric cancer cells by targeting ATG12 and HMGB2. Cell Death Dis. 2015;6(5):e1766.
- Nuchel J, Ghatak S, Zuk AV, et al. TGFB1 is secreted through an unconventional pathway dependent on the autophagic machinery and cytoskeletal regulators. Autophagy. 2018;14(3):465–486.
- Pascua-Maestro R, Diez-Hermano S, Lillo C, et al. Protecting cells by protecting their vulnerable lysosomes: identification of a new mechanism for preserving lysosomal functional integrity upon oxidative stress. PLoS Genet. 2017;13(2):e1006603.
- Li Z, Fan EK, Liu J, et al. Cold-inducible RNA-binding protein through TLR4 signaling induces mitochondrial DNA fragmentation and regulates macrophage cell death after trauma. Cell Death Dis. 2017;8(5):e2775.
- Kaur J, Debnath J. Autophagy at the crossroads of catabolism and anabolism. Nat Rev Mol Cell Biol. 2015;16(8):461–472.
- Marshall RS, Hua Z, Mali S, et al. ATG8-Binding UIM Proteins Define a New Class of Autophagy Adaptors and Receptors. Cell. 2019;177(3):766–781 e24.
- Kim K, Shim D, Lee JS, et al. Transcriptome analysis reveals nonfoamy rather than foamy plaque macrophages are proinflammatory in atherosclerotic murine models. Circ Res. 2018;123(10):1127–1142.
- Monahan Z, Shewmaker F, Pandey UB. Stress granules at the intersection of autophagy and ALS. Brain Res. 2016;1649(Pt B):189–200.
- Zhong P, Huang H. Recent progress in the research of cold-inducible RNA-binding protein. Future Sci OA. 2017;3(4):FSO246.
- van Zutphen T, Todde V, de Boer R, et al. Lipid droplet autophagy in the yeast Saccharomyces cerevisiae. Mol Biol Cell. 2014;25(2):290–301.
- Tong AH, Evangelista M, Parsons AB, et al. Systematic genetic analysis with ordered arrays of yeast deletion mutants. Science. 2001;294(5550):2364–2368.
- Tong AH, Lesage G, Bader GD, et al. Global mapping of the yeast genetic interaction network. Science. 2004;303(5659):808–813.
- Cristobal-Sarramian A, Radulovic M, Kohlwein SD. Methods to measure lipophagy in yeast. Methods Enzymol. 2017;588:395–412.
- Maeda Y, Oku M, Sakai Y. A defect of the vacuolar putative lipase Atg15 accelerates degradation of lipid droplets through lipolysis. Autophagy. 2015;11(8):1247–1258.
- Tsuji T, Fujimoto M, Tatematsu T, et al. Niemann-Pick type C proteins promote microautophagy by expanding raft-like membrane domains in the yeast vacuole. Elife. 2017;6. DOI:10.7554/eLife.25960
- Wang CW, Miao YH, Chang YS. A sterol-enriched vacuolar microdomain mediates stationary phase lipophagy in budding yeast. J Cell Biol. 2014;206(3):357–366.
- Munakata N, Klionsky DJ. “Autophagy suite”: Atg9 cycling in the cytoplasm to vacuole targeting pathway. Autophagy. 2010;6(6):679–685.
- Seo AY, Lau PW, Feliciano D, et al. AMPK and vacuole-associated Atg14p orchestrate mu-lipophagy for energy production and long-term survival under glucose starvation. Elife. 2017;6. DOI:10.7554/eLife.21690
- Jayachandran R, Sundaramurthy V, Combaluzier B, et al. Survival of mycobacteria in macrophages is mediated by coronin 1-dependent activation of calcineurin. Cell. 2007;130(1):37–50.
- Yuan J, Zhang Y, Sheng Y, et al. MYBL2 guides autophagy suppressor VDAC2 in the developing ovary to inhibit autophagy through a complex of VDAC2-BECN1-BCL2L1 in mammals. Autophagy. 2015;11(7):1081–1098.
- Doi A, Fujimoto A, Sato S, et al. Chemical genomics approach to identify genes associated with sensitivity to rapamycin in the fission yeast Schizosaccharomyces pombe. Genes Cells. 2015;20(4):292–309.
- Lohmann D, Spandl J, Stevanovic A, et al. Monoubiquitination of ancient ubiquitous protein 1 promotes lipid droplet clustering. PLoS One. 2013;8(9):e72453.
- Shibutani ST, Yoshimori T. A current perspective of autophagosome biogenesis. Cell Res. 2014;24(1):58–68.
- Mijaljica D, Prescott M, Devenish RJ. Microautophagy in mammalian cells: revisiting a 40-year-old conundrum. Autophagy. 2011;7(7):673–682.
- Olzmann JA, Carvalho P. Dynamics and functions of lipid droplets. Nat Rev Mol Cell Biol. 2019;20(3):137–155.
- Moeller CH, Thomson WW. Uptake of lipid bodies by the yeast vacuole involving areas of the tonoplast depleted of intramembranous particles. J Ultrastruct Res. 1979;68(1):38–45.
- Mizushima N, Yoshimori T, Ohsumi Y. The role of Atg proteins in autophagosome formation. Annu Rev Cell Dev Biol. 2011;27:107–132.
- Wang L, Zhou J, Yan S, et al. Ethanol-triggered lipophagy requires SQSTM1 in AML12 hepatic cells. Sci Rep. 2017;7(1):12307.
- Yan Y, Wang H, Wei C, et al. HDAC6 regulates lipid droplet turnover in response to nutrient deprivation via p62-mediated selective autophagy. J Genet Genomics. 2019;46(4):221–229.
- Lam T, Harmancey R, Vasquez H, et al. Reversal of intramyocellular lipid accumulation by lipophagy and a p62-mediated pathway. Cell Death Discov. 2016;2:16061.
- Llorente-Cortes V, Badimon L. LDL receptor-related protein and the vascular wall: implications for atherothrombosis. Arterioscler Thromb Vasc Biol. 2005;25(3):497–504.
- Tsai T-H, Chen E, Li L, et al. The constitutive lipid droplet protein PLIN2 regulates autophagy in liver. Autophagy. 2017;13(7):1130–1144.
- Kaushik S, Cuervo AM. AMPK-dependent phosphorylation of lipid droplet protein PLIN2 triggers its degradation by CMA. Autophagy. 2016;12(2):432–438.
- Mejhert N, Kuruvilla L, Gabriel KR, et al. Partitioning of MLX-family transcription factors to lipid droplets regulates metabolic gene expression. Mol Cell. 2020;77(6):1251–1264.e9.
- Wong ES, Tan JMM, Soong W-E, et al. Autophagy-mediated clearance of aggresomes is not a universal phenomenon. Hum Mol Genet. 2008;17(16):2570–2582.
- Kwon DH, Kim L, Song HK. pH-dependent regulation of SQSTM1/p62 during autophagy. Autophagy. 2019;15(1):180–181.
- Chou TF, Deshaies RJ. Development of p97 AAA ATPase inhibitors. Autophagy. 2011;7(9):1091–1092.
- Jia H, Liang Z, Zhang X, et al. 14-3-3 proteins: an important regulator of autophagy in diseases. Am J Transl Res. 2017;9(11):4738–4746.
- Jia B, Wu Y, Zhou Y. 14-3-3 and aggresome formation: implications in neurodegenerative diseases. Prion. 2014;8(2):173–177.
- Martin S, Driessen K, Nixon SJ, et al. Regulated localization of Rab18 to lipid droplets: effects of lipolytic stimulation and inhibition of lipid droplet catabolism. J Biol Chem. 2005;280(51):42325–42335.
- Jayson CBK, Arlt H, Fischer AW, et al. Rab18 is not necessary for lipid droplet biogenesis or turnover in human mammary carcinoma cells. Mol Biol Cell. 2018;29(17):2045–2054.
- Spandl J, Lohmann D, Kuerschner L, et al. Ancient ubiquitous protein 1 (AUP1) localizes to lipid droplets and binds the E2 ubiquitin conjugase G2 (Ube2g2) via its G2 binding region. J Biol Chem. 2011;286(7):5599–5606.
- Sandoz P.A., Image-based analysis of living mammalian cells using label-free. 3D refractive index maps reveals new organelle dynamics and dry mass flux. PLoS Biol: 2019;17(12):e3000553.
- Valm AM, Cohen S, Legant WR, et al. Applying systems-level spectral imaging and analysis to reveal the organelle interactome. Nature. 2017;546(7656):162–167.
- Rambold AS, Cohen S, Lippincott-Schwartz J. Fatty acid trafficking in starved cells: regulation by lipid droplet lipolysis, autophagy, and mitochondrial fusion dynamics. Dev Cell. 2015;32(6):678–692.
- Deretic V. Autophagosomes and lipid droplets: no longer just chewing the fat. Embo J. 2015;34(16):2111–2113.
- Shpilka T, Welter E, Borovsky N, et al. Lipid droplets and their component triglycerides and steryl esters regulate autophagosome biogenesis. Embo J. 2015;34(16):2117–2131.
- Saito T, Kuma A, Sugiura Y, et al. Autophagy regulates lipid metabolism through selective turnover of NCoR1. Nat Commun. 2019;10(1):1567.
- Kanki T, Wang K, Baba M, et al. A genomic screen for yeast mutants defective in selective mitochondria autophagy. Mol Biol Cell. 2009;20(22):4730–4738.
- Chen Y, Yu L. Development of research into autophagic lysosome reformation. Mol Cells. 2018;41(1):45–49.
- Parzych KR, Klionsky DJ. Vacuolar hydrolysis and efflux: current knowledge and unanswered questions. Autophagy. 2019;15(2):212–227.
- Schott MB, Weller SG, Schulze RJ, et al. Lipid droplet size directs lipolysis and lipophagy catabolism in hepatocytes. J Cell Biol. 2019;218(10):3320–3335.
- Ahmad F, Leake DS. Lysosomal oxidation of LDL alters lysosomal pH, induces senescence, and increases secretion of pro-inflammatory cytokines in human macrophages. J Lipid Res. 2019;60(1):98–110.
- Wen Y, Leake DS. Low density lipoprotein undergoes oxidation within lysosomes in cells. Circ Res. 2007;100(9):1337–1343.
- Liao X, Sluimer JC, Wang Y, et al. Macrophage autophagy plays a protective role in advanced atherosclerosis. Cell Metab. 2012;15(4):545–553.
- Emanuel R, Sergin I, Bhattacharya S, et al. Induction of lysosomal biogenesis in atherosclerotic macrophages can rescue lipid-induced lysosomal dysfunction and downstream sequelae. Arterioscler Thromb Vasc Biol. 2014;34(9):1942–1952.
- Xu G, Sztalryd C, Lu X, et al. Post-translational regulation of adipose differentiation-related protein by the ubiquitin/proteasome pathway. J Biol Chem. 2005;280(52):42841–42847.
- Gallily R, Feldman M. The role of macrophages in the induction of antibody in x-irradiated animals. Immunology. 1967;12(2):197–206.
- Havel RJ, Eder HA, Bragdon JH. The distribution and chemical composition of ultracentrifugally separated lipoproteins in human serum. J Clin Invest. 1955;34(9):1345–1353.
- Otero-Vinas M, Llorente-Cortés V, Peña E, et al. Aggregated low density lipoproteins decrease metalloproteinase-9 expression and activity in human coronary smooth muscle cells. Atherosclerosis. 2007;194(2):326–333.
- Fung KY, Wang C, Nyegaard S, et al. SR-BI mediated transcytosis of HDL in brain microvascular endothelial cells is independent of caveolin, clathrin, and PDZK1. Front Physiol. 2017;8:841.
- Adusumilli R, Mallick P. Data Conversion with ProteoWizard msConvert. Methods Mol Biol. 2017;1550:339–368.
- Kessner D, Chambers M, Burke R, et al. ProteoWizard: open source software for rapid proteomics tools development. Bioinformatics. 2008;24(21):2534–2536.
- Pedrioli PG. Trans-proteomic pipeline: a pipeline for proteomic analysis. Methods Mol Biol. 2010;604:213–238.
- Deutsch EW, Mendoza L, Shteynberg D, et al. A guided tour of the trans-proteomic pipeline. Proteomics. 2010;10(6):1150–1159.
- Eng JK, Jahan TA, Hoopmann MR. Comet: an open-source MS/MS sequence database search tool. Proteomics. 2013;13(1):22–24.
- The UniProt C. UniProt: the universal protein knowledgebase. Nucleic Acids Res. 2017;45(D1):D158–D169.
- Deutsch EW, Csordas A, Sun Z, et al. The ProteomeXchange consortium in 2017: supporting the cultural change in proteomics public data deposition. Nucleic Acids Res. 2017;45(D1):D1100–D1106.
- Perez-Riverol Y, Csordas A, Bai J, et al. The PRIDE database and related tools and resources in 2019: improving support for quantification data. Nucleic Acids Res. 2019;47(D1):D442–D450.
- Keller A, Nesvizhskii AI, Kolker E, et al. Empirical statistical model to estimate the accuracy of peptide identifications made by MS/MS and database search. Anal Chem. 2002;74(20):5383–5392.
- Nesvizhskii AI, Keller A, Kolker E, et al. A statistical model for identifying proteins by tandem mass spectrometry. Anal Chem. 2003;75(17):4646–4658.
- Bailey TL, Elkan C. Fitting a mixture model by expectation maximization to discover motifs in biopolymers. Proc Int Conf Intell Syst Mol Biol. 1994;2:28–36.
- Bauer S, Grossmann S, Vingron M, et al. Ontologizer 2.0–a multifunctional tool for GO term enrichment analysis and data exploration. Bioinformatics. 2008;24(14):1650–1651.
- Lab K GFP fixation in yeast. 2020. Available from: http://mcb.berkeley.edu/labs/koshland/Protocols/MICROSCOPY/gfpfix.html
- Longtine MS, Mckenzie III A, Demarini DJ, et al. Additional modules for versatile and economical PCR-based gene deletion and modification in Saccharomyces cerevisiae. Yeast. 1998;14(10):953–961.