
 ?Mathematical formulae have been encoded as MathML and are displayed in this HTML version using MathJax in order to improve their display. Uncheck the box to turn MathJax off. This feature requires Javascript. Click on a formula to zoom.
ABSTRACT
PINK1 and PRKN, which cause Parkinson disease when mutated, form a quality control mitophagy pathway that is well-characterized in cultured cells. The extent to which the PINK1-PRKN pathway contributes to mitophagy in vivo, however, is controversial. This is due in large part to conflicting results from studies using one of two mitophagy reporters: mt-Keima or mito-QC. Studies using mt-Keima have generally detected PINK1-PRKN mitophagy in vivo, whereas those using mito-QC generally have not. Here, we directly compared the performance of mito-QC and mt-Keima in cell culture and in mice subjected to a PINK1-PRKN activating stress. We found that mito-QC was less sensitive than mt-Keima for mitophagy, and that this difference was more pronounced for PINK1-PRKN mitophagy. These findings suggest that mito-QC’s poor sensitivity may account for conflicting reports of PINK1-PRKN mitophagy in vivo and caution against using mito-QC as a reporter for PINK1-PRKN mitophagy.
Abbreviations: DFP: deferiprone; EE: exhaustive exercise; FBS: fetal bovine serum; OAQ: oligomycin, antimycin, and Q-VD-OPH; OMM: outer mitochondrial membrane; PBS: phosphate-buffered saline; PD: Parkinson disease; UPS: ubiquitin-proteasome system.
Introduction
Mitophagy is a form of selective macroautophagy/autophagy, in which a mitochondrion is captured in an autophagosome and delivered to a lysosome for degradation [Citation1]. The cell may employ mitophagy to reduce mitochondrial numbers, as in programmed mitophagy, or may specifically target damaged mitochondria for replacement with healthy mitochondria, as in quality control mitophagy.
The best characterized quality control mitophagy pathway is formed by PINK1 (PTEN induced kinase 1) and PRKN (parkin RBR E3 ubiquitin protein ligase). Loss of function mutations in PRKN or PINK1 are the most common cause of recessive PD. In response to mitochondrial damage, PINK1 accumulates on the outer mitochondrial membrane (OMM), where it phosphorylates both ubiquitin and PRKN [Citation2–8]. PRKN, co-activated by phosphorylation and phospho-ubiquitin binding, ubiquitinates additional OMM proteins. Some of these OMM proteins, which are anchored by transmembrane domains, are extracted from the membrane and degraded by the ubiquitin-proteasome system [Citation9–12]. Other ubiquitinated OMM proteins, like the beta-barrel VDAC (voltage dependent anion channel) proteins, remain in the membrane and recruit the autophagy receptors OPTN (optineurin) and CALCOCO2 (calcium binding and coiled-coil domain 2) [Citation3,Citation13–15]. These, in turn, initiate autophagosome formation around the damaged mitochondrion and deliver it to an acidic lysosome for degradation.
Although the PINK1-PRKN pathway is well-characterized in cultured cells, the extent to which it contributes to mitophagy in vivo is controversial. This is in part because of conflicting results from studies using two recently developed fluorescent protein-based mitophagy reporters, mito-QC and mt-Keima [Citation16–21]. Those studies using primarily the mito-QC reporter have detected little PINK1-PRKN mitophagy in transgenic fruit flies or mice, whereas those using the mt-Keima reporter have observed a robust increase in PINK1-PRKN mitophagy with aging and mitochondrial stress [Citation19–25]. These conflicting results could be due to methodological differences in the studies unrelated to the reporters. Alternatively, they may be due to different sensitivities of the reporters for PINK1-PRKN mitophagy. A systematic comparison of the reporters, however, is lacking.
Here, we directly compared the sensitivities of mito-QC and mt-Keima for PINK1-PRKN mitophagy in cell culture and in vivo. We found that the mito-QC reporter was less sensitive than mt-Keima in cell culture, and that this difference was more pronounced for PINK1-PRKN mitophagy. Additionally, we found that mt-Keima and not mito-QC readily detects a two-fold increase in PINK1-PRKN mitophagy in vivo, in mice challenged with exhaustive exercise (EE). These findings suggest that the relative sensitivities of mito-QC and mt-Keima may account for the conflicting reports of PINK1-PRKN mitophagy in vivo and caution against using mito-QC as a reporter for PINK1-PRKN mitophagy.
Results
The pH sensitivities of mt-Keima and mito-QC reporters distinguish free mitochondria from mitochondria in lysosomes (mito-lysosomes) by distinct mechanisms (). mt-Keima has dual excitation peaks in its protonated and deprotonated states, providing a ratiometric and reversible measure of pH. mito-QC, by contrast, contains tandem fluorescent proteins with differential and irreversible sensitivities to pH: both EGFP and mCherry fluoresce on free mitochondria, but the pH sensitive EGFP is quenched and degraded in mito-lysosomes. Thus, mito-lysosomes have only mCherry fluorescence, while free mitochondria have both EGFP and mCherry fluorescence. The two reporters also differ in their targeting to mitochondria. mito-QC is targeted to the outer mitochondrial membrane (OMM) by the C-terminal targeting signal of FIS1 (fission, mitochondrial 1). By contrast, mt-Keima is targeted to the mitochondrial matrix by the N-terminal targeting signal of COX8A (cytochrome c oxidase subunit 8A).
Figure 1. The mitophagy reporter mt-Keima is more sensitive than mito-QC in cell culture. (A) Schematic depiction of the ratiometric mitophagy reporters mt-Keima (left) and mito-QC (right). mt-Keima has its excitation maxima near 488 nm at pH 8 and near 561 nm at pH 4, differentiating free mitochondria (Mito) from mito-lysosomes (MitoLyso). mito-QC is excited at two maxima near 488 nm and 561 nm in free mitochondria and only one near 561 nm in mito-lysosomes. (B) Primary fibroblast whole cell lysates (WCL) from mito-QC and mt-Keima transgenic mice were separated into cytosolic (Cyto) and crude mitochondrial fractions (Mito) by differential centrifugation. The percentage of each fraction loaded is indicated. Additionally, the band intensity of each fluorescent protein (FP) is reported, as is the ratio of band intensity to % loaded (normalized in each case to WCL values). HSP90 serves as a cytosolic marker. Mitochondrial markers include inner membrane proteins (NDUFB8/NADH:ubiquinone oxidoreductase subunit B8 and SDHB/succinate dehydrogenase complex iron sulfur subunit B), the intermembrane space protein CYCS, and the outer membrane protein TOMM70. The experiment was performed twice with similar results. (C – E) HeLa cells stably expressing HA-PRKN and either mt-Keima (C) or mito-QC (D) were treated with vehicle (blue), DFP for 24 h (red), or OAQ for 6 h (green). Fluorescence was measured by flow cytometry. The histogram depicts the ratiometric fluorescence for single cell events for mt-Keima (C, top) or mito-QC (D, top). The bimodal distribution of the OAQ graph likely reflects cells with (arrow) or without (arrowhead) PRKN exogenous expression. (E) Graph shows ratiometric fluorescence for each reporter in response to vehicle, DFP, or OAQ, as a percentage of vehicle. Data reflect a total of three biological replicates performed on two separate occasions. (C, D, F, and G) Primary mouse fibroblasts stably expressing BFP-PRKN and either mt-Keima or mito-QC were treated as in (C – E). The histogram depicts the ratiometric fluorescence for single cell events for mt-Keima (C, bottom) or mito-QC (D, bottom). (F) Graph shows ratio for each reporter in response to vehicle, DFP, or OAQ, as a percentage of vehicle. (G) Graph depicts fold change (FC) of EGFP, mCherry (mCh), or their ratio for mito-QC (left side of graph), or pH 8, pH 4, or their ratio for mt-Keima (right side of graph). Data reflect a total of three biological replicates performed on two separate occasions. “ns” indicates not significant, “*” indicates p-value < 0.05, “**” indicates p-value < 0.01, and “***” indicates p-value < 0.001 after correction for multiple comparisons. Error bars represent standard error of the mean. (H) Mitophagy was measured in HeLa cells co-expressing BFP-PRKN and the indicated mitophagy reporter by flow cytometry (schematic on top), using a CellStream flow cytometer with a more sensitive detector. The cells were gated for low or high BFP-PRKN expression, using the same BFP acquisition settings for all samples (example histogram shown lower left). Graph on lower right shows the ratio of the pH 4 over pH 8 for AO treated cells as a percent of the not treated sample (NT). At least five biological replicates were performed on at least two occasions. “*” indicates p-value < 0.001 after correction for multiple comparisons
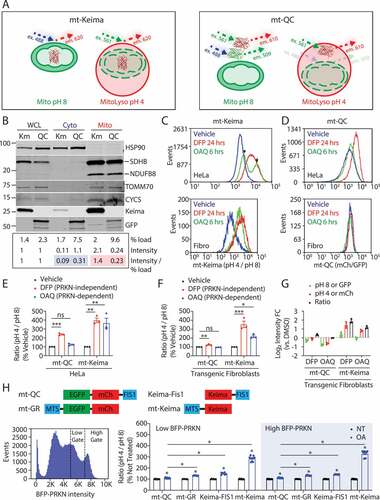
To directly compare the sensitivities of mt-Keima and mito-QC reporters in cultured cells, we established HeLa cell lines stably expressing one of the two reporters and primary fibroblasts from mito-Keima and mito-QC transgenic mice. All cell lines were stably transduced with PRKN to allow assessment of both PINK1-PRKN-dependent and -independent mitophagy pathways (Fig. S1A-D). These stable lines were polyclonal and expressed PRKN in many but not all cells.
HA-PRKN expression and activity were found to be similar in the HeLa lines, as indicated by similar degradation of the inner mitochondrial membrane protein MT-CO2 (mitochondrially encoded cytochrome c oxidase II), following activation of PRKN by depolarization (with oligomycin, antimycin, and Q-VD-OPh (OAQ)) (Fig. S1A – C). Iron chelation with deferiprone (DFP) also had a similar effect on MAP1LC3B (microtubule associated protein 1 light chain 3 beta) levels in both cell lines (Fig. S1A-C). This confirms that PRKN-dependent and -independent mitophagy occurs to a similar extent in both reporter cell lines.
As expected, mt-Keima was targeted primarily to the mitochondrial matrix, whereas mito-QC was targeted to the OMM in HeLa cells (Fig. S1E). mito-QC targeting, however, was incomplete, with substantial mito-QC mistargeted to the cytosol in comparison to mt-Keima and endogenous MT-CO2 (Fig. S1F). Importantly, the same observation was made in primary fibroblasts from mito-QC transgenic mice, in which the majority of mito-QC was in the cytosolic fraction, whereas the majority of mt-Keima was in the mitochondrial fraction (). Integrity of the mitochondrial fraction appeared to be preserved, as low levels of the mitochondrial intermembrane space protein CYCS (cytochrome c, somatic) and the outer membrane protein TOMM70 (translocase of outer mitochondrial membrane 70) appeared in the cytosolic fraction. These localizations were confirmed by confocal microscopy; cytoplasmic signal over background was observed for mito-QC but not mt-Keima in fibroblasts (Fig. S1A). The incomplete localization of mito-QC did not appear to be due to reporter truncation from proteolytic cleavage or improper translation, as the predominant mito-QC band, detected with GFP and mCherry antibodies, migrated at ~60 kDa (Fig. S2B). Thus, a substantial proportion of mito-QC is mistargeted to the cytosol, whereas the majority of mt-Keima is correctly targeted to the mitochondrial matrix.
We next compared the reporters’ sensitivity to PRKN-dependent and PRKN-independent stressors by flow cytometry, which provides an unbiased, quantitative measure of fluorescence in single cells. In HeLa cells, both reporters increased their pH 4:pH 8 ratios in response to a PRKN-independent stressor, iron chelation with DFP for 24 h [Citation18]. The increase was approximately 4-fold for mt-Keima compared to 2-fold for mito-QC. mt-Keima ratios similarly increased nearly 4-fold following a PRKN-dependent stressor (OAQ for 6 h) (). By contrast, the 1.2-fold increase in mito-QC signal with OAQ did not reach significance. A similar pattern was observed for primary fibroblasts from mt-Keima and mito-QC transgenic mice (). mt-Keima increased more than mito-QC in response to both PRKN-dependent and -independent stressors. Together these findings demonstrate that mt-Keima is more sensitive than mito-QC in cell culture, especially for PRKN-dependent mitophagy.
It was recently reported that mito-QC is degraded by PRKN [Citation26]. Consistent with this report, we observed decreased EGFP and mCherry fluorescence of mito-QC in response to OAQ (). Also consistently, we found that the decrease was blocked by the proteasome inhibitor lactacystin, suggesting that mito-QC is degraded by the proteasome (Fig. S2C). mito-QC degradation was similarly blocked by CB-5083, an inhibitor of VCP (valosin containing protein). This suggests that VCP removes mito-QC from the membrane prior to degradation by the proteasome (Fig. S2C). Following treatment with OA, mito-QC also exhibited mislocalization to the nuclear envelope and cytosolic puncta (Fig. S2D, arrows and arrowheads, respectively).
mt-Keima may be more sensitive than mito-QC because it uses mKeima rather than tandem EGFP-mCherry or because it is targeted to the mitochondrial matrix rather than the outer mitochondrial membrane. To distinguish between these possibilities, we generated four additional HeLa cell lines: two with mKeima directed either to the mitochondrial matrix (mt-Keima) or to the outer mitochondrial membrane (Keima-FIS1), and two with tandem EGFP-mCherry targeted to either the mitochondrial matrix (mito-GR) or the outer mitochondrial membrane (mito-QC) (). All cell lines were also transduced with BFP-PRKN. Gating on BFP allowed us to match PRKN expression more precisely among the reporter cell lines. Additionally, a flow cytometer with a more sensitive detector (charge-coupled device camera rather than photomultiplier tube) was used for this set of experiments, which enabled us to reliably detect smaller increases in mitophagy.
In high BFP-PRKN expressing cells, a significant increase was observed for both mt-Keima and mito-QC lines (). However, the increase was greater for mt-Keima compared to mito-QC: mt-Keima increased 229% and mito-QC increased 11%, compared to untreated cells. Cells gated for low PRKN expression had the same pattern of results for mt-Keima and mito-QC (185% vs. 11% increase). Confocal microscopy verified that BFP-PRKN was expressed in both cell lines and was recruited to mitochondria in response to OA as expected (Fig. S2D). These results also confirmed that the difference in cell line response is due to the reporter and not differences in PRKN expression between the lines.
Next, we compared the mito-QC line to the mito-GR and Keima-FIS1 lines. Both lines localized to mitochondria as expected (Fig. S2E). Notably, both mito-GR and Keima-FIS1 reporter lines had a larger response than mito-QC (32% vs. 11% and 42% vs. 11% increase, respectively) in high BFP-PRKN expressing cells (). All lines were less responsive than mt-Keima. These findings suggest that the choice of fluorescent protein and its targeting both contribute to the superior performance of mt-Keima over mito-QC.
We next compared mt-Keima and mito-QC in vivo, using an exhaustive exercise (EE) protocol, which we recently showed activates PINK1-PRKN mitophagy in the mouse heart [Citation24]. The protocol consists of three days of acclimation on the treadmill followed by three days of running until exhaustion (). Cardiac tissue was imaged ex vivo one hour after the final run.
Figure 2. Mt-Keima detects PINK1-dependent mitophagy in vivo. (A) Schematic depicts the exhaustive exercise protocol. In the run group, mice were trained on the treadmill for 3 days, rested for 0–2 days, and then run to exhaustion for 3 days. In the sedentary group, mice were left in the home cage. Mice were sacrificed one hour after the end of the protocol and the hearts were immediately imaged ex vivo. (B and D) mt-Keima mice were subjected to the protocol described in (A) and their hearts imaged ex vivo by confocal microscopy. Mitochondria appeared as regularly spaced oval shaped structures in rows along the myofibril and were excited preferentially by the 488 nm laser (i.e., mt-Keima [pH 8]) (box in Figure 2B, inset). Mitolysosomes, by contrast, were round structures clustered in the perinuclear region (arrows in Figure 2B, inset) or scattered along the myofibril (arrowheads in Figure 2B, inset). 3 mice per group were analyzed. (C) Heart of sedentary mt-Keima mouse was drop fixed in 4% paraformaldehyde and immunostained for LAMP1. (E) mt-Keima mice were run as in (B and D) but the final run was stopped at 40 min. 3 mice were in the sedentary group and 4 mice in the run group. (F) mt-Keima; pink1+/+ and mt-Keima; pink1−/- littermates were treated as in (B and E). “ns” indicates not significant, “*” indicates p-value < 0.05, and “**” indicates p-value < 0.01 after correction for multiple comparisons. Error bars represent standard error of the mean. Scale bars in all images: 20 μm
![Figure 2. Mt-Keima detects PINK1-dependent mitophagy in vivo. (A) Schematic depicts the exhaustive exercise protocol. In the run group, mice were trained on the treadmill for 3 days, rested for 0–2 days, and then run to exhaustion for 3 days. In the sedentary group, mice were left in the home cage. Mice were sacrificed one hour after the end of the protocol and the hearts were immediately imaged ex vivo. (B and D) mt-Keima mice were subjected to the protocol described in (A) and their hearts imaged ex vivo by confocal microscopy. Mitochondria appeared as regularly spaced oval shaped structures in rows along the myofibril and were excited preferentially by the 488 nm laser (i.e., mt-Keima [pH 8]) (box in Figure 2B, inset). Mitolysosomes, by contrast, were round structures clustered in the perinuclear region (arrows in Figure 2B, inset) or scattered along the myofibril (arrowheads in Figure 2B, inset). 3 mice per group were analyzed. (C) Heart of sedentary mt-Keima mouse was drop fixed in 4% paraformaldehyde and immunostained for LAMP1. (E) mt-Keima mice were run as in (B and D) but the final run was stopped at 40 min. 3 mice were in the sedentary group and 4 mice in the run group. (F) mt-Keima; pink1+/+ and mt-Keima; pink1−/- littermates were treated as in (B and E). “ns” indicates not significant, “*” indicates p-value < 0.05, and “**” indicates p-value < 0.01 after correction for multiple comparisons. Error bars represent standard error of the mean. Scale bars in all images: 20 μm](/cms/asset/76b36e2f-8249-4f24-8b97-2d192c6dd39a/kaup_a_1896924_f0002_c.jpg)
In the first experiment, cardiac tissue from WT mice expressing the mt-Keima reporter was examined ex vivo (). mt-Keima signal was observed in two distinct structures corresponding to free mitochondria and mito-lysosomes, respectively. Mitochondria appeared as regularly spaced oval shaped structures in rows along the myofibril and were excited preferentially by the 488 nm laser (i.e., mt-Keima [pH 8]) (box in , inset). Mito-lysosomes, by contrast, were round structures clustered in the perinuclear region (arrows in , inset) or scattered along the myofibril (arrowheads in , inset). They were excited preferentially by the 561 nm laser (i.e., mt-Keima [pH 4]). In fixed tissue, these round structures were colocalized with the lysosomal membrane marker LAMP1 (lysosomal associated membrane protein 1) (). Similarly, round structures positive for mt-Keima (pH 4) signal co-stained with LysoSensor Green in cultured fibroblasts from these mice (Fig. S3A). Thus, round structures with high mt-Keima (pH 4) signal were confirmed to be mito-lysosomes.
We next compared mitolysosome intensity in rested animals or animals run to exhaustion. Similar to our previous findings using this protocol, EE produced an approximately 2-fold increase in mitolysosomal area in the heart () [Citation24]. As we observed substantial variability in the amount of time each mouse ran, in a second experiment we limited the final run time to 40 min for each mouse. We again observed a roughly 2-fold increase in mitolysosomal area with EE, suggesting that the induction of mitophagy with EE is not strictly dependent on the length of time run beyond 40 min (). We previously observed that the increase in mitophagy with EE is dependent on PINK1 [Citation24]. To confirm this observation, we performed a third experiment in which we subjected mt-Keima littermates with or without PINK1 to EE. Consistent with our prior observations, EE did not increase mitophagy in pink1−/- mice (). In fact, there was slight but non-significant decrease in mitophagy. Together these findings confirm that mt-Keima reports a PINK1-dependent increase in mitophagy in the mouse heart following EE.
Next, we subjected mito-QC mice to the same EE protocol applied to the mt-Keima mice. Mitochondria appeared as EGFP+ mCherry+ structures regularly aligned along the myofibril, and mitolysosomes appeared as EGFP− mCherry+ round structures near the nucleus and scattered along the myofibril ( and Fig. S3B). In an initial experiment, a slight increase in mitolysosomal area was observed in fixed tissue, which did not reach significance ( and B). In a second experiment, mito-QC littermates with or without PINK1 were subjected to EE, and both fixed and live tissues were imaged. In both fixed and live tissues, there again was a trend toward increased mitophagy in WT mice with EE; however, there were no significant differences between the groups (). mito-QC expression was stable following EE, suggesting that proteasomal degradation of the reporter by PRKN is not appreciable at endogenous levels of PRKN expression following EE stress (Fig. S3C).
Figure 3. Mito-QC does not detect PINK1-dependent mitophagy in vivo. (A and B) mito-QC mice were subjected to the protocol described in (Fig. 2A) and the tissue was immediately fixed in 4% paraformaldehyde and examined by confocal microscopy. Scale bar = 20 μm. mito-QC; pink1+/+ (WT) and mito-QC; pink1−/- (PK KO) littermates were either sedentary (S) or run (R), following the EE protocol in (). For each animal a sample of heart tissue was immediately fixed and imaged later (fixed), and second sample was immediately imaged live (live). (D) Graph depicts sedentary (S) and run (R) data from all WT animals in experiments shown in , normalized to sedentary animal mean values in each experiment. “ns” indicates not significant, “**” indicates p-value < 0.01, and “****” indicates p-value < 0.0001 after correction for multiple comparisons. Error bars represent standard error of the mean
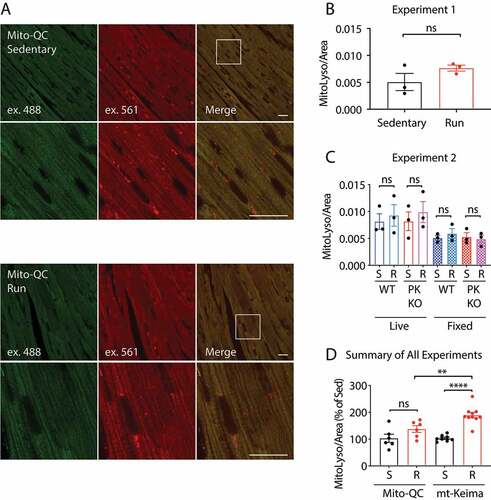
We noted that mt-Keima and mito-QC appeared similarly bright in our experiments. This was surprising as the theoretical brightness of mKeima when excited at 488 nm is only 2.7% that of EGFP. To investigate further, we measured the intensity of EGFP and mKeima in fibroblasts from mito-QC and mt-Keima mice, using the same lightpath and changing only the emission window of the detector, a gallium arsenide phosphide photomultiplier tube (Fig. S3D and E). This confirmed that the mitochondrial signal is slightly brighter in mt-Keima than mito-QC fibroblasts. This was not due to decreased transcription of the reporter as mRNA levels were higher for EGFP than mKeima (Fig. S3F). Most likely, this discrepancy reflects decreased stability of mito-QC protein compared to mt-Keima: more fluorescent protein may be accommodated in the volume of the mitochondrial matrix compared to the surface of the outer membrane, and mistargeted protein may be degraded in the cytosol. This may account for mt-Keima and mito-QC having similar practical brightness, even though EGFP has higher theoretical brightness than mKeima.
Accounting for all WT mice from the three mt-Keima experiments and the two mito-QC experiments, mt-Keima mice exhibited a 1.9-fold increase in mitophagy compared to 1.3-fold in mito-QC mice (). A sample size calculation indicated that 2 mt-Keima mice per group would be needed to detect a significant increase in mitophagy following EE compared to 16 mito-QC mice per group (at a p-value of 0.05 and an α of 0.80). Together these findings suggest that mt-Keima more readily detects PINK1-PRKN mitophagy in response to an acute stressor in vivo, consistent with our observations in cell culture.
Discussion
Use of mt-Keima and mito-QC mitophagy reporters in vivo has yielded conflicting results. Studies using mt-Keima have generally found evidence for PINK1-PRKN mitophagy in vivo, whereas those using mito-QC have not [Citation2–8]. Here, we directly compared the two reporters and found that mt-Keima is a more sensitive mitophagy reporter in cell culture and in vivo. This was the case for all forms of mitophagy tested but was more pronounced for PINK1-PRKN mitophagy.
Incomplete targeting of mito-QC to the OMM may account at least in part for its decreased sensitivity. Notably, we found that more mito-QC is in the cytosolic fraction than the mitochondrial fraction in primary fibroblast lysates. When in the cytosol, mCherry forms aggregates that accumulate in lysosomes [Citation27]. Thus, mistargeted mito-QC may increase background lysosomal fluorescence. This background may be mistaken for basal mitophagy and may blunt the response of mito-QC to an increase in mitophagy. Background fluorescence would be predicted to accumulate with long-term stable expression and to be further exacerbated in post-mitotic cells, such as cardiomyocytes and neurons, which cannot dilute these aggregates by cell growth and division. Consistently, it was recently shown that mito-QC is more specific for PRKN-dependent mitophagy when transiently expressed [Citation26]. Targeting tandem GFP-mCherry to the mitochondrial matrix rather than the outer mitochondrial membrane improved the performance of the GFP-mCherry reporter.
These findings are consistent with other recent reports. mito-SRAI, a new mitophagy reporter, was also found to be more sensitive than mito-QC for PINK1-PRKN mitophagy [Citation26]. mito-SRAI has a similar tandem fluorescent protein design as mito-QC but is targeted to the mitochondrial matrix rather than the OMM. In addition to several other optimizations, reducing cytosolic mistargeting was suggested to be a key factor in the improved sensitivity of mito-SRAI over mito-QC [Citation26]. Consistently, other studies that have targeted tandem mCherry-EGFP reporters to the mitochondrial matrix rather than the OMM have detected PINK1-PRKN mitophagy at endogenous levels of PRKN expression [Citation12,Citation28]. Together these observations suggest that the targeting of mito-QC to the OMM may be responsible at least in part for its lower sensitivity.
In addition to differences in targeting, however, choice of fluorescent protein also affected the sensitivity of the reporter. mKeima performed better than tandem EGFP-mCherry even when both were targeted to the same mitochondrial compartment. mKeima may lead to a larger ratiometric change, as each mKeima molecule will undergo a spectral shift following delivery to the lysosome. Additionally, mKeima may have greater resistance to hydrolysis in the lysosome compared to mCherry.
In cell culture, we found that mito-QC detects iron-chelation induced mitophagy (which is PRKN-independent) more readily than depolarization-induced mitophagy (which is PRKN-dependent). mt-Keima, by contrast, detected both equally. One reason for this difference may be degradation of mito-QC by the UPS, as has been observed previously and we replicated here [Citation26]. The mechanism of mito-QC degradation is likely similar to that of other single-span proteins in the OMM: PRKN ubiquitination followed by VCP extraction from the OMM for UPS degradation [Citation9–12]. Consistently, its degradation was also inhibited by the VCP inhibitor, CB-5083. UPS degradation of mito-QC would limit its delivery to the lysosome, thus, blunting its report of PRKN-dependent mitophagy.
Our finding that mt-Keima is more sensitive than mito-QC for PINK1-PRKN mitophagy may explain some recent inconsistencies in the literature. Using mt-Keima, Cornelissen et al. observed that mitophagy increases several-fold in fruit flies as they age from 1 to 4 weeks [Citation23]. PINK1 and PRKN were required for this age-related increase but not basal mitophagy in young flies. Similarly, Kim et al. found that mt-Keima larva challenged with oxidative stress (paraquat treatment) exhibit a several-fold increase in PINK1-PRKN-dependent mitophagy [Citation25]. By contrast, using mito-QC, Lee et al. found no difference in basal mitophagy in aged flies deficient for PINK1 or PRKN [Citation22]. Our finding that mt-Keima is more sensitive than mito-QC provides a potential explanation for these inconsistencies: PINK1-PRKN mitophagy may increase with age or oxidative stress in flies as detected by mt-Keima, and this increase may have been missed by the less sensitive mito-QC. Similarly, the conclusion from mito-QC mice that PINK1 does not contribute to basal mitophagy may require reevaluation using more sensitive methods [Citation20]. mt-Keima and the new mito-SRAI will likely be helpful in this regard, as well as alternative strategies, such as assessment of mitochondrial protein turnover [Citation26,Citation29,Citation30]. Some of these alternative methods, such as mito-SRAI, may also circumvent a major limitation of mt-Keima: that it needs to be imaged in live cells or tissue.
In summary, our findings demonstrate that mt-Keima is more sensitive than mito-QC for PINK1-PRKN mitophagy both in cell culture and in vivo, and caution against using mito-QC as a reporter for PINK1-PRKN mitophagy.
Materials and methods
Transgenic mice
mito-QC, mt-Keima, and pink1−/- transgenic mouse lines have been published previously [Citation17,Citation19,Citation31]. mito-QC mice were a kind gift from Dr. Ian Ganley (University of Dundee). mt-Keima mice were a kind gift from Dr. Toren Finkel (University of Pittsburgh). The pink1−/- mice (strain B6.129S4-Pink1tm1Shn/J) were obtained commercially (Jackson Laboratories, 017946). All animal studies were approved by the Animal Care Use Committee at the NINDS intramural program. Both genders were used in all studies. The exhaustive exercise protocol was performed as published previously, using a Columbus Eco 3/6 treadmill (Columbus Instruments, 1055-SRM) [Citation24].
In brief, animals were familiarized with the treadmill for three days, using low intensity running. Depending on when in the week the protocol was started, the animals were either rested for two days over the weekend or immediately challenged with exhaustive exercise the following day. The three exhaustive exercise trials consisted of a progressive escalation of belt speed. Animals were run until exhausted or, where indicated, for 40 min. Exhaustion was determined when the mice failed to reengage all four paws with the treadmill belt despite negative stimulus. Immediately after the final run the animals were sacrificed and the heart immediately removed. The heart was rinsed in cold 1X phosphate buffer saline (PBS) (Gibco, 70,011,044) and the tissue was teased with forceps into small pieces. The pieces were sealed between a coverslip and glass slide with a spacer cut out of parafilm. Fluorescence was imaged on a laser scanning confocal microscope (Olympus Life Science, FV3000) using 488 nm and 561 nm lasers. Imaging settings were kept constant between experimental conditions within an experiment.
Representative images were analyzed using the Fiji software package, which is based on ImageJ (National Institutes of Health). For mt-Keima, mitolysosomes were measured by dividing the area of “red” signal (excitation by wavelength 561 nm) by the area of “green” signal (excitation by wavelength 488 nm). For mito-QC, mitolysosomes were measured by dividing the area of mCherry signal by the area of EGFP signal. Outlines of cardiomyocytes were individually circled to avoid measuring background. At least four images per sample were added together and the mean within each sample group is represented as mean ± standard error.
Cell culture
mt-Keima and mito-QC primary mouse fibroblasts were generated from 1-day old newborn pups. Pups were removed from the litter and placed in Dulbecco’s Modified Eagle Medium (Gibco, 11995040) containing 1% L-glutamine (Gibco, 21051024), 15% Fetal Bovine Serum (Gibco, 26140079), MEM-NEAA (Gibco, 10370021), 1% sodium pyruvate (Gibco, 11360070), 1X penicillin-streptomycin (Gibco, 15140163), 1X gentamicin (Gibco, 15750078, and 1X amphotericin B (Gibco, 15290018). Sterile scalpels were used to cut the skin from the animals into thin slices around 1–2 mm squared. The tissues were transferred to a 1% gelatin-coated plate containing the dissection media and covered with sterile cover slips. High glucose Dulbecco’s Modified Eagle Medium (Gibco, 11995040) with sodium pyruvate (Gibco, 11360070) and supplemented with 10% Fetal Bovine Serum (Gibco, 26140079) and penicillin-streptomycin (Gibco, 15140163), was used for all other tissue culture and for primary fibroblasts after passage 1. mt-Keima and HA-PRKN in pHAGE were previously described [Citation14]. mito-QC in lentiviral vector was produced by cloning EGFP, mCherry, and FIS1 (101–152) in tandem into the pHAGE vector. Keima-FIS1 was produced in analogous way but with Keima replacing EGFP and mCherry. mito-GR contained four tandem COX8A mitochondrial targeting signals and PEST and CR1 sequences that were reported for the mito-SRAI construct to ensure targeting GFP-mCherry to the mitochondrial matrix [Citation26]. BFP-PRKN was cloned into the pHAGE vector. Complete plasmid maps and sequences are available upon request. Stable fibroblasts expressing BFP-PRKN were obtained by transducing the cells with BFP-PRKN lentivirus in the presence of 8 μg/mL polybrene (MilliporeSigma, TR-1003-G). HeLa cells stably expressing HA-PRKN with either mito-QC or mt-Keima were similarly generated by transduction with the respective lentiviral viruses and antibiotic and/or fluorescence-activated cell sorting-based selection. Lentiviral viruses were created by transfection of HEK293T cells with the indicated pHAGE vector. Cells were treated where indicated with 10 μM Oligomycin (Calbiochem Research Biochemicals, 495455), 4 μM Antimycin A (MilliporeSigma, A8674) and 20 μM QVD (APExBIO Technology LLC, A1901) (OAQ), 1 mM DFP (MilliporeSigma, 379409), 5 μM lactacystin (Enzo Life Sciences, BML-PI104-0200), and/or 10 μM CB-5083 (APExBIO Technology LLC, B6032).
Antibodies
The following antibodies were used: anti-IMMT (inner membrane mitochondrial protein) (ProteinTech Group, 10179-1-AP), anti-HSP90 (heat shock 90kDa proteins) (ProteinTech Group, 13171-1-AP), anti-total OXPHOS (Abcam, ab110413), anti-Keima (MBL International Corporation, M126-3 M), anti-EGFP (Abcam, ab6556), anti-TOM70 (Santa Cruz, SC-390545), anti-LAMP1 (Santa Cruz, SC-19992), goat anti-rat IgG (H + L) Alexa Fluor 488 (ThermoFisher Scientific, A-11006), goat anti-rat IgG (H + L) Alexa Fluor 647 (ThermoFisher Scientific, A-21247), anti-MT-CO2 (Abcam, ab110258), anti-MAP1LC3B (Cell Signaling Technology, 2775S), anti-mCherry (Takara Bio, 632543), and anti-ECH1 (enoyl-CoA hydratase 1) (Abcam, ab153720).
Immunoblotting
Mouse heart and skeletal muscle were lysed in RIPA buffer and a buffer containing 20 mM Tris pH 7.8, 137 mM NaCl, 2.7 mM KCl, 1 mM MgCl2, 1% Triton X-100, 10% glycerol, 1 mM ethylenediaminetetraacetic acid and 1 mM dithiothreitol respectively with 1% proteinase inhibitor. Lysates were sonicated by a Vibra-Cell Ultrasonic Disruptor (QSONICA, Q700-110) for 15s, 4 times at an output level of 20. Protein concentration was determined by the bicinchoninic acid assay (ThermoFisher Scientific, 23225). Lysates were separated on sodium dodecyl sulfate–polyacrylamide gel electrophoresis gels (BioRad Laboratories, 5671024) and analyzed by immunoblotting.
Heart immunofluorescence
mito-QC or mt-Keima mice were sacrificed under isoflurane anesthesia. The heart was immediately removed, exsanguinated, washed in 1X PBS briefly and drop fixed in 4% paraformaldehyde (Electron Microscopy Sciences, 15710) in 1X PBS for 1 hour at RT then 4°C overnight. The hearts were washed with 1X PBS three times before being sectioned at 40–70 μm using a Compresstome (Precisionary Instruments LLC, VF 310–0Z). The sections were placed in permeabilization/blocking solution (4% Bovine Serum Albumin, 0.5% Triton X-100 in 1X PBS) at room temperature for 30 min, then incubated in primary antibody overnight at 4°C degrees (1:200 primary antibody in permeabilization/blocking solution). The sections were washed in 1X PBS three times at room temperature and placed in 1X PBS with secondary antibody (1:333) at room temperature for 1 h. Finally, the sections were washed three times in 1X PBS before being mounted on charged slides and imaged on a confocal microscope.
Flow cytometry
After treatment, cells were then resuspended in sorting buffer (145 mM NaCl, 5 mM KCl, 1.8 mM CaCl2, 0.8 mM MgCl2, 10 mM 4-(2-hydroxyethyl)-1-piperazineethanesulfonic acid, 10 mM glucose, 0.1% BSA). Flow cytometry was performed using Summit software (v6.2.6.16198) on a MoFlo Astrios flow cytometer (Beckman Coulter, B52102) or on a Amnis CellStream flow cytometer (Luminex Corporation, CS-100196). Measurements of lysosomal mt-Keima were made on the MoFlo Astrios using dual-excitation ratiometric pH measurements at 488 (pH 8) and 561 (pH 4) nm lasers with 620/29-nm and 614/20-nm emission filters, respectively. Similarly, measurements of lysosomal mt-Keima were made on the CellStream using dual-excitation ratiometric pH measurements with 488- (pH 8) and 561- (pH 4) nm lasers with 611/31 emission filter used for both. For each sample, > 5,000 events were collected. Primary mouse embryonic fibroblasts were gated for BFP, to limit analysis to BFP-PRKN expressing cells. For HeLa cells low and high BFP-PRKN populations were gated as indicated and BFP acquisition parameters were held constant for all cell lines compared.
Gene expression
Gene expression measurements were performed by gene expression droplet digital polymerase chain reaction (Bio-Rad Laboratories, 1864003). Gene expression droplet digital polymerase chain reaction reactions were run with complement DNA from mouse neonatal fibroblasts or mouse hearts using the following custom-designed primer/probe assays from Bio-Rad:
GFP (Probe: 5ʹ-/5HEX/CTTGTGCCC/ZEN/CAGGATGTTGCC/3IABkFQ/-3ʹ; Primer 1: 5ʹ-TGCTTGTCGGCCATGATATAG-3ʹ; Primer 2: 5ʹ-AAGGGCATCGACTTCAAGG-3ʹ),
mKeima (Probe: 5ʹ-/5HEX/AGCAACGAC/ZEN/AGCAGCATCCAGGGCA/3IABkFQ/-3ʹ; Primer 1: 5ʹ-TCTCGCCGCTGATCTTCAC-3ʹ Primer 2: 5ʹ-GACTACTTCAAGCAGAGCTTCC-3ʹ).
Reactions were run as multiplex with a GAPDH control (BioRad Laboratories, qHsaCEP0041396). Quantification was performed using QuantaSoft Analysis Pro (BioRad Laboratories, 1864011).
Statistical analysis
or all statistical analyses with 2 samples, Student’s t-tests (2-tailed) were performed in Excel (Microsoft Corporation) or Prism (GraphPad Software). For analyses comparing more than 2 samples one-way ANOVA with Sidak’s multiple comparison test was performed in Prism (GraphPad Software). For mouse experiments, images from each cohort were analyzed blind to condition and genotype. Individuals running mice and imaging tissue ex vivo were not blind to genotype or condition. Sample size calculations were estimated assuming normal distributions of ratio values in sedentary and run animals. This was performed with the following parameters: two-tailed α value of 0.05 and power of 0.8. Sigma for the calculations was the pooled standard deviations between the sedentary (sd1) and run (sd2) groups, determined by the following formula: . The following calculator was used for sample-size determination, which is based on the standard calculation from normal distributions: https://www.stat.ubc.ca/~rollin/stats/ssize/n2.html.
Supplemental Material
Download Zip (103.1 MB)Acknowledgments
We thank Dr. Richard Youle, Dr. Nuo Sun, and Dr. Julia Thayer for their critical reading of the manuscript and insightful comments. We thank the NCI Genomics Core for running the digital droplet polymerase cyclic acid samples. We thank the members of the Narendra lab for their feedback. This work was supported by the Intramural Research Program of the NINDS, National Institutes of Health.
Disclosure statement
No potential conflict of interest was reported by the authors.
Supplementary material
Supplemental data for this article can be accessed here.
Additional information
Funding
Related Research Data
References
- Youle RJ, Narendra DP. Mechanisms of mitophagy. Nat Rev Mol Cell Biol. 2011;12:9–14.
- Narendra DP, Jin SM, Tanaka A, et al. PINK1 is selectively stabilized on impaired mitochondria to activate Parkin. PLoS Biol. 2010;8:e1000298.
- Geisler S, Holmström KM, Skujat D, et al. PINK1/Parkin-mediated mitophagy is dependent on VDAC1 and p62/SQSTM1. Nat Cell Biol. 2010;12:119–131.
- Vives-Bauza C, Zhou C, Huang Y, et al. PINK1-dependent recruitment of Parkin to mitochondria in mitophagy. Proc Natl Acad Sci USA. 2010;107:378–383.
- Kane LA, Lazarou M, Fogel AI, et al. PINK1 phosphorylates ubiquitin to activate Parkin E3 ubiquitin ligase activity. J Cell Biol. 2014;205:143–153.
- Kazlauskaite A, Kondapalli C, Gourlay R, et al. Parkin is activated by PINK1-dependent phosphorylation of ubiquitin at Ser65. Biochem J. 2014;460:127–139.
- Koyano F, Okatsu K, Kosako H, et al. Ubiquitin is phosphorylated by PINK1 to activate parkin. Nature. 2014;510:162–166.
- Narendra D, Tanaka A, Suen D-F, et al. Parkin is recruited selectively to impaired mitochondria and promotes their autophagy. J Cell Biol. 2008;183:795–803.
- Tanaka A, Cleland MM, Xu S, et al. Proteasome and p97 mediate mitophagy and degradation of mitofusins induced by Parkin. J Cell Biol. 2010;191:1367–1380.
- Kim NC, Tresse E, Kolaitis R-M, et al. VCP is essential for mitochondrial quality control by PINK1/Parkin and this function is impaired by VCP mutations. Neuron. 2013;78:65–80.
- Zhang T, Mishra P, Hay BA, et al. Valosin-containing protein (VCP/p97) inhibitors relieve Mitofusin-dependent mitochondrial defects due to VCP disease mutants. Elife. 2017;6:e17834.
- Ordureau A, Paulo JA, Zhang J, et al. Dynamics of Parkin and USP30-Dependent Ubiquitylomes in iNeurons during Mitophagic Signaling. Mol Cell. 2020;77(1124–1142):e10.
- Wong YC, Holzbaur ELF. Optineurin is an autophagy receptor for damaged mitochondria in parkin-mediated mitophagy that is disrupted by an ALS-linked mutation. PNAS. 2014;111:E4439–48.
- Lazarou M, Sliter DA, Kane LA, et al. The ubiquitin kinase PINK1 recruits autophagy receptors to induce mitophagy. Nature. 2015;524:309–314.
- Ordureau A, Heo J-M, Duda DM, et al. Defining roles of PARKIN and ubiquitin phosphorylation by PINK1 in mitochondrial quality control using a ubiquitin replacement strategy. Proc Natl Acad Sci USA. 2015;112:6637–6642.
- Katayama H, Kogure T, Mizushima N, et al. A sensitive and quantitative technique for detecting autophagic events based on lysosomal delivery. Chem Biol. 2011;18:1042–1052.
- Sun N, Yun J, Liu J, et al. Measuring in vivo mitophagy. Mol Cell. 2015;60:685–696.
- Allen GFG, Toth R, James J, et al. Loss of iron triggers PINK1/Parkin-independent mitophagy. EMBO Rep. 2013;14:1127–1135.
- McWilliams TG, Prescott AR, Allen GFG, et al. mito-QC illuminates mitophagy and mitochondrial architecture in vivo. J Cell Biol. 2016;214:333–345.
- McWilliams TG, Prescott AR, Montava-Garriga L, et al. Basal mitophagy occurs independently of PINK1 in Mouse tissues of high metabolic demand. Cell Metab. 2018;27(439–449):e5.
- Mingming T, Toshiro S, Peiyong Z, et al. Mitophagy is essential for maintaining cardiac function during high fat diet-induced diabetic cardiomyopathy. Circ Res. 2019;124:1360–1371.
- Lee JJ, Sanchez-Martinez A, Zarate AM, et al. Basal mitophagy is widespread in Drosophila but minimally affected by loss of Pink1 or parkin. J Cell Biol. 2018;217:1613–1622.
- Cornelissen T, Vilain S, Vints K, et al. Deficiency of parkin and PINK1 impairs age-dependent mitophagy in Drosophila. Elife. 2018;7. DOI:10.7554/eLife.35878
- Sliter DA, Martinez J, Hao L, et al. Parkin and PINK1 mitigate STING-induced inflammation. Nature. 2018;561:258–262.
- Kim YY, Um J-H, Yoon J-H, et al. Assessment of mitophagy in mt-Keima Drosophila revealed an essential role of the PINK1-Parkin pathway in mitophagy induction in vivo. Faseb J. 2019;33(9):9742–9751.
- Katayama H, Hama H, Nagasawa K, et al. Visualizing and modulating mitophagy for therapeutic studies of neurodegeneration. Cell. 2020;181(1176–1187):e16.
- Katayama H, Yamamoto A, Mizushima N, et al. GFP-like proteins stably accumulate in lysosomes. Cell Struct Funct. 2008;33:1–12.
- Rojansky R, Cha M-Y, Chan DC. Elimination of paternal mitochondria in mouse embryos occurs through autophagic degradation dependent on PARKIN and MUL1. Elife. 2016;5. DOI:10.7554/eLife.17896
- Vincow ES, Merrihew G, Thomas RE, et al. The PINK1–Parkin pathway promotes both mitophagy and selective respiratory chain turnover in vivo. Proc Nat Acad Sci. 2013;110:6400–6405.
- Vincow ES, Thomas RE, Merrihew GE, et al. Autophagy accounts for approximately one-third of mitochondrial protein turnover and is protein selective. Autophagy. 2019;15(9):1592–1605.
- Kitada T, Pisani A, Porter DR, et al. Impaired dopamine release and synaptic plasticity in the striatum of PINK1-deficient mice. Proc Natl Acad Sci USA. 2007;104:11441–11446.