
ABSTRACT
Dysregulation of mitochondrial homeostasis and accumulation of damaged mitochondria cause degenerative diseases such as age-related macular degeneration (AMD). We studied the effects of the intermediate cytofilament KRT8 (keratin 8) on mitochondrial homeostasis in relation to the morphology and function of mitochondria in retinal pigment epithelial cells under oxidative stress. When the mitochondria were damaged owing to oxidative stress, the damaged mitochondria were readily disposed of via mitophagy following mitochondrial fission. During this process, KRT8 was found to physically interact with the mitochondria through PLEC (plectin) and facilitate the mitochondrial fission-mediated mitophagy. However, the association between PLEC-anchoring mitochondria and KRT8 was dwindled by KRT8 phosphorylation under oxidative stress. The efficient KRT8-facilitated mitophagy flux suppressed the accumulation of damaged mitochondria and consequently diminished necrotic cell death under oxidative stress. Thus, by facilitating mitophagy, KRT8 protects RPE cells against necrotic cell death due to oxidative stress.
Abbreviations: 3-MA: 3-methyladenine; AMD: age-related macular degeneration; DDIT3: DNA damage inducible transcript 3; DNM1L: dynamin 1 like; ER: endoplasmic reticulum; GAPDH: glyceraldehyde-3-phosphate dehydrogenase; GCN1: GCN1 activator of EIF2AK4; IF: intermediate filament; KRT8: keratin 8; MAP1LC3B/LC3B: microtubule associated protein 1 light chain 3; MFF: mitochondrial fission factor; MMP: mitochondrial membrane potential; OCR: oxygen consumption rate; PLEC: plectin; ROS: reactive oxygen species; RPE: retinal pigment epithelium; SQSTM1/p62: sequestosome 1; TOMM20: translocase of outer mitochondrial membrane 20
Introduction
Age-related macular degeneration (AMD) is a progressive degeneration of the retinal pigment epithelium (RPE); it is one of the major causes of blindness. Oxidative stress, inflammation, and the accumulation of drusen (tiny yellow deposits) have been proposed as the pathological causes of AMD [Citation1,Citation2]. During aging, accumulation of damaged mitochondria and misfolded proteins leads to functional abnormalities in the RPE because of the prolonged exposure to reactive oxygen species (ROS) [Citation3–5]. Uncontrolled accumulation of cytoplasmic ROS, a result of the dysregulation of mitochondrial homeostasis, causes various degenerative diseases, including AMD [Citation6,Citation7]. The accumulation of damaged mitochondria (defined by the reduction and rupture of cristae in the mitochondrial matrix) in the eyes of patients with AMD is a characteristic of the disease [Citation7]. Further, mitochondrial swelling and a decreased number of mitochondria are histologically visualized characteristics in the RPE of patients with AMD [Citation8–10].
Mitochondria are unique organelles that produce ATP using oxygen in the cells. During ATP production, mitochondria often generate ROS, which can induce mitochondrial damage [Citation11,Citation12]. To prevent ROS-inflicted structural damage and maintain homeostasis, mitochondria change their morphology through the fission and fusion processes, which are highly dynamic responses to environmental conditions [Citation13,Citation14]. When the mitochondria are damaged by environmental stressors, as with ROS, the damaged part of the mitochondrion is divided and separated from the intact mitochondrion via mitochondrial fission [Citation15]. These fragments of the damaged mitochondria are subsequently degraded by mitophagy, one of the macroautophagy/autophagy processes [Citation16–18]. If mitochondrial fission is impaired, the mitochondrial damage may accumulate and spread over the intact mitochondria [Citation19]. The pathophysiological basis of AMD is currently attributed to the accumulation of the oxidatively damaged organelles and proteins of RPE via aging, which is caused by an imbalance of oxygen radicals [Citation20]. Drusen, composed of lipofuscin and oxidized proteins, cause extended mitochondrial damage in RPE [Citation21,Citation22].
Autophagy is a process that removes damaged organelles and toxic protein aggregates by orderly degradation and recycling of cellular components. In the RPE, autophagy is highly active for the removal of oxidized mitochondria and lipofuscin [Citation23–25]. However, impairment or insufficiency of RPE autophagy causes AMD via the accumulation of toxic aggregates (damaged mitochondria and lipofuscin) in the intra- and extracellular environment [Citation26–29]. Mitophagy, the specialized removal of mitochondria, regulates mitochondrial quality control [Citation30–32]. Under diverse stress conditions, mitophagy protects cells from the damage caused by dysregulated mitochondrial metabolism and deters the induction of cell death, such as necrosis and apoptosis [Citation33]. We previously observed that KRT8 (keratin 8), an intermediate filament (IF), protects RPE cells against cell death under oxidative stress by facilitating autophagy [Citation20]. It has been known that KRT8 is involved in the regulation of mitochondrial distribution and inhibition of apoptosis [Citation34,Citation35]. IFs provide a scaffolding platform to regulate organelle distribution and shape in the cytosol [Citation36]. Cytoskeletal linker proteins, such as PLEC (plectin), stabilize the cytoskeletal-scaffolding architecture by anchoring IF to other cytoskeletons and subcellular organelles including mitochondria [Citation37,Citation38]. Despite the contribution of keratin filaments to mitochondrial metabolism, mechanistic details of how cytofilament KRT8 affects mitochondrial dynamics in cells under oxidative stress – as a way to maintain mitochondrial homeostasis and protect cells from cell death – is unclear.
Herein, we investigated the effects of KRT8 on mitochondrial dynamics by monitoring mitochondrial morphology and function in RPE cells under oxidative stress. When the mitochondria are damaged by oxidative stress, mitophagy is induced based on the status of the mitochondrial morphology. Roles of KRT8 on mitochondrial fission-mediated mitophagy was monitored along with effects on the mitochondrial shape and function. We further examined whether facilitation of mitochondrial fission-mediated mitophagy by KRT8 attenuates oxidative stress-induced necrosis of RPE cells. Our results will contribute to elucidate roles of cytofilament on dynamic flux of mitochondrial fission-mediated mitophagy.
Results
KRT8 promotes mitochondrial fission and suppresses mitochondrial dysfunction under oxidative stress
As the accumulation of damaged mitochondria is a known feature of patients with AMD [Citation7], we first observed the mitochondria in the RPE of AMD mice models prepared with administration of ROS-generating iodate (). In the control group (saline), the RPE demonstrated a homogenous hexagonal structure by TJP1/ZO-1 staining, which is a widely used marker on the tight junction in polarized epithelial cells. The AMD mouse models (NaIO3 injected) showed an irregular and disorganized RPE pattern with multinucleated giant cells with enlarged mitochondria. In the AMD mouse models under oxidative stress, enlarged mitochondria were vividly accumulated (green fluorescence), compared to the control group.
Figure 1. Paraquat induces morphological changes and mitochondrial damage and KRT8 suppresses paraquat-induced mitochondrial damage in ARPE-19 cells. (A) Immunohistochemical images of mice retinal flat mounts, showing the presence of TOMM20 (green) and TJP1/ZO-1 (red). Mice were intravenously injected with saline or NaIO3 (20 mg/kg) and sacrificed 2 weeks after the intravenous injection. Nuclei were stained with DAPI (blue). Scale bar: 50 µm. (B) Fluorescence microscopy images of the DCFDA-stained cells. Cells were exposed to 400 µM of paraquat for 24 h; scale bar: 40 µm. (C) Flow cytometric measurement of MitoSOX-stained cells. Cells were exposed to 400 µM of paraquat for 24 h. (D) Confocal images of the MitoTracker Red-stained, KRT8-immunostained cells. Cells were incubated to 400 μM paraquat for 6, 12, and 24 h (upper images). Magnified images of the white boxed regions are shown as insets. Scale bar: 10 µm. The frequency distributions indicate the mitochondrial size after 24 h of paraquat treatment. The average size of the mitochondria is represented in each graph. (E) Confocal images from a time-lapse sequence (Video S1) of the cells obtained by monitoring mitochondria (red) and KRT8 (green). Cells were transfected with KRT8-GFPSpark and incubated in the presence or absence of paraquat (400 μM) for 12 h. White arrowheads indicate the sites of mitochondrial fission. Line scan plots show the normalized fluorescence intensities of KRT8 and mitochondria in the yellow dash lines of the 92, 184, and 391 sec images. Scale bars, 2 µm. (F) TEM images of paraquat-exposed cells. Cells were exposed to 400 µM of paraquat for 24 h. Blue-, and red-colored arrows indicate healthy and damaged mitochondria, respectively. (G) OCR assay of RPE cells. Cells were exposed to 400 µM of paraquat for 24 h. Data are presented as means ± SD, n= 3. **P < 0.01. (H) Mitochondrial damage assay of paraquat-exposed RPE cells. Cells were exposed to 400 µM of paraquat for 24 h. The percentage population of cells with damaged mitochondria are represented by each graph. Bar graphs indicate the percentage of cells with damaged mitochondria. Data are presented as means ± SD, n= 3. *P < 0.05, **P < 0.01
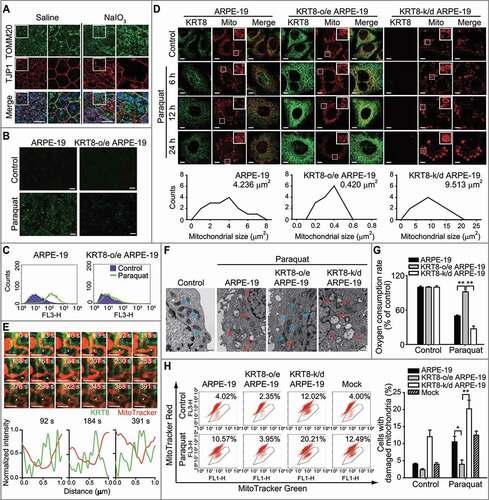
Intermediate cytofilament KRT8 modulates mitochondrial shape and function [Citation39] and regulates mitochondrial distribution [Citation35]. To confirm this, we investigated the role of KRT8 in mitochondrial homeostasis in RPE cells under oxidative stress. We investigated whether KRT8 modulates mitochondrial homeostasis in RPE cells under oxidative stress. We monitored the ROS in a human retinal pigment epithelial cell line, ARPE-19 cells, with different KRT8 expression levels after treatment with an ROS-generating agent (paraquat) for 24 h ( and S1A). Paraquat treatment significantly increased the fluorescence, which represented the generation of intracellular ROS. However, in the KRT8-overexpressing cells, ROS accumulation was significantly reduced. As paraquat causes the generation of ROS from mitochondria [Citation40], we next tested whether paraquat-induced ROS are accumulated in the mitochondria of RPE cells using MitoSOX, a mitochondrial superoxide indicator ( and S1A). Similar to the preceding finding (), red fluorescence indicates that mitochondrial ROS were enhanced by paraquat treatment in ARPE-19 cells. In the ARPE-19 cells overexpressing KRT8, fluorescence was not significantly increased after paraquat treatment. Thus, KRT8 decreases the generation of paraquat-induced mitochondrial ROS in RPE cells.
To further investigate whether KRT8 overexpression affects mitochondrial morphology in RPE cells under oxidative stress, we observed changes in mitochondrial shape at different paraquat exposure times. Under oxidative stress, the mitochondria undergo significant changes in shape; as such, mitochondrial morphology was changed from an elongated tubular form to an enlarged spherical form in ARPE-19 and KRT8-knockdown cells (, S1B, and S1C). Thus, swollen shape of mitochondria is a common morphological feature in RPE cells under oxidative stress, which are both observed in the ARPE-19 cells and the AMD mouse models. In contrast, paraquat treatment induced extensive mitochondrial fragmentation in the KRT8-overexpressing cells, which is likely due to mitochondrial fission. The average size of the mitochondria in ARPE-19 and KRT8 knockdown cells was 11-fold and 22-fold larger than those in KRT8 overexpressing cells, respectively. To monitor mitochondrial fission by KRT8, we transfected RPE cells with GFPSpark-tagged KRT8 and incubated them with MitoTracker Red to trace the mitochondria (, S1D, and Video S1). Mitochondrial fission was induced in RPE cells under oxidative stress, in which KRT8 was present at the sites of mitochondrial fission. Based on these results, we hypothesized that KRT8 would be related with ROS generation and morphological changes of the mitochondria in RPE cells under oxidative stress.
To further examine whether the functional and structural intactness of the mitochondria is differently affected with KRT8 expression in RPE cells under oxidative stress, we observed the internal structure of mitochondria in ARPE-19 cells using transmission electron microscopy (, S1E, and S1F). The control group (i.e. absence of paraquat) had mitochondria with clear inner membranes and dense matrix space, whereas paraquat-exposed ARPE-19 cells had enlarged and swollen mitochondria with destroyed cristae. A swollen mitochondrial shape with disrupted cristae were more extensively observed in the KRT8 knockdown ARPE-19 cells under oxidative stress.
We then examined mitochondrial function by determining the oxygen consumption rate (OCR) ( and S1G) and membrane potential of the mitochondria (MMP) ( and S1H). In ARPE-19 cells under oxidative stress, the OCR decreased approximately 50% compared to the control group. When the RPE cells with KRT8 knockdown were exposed to paraquat, the cells showed a significantly decreased OCR (approximately 30%). In contrast, OCR was maintained at an unhampered state (at approximately 90%) in the ARPE-19 cells with overexpressed KRT8 under oxidative stress. We counted the cell population that contains non-respiring mitochondria via flow cytometry after double staining with MitoTracker Red and Green ( and S1F). Mitochondrial damage such as low MMP can be identified and measured by double staining with mitochondria-specific fluorescent dyes, MitoTracker Green and Red [Citation31,Citation41]. MitoTracker Red, a lipophilic cationic fluorescent dye that is concentrated inside of mitochondria owing to their negative MMP, represents MMP and mitochondrial mass. On the other hand, MitoTracker Green stains mitochondria as an indicator of mitochondrial mass. When the cells were exposed to paraquat, cell populations with non-respiring mitochondria (i.e. low MMP) were increased by over 10% and 20% in ARPE-19 cells and KRT8 knockdown cells, respectively. In contrast, the population of cells that contain mitochondria with low MMP slightly increased to 4.0% in the KRT8-overexpressing RPE cells under oxidative stress. Thus, paraquat induces oxidative stress, which results in mitochondrial dysfunction that is accompanied by mitochondrial swelling. However, in the mitochondria of the RPE cells under oxidative stress, KRT8 overexpression not only suppresses ROS generation but also suppresses a shift to the dysfunctional state.
KRT8 suppresses mitochondrial damage and necrosis under ER stress
Mitochondrial swelling and rupture are caused by an overload of calcium ions, which are released from the stressed endoplasmic reticulum (ER) [Citation42] into the mitochondria [Citation43–45]. As paraquat is an inducer of ER stress [Citation46,Citation47], we investigated whether KRT8 suppresses paraquat-induced ER stress in ARPE-19 cells ( and S2A). In both ARPE-19 and KRT8-overexpressing cells, the ER stress markers, DDIT3 and p-GCN1, were equally upregulated by paraquat and bortezomib not by antimycin A. Thus, the KRT8 expression levels did not alleviate the ER stress caused by paraquat and bortezomib treatment.
Figure 2. KRT8 decreases necrotic cell death under paraquat-induced ER stress. (A) Immunoblots of KRT8, DDIT3, and p-GCN1 in ARPE-19 cells. Cells were treated with 400 μM of paraquat, 30 nM of bortezomib, or 10 μM of antimycin A for 24 h. (B) Confocal microscopy images of the mitochondria (green) and calcium ions (rhod-2, red). Cells were incubated with 400 µM of paraquat for 24 h. Heat map images of rhod-2 fluorescence indicate calcium ion levels. Scale bar: 20 µm. (C) Flow cytometric assay for cell death, as monitored by FITC-conjugated ANXA5/annexin V and propidium iodide (PI). Cells were incubated with 400 µM of paraquat for 36 h. The percentage population of necrosis and apoptosis are indicated by red and blue boxes, respectively. The bar graphs indicate the percentage of necrosis. Data are presented as means ± SD, n= 3. **P < 0.01
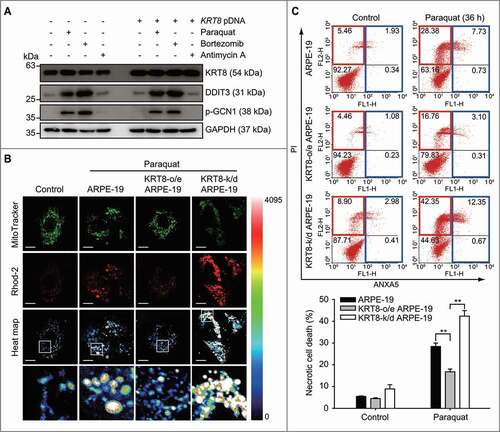
Next, we examined whether KRT8 diminishes the calcium ion overload in the mitochondria under paraquat-induced ER stress. Mitochondrial calcium ion indicators (rhod-2) were used to stain calcium ions in the mitochondria and were monitored via confocal fluorescence microscopy ( and S2B) and flow cytometry (Figure S2C). When the ARPE-19 and KRT8-knockdown ARPE-19 cells were exposed to paraquat, high fluorescence intensity was observed in the swollen mitochondria (). However, KRT8-overexpressing ARPE-19 cells showed low rhod-2 fluorescence intensity in the fragmented mitochondria under oxidative stress. Consistent with these results, paraquat treatment significantly increased the rhod-2 fluorescence in ARPE-19 and KRT8-knockdown ARPE-19 cells, whereas it slightly increased the rhod-2 fluorescence in KRT8-overexpressing ARPE-19 cells (Figure S2C).
The swelling and rupture of the mitochondria under ER stress induce necrosis [Citation48,Citation49]. As KRT8 decreased the mitochondrial damage under oxidative stress, we further investigated the effects of KRT8 on paraquat-induced cell death in RPE cells with different KRT8 expression levels (). Paraquat treatment significantly increased the necrotic cell death in ARPE-19 cells and KRT8-knockdown ARPE-19 cells by 23% and 33%, respectively. In contrast, the necrotic cell death in the KRT8-overexpressing ARPE-19 cells increased by only approximately 12%, compared to the control group. Thus, KRT8 decreases the accumulation of calcium ions in the mitochondria and prevents necrotic cell death in RPE cells under paraquat-induced ER stress.
Mitochondrial fission precedes the attenuation of mitochondrial dysfunction by KRT8
Fragmented small mitochondria were prominent in the KRT8-overexpressing ARPE-19 cells under oxidative stress; moreover, mitochondrial damage and subsequent necrosis (seen in ARPE-19 cells) were decreased. To determine a link between mitochondrial morphological features and decreased mitochondrial damage, we hypothesized that mitochondrial fission reduces mitochondrial damage in ARPE-19 cells under oxidative stress. We monitored whether the inhibition of mitochondrial fission affects mitochondrial dysfunction and subsequent changes in the cell fate ().
Figure 3. Inhibition of mitochondrial fission enhances mitochondrial swelling and necrotic cell death under oxidative stress. (A) Immunoblots of MFF and DNM1L in anti-MFF or anti-DNM1L siRNA-transfected ARPE-19 cells. Cells were exposed to 400 µM of paraquat for 24 h. (B) Confocal images of MitoTracker Red-stained cells. Cells were exposed to 400 µM of paraquat for 24 h. Nuclei were stained with DAPI (blue). Scale bar: 10 µm. (C) The OCR assay of anti-MFF or anti-DNM1L siRNA-transfected RPE cells. Cells were exposed to 400 µM of paraquat for 24 h. Data are presented as means ± SD, n= 3. **P < 0.01. (D) Flow cytometric assay for mitochondrial damage in anti-MFF or anti-DNM1L siRNA-transfected cells. Cells were exposed to 400 µM of paraquat for 36 h. The percentage population of cells with damaged mitochondria are represented in each graph. Bar graphs indicate the percentage of cells with damaged mitochondria. Data are presented as means ± SD, n= 3. **P < 0.01. (E) Flow cytometric assay for cell death in anti-MFF or anti-DNM1L siRNA-transfected cells. Cells were exposed to 400 µM of paraquat for 36 h. The percentage population of necrosis and apoptosis are indicated in red and blue boxes, respectively. Bar graphs indicate the percentage of necrosis. Data are presented as means ± SD, n= 3. **P < 0.01
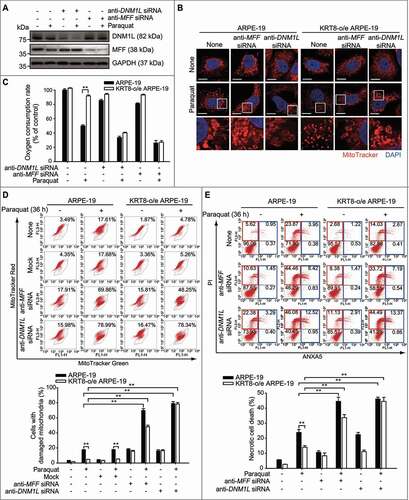
When the mitochondrial fission proteins – MFF and DNM1L – were knocked down using anti-MFF or anti-DNM1L siRNA in the ARPE-19 cells, a multitude of mitochondria were shown to be swollen in both the ARPE-19 and KRT8-overexpressing cells under oxidative stress (, , and S3). To assess the mitochondrial functions of RPE cells with inhibited mitochondrial fission, we investigated OCR () and MMP (, S3A, and S3B) in the MFF- or DNM1L-knockdown cells. In the KRT8-overexpressing cells, paraquat treatment did not significantly decrease the OCR, compared to the control cells. In contrast, when mitochondrial fission was inhibited, OCR was significantly decreased in both control and KRT8-overexpressing cells. Likewise, the cell population with damaged mitochondria (marked by decreased MMP) was found to be significantly increased in the MFF- and DNM1L-knockdown cells under oxidative stress. Based on these mitochondrial functional assays, we suggest that mitochondrial fission inhibition fails to offset mitochondrial damage in KRT8-overexpressing cells under oxidative stress. Thus, KRT8 is likely to mitigate mitochondrial damage via MFF- and DNM1L-dependent mitochondrial fission.
We previously observed that the inhibition of autophagy induces apoptosis in RPE cells exposed to paraquat for 24 h [Citation20]. In contrast, under long-term exposure (over 36 h) to paraquat, necrosis was induced in RPE cells ( and ). To address whether long-term oxidative stress induces necrosis by dysfunctional mitochondrial fission in ARPE-19 cells, we monitored the cell death process after inhibiting mitochondrial fission and autophagy (Figure S3C). Inhibition of mitochondrial fission by MFF knockdown enhanced necrosis by over 18% and 14% in ARPE-19 and KRT8-overexpressing ARPE-19 cells, respectively, compared to the control group. Interestingly, inhibition of the autophagy with 3-methyladenine (3-MA) increased apoptosis without affecting the necrosis caused by paraquat treatment and MFF knockdown. Next, we investigated the manner in which mitochondrial fission inhibition affects the fate of RPE cells in which mitochondrial fission proteins were knocked down under oxidative stress (). Necrotic cell death was significantly increased in the ARPE-19 cells after paraquat treatment for 36 h. Consistent with the results shown in , the paraquat-induced necrosis was diminished in KRT8-overexpressing cells. However, the knockdown of mitochondrial fission proteins (MFF or DNML1) significantly enhanced necrotic cell death in both ARPE-19 and KRT8-overexpressing cells under oxidative stress. Thus, necrotic cell death is likely induced by dysfunctional mitochondrial fission when RPE cells are under long-term exposure (over 36 h) causing oxidative stress.
To examine the effects of mitochondrial fission on the accumulation of mitochondrial ROS under oxidative stress, we monitored ROS generation in RPE cells after the inhibition of mitochondrial fission. Paraquat treatment increased the amount of ROS in the ARPE-19 cells both with and without DNM1L knockdown (Figure S3D). Similar to the preceding results ( and C), ROS accumulation was not observed in KRT8-overexpressing cells. In contrast, DNM1L-knockdown did not attenuate ROS generation in ARPE-19 cells despite KRT8 overexpression, indicating that KRT8 diminishes paraquat-induced ROS generation after mitochondrial fission in RPE cells. Overall, mitochondrial fission is a prerequisite for KRT8 to facilitate the attenuation of mitochondrial damage and subsequent necrosis in RPE cells under prolonged oxidative stress.
KRT8 facilitates mitochondrial fission-mediated mitophagy and subsequent mitochondrial salvage
Abnormally enlarged mitochondria (termed megamitochondria) cannot be degraded by autophagy [Citation50]. To investigate whether mitochondrial fission is required for mitophagy, a selective degradation system of mitochondria, we investigated the induction of mitophagy that is based on mitochondrial size in oxidatively stressed RPE cells. Mitochondria were stained with MitoTracker Red; autophagosomes were traced by the GFP-conjugated MAP1LC3B/LC3B (microtubule associated protein 1 light chain 3 beta) (). Autophagosomes traced with GFP-LC3B puncta, which were accumulated in RPE cells under oxidative stress, were partially colocalized with fragmented mitochondria in both ARPE-19 cells and KRT8-overexpressing ARPE-19 cells. Importantly, the fragmented small mitochondria were mostly colocalized with GFP-LC3 puncta in the paraquat-treated KRT8-overexpressing ARPE-19 cells. In contrast, the GFP-LC3B puncta did not overlap with enlarged swollen mitochondria in ARPE-19 cells under oxidative stress. Further, the TEM image of the KRT8-overexpressing RPE cells exposed to paraquat presented a fragmented mitochondrion that was surrounded by a double-membraned vesicle representing an autophagosome (). These results indicate that the fragmented or small-sized mitochondria are only eligible for the mitophagic process in RPE cells under oxidative stress.
Figure 4. KRT8 protects the mitochondria via mitochondrial fission-mediated mitophagy under oxidative stress. (A) Confocal microscopy images of cells by monitoring GFP-LC3B puncta (green) and mitochondria (red). Cells were exposed to 400 µM of paraquat for 24 h. Nuclei were stained with DAPI (blue). Scale bar: 5 µm. (B) TEM images showing mitochondrial internal structures. Cells were exposed to 400 µM of paraquat for 24 h. Blue- and red-colored arrows indicate healthy and damaged mitochondria, respectively. The enlarged image shows the mitochondrion in the autophagic vacuole (indicated by a white square). (C) Immunoblots of KRT8, TOMM20, and the autophagic markers (SQSTM1, BECN1, and LC3B). Cells were exposed to 400 µM of paraquat for 24 h. Numbers below the bands indicate the relative band intensity normalized to GAPDH. (D) Immunoblots of DNM1L, TOMM20, and the autophagic markers (SQSTM1 and LC3B). Cells were exposed to 400 µM of paraquat for 24 h. Numbers below the bands indicate the relative band intensity normalized to GAPDH. (E) Confocal images of MitoTracker Red-stained cells. Cells were incubated with paraquat (400 µM) in the presence or absence of 3-MA (10 mM) for 24 h. Nuclei were stained with DAPI (blue). Scale bar: 10 µm
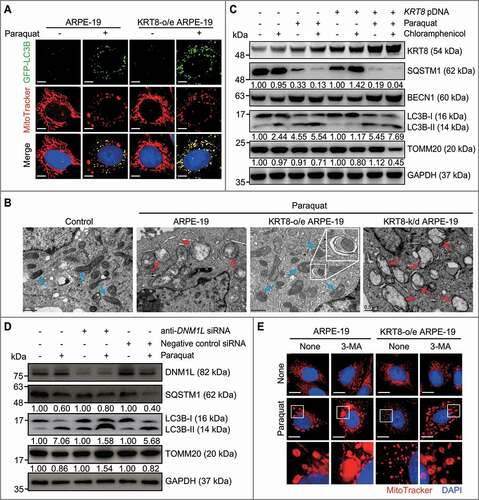
To trace the mitophagic flux in RPE cells under oxidative stress, we monitored the degradation of the mitochondrial protein TOMM20 after blocking mitochondrial biogenesis using chloramphenicol, which is an inhibitor specific to the mitochondrial ribosome (70S ribosome). (). Paraquat-induced autophagy was demonstrated by the presence of autophagic markers, such as SQSTM1 degradation, BECN1 upregulation, and LC3B conversion. Under normal conditions, chloramphenicol did not affect the expression levels of the autophagic markers and the mitochondrial marker protein. When the cells were exposed to paraquat in the presence of chloramphenicol, decreased levels of TOMM20 were observed, which indicates a progression of mitophagy that degrades dysfunctional mitochondria. The cells treated with paraquat plus chloramphenicol showed decreased levels of TOMM20 by approximately 30% and 55% in ARPE-19 cells and KRT8-overexpressing ARPE-19 cells, respectively. Thus, dysfunctional mitochondria were more significantly degraded by mitophagy in the KRT8-overexpressing cells than in the control cells. In addition, to examine whether mitochondrial fission is necessary for subsequent mitophagy, we monitored mitophagic flux after mitochondrial fission inhibition in RPE cells (). The DNM1L knockdown cells exposed to paraquat showed pronounced accumulation of LC3B-II with decreased SQSTM1 degradation compared to controls. Importantly, the TOMM20 levels were increased in the DNM1L knockdown cells under oxidative stress, suggesting that inhibition of mitochondrial fission suppresses the autophagic flux that disposes dysfunctional mitochondria. Thus, mitochondrial fission is a prerequisite for subsequent mitophagy, which is facilitated by KRT8 under oxidative stress. To investigate whether the inhibition of autophagy induces alterations in mitochondrial morphology, we examined mitochondrial shape after 3-MA treatment under oxidative stress (). When the cells were exposed to paraquat with 3-MA, the shape of the mitochondria was changed to the excessively swollen form in both ARPE-19 and KRT8-overexpressing ARPE-19 cells. Collectively, inhibition of either mitochondrial fission or subsequent mitophagy leads to the accumulation of damaged mitochondria in RPE cells.
Next, we hypothesized that the damaged parts of mitochondria can be degraded via fission and subsequent mitophagy. To test this hypothesis, we monitored the mitochondrial turnover under oxidative stress using the MitoTimer system, in which green and red fluorescence reflects nascent and aged mitochondrial status [Citation51], respectively (). Under normal conditions, the merged image showed yellow fluorescence with a red-to-green ratio of 0.5, which represents the steady-state of the mitochondrial aging process. When the KRT8-overexpressing cells were exposed to paraquat, the red-to-green ratio of the MitoTimer fluorescence was approximately 3-fold lower than that of the control ARPE-19 cells exposed to paraquat. In accordance with this finding, from the relative proportion of each fluorescence in the merged images, the mitochondria with red fluorescence were observed to be over 90% in ARPE-19 cells, whereas the mitochondria from the KRT8-overexpressing cells under oxidative stress were found to have a lower amount (25%) of red fluorescence. Importantly, the amount of nascent mitochondria (depicted with green fluorescence) was greater in the KRT8-overexpressing cells than in the control cells. Hence, KRT8 overexpression not only diminishes the accumulation of aged mitochondria but also facilitates mitochondrial turnover under oxidative stress.
Figure 5. KRT8 facilitates mitochondrial turnover and subsequent mitochondrial salvage under oxidative stress. (A) Confocal microscopy images in MitoTimer-expressing cells. Cells were exposed to 400 µM of paraquat for 24 h. Scale bar: 10 µm. Bar graphs represent the red-to-green fluorescence ratio of MitoTimer (left graph) and the percentage of each fluorescence level in the merged images of MitoTimer (right graph). Data are presented as means ± SD, n= 3. **P < 0.01. (B) Fluorescence microscopy images of MitoTracker Red-stained cells. The cells were exposed to paraquat (400 μM) for 24 h and incubated in the complete culture media not including paraquat for 6 and 24 h. Nuclei were stained with DAPI (blue). Scale bar: 5 µm. (C and D) Flow cytometric analysis of mitochondrial damage and cell death in cells exposed to paraquat (400 μM). The cells were incubated with paraquat for 24 or 48 h and paraquat-exposed cells for 24 h were incubated in the complete culture media not including paraquat for 24 h. (C) The percentage population of cells with damaged mitochondria are represented by each graph. Bar graphs indicate the percentage of cells with damaged mitochondria in the flow cytometric analysis. Data are presented as means ± SD, n= 3. **P < 0.01. (D) The percentage population of necrosis and apoptosis are indicated in red and blue boxes, respectively. Bar graphs indicate the percentage of necrosis. Data are presented as means ± SD, n= 3. **P < 0.01
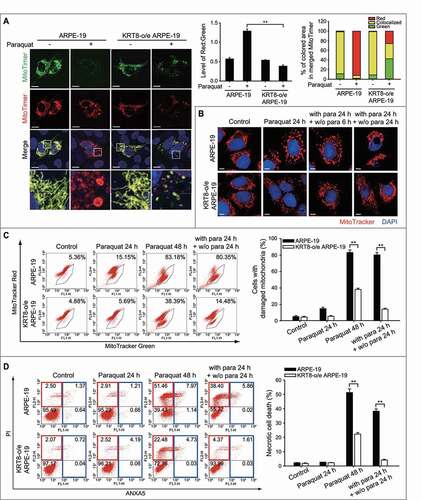
To further investigate the role of KRT8 in mitochondrial turnover, mitochondrial salvage in paraquat-treated RPE cells was examined after changing the cell growth medium to a normal growth medium without paraquat. Several mitochondrial functional properties were monitored – mitochondrial morphology, membrane potential, and necrotic cell death (-). The cells that were exposed to paraquat for 24 h and that showed enlarged swollen mitochondria were placed in the normal culture medium and further incubated for 6 h. In the paraquat-treated ARPE-19 cells, the enlarged swollen mitochondria were partly condensed after 6 h of changing the medium. After 24 h of the medium change, the cells showed a complete collapse of the mitochondria on one side of the cells, which contained abnormal-shaped nuclei. In contrast, the fragmented form of the mitochondria in the paraquat-treated KRT8-overexpressing ARPE-19 cells was altered to the normal tubular form of the mitochondria in a time-dependent manner after the medium change.
We then investigated whether the paraquat-treated cells would be rescued from mitochondrial damage and necrotic cell death ( and ). In ARPE-19 cells under oxidative stress, the cell population that contained mitochondria of low MMP increased in a time-dependent manner (). The ARPE-19 cells, which were exposed to paraquat for 48 h, showed a significantly increased (over 80%) cell population with damaged mitochondria. After paraquat treatment for 24 h, despite the fact that the cells were placed in complete medium without paraquat, the cell population that contained damaged mitochondria did not differ from that of the ARPE-19 cell group exposed to paraquat for 48 h. However, in the KRT8-overexpressing ARPE-19 cells, the cell population with damaged mitochondria increased by approximately 1% and 34% after treatment with paraquat for 24 h and 48 h, respectively. Interestingly, the cell population with damaged mitochondria caused by paraquat treatment decreased to 14% in KRT8-overexpressing cells after the medium was replaced with medium without paraquat. Thus, KRT8 attenuates mitochondrial dysfunction and facilitates the salvage of mitochondria under oxidative stress.
To further investigate whether KRT8 attenuates necrotic cell death by salvaging mitochondria under oxidative stress, necrotic cell death by paraquat was monitored after the paraquat-treated RPE cells were further grown in normal growth medium without paraquat (). Prolonged exposure to paraquat (48 h) caused increased necrotic cell death in both ARPE-19 and KRT8-overexpressing cells (exhibiting 52% and 23% necrotic cell populations, respectively). The ROS-inflicted necrotic cell death was diminished by 13% after the medium change in the ARPE-19 cells. Importantly, the rescue of necrotic cell death was greatly enhanced in the KRT8-overexpressing ARPE-19 cells; most cells survived following the medium change. Therefore, KRT8 facilitates mitochondrial turnover and salvage by mitochondrial fission-mediated mitophagy in RPE cells under oxidative stress.
Cytoskeletal linker PLEC mediates KRT8-mitochondria interactions
As mitochondria-anchored PLEC also serves as a docking site for Ifs [Citation52,Citation53], we investigated whether the KRT8-mitochondria interaction is mediated by the cytoskeletal linker protein PLEC. Cell lysates were fractionated into cytosolic and mitochondrial fractions to determine the physical interaction between KRT8 and mitochondria in the presence and absence of PLEC (). In cells under normal conditions, KRT8 and PLEC coexisted in both cytosolic and mitochondrial fractions. However, in the PLEC-knockdown cells, KRT8 was no longer present in the mitochondrial fraction but was prominent in the cytoplasmic fraction. Thus, the physical interaction between KRT8 and the mitochondria is likely mediated by PLEC in RPE cells.
Figure 6. Interaction between KRT8 and mitochondria is mediated by PLEC. (A) Immunoblots of PLEC and KRT8 in anti-PLEC siRNA-transfected cells after subcellular fractionation. WCL, whole cell lysate; Cytosol, cytosolic fraction; Mito, mitochondrial fraction. (B) Confocal microscopy images of MitoTracker Red-stained cells. Cells were exposed to 400 µM of paraquat for 24 h. Nuclei were stained with DAPI (blue). Scale bar: 10 µm. (C) The OCR assay in anti-PLEC siRNA-transfected cells. Cells were exposed to 400 µM of paraquat for 24 h. Data are presented as means ± SD, n= 3. **P < 0.01. (D) Flow cytometric assay for mitochondrial damage in anti-PLEC siRNA-transfected cells. Cells were exposed to 400 µM of paraquat for 24 h. The percentage population of cells with damaged mitochondria are represented in each graph. Bar graphs indicate the percentage of cells with damaged mitochondria. Data are presented as means ± SD, n= 3. *P < 0.05. (E) Immunoblots of the PLEC, TOMM20, SQSTM1, and LC3B in anti-PLEC siRNA-transfected cells. Cells were exposed to 400 µM of paraquat for 24 h. Numbers below the bands indicate the relative band intensity normalized to GAPDH
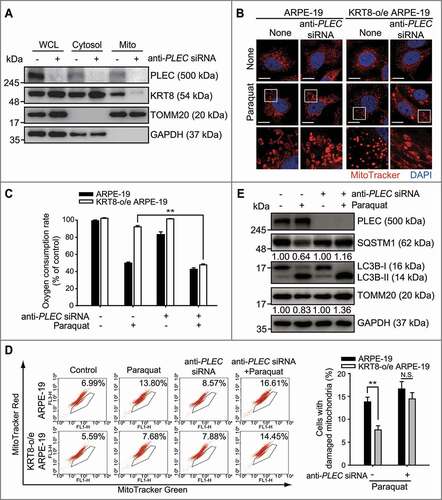
To investigate whether PLEC is required for the KRT8-mediated facilitation of mitochondrial fission and mitophagy under oxidative stress, we monitored the morphology and function of the mitochondria after PLEC knockdown. When PLEC expression was suppressed using anti-PLEC siRNA, swollen-type mitochondria were predominantly observed in both ARPE-19 and KRT8-overexpressing cells under oxidative stress (). This is similar to results shown in , which demonstrated mitochondrial swelling under oxidative stress. In addition, PLEC knockdown significantly decreased OCR of the mitochondria despite KRT8 overexpression in the cells under oxidative stress (). Similarly, when PLEC expression was suppressed with anti-PLEC siRNA in cells under oxidative stress, KRT8 overexpression did not reverse the increase in the number of cells with low MMP (). Thus, PLEC deficiency causes the loss of KRT8-mediated mitochondrial protection under oxidative stress, which results in morphological changes and mitochondria damage. To examine the effects of PLEC deficiency on the autophagic disposal of damaged mitochondria, we monitored mitophagic flux in cells with PLEC knockdown (). Paraquat treatment unleashed the mitophagic flux with LC3 conversion, SQSTM1 degradation, and TOMM20 degradation by approximately 20%, compared to the control group. In contrast, in the PLEC-knockdown cells, paraquat treatment did not cause the degradation of both SQSTM1 and TOMM20, which indicates that PLEC is required for the efficient progression of mitophagic flux in cells under oxidative stress. Overall, PLEC is crucially involved in the KRT8-mediated disposal of dysfunctional mitochondria under oxidative stress.
We previously observed that KRT8 and its phosphorylated form (p-KRT8) are upregulated in cells under oxidative stress and that p-KRT8 is rearranged near the nucleus [Citation20]. Phosphorylation of IFs affects IF-mitochondria interactions, which leads to the disruption of IF architecture and reduced mitochondrial function [Citation54,Citation55]. We first examined the expression of PLEC and KRT8 in cells under continued exposure to paraquat (Figure S4A). The amount of PLEC was not affected by the continued paraquat treatment, whereas the KRT8 and p-KRT8 levels were significantly increased. Interestingly, the level of KRT8 in the mitochondrial fraction was decreased in a time-dependent manner after paraquat treatment, compared to that in the cytosolic fraction (Figure S4B). Thus, we speculated that prolonged oxidative stress disrupts the physical interactions between KRT8 and the mitochondria in RPE cells by the phosphorylation of KRT8.
To examine whether KRT8 phosphorylation disrupts KRT8-mitochondria interactions, the presence of KRT8 and PLEC in the mitochondrial fraction was monitored after the inhibition of KRT8 phosphorylation in RPE cells under oxidative stress (). We previously observed that oxidative stress-induced KRT8 phosphorylation can be diminished by the MAP2K1 inhibitor, PD98059 [Citation20]. When KRT8 phosphorylation was inhibited using PD98059, the amount of KRT8 that was associated with the mitochondria was significantly higher than that without PD98059. However, the amount of PLEC in the mitochondrial fraction was not influenced by KRT8 phosphorylation. In contrast, in the PLEC-deficient cells, KRT8 was not observed in the mitochondrial fraction despite the inhibition of KRT8 phosphorylation with PD98059 (). Based on these results, we suggest that phosphorylation of KRT8 is likely to diminish interactions between KRT8 and PLEC-anchored mitochondria under oxidative stress.
Figure 7. Phosphorylation of KRT8 disrupts KRT8-mitochondria interactions. (A) Immunoblots of PLEC, KRT8, and p-KRT8 in ARPE-19 cells after subcellular fractionation. Cells were incubated with paraquat (400 µM) in the presence or absence of PD98059 (20 μM) for 24 h. Numbers below the bands indicate the relative band intensity normalized to TOMM20. (B) Immunoblots of PLEC, KRT8, and p-KRT8 in the mitochondrial fraction of ARPE-19 and anti-PLEC siRNA-transfected ARPE-19 cells after subcellular fractionation. Cells were incubated with paraquat (400 µM) in the presence or absence of PD98059 (20 μM) for 24 h. Numbers below the bands indicate the relative band intensity normalized to TOMM20. (C) Immunoblots of PLEC and KRT8 in the anti-PLEC siRNA-transfected ARPE-19 cells after co-IP with anti-KRT8 antibody. Cells were incubated with paraquat (400 µM) in the presence or absence of PD98059 (20 μM) for 24 h. Numbers below the bands indicate the relative band intensity normalized to KRT8 of Input. (D) Fluorescence microscopy images of MitoTracker Red-stained and KRT8-immunostained ARPE-19 cells. Cells were incubated with paraquat (400 µM) in the presence or absence of PD98059 (20 μM) for 24 h. Scale bar: 10 µm. (E) Assessment of damaged mitochondria in the ARPE-19 cells incubated with paraquat and PD98059. Cells were incubated with paraquat (400 µM) in the presence or absence of PD98059 (20 μM) for 36 h. The percentage population of cells with damaged mitochondria are represented by each graph. Bar graphs indicate the percentage of cells with damaged. Data are presented as means ± SD, n= 3. **P < 0.01. (F) Graphical summary of the results
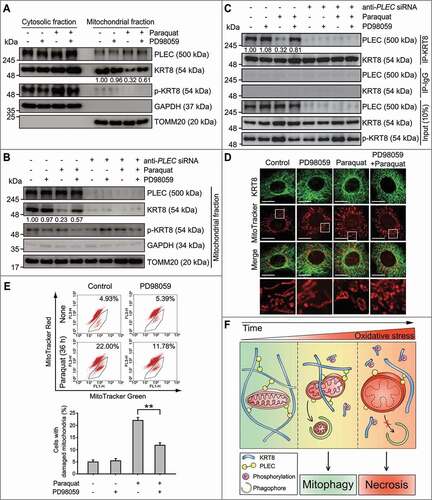
To evaluate the effects of KRT8 phosphorylation on the association between KRT8 and PLEC, we next conducted a co-immunoprecipitation assay using KRT8-specific antibodies (). PLEC was co-precipitated with KRT8, which suggests a stable association between KRT8 and PLEC in the cells under normal conditions. However, the KRT8-PLEC association was seemingly decreased under oxidative stress as reduced levels of PLEC were co-precipitated with KRT8. In contrast, the association between KRT8 and PLEC was significantly recovered by PD98059 under oxidative stress. These results indicate that the association between KRT8 and mitochondria is mediated by PLEC under oxidative stress, which can be disrupted by KRT8 phosphorylation. To further understand the effects of KRT8 phosphorylation on the suppression of paraquat-induced mitochondrial damage, we investigated mitochondrial morphology and membrane potential in the presence or absence of PD98059 under oxidative stress ( and ). When the cells were treated with PD98059 under oxidative stress, the number of swollen mitochondria decreased and numerous mitochondria were shown to be fragmented (). In addition, inhibition of KRT8 phosphorylation decreases the number of ARPE-19 cells with damaged mitochondria under oxidative stress (). Therefore, oxidative stress causes mitochondrial damage by disrupting KRT8-mitochondria interactions, which can be suppressed by the inhibition of KRT8 phosphorylation.
Discussion
Damaged mitochondria are degraded by mitophagy, a type of selective autophagy to clear mitochondria, which is important for the maintenance of mitochondrial quality [Citation6,Citation25,Citation33,Citation56]. Inhibition of mitophagy by knocking out PRKN or PINK1 (or their homologs) is associated with mitochondrial swelling, which leads to the degeneration of muscles and neurons [Citation57–59]. In senescent cells, a lack of autophagy due to decreased levels of active lysosomes enhances the accumulation of lipofuscin and damaged mitochondria [Citation60–62]. Similarly, AMD was shown to be caused by mitochondrial dysfunction [Citation5,Citation7,Citation27,Citation28]. In the present study, we observed swollen mitochondria, which are known as the hallmark of AMD patients [Citation8–10], in RPE cells of AMD mouse models under oxidative stress. Oxidative stress-induced mitochondrial damage evidenced by swollen mitochondria with destroyed cristae and decreased mitochondrial function, which was reversed by KRT8 overexpression in the RPE cells.
Mitochondria physically interact with the ER based on the status of mitochondrial metabolism [Citation63,Citation64]. However, ER-derived calcium ion overload in mitochondria causes mitochondrial swelling and rupture [Citation43,Citation44], leading to cellular necrosis [Citation48]. We observed that ER-derived calcium ions extensively accumulated in the swollen mitochondria, resulting in necrosis. Although the KRT8 expression levels in the RPE cells did not affect the extent of paraquat-induced ER stress, KRT8 suppresses necrosis via the inhibition of calcium ion overload in the mitochondria.
Under stress condition, mitochondrial fission is required for removal of mitochondria [Citation65], and its upregulation is known to facilitate mitophagy [Citation66,Citation67]. We observed that KRT8 overexpression protects paraquat-exposed RPE cells from necrosis and enhances mitochondrial turnover to salvage the mitochondria by facilitating mitochondrial fission-mediated mitophagy. Thus, it is likely that the inhibition of mitochondrial fission suppresses mitophagy and causes mitochondrial swelling. The lack of mitochondrial fission was found to cause mitochondrial swelling and mitophagy suppression. In addition, the inhibition of either mitochondrial fission or subsequent mitophagy leads to necrosis following mitochondrial damage in RPE cells. Based on our observations, we suggest that KRT8 overexpression expedites mitochondrial fission by stabilizing the cytoplasmic architecture during mitophagy.
PLEC, as a cytolinker protein between cytoskeleton and organelles [Citation37,Citation38], is involved in the morphological changes of the mitochondria, such as fusion and fission [Citation52,Citation53,Citation68]. Mutations of PLEC are attributed to muscular dystrophy, which is a degenerative disease that is caused by mitochondrial dysfunction [Citation69,Citation70]. Our results indicate that PLEC deficiency increases mitochondrial elongation with decreased mitochondrial fission, which leads to mitochondrial swelling under stress conditions. We also found that KRT8 phosphorylation disrupts the physical interactions between KRT8 and the mitochondria with subsequent mitochondrial dysfunction. It has been previously reported that dysregulation of cytoskeletal structure via hyperphosphorylation affects mitochondrial function and motility [Citation54,Citation55]. Thus, our finding that KRT8 interacts with PLEC-anchored mitochondria and its phosphorylation causes dissociation with PLEC may explain details of mitochondrial dysfunction caused by dysregulation of cytoskeletal structure with a regard to KRT8-mitochondria interaction under oxidative stress.
In conclusion, our findings demonstrate that KRT8 enhances mitochondrial turnover by facilitating mitochondrial fission-mediated mitophagy and diminishing oxidative stress-induced necrosis in RPE cells (). KRT8 expedites the clearance of damaged mitochondria by stabilizing cytoplasmic architecture through association with PLEC-anchoring mitochondria. Thus, the upregulation of KRT8 and downregulation of phosphorylated KRT8 along with the maintained association between KRT8 and the damaged mitochondria that undergo fission would be beneficial for the efficient disposal of dysfunctional mitochondria under oxidative stress. Such mitochondrial disposal via favored mitophagy and concomitant biogenesis of nascent mitochondria is likely a strategy to maintain mitochondrial homeostasis and avoid necrosis caused by cumulative oxidative stress.
Materials and Methods
Cell culture and reagents
ARPE-19 cells were maintained in DMEM-F12 supplemented with fetal bovine serum (FBS, 10%) and penicillin/streptomycin (1%) at 37°C in 5% CO2. To prepare the ARPE-19 cells overexpressing, or with a knockdown of, KRT8, cells were incubated in Opti-MEM medium and transfected with KRT8-encoded plasmid (pUNO1-hKRT8), or anti-KRT8 siRNA using Lipofectamine 3000, respectively. Paraquat (methyl viologen dichloride hydrate; 856,177), 2′,7′-dichlorofluorescin diacetate (DCFDA, D6883), antimycin A (A8674), chloramphenicol (C0378), 3-methyladenine (3-MA; M9281), bortezomib (5.04314), PD98059 (P215), and DAPI (D9542) were purchased from Sigma-Aldrich. Opti-MEM (31,985) and Dulbecco modified Eagle medium: nutrient mixture F-12 (DMEM-F12; 11,330) were supplied by GIBCO®/Thermo Fisher Scientific. MitoTracker Red CMX/Ros (M7512), MitoTracker Green FM (M7514), MitoSOX (M36008), Rhod-2 (R1244), ProLong Gold antifade reagent (P36934), and Lipofectamine 3000 (L3000015) were purchased from Invitrogen Life Technologies. Dynabeads M-270 Epoxy (14,301) and protease & phosphatase inhibitor cocktail (78,442) were purchased from Thermo Fisher Scientific.
Plasmids encoding MitoTimer (Addgene, 52,659) were a gift from Dr. Zhen Yan (University of Virginia). Plasmid DNAs (pSELECT-GFP-LC3B [psetz-gfplc3b, sc43732] and pUNO1-hKRT8, coding for the sequence of Homo sapiens (Hs)/human KRT8 [puno1-hkrt8, sc35156]) were purchased from InvivoGen. Plasmids encoding KRT8-GFPSpark (pCMV3-KRT8-GFPSpark, HG13153-ACG) were purchased from Sino Biological (Beijing, China). The siRNA of KRT8 (sc35156), MFF (sc94736), DNM1L (sc43732), PLEC (sc29453), and negative control (sc37007) were purchased from Santa Cruz Biotechnology.
Antibodies
The following antibodies were used: anti-KRT8 (ab9023), phospho-KRT8 (Ser73; ab32579), DDIT3 (ab11419), MFF (ab81127), SQSTM1 (ab56416), PLEC (ab32528), and GAPDH (181,602) were from Abcam; anti-KRT8 (MA5-14,428) and anti-TJP1/ZO-1 (61–7300) were purchased from Thermo Fisher Scientific; anti-TOMM20 (sc11415), BECN1 (sc11427), horseradish peroxidase (HRP)-conjugated goat anti-rabbit immunoglobulin (sc2004), and HRP-conjugated goat anti-mouse immunoglobulin (sc2031) were purchased from Santa Cruz Biotechnology; anti-DNM1L (5391), phospho-GCN1 (Ser51; 9721), and LC3B (3868) were from Cell Signaling Technology; Alexa Fluor 488-conjugated goat anti-rabbit immunoglobulin (A11008), Alexa Fluor 488-conjugated goat anti-mouse immunoglobulin (A11001), and Alexa Fluor 555-conjugated goat anti-mouse immunoglobulin (A21422) were purchased from Invitrogen Life Technologies. Antibodies used in this study are detailed in .
Table 1. Antibodies used in the study
Animal studies
Adult male C57BL/6 J mice (7–9 weeks old, Orient Bio) were housed in a temperature-controlled room under a 12-h light/dark cycle. Mice were maintained in accordance with the policies of the Konkuk University Institutional Animal Care and Use Committee (IACUC).
Immunohistochemistry
C57BL/6 J mice were intravenously injected with 20 mg/kg of NaIO3 to obtain AMD model. Saline treated group was served as control by a single intravenous injection of NaCl (0.9%). Mice were sacrificed 2 weeks after the intravenous injection. After anesthetization with CO2 gas deeply, eyes were enucleated immediately. Enucleated eyes were fixed 4% paraformaldehyde for 1 h. Anterior eye cups were dissected, and retina layers were carefully removed. The tissues were incubated in blocking solution including 3% BSA (R&D Technology, C0082) and 0.2% Triton X-100 (AMRESCO, 0694) for 1 h. Then, tissues were incubated with TJP1/ZO-1 antibody overnight at 4°C. After the rinsing step with PBS (Welgene, ML008-02) containing 0.5% BSA, tissues were incubated with a secondary antibody for 1 h in dark and flat-mounted. All stained samples were captured using a confocal microscopy (LSM800, Carl Zeiss; Oberkochen, Germany).
Intracellular and mitochondrial reactive oxygen species detection
Intracellular ROS formation in ARPE-19 and KRT8 overexpressing ARPE-19 cells was detected by fluorescence microscopy. ARPE-19 cells (~ 80% confluent) in a 24-well plate with auto-coverglass (Ф12 mm; Paul Marienfeld GmbH &Co. KG, 0111520) were incubated with 400 µM paraquat at 37°C for 24 h. Cells were loaded with 10 µM of DCFDA for 10 min at 37°C in the dark. After incubation, the medium containing DCFDA was aspirated. Cells were then washed once with prewarmed 1X PBS, and then supplemented with prewarmed Opti-MEM medium. Cells were examined under a fluorescence microscope (AxioVert 200, Carl Zeiss) with excitation and emission set at 525 and 550 nm, respectively. Fluorescence of oxidized DCFDA in cells was captured with AxioCam using AxioVision software (Carl Zeiss).
To detect mitochondrial ROS generation in ARPE-19 and KRT8 overexpressing ARPE-19 cells, cells were seeded in a 6-well plate and incubated with 400 µM of paraquat at 37°C for 24 h. Cells were loaded with MitoSOX (10 µM) for 10 min at 37°C in the dark. At the end of incubation, the cells were collected and resuspended in cold PBS. Flow cytometric data were obtained using a FACSCalibur Flow Cytometer (BD Biosciences; San Jose, CA, USA) equipped with BD CellQuest Pro software (BD Biosciences).
Oxygen consumption rate (OCR) assay
Cells were seeded in a 96-well plate and incubated with 400 µM paraquat at 37°C for 24 h. After incubation, the culture medium was removed and replaced with fresh medium with paraquat. The oxygen consumption in the cells was measured using oxygen consumption assay kit (Cayman Chemicals, 600,800). The phosphorescent oxygen probe reagent was added to all wells except blank wells and the wells were sealed with prewarmed mineral oil. The fluorescence was read at excitation; 380 nm and emission; 650 nm kinetically for 120 min at 37°C by using a multi-plate reader (GeminiEM, Molecular Devices; San Jose, CA, USA).
Analysis of mitochondrial morphology
ARPE-19- and KRT8-overexpressing ARPE-19 cells were seeded in a 24-well plate containing auto-coverglass and incubated with 400 µM paraquat at 37°C for 24 h. Cells were washed with PBS and incubated with 100 nM of MitoTracker Red CMX/Ros at 37°C for 15 min in the dark to stain mitochondria. After incubation, cells were washed three times with prewarmed PBS and fixed with 4% paraformaldehyde for 1 h. Cells were permeabilized with 0.2% Triton X-100 and blocked with 3% bovine serum albumin for 1 h. Cells were then incubated overnight at 4°C with the anti-KRT8 primary antibodies (1:200 diluted). After PBS washing three times, cells were incubated with the fluorescence-conjugated secondary antibodies (1:1000; Alexa Fluor 488) for 2 h in the dark. The cells were washed 3 times with PBS for 10 min each after every step, and the nuclei were stained with DAPI (1:1000 diluted). Cells were mounted on the coverslip with ProLong Gold antifade reagent (Invitrogen Life Technologies) and observed with a confocal microscope (LSM800, Carl Zeiss).
Live-cell imaging
Imaging of live cells was performed by using a confocal microscope (LSM800) in temperature-controlled chamber at 37°C. For live imaging, cells were seeded in confocal dish (SPL Life Sciences Co.) and transfected with pCMV3-KRT8-GFPSpark (Sino Biological) using Lipofectamine 3000. Cells were exposed to paraquat (400 µM) for 6 h. Mitochondria were stained with 100 nM of MitoTracker Red CMX/Ros at 37°C for 15 min in the dark. After MitoTracker Red incubation, cells were washed 3 times with PBS and replaced in Opti-MEM media with paraquat (400 µM). Then, cells were imaged with the Plan-Apochromat 63x/1.4 OIL DIC M27 objective (Carl Zeiss) using the 488 and 578 nm excitation lasers for GFP and MitoTracker Red, respectively. The images were analyzed and line scan plots of 92, 184, and 391 sec images were generated by ZEN program (Carl Zeiss).
Transmission electron microscopy
ARPE-19 cells were seeded in a 100-mm dish and incubated with 400 µM paraquat for 24 h. To fix the cells, cells were fixed with 2% glutaraldehyde and 2% paraformaldehyde in 0.05 M sodium cacodylate buffer (pH 7.2) at 4°C for 2 h. After 3 times washing with 0.05 M sodium cacodylate buffer (pH 7.2), cells were postfixed with 1% osmium tetroxide and 0.05 M cacodylate buffer at 4°C for 2 h. Cells were washed twice with distilled water and en bloc stained in 0.5% uranyl acetate overnight at 4°C. The cells were dehydrated with various concentrations (30 to 100%) of ethanol and transitioned into 100% propylene oxide. The dehydrated cells were infiltrated with Spurr’s resin (Electron Microscopy Sciences, 14,300) in propylene oxide and polymerized in Spurr resin at 70°C overnight. After ultramicrotome sectioning (MTX, RMC Boeckeler; Tucson, AZ, USA) the cells were sequentially stained with 2% uranyl acetate and Reynolds’ lead citrate. The prepared cells were observed by transmission electron microscopy (LIBRA 120, Carl Zeiss).
Flow cytometric analysis; mitochondrial damage detection
Cells were seeded in 6-well plate and treated with paraquat for 24 h. The cells were washed with prewarmed PBS and stained with MitoTracker Red CMX/Ros (100 nM) and MitoTracker Green FM (50 nM) at 37°C for 15 min in the dark. Cells were collected and resuspended in PBS after washing with PBS. Flow cytometric data were obtained using a FACSCalibur Flow Cytometer (BD Biosciences) equipped with BD CellQuest Pro software (BD Biosciences).
Mitophagy assay; GFP-LC3B analysis
ARPE-19- and KRT8-overexpressing ARPE-19 cells were seeded in a 12-well plate containing auto-coverglass (Ф18 mm; Paul Marienfeld GmbH &Co. KG, 0111580). Cells were incubated with Opti-MEM medium at 37°C for 2 h. Then, cells were transfected with 1 µg of pSELECT-GFP-LC3B using Lipofectamine 3000. The transfected cells were washed with PBS 3 times and complete DMEM-F12 medium with paraquat (400 µM) for 24 h. After paraquat incubation, cells were stained with 100 nM of MitoTracker Red CMX/Ros for 15 min in the dark. To fix the cells, cells were incubated in 4% paraformaldehyde for 1 h. Cells were washed twice with PBS. Nuclei were stained with DAPI (1:1000). The cells were observed under a confocal fluorescence microscope (LSM800, Carl Zeiss).
Observation of mitochondrial turnover
ARPE-19 cells and KRT8-overexpressing ARPE-19 cells were seeded in a 24-well plate containing auto-coverglass and transfected with pMitoTimer using Lipofectamine 3000. After plasmid DNA transfection, cells were washed with PBS three times and replaced in complete DMEM-F12 medium. Then, cells were incubated with 400 µM of paraquat and fixed with 4% paraformaldehyde for 1 h. Nuclei were stained with DAPI (1:1000). The cells were observed under a confocal fluorescence microscope (LSM800, Carl Zeiss) and analyzed by ZEN software (Carl Zeiss). Quantification of pMitoTimer were carried out with ImageJ software (Bethesda, MD, USA), in which a threshold was set to the mitochondrial regions and the images were converted to a 32-bit format. The red-to-green ratio was quantified by dividing the red image over the green image on a pixel-by-pixel basis. Percentage of colored area was quantified in the merged image.
Observation of mitochondrial salvage
To investigate mitochondrial salvage, ARPE-19 cells and KRT8-overexpressing ARPE-19 cells were exposed to 400 µM of paraquat for 24 h and incubated in the complete culture media – which does not include paraquat – for 6 and 24 h. Several mitochondrial functional properties were monitored – mitochondrial morphology, membrane potential, and necrotic cell death.
Western blot analysis
Cells were lysed in RIPA buffer (50 mM Tris-HCl, pH 8, 150 mM NaCl, 0.1% SDS, 0.5% sodium deoxycholate [Sigma-Aldrich, 30,970], 1.0% Tergitol® [Nonidet P-40; Sigma-Aldrich, NP40], 10 mM 2-mercaptoethanol, 1 mM phenylmethanesulfonylfluoride [Sigma-Aldrich, P7626]) with protease & phosphatase inhibitor cocktail. The protein concentration was determined by using the Bradford method (Bio-Rad, 5,000,006). The protein (total of 35 µg) was separated by SDS polyacrylamide gel electrophoresis. Proteins were then transferred to an Immobilon-P PVDF membrane (Millipore, IPVH00010), and the membranes were blocked with 5% skim milk in TBST buffer (25 mM Tris, 150 mM NaCl, 2 mM KCl, 0.1% Tween 20 [Sigma-Aldrich, P5927], pH 7.4) for 1 h at room temperature. After overnight incubation in primary antibodies (1:500 to 1:2000) at 4°C, the membrane was subsequently incubated with horseradish peroxidase-conjugated anti-rabbit and mouse immunoglobulin, and signals were detected with an enhanced chemiluminescence system (Millipore, WBKLS0500) by using G:BOX Chemi XL (Syngene; Frederick, MD, USA). The TOMM20 protein band intensities normalized to GAPDH (GeneTools software included in G:BOX Chemi XL), expressed relative to control.
Subcellular fractionation
Cells were resuspended in fractionation buffer (220 mM mannitol, 70 mM sucrose, 20 mM HEPES, pH 7.4, 10 mM KCl, 2 mM MgCl2, 1 mM EDTA, 1 mM EGTA, 1 mM DTT) with protease & phosphatase inhibitor cocktail and incubated on ice for 15 min. Cells were lysed by passing cell mixture through a 27-gauge needle and incubated on ice for 20 min. Cell lysate was centrifuged at 720 g for 5 min at 4°C to remove the nuclei and unbroken cells. The supernatant was centrifuged at 10,000 g for 10 min at 4°C to pellet mitochondria. The supernatant containing cytosolic fraction was separated and collected.
Co-immunoprecipitation
PLEC was immunopurified by using Dynabeads M-270 Epoxy in ARPE-19 and PLEC-knockdown ARPE-19 cells. Anti-KRT8 antibody (40 µg) was covalently conjugated to Dynabeads (10 mg), and co-immunoprecipitations were performed according to the manufacturer’s instructions. Cell lysates were incubated with the anti-KRT8 antibody coupled Dynabeads at 4°C for 2 h. After incubation, the Dynabeads were separated by magnet and washed three times. Captured proteins were eluted twice with the addition of 50 µL of HPH EB buffer (0.5 M NH4OH, 0.5 mM EDTA).
Flow cytometric analysis; cell death detection
The prepared cells were treated with 400 µM of paraquat for 36 h, they were washed with cold PBS and resuspended in staining buffer containing fluorescein-5-isothiocyanate-ANXA5/annexin V (ANXA5/annexin V-FITC), and propidium iodide (PI) with RNase A, provided in the apoptosis detection kit (BD Biosciences, 556,547), according to the manufacturer’s instructions. Flow cytometric data were obtained using a FACSCalibur Flow Cytometer (BD Biosciences) equipped with BD CellQuest Pro software (BD Biosciences).
Mitochondrial calcium ion detection
ARPE-19 cells were seeded in a coverglass bottom dish (hole: Ф18 mm) were treated with 400 µM of paraquat or 30 nM of bortezomib for 24 h. Cells were incubated with 50 nM of MitoTracker Green FM and 4 µM of Rhod-2, which is reduced by sodium borohydride, for 20 min and washed with prewarmed PBS. The fluorescence was observed by using a confocal microscope (LSM800, Carl Zeiss) and analyzed by ZEN software (Carl Zeiss)
Quantification and statistical analysis
Statistical analysis was performed in Sigma plot 10.0 and GraphPad Prism (Version 5). Replicate data are expressed as the means ± standard deviation (S.D.). Significant differences between two non-parametric groups were statistically analyzed by Mann-Whitney U-test. One-way analysis of variance (ANOVA) was used for multiple comparisons. A p-value of < 0.05 was considered statistically significant.
Supplemental Material
Download Zip (24.1 MB)Acknowledgments
This research was supported by the grants from the National Research Foundation of Korea (2017R1E1A1A01074656 and 2020R1I1A1A01067670) and Konkuk University Researcher Fund in 2019.
Disclosure statement
The authors have declared that no competing interests exist.
Supplementary material
Supplemental data for this article can be accessed here.
Additional information
Funding
Related Research Data
References
- Friedman DS, O’Colmain BJ, Munoz B, et al. Prevalence of age-related macular degeneration in the United States. Arch Ophthalmol. 2004;122:564–572.
- Lim LS, Mitchell P, Seddon JM, et al. Age-related macular degeneration. Lancet. 2012;379(9827):1728–1738.
- Kaarniranta K, Salminen A, Eskelinen EL, et al. Heat shock proteins as gatekeepers of proteolytic pathways-Implications for age-related macular degeneration (AMD). Ageing Res Rev. 2009;8:128–139.
- Liang FQ, Godley BF. Oxidative stress-induced mitochondrial DNA damage in human retinal pigment epithelial cells: a possible mechanism for RPE aging and age-related macular degeneration. Exp Eye Res. 2003;76:397–403.
- Kaarniranta K, Kajdanek J, Morawiec J, et al. PGC-1alpha protects RPE cells of the aging retina against oxidative stress-induced degeneration through the regulation of senescence and mitochondrial quality control. The Significance for AMD Pathogenesis. Int J Mol Sci. 2018;19(8):19.
- Chen HC, Chan DC. Mitochondrial dynamics-fusion, fission, movement, and mitophagy-in neurodegenerative diseases. Hum Mol Genet. 2009;18(R2):R169–R76.
- Suter M, Reme C, Grimm C, et al. Age-related macular degeneration. The lipofusion component N-retinyl-N-retinylidene ethanolamine detaches proapoptotic proteins from mitochondria and induces apoptosis in mammalian retinal pigment epithelial cells. J Biol Chem. 2000;275:39625–39630.
- Bianchi E, Scarinci F, Ripandelli G, et al. Retinal pigment epithelium, age-related macular degeneration and neurotrophic keratouveitis. Int J Mol Med. 2013;31:232–242.
- Brown EE, DeWeerd AJ, Ildefonso CJ, et al. Mitochondrial oxidative stress in the retinal pigment epithelium (RPE) led to metabolic dysfunction in both the RPE and retinal photoreceptors. Redox Biol. 2019;24:101201.
- Feher J, Kovacs I, Artico M, et al. Mitochondrial alterations of retinal pigment epithelium in age-related macular degeneration. Neurobiol Aging. 2006;27:983–993.
- Handa JT. How does the macula protect itself from oxidative stress? Mol Aspects Med. 2012;33:418–435.
- Blasiak J, Glowacki S, Kauppinen A, et al. Mitochondrial and nuclear DNA damage and repair in age-related macular degeneration. Int J Mol Sci. 2013;14:2996–3010.
- Gottlieb RA, Bernstein D. Mitochondrial remodeling: rearranging, recycling, and reprogramming. Cell Calcium. 2016;60:88–101.
- Eisner V, Picard M, Hajnoczky G. Mitochondrial dynamics in adaptive and maladaptive cellular stress responses. Nat Cell Biol. 2018;20(7):755–765.
- Parone PA, Da Cruz S, Tondera D, et al. Preventing mitochondrial fission impairs mitochondrial function and leads to loss of mitochondrial DNA. PloS One. 2008;3(9):e3257.
- Burman JL, Pickles S, Wang C, et al. Mitochondrial fission facilitates the selective mitophagy of protein aggregates. J Cell Biol. 2017;216(10):3231–3247.
- Frank M, Duvezin-Caubet S, Koob S, et al. Mitophagy is triggered by mild oxidative stress in a mitochondrial fission dependent manner. Bba-Mol Cell Res. 2012;1823:2297–2310.
- Zhang CS, Lin SC. AMPK promotes autophagy by facilitating mitochondrial fission. Cell Metab. 2016;23:399–401.
- Galloway CA, Lee H, Nejjar S, et al. Transgenic control of mitochondrial fission induces mitochondrial uncoupling and relieves diabetic oxidative stress. Diabetes. 2012;61(8):2093–2104.
- Baek A, Yoon S, Kim J, et al. Autophagy and KRT8/keratin 8 protect degeneration of retinal pigment epithelium under oxidative stress. Autophagy. 2017;13(2):248–263.
- Klein R, Meuer SM, Knudtson MD, et al. The epidemiology of retinal reticular drusen. Am J Ophthalmol. 2008;145(2):317–326.
- Zweifel SA, Imamura Y, Spaide TC, et al. Prevalence and Significance of Subretinal Drusenoid Deposits (Reticular Pseudodrusen) in age-related macular degeneration. Ophthalmology. 2010;117(9):1775–1781.
- Kim JY, Zhao H, Martinez J, et al. Noncanonical autophagy promotes the visual cycle. Cell. 2013;154:365–376.
- Kaarniranta K, Sinha D, Blasiak J, et al. Autophagy and heterophagy dysregulation leads to retinal pigment epithelium dysfunction and development of age-related macular degeneration. Autophagy. 2013;9(7):973–984.
- Palikaras K, Lionaki E, Tavernarakis N. Mechanisms of mitophagy in cellular homeostasis, physiology and pathology. Nat Cell Biol. 2018;20(9):1013–1022.
- Felszeghy S, Viiri J, Paterno JJ, et al. Loss of NRF-2 and PGC-1alpha genes leads to retinal pigment epithelium damage resembling dry age-related macular degeneration. Redox Biol. 2019;20:1–12.
- Mitter SK, Song C, Qi X, et al. Dysregulated autophagy in the RPE is associated with increased susceptibility to oxidative stress and AMD. Autophagy. 2005;2014(10):1989.
- Karlsson M, Frennesson C, Gustafsson T, et al. Autophagy of iron-binding proteins may contribute to the oxidative stress resistance of ARPE-19 cells. Exp Eye Res. 2013;116:359–365.
- Leidal AM, Levine B, Debnath J. Autophagy and the cell biology of age-related disease. Nat Cell Biol. 2018;20(12):1338–1348.
- Lei L, Tzekov R, Li H, et al. Inhibition or stimulation of autophagy affects early formation of lipofuscin-like autofluorescence in the retinal pigment epithelium cell. Int J Mol Sci. 2017;18(4):18.
- Tatsuta T, Langer T. Quality control of mitochondria: protection against neurodegeneration and ageing. Embo J. 2008;27(2):306–314.
- Youle RJ, Narendra DP. Mechanisms of mitophagy. Nat Rev Mol Cell Biol. 2011;12(1):9–14.
- Kim I, Rodriguez-Enriquez S, Lemasters JJ. Selective degradation of mitochondria by mitophagy. Arch Biochem Biophys. 2007;462(2):245–253.
- Anesti V, Scorrano L. The relationship between mitochondrial shape and function and the cytoskeleton. Bba-Bioenergetics. 2006;1757:692–699.
- Duan S, Yao Z, Zhu Y, et al. The Pirh2-keratin 8/18 interaction modulates the cellular distribution of mitochondria and UV-induced apoptosis. Cell Death Differ. 2009;16:826–837.
- Toivola DM, Tao GZ, Habtezion A, et al. Cellular integrity plus: organelle-related and protein-targeting functions of intermediate filaments. Trends Cell Biol. 2005;15:608–617.
- Castanon MJ, Walko G, Winter L, et al. Plectin-intermediate filament partnership in skin, skeletal muscle, and peripheral nerve. Histochem Cell Biol. 2013;140:33–53.
- Wiche G, Winter L. Plectin isoforms as organizers of intermediate filament cytoarchitecture. Bioarchitecture. 2011;1:14–20.
- Tao GZ, Looi KS, Toivola DM, et al. Keratins modulate the shape and function of hepatocyte mitochondria: a mechanism for protection from apoptosis. J Cell Sci. 2009;122:3851–3855.
- Castello PR, Drechsel DA, Patel M. Mitochondria are a major source of paraquat-induced reactive oxygen species production in the brain. J Biol Chem. 2007;282:14186–14193.
- Pendergrass W, Wolf N, Poot M. Efficacy of MitoTracker Green (TM) and CMXRosamine to measure changes in mitochondrial membrane potentials in living cells and tissues. Cytom Part A. 2004;61A:162–169.
- Pinton P, Giorgi C, Siviero R, et al. Calcium and apoptosis: ER-mitochondria Ca2+ transfer in the control of apoptosis. Oncogene. 2008;27(50):6407–6418.
- Chappell JB, Crofts AR. Calcium ion accumulation and volume changes of isolated liver mitochondria. Calcium ion-induced swelling. Biochem J. 1965;95:378–386.
- Halestrap AP. What is the mitochondrial permeability transition pore? J Mol Cell Cardiol. 2009;46(6):821–831.
- Rizzuto R, De Stefani D, Raffaello A, et al. Mitochondria as sensors and regulators of calcium signalling. Nat Rev Mol Cell Biol. 2012;13(9):566–578.
- Chen YW, Yang YT, Hung DZ, et al. Paraquat induces lung alveolar epithelial cell apoptosis via Nrf-2-regulated mitochondrial dysfunction and ER stress. Arch Toxicol. 2012;86(10):1547–1558.
- Chinta SJ, Rane A, Poksay KS, et al. Coupling endoplasmic reticulum stress to the cell death program in dopaminergic cells: effect of paraquat. Neuromolecular Med. 2008;10(4):333–342.
- Nakagawa T, Shimizu S, Watanabe T, et al. Cyclophilin D-dependent mitochondrial permeability transition regulates some necrotic but not apoptotic cell death. Nature. 2005;434(7033):652–658.
- Vande Velde C, Cizeau J, Dubik D, et al. BNIP3 and genetic control of necrosis-like cell death through the mitochondrial permeability transition pore. Mol Cell Biol. 2000;20(15):5454–5468.
- Yamada T, Murata D, Adachi Y, et al. Mitochondrial stasis reveals p62-Mediated ubiquitination in parkin-independent mitophagy and mitigates nonalcoholic fatty liver disease. Cell Metab. 2018;28::588–+.
- Hernandez G, Thornton C, Stotland A, et al. MitoTimer: a novel tool for monitoring mitochondrial turnover. Autophagy. 2013;9(11):1852–1861.
- Reipert S, Steinbock F, Fischer I, et al. Association of mitochondria with plectin and desmin intermediate filaments in striated muscle. Exp Cell Res. 1999;252:479–491.
- Winter L, Abrahamsberg C, Wiche G. Plectin isoform 1b mediates mitochondrion-intermediate filament network linkage and controls organelle shape. J Cell Biol. 2008;181:903–911.
- Matveeva EA, Venkova LS, Chernoivanenko IS, et al. Vimentin is involved in regulation of mitochondrial motility and membrane potential by Rac1. Biol Open. 2015;4(10):1290–1297.
- Sripathi SR, He WL, Sylvester O, et al. Altered cytoskeleton as a mitochondrial decay signature in the retinal pigment epithelium. Protein J. 2016;35:179–192.
- Ashrafi G, Schwarz TL. The pathways of mitophagy for quality control and clearance of mitochondria. Cell Death Differ. 2013;20(1):31–42.
- Clark IE, Dodson MW, Jiang CG, et al. Drosophila pink1 is required for mitochondrial function and interacts genetically with parkin. Nature. 2006;441(7097):1162–1166.
- Park J, Lee SB, Lee S, et al. Mitochondrial dysfunction in Drosophila PINK1 mutants is complemented by parkin. Nature. 2006;441(7097):1157–1161.
- Geisler S, Holmstrom KM, Skujat D, et al. PINK1/Parkin-mediated mitophagy is dependent on VDAC1 and p62/SQSTM1. Nat Cell Biol. 2010;12(2):119–131.
- Cuervo AM, Bergamini E, Brunk UT, et al. Autophagy and aging - The importance of maintaining “clean” cells. Autophagy. 2005;1:131–140.
- Terman A, Brunk UT. The aging myocardium: roles of mitochondrial damage and lysosomal degradation. Heart Lung Circ. 2005;14:107–114.
- Terman A, Gustafsson B, Brunk UT. Autophagy, organelles and ageing. J Pathol. 2007;211(2):134–143.
- Hajnoczky G, Robb-Gaspers LD, Seitz MB, et al. Decoding of cytosolic calcium oscillations in the mitochondria. Cell. 1995;82(3):415–424.
- Rizzuto R, Pinton P, Carrington W, et al. Close contacts with the endoplasmic reticulum as determinants of mitochondrial Ca2+ responses. Science. 1998;280:1763–1766.
- Twig G, Elorza A, Molina AJ, et al. Fission and selective fusion govern mitochondrial segregation and elimination by autophagy. Embo J. 2008;27:433–446.
- Mao K, Klionsky DJ. Mitochondrial fission facilitates mitophagy in Saccharomyces cerevisiae. Autophagy. 2013;9:1900–1901.
- Yoo SM, Yamashita S, Kim H, et al. FKBP8 LIRL-dependent mitochondrial fragmentation facilitates mitophagy under stress conditions. Faseb J. 2020;34:2944–2957.
- Winter L, Kuznetsov AV, Grimm M, et al. Plectin isoform P1b and P1d deficiencies differentially affect mitochondrial morphology and function in skeletal muscle. Hum Mol Genet. 2015;24:4530–4544.
- Natsuga K, Nishie W, Shinkuma S, et al. Plectin deficiency leads to both muscular dystrophy and pyloric atresia in epidermolysis bullosa simplex. Hum Mutat. 2010;31:E1687–E98.
- Smith FJD, Eady RAJ, Leigh IM, et al. Plectin deficiency results in muscular dystrophy with epidermolysis bullosa. Nat Genet. 1996;13:450–457.