
 ?Mathematical formulae have been encoded as MathML and are displayed in this HTML version using MathJax in order to improve their display. Uncheck the box to turn MathJax off. This feature requires Javascript. Click on a formula to zoom.
ABSTRACT
In Saccharomyces cerevisiae, Atg9 is an important autophagy-related (Atg) protein, and interacts with hundreds of other proteins. How many Atg9-interacting proteins are involved in macroautophagy/autophagy is unclear. Here, we conducted a multi-omic profiling of Atg9-dependent molecular landscapes during nitrogen starvation-induced autophagy, and identified 290 and 256 genes to be markedly regulated by ATG9 in transcriptional and translational levels, respectively. Unexpectedly, we found most of known Atg proteins and autophagy regulators that interact with Atg9 were not significantly changed in the mRNA or protein level during autophagy. Based on a hypothesis that proteins with similar molecular characteristics might have similar functions, we developed a new method named inference of functional interacting partners (iFIP) to integrate the transcriptomic, proteomic and interactomic data, and predicted 42 Atg9-interacting proteins to be potentially involved in autophagy, including 15 known Atg proteins or autophagy regulators. We validated 2 Atg9-interacting partners, Glo3 and Scs7, to be functional in both bulk and selective autophagy. The mRNA and protein expressions but not subcellular localizations of Glo3 and Scs7 were affected with or without ATG9 during autophagy, whereas the colocalizations of the 2 proteins and Atg9 were markedly enhanced at early stages of the autophagic process. Further analyses demonstrated that Glo3 but not Scs7 regulates the retrograde transport of Atg9 during autophagy. A working model was illustrated to highlight the importance of the Atg9 interactome. Taken together, our study not only provided a powerful method for analyzing the multi-omics data, but also revealed 2 new players that regulate autophagy.
Abbreviations: ALP: alkaline phosphatase; Arf1: ADP-ribosylation factor 1; Atg: autophagy-related; Co-IP: co-immunoprecipitation; Cvt: cytoplasm-to-vacuole targeting; DEM: differentially expressed mRNA; DEP: differentially expressed protein; DIC: differential interference contrast; E-ratio: enrichment ratio; ER: endoplasmic reticulum; ES: enrichment score; FC: fold change; FPKM: fragments per kilobase of exon per million fragments mapped; GAP: GTPase-activating protein; GFP: green fluorescent protein; GO: gene ontology; GSEA: gene set enrichment analysis; GST: glutathione S-transferase; HA: hemagglutinin; iFIP: inference of functional interacting partners; KO: knockout; LR: logistic regression; OE: over-expression; PAS: phagophore assembly site; PPI: protein-protein interaction; RFP: red fluorescence protein; RNA-seq: RNA sequencing; RT-PCR: real-time polymerase chain reaction; SCC: Spearman’s correlation coefficient; SD-N: synthetic minimal medium lacking nitrogen; THANATOS: The Autophagy, Necrosis, ApopTosis OrchestratorS; Vsn: variance stabilization normalization; WT: wild-type.
Introduction
Macroautophagy (hereafter referred to as autophagy) is a lysosome/vacuole-based degradative pathway, and involved in the formation of autophagosome for the engulfment and delivery of cytoplasmic materials, such as damaged organelles, misfolded proteins, aggregates, and/or intercellular pathogens, into lysosome/vacuole for the degradation and recycling [Citation1–4]. Autophagy can be classified into 2 types including bulk/nonselective and selective autophagy [Citation4]. Under nutritional constraints as well as numerous other stress conditions, autophagy activity is dramatically upregulated to exert the cytoprotective function and promote cell survival rather than cell death. In the field of autophagy, the yeast Saccharomyces cerevisiae was established as a classical model organism [Citation3–6]. The understanding on the molecular mechanisms of autophagy has rapidly grown since the discovery of 37 autophagy-related (ATG) genes including a recently discovered ATG42, which are crucial for orchestrating the autophagic process in S. cerevisiae [Citation4,Citation7]. An additional 5 ATG genes, ATG25, ATG28, ATG30, ATG35 and ATG37, were exclusively encoded in the yeast Komagataella phaffii/Pichia pastoris [Citation8], and ATG43 was discovered in Schizosaccharoymces pombe [Citation9]. Our previous studies demonstrated that 24 of the 41 yeast ATG genes were conserved with orthologous counterparts in mammals [Citation8]. Thus, the core machinery of autophagy is highly conserved in eukaryotes. Besides Atg proteins, a considerable number of autophagy regulators were reported to be involved in regulating autophagy [Citation10]. For example, yeast target of rapamycin complex 1 (TORC1) is activated to inhibit autophagy in nutrient-rich medium, whereas the exposure of rapamycin induces autophagy by inhibiting TORC1 [Citation11,Citation12].
Among 18 core ATG genes essential for starvation-induced autophagosome formation in S. cerevisiae, Atg9 is the only transmembrane protein that plays a critical role in membrane transport, phagophore nucleation and autophagosome formation [Citation13]. Yeast Atg9 and its mammalian counterparts were predicted with 6 transmembrane α helices, as well as intrinsically disordered regions (IDRs) in its N- and C-terminal regions, which are both exposed to the cytoplasm [Citation14]. However, a recently reported high-resolution cryoelectron microscopy (cryo-EM) structure demonstrated that human ATG9A, an ortholog of yeast Atg9, only consists of 4 transmembrane helices, and 2 partially membrane-embedded helices do not completely cross the membrane [Citation15]. Atg9 is highly conserved across eukaryotes [Citation16], and the majority of yeast Atg9 locates on cytoplasmic mobile membrane vesicles, which are produced and transported from the Golgi apparatus in a process dependent on Atg23 and Atg27 [Citation17,Citation18]. Upon various stress stimuli, small Atg9 vesicles are recruited to the phagophore assembly site (PAS) for phagophore nucleation. The transport of Atg9 from the PAS back to cytoplasmic vesicles is controlled by Atg1, which is a serine/threonine protein kinase regulated by Tor1 [Citation19,Citation20]. In particular, recent studies reported that both yeast Atg9 and human ATG9A are lipid scramblases to bidirectionally translocate phospholipids of membranes in vitro [Citation21,Citation22], and Atg9-mediated transbilayer phospholipid transport was proposed to play a critical role in the expansion of phagophore [Citation21–23]. Furthermore, it has been postulated that Atg9-containing vesicles contribute to the formation of the autophagosome precursor, the phagophore, rather than providing the bulk of autophagosomal membrane in both yeast and mammals [Citation17,Citation18,Citation24,Citation25]. In particular, Atg9 vesicles act as seeds to establish membrane contact sites for recruitment of downstream Atg proteins [Citation25]. Indeed, Atg9 was detected to interact with a large number of other Atg proteins [Citation26,Citation27]. For example, Atg9 first recognizes and binds the Hop/Rev7/Mad2 (HORMA) domain of Atg13 at the PAS, then recruits Atg2 and Atg18 for the interaction [Citation28,Citation29]. In this regard, Atg9 is an important member of the core autophagy machinery for regulating the autophagy activity. Beyond other Atg proteins, Atg9 also interacts with multiple autophagy regulators or other proteins. How many Atg9-interacting proteins are functional in autophagy is unclear, and how members in the Atg9 interactome synergistically orchestrate the autophagic process remain to be dissected.
In this study, we performed a time-series transcriptomic and proteomic profiling of Atg9-dependent molecular changes in S. cerevisiae during nitrogen starvation-induced autophagy. From the omics data, we in total identified 290 differentially expressed mRNAs (DEMs) and 256 differentially expressed proteins (DEPs) in atg9 knockout (KO) (atg9∆) strain against wild-type (WT) yeasts. We found that most of known Atg9-interacting Atg proteins and autophagy regulators were only moderately changed with or without Atg9 during autophagy. In contrast with conventional studies that were mainly focused on the analysis of DEMs or DEPs, we hypothesized that other proteins sharing similar molecular characteristics with known Atg proteins and autophagy regulators might be also involved in regulation of autophagy. Thus, we integrated the Atg9-centered transcriptomic, proteomic and interactomic data sets, and developed a new computational method for the inference of functional interacting partners (iFIP). Using iFIP, we predicted 42 Atg9-interacting partners to be potentially involved in autophagy, including 15 known Atg proteins or autophagy regulators. Using gene knockout (KO) strains, we screened remaining candidates if available, and validated 2 Atg9-interacting proteins, Glo3 and Scs7, to play a potential role in regulating autophagy activity. Further experiments showed that the mRNA and protein expressions but not subcellular localizations of Glo3 and Scs7 were affected by Atg9 during autophagy. Glo3 and Scs7 partially colocalized with Atg9, and their colocalizations were markedly enhanced in early stages of the autophagic process. The 2 proteins were validated to participate in regulating both bulk and selective autophagy. In addition, we found Glo3 but not Scs7 regulates the retrograde transport of Atg9 during autophagy. In addition, a working model was established for highlighting the functional importance of the Atg9 interactome. Taken together, our study not only designed an efficient method for integrating and analyzing the multi-omics data, but also revealed new players in yeast autophagy.
Results
Integration of multi-omics data predicts new autophagy regulators that interact with yeast Atg9
The whole experimental procedure of the study was shown (). First, the WT and atg9∆ yeasts in BY4741 background were separately cultured under nitrogen starvation for 0, 1 and 4 h (). For each time point, yeast cells were collected for the transcriptomic and proteomic profiling, respectively. The multi-omics data was carefully processed and analyzed (). Here, we adopted the WT data as the control, and pairwise characterized yeast genes differentially regulated in atg9∆ against WT yeasts at the mRNA or protein level for each time point. To identify potential DEMs from the transcriptomic data, an extensively used protocol based on Bowtie [Citation30], TopHat [Citation31] and Cufflinks [Citation32] was employed to map the raw reads to the reference mRNA sequences in S. cerevisiae (), calculate the fragments per kilobase of exon per million fragments mapped (FPKM) value for each mappable mRNA, and determine the statistical significance between each time point of the 2 yeast strains. To identify potential DEPs with different abundances between atg9∆ and WT yeasts, the label-free quantification technology coupled with the liquid chromatography-tandem mass spectrometry (LC-MS/MS) were adopted. The raw MS/MS spectra were searched against the reference protein sequences of S. cerevisiae using MaxQuant, a mainstream search engine for processing the MS/MS data [Citation33] (). To enable comparisons across different samples, the imputation of missing values was first conducted and raw MS/MS intensities were then normalized by PANDA-view (), a convenient tool for analyzing and visualizing the quantitative proteomic data [Citation34].
Figure 1. The whole procedure of the study. (A) The experimental procedure of sample preparation. WT and atg9∆ yeast cells were cultured in SD-N medium for 0, 1 and 4 h. Then, the cells were collected for the transcriptomic and proteomic quantifications. (B) The processing and analyses of multi-omics data. For the transcriptomic data, Bowtie [Citation30], TopHat [Citation31] and Cufflinks [Citation32] were adopted for mRNA alignment, assembly and quantification. Meanwhile, MaxQuant [Citation33] and PANDA-view [Citation34] were used for processing and analyzing the proteomic data. (C) The iFIP algorithm. To integrate the transcriptomic, proteomic and interactomic data, a computational method named iFIP was developed to predict potential Atg proteins or autophagy regulators from Atg9-interacting proteins. (D) The experimental validations. Based on the results from iFIP, additional experiments were conducted to validate the predictions for finding new players in autophagy
![Figure 1. The whole procedure of the study. (A) The experimental procedure of sample preparation. WT and atg9∆ yeast cells were cultured in SD-N medium for 0, 1 and 4 h. Then, the cells were collected for the transcriptomic and proteomic quantifications. (B) The processing and analyses of multi-omics data. For the transcriptomic data, Bowtie [Citation30], TopHat [Citation31] and Cufflinks [Citation32] were adopted for mRNA alignment, assembly and quantification. Meanwhile, MaxQuant [Citation33] and PANDA-view [Citation34] were used for processing and analyzing the proteomic data. (C) The iFIP algorithm. To integrate the transcriptomic, proteomic and interactomic data, a computational method named iFIP was developed to predict potential Atg proteins or autophagy regulators from Atg9-interacting proteins. (D) The experimental validations. Based on the results from iFIP, additional experiments were conducted to validate the predictions for finding new players in autophagy](/cms/asset/70093665-83be-4aac-8c3c-3a0da8ff431c/kaup_a_1898749_f0001_oc.jpg)
From public databases that maintained experimentally characterized protein-protein interactions (PPIs), we obtained 341 non-redundant Atg9-interacting proteins in S. cerevisiae. Previously, we developed a database named The Autophagy, Necrosis, ApopTosis OrchestratorS (THANATOS, http://thanatos.biocuckoo.org), which contained 191,543 experimentally or computationally identified proteins involved in regulating autophagy and cell death pathways in 164 eukaryotes, through literature biocuration and orthologous detection [Citation8]. From THANATOS, we compiled a benchmark data set containing 39 known Atg proteins and autophagy regulators that interact with yeast Atg9. To integrate the multi-omics data, we designed a machine learning method named iFIP, by training a logistic regression (LR) model that differentially weighted various features derived from the transcriptomic, proteomic and interactomic data sets (). Using iFIP, Atg9-interacting proteins that are potentially involved in regulating autophagy were predicted. The known Atg proteins and autophagy regulators were singled out, while we screened the remaining candidates using the green fluorescent protein (GFP)-Atg8 immunoblotting assay, one of the most popular end-point measurements for monitoring yeast autophagy, in their corresponding KO strains if available (). Screened autophagy regulators were further validated to ensure the reproducibility, whereas the phenotypic changes of their KO strains during autophagy were directly observed under the confocal microscopy and analyzed by DeepPhagy (http://deepphagy.biocuckoo.org/) [Citation35], a deep learning-based software package for quantitative analysis of autophagy activity, by calculating the proportion of cells with GFP-Atg8 vacuolar delivery from yeast fluorescent images (). The co-immunoprecipitation (Co-IP) assay was used to validate the potential interactions between Atg9 and the new autophagy regulators. Potential mechanisms of the new regulators involved in autophagy were studied. A core Atg9 interactome in orchestrating autophagy was modeled.
Transcriptomic and proteomic analysis of yeast Atg9-dependent molecular landscapes
From the transcriptomes of the 6 samples, 2.84 × 10⁸ clean reads were first generated by RNA sequencing (RNA-seq) technology, and then mapped to non-redundant mRNA sequences in S. cerevisiae (). The mRNA expression levels of different samples showed a similar distribution, with an average FPKM value of 321.75 (). In our results, 6,473 yeast mRNAs were detected with at least one read from 6 samples, with an average of 6,178 mRNAs per sample ( and Table S1). Interestingly, we observed an extremely high overlap of 6396 genes (99.38%) mutually detected in WT and atg9∆ strains, indicating the high reliability of the transcriptomic data. As expected, the average FPKM value of ATG9 was calculated as 38.51 and 0.05 in WT and atg9∆ strains, respectively, supporting a complete deletion of ATG9 in atg9∆ yeasts (Table S1). From the transcriptomic data, 290 DEMs were detected between atg9∆ and WT strains in at least one time point, including 109 and 181 DEMs to be significantly upregulated and downregulated in atg9∆ yeasts, respectively ( and Table S1, p-value < 0.05).
Figure 2. A summary of the transcriptomic and proteomic data. (A) The numbers of clean reads sequenced from WT and atg9∆ strains. (B) The distribution of FPKM values for identified mRNAs. (C) The numbers of mRNAs detected with at least one read in WT and atg9∆ samples. (D) The overlap of significantly upregulated or downregulated mRNAs in the 3 time points. (E) The distribution of numbers of peptides in mappable proteins. (F) The distribution of intensity values of proteins in each sample before and after normalization. (G) The overlap of significantly upregulated or downregulated proteins in the 3 time points. (H) The overlap of DEMs and DEPs. (I) The GO-based enrichment analysis of biological processes at mRNA and protein levels
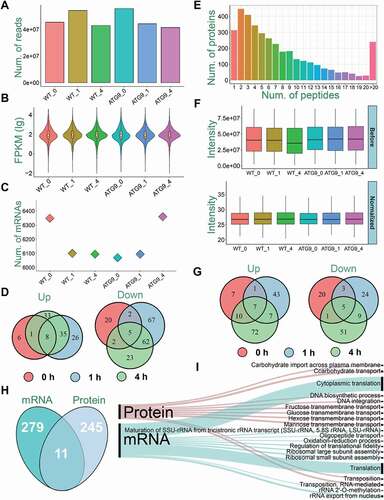
For the analysis of the proteomic data, 27,816 non-redundant peptides were quantitatively identified from the 6 samples, after the MaxQuant [Citation33] search. These short peptides were then mapped to their corresponding protein sequences, and in total 3,678 unique proteins were quantified with at least one detected peptide (Table S2). To evaluate the reliability of protein identification, the distribution of numbers of peptides mapped to proteins was shown, and the result demonstrated a high reliability that 91.51% of all proteins were mapped with ≥ 2 peptides (). In contrast with transcriptomes, the overlap of proteins mutually identified in WT and atg9∆ strains was considerably reduced to 88.22%. However, proteins are more dynamic and cannot be amplified against mRNAs, whereas the proteomic profiling is much more difficult than RNA-seq [Citation36]. Thus, such a high overlap was still promising to support the data quality. To reduce the fluctuations among different samples for a cross-sample comparison, a user-friendly tool, PANDA-view [Citation34], was used for imputation of missing values and data normalization (). The protein expression levels of 33 Atg proteins and autophagy regulators were shown before and after imputation and normalization (Fig. S1A). It could be found that missing expression values of proteins were imputed by PANDA-view [Citation34]. After normalization, the fold change (FC) values of maximum vs. minimum expression levels were decreased for quantified proteins, e.g., Esa1 and Snc2 (Fig. S1B), indicating the data variance in proteomic data was considerably reduced. Using a cutoff of FC > 3 or < 1/3, we identified 256 potential DEPs, including 147 and 113 DEPs significantly upregulated and downregulated in atg9∆ yeasts, respectively ( and Table S3).
Through a comparison, we found that only 11 significantly changed genes in both mRNA and protein levels (), indicating that the transcriptome and proteome were differentially shaped by Atg9. Next, the gene ontology (GO)-based enrichment analysis was performed to identify major biological processes regulated by Atg9 in the transcriptomic and proteomic data (). Interestingly, we found that a number of membrane transport processes were exclusively enriched in the protein level, whereas translation-related processes were only enriched in the mRNA level. Such a result further emphasized different roles of Atg9 in shaping molecular landscapes in transcriptional and translational levels, respectively.
Molecular dynamics of the yeast Atg9 interactome during autophagy
From 4 public PPI databases including BioGRID [Citation37], IID [Citation38], HINT [Citation39] and iRefIndex [Citation40], we obtained 341 known Atg9-interacting proteins in S. cerevisiae. These PPIs were identified by 14 types of experimental methods (Table S4), which were defined by the Proteomics Standards Initiative–Molecular Interactions (PSI–MI) controlled vocabulary and maintained in the Ontobee database (http://www.ontobee.org/) [Citation41]. To exploit the correlation of the Atg9 interactome and autophagy, a GO-based enrichment was conducted for 341 Atg9-interacting proteins. Obviously, we found that most of enriched biological processes were experimentally validated to be closely associated with autophagy (). For example, the most significantly over-represented pathway was protein transport (GO:0015031), which was reported to be crucial in nitrogen starvation-induced autophagy [Citation42,Citation43]. Also, 2 enriched processes such as vesicle-mediated transport (GO:0016192) and protein localization by Cvt pathway (GO:0032258) were also known to participate in regulating autophagy [Citation44] (). In this regard, our analysis supported a critical role of the Atg9 interactome in autophagy.
Figure 3. The analysis of the yeast Atg9 interactome during autophagy. (A) The GO-based enrichment analysis of 341 Atg9-interacting proteins, by using GO biological process terms. (B) The number of Atg9-interacting proteins detected by the transcriptomic and/or proteomic analyses. (C) The mRNA expression levels of 341 Atg9-interacting proteins. For proteins not detected by the transcriptomic profiling in any samples, their mRNA levels were set as 0 and visualized in black. (D) The protein expression levels of the Atg9 interactome. For proteins not detected, their expression levels were set as 0 and visualized in black. (E) The Spearman’s correlation between steady-state mRNA and protein abundance for the Atg9-interacting proteins. *p-value < 10−5; **p-value < 10−10; ***p-value < 10−20. (F) The overlap of DEMs in the Atg9 interactome and the 39 known Atg proteins and autophagy regulators taken from the THANATOS database [Citation8]. (G) The overlap of DEPs in the Atg9 interactome and the 39 proteins in THANATOS [Citation8]
![Figure 3. The analysis of the yeast Atg9 interactome during autophagy. (A) The GO-based enrichment analysis of 341 Atg9-interacting proteins, by using GO biological process terms. (B) The number of Atg9-interacting proteins detected by the transcriptomic and/or proteomic analyses. (C) The mRNA expression levels of 341 Atg9-interacting proteins. For proteins not detected by the transcriptomic profiling in any samples, their mRNA levels were set as 0 and visualized in black. (D) The protein expression levels of the Atg9 interactome. For proteins not detected, their expression levels were set as 0 and visualized in black. (E) The Spearman’s correlation between steady-state mRNA and protein abundance for the Atg9-interacting proteins. *p-value < 10−5; **p-value < 10−10; ***p-value < 10−20. (F) The overlap of DEMs in the Atg9 interactome and the 39 known Atg proteins and autophagy regulators taken from the THANATOS database [Citation8]. (G) The overlap of DEPs in the Atg9 interactome and the 39 proteins in THANATOS [Citation8]](/cms/asset/b386ad49-d4f7-4d11-a30e-75d78e7506ae/kaup_a_1898749_f0003_oc.jpg)
Next, we checked the transcriptomic and proteomic data, and found that 325 (95.31%) and 282 (82.70%) Atg9-interacting partners were detected at the mRNA or protein level, respectively (). Also, 270 (79.18%) Atg9-interacting partners were simultaneously detected at both two levels (), indicating a high coverage of the multi-omics data for profiling the Atg9 interactome. For the 6 samples, the mRNA and protein expression levels of the Atg9-interacting partners were shown in heatmaps (), and the average correlation between steady-state mRNA and protein abundance of Atg9-interacting partners was calculated [Citation45], with a Spearman’s correlation coefficient (SCC) ranged from 0.112 to 0.698 (). The mRNA-protein correlations were highly significant in all the 3 samples of WT cells (SCC ≥ 0.500, p-value ≤ 1.74 × 10⁻¹⁸), as well as atg9∆ yeasts not entering autophagy (SCC = 0.616, p-value = 1.43 × 10⁻²⁹) (). The mRNA-protein correlations were markedly reduced in atg9∆ yeasts under nitrogen starvation for 1 and 4 h, with the SCCs as 0.112 (p-value = 0.07) and 0.268 (p-value = 5.23 × 10⁻⁶), respectively (). In this regard, Atg9 contributes to the accordant changes in mRNA and protein expression levels of its interacting partners during autophagy.
Finally, we mapped the 290 DEMs and 256 DEPs markedly regulated by Atg9 to the 341 Atg9-interacting proteins, and found only 3 known Atg proteins and autophagy regulators including Pho23, Atg11 and Sso1 were covered (). Using the same methods and criteria, we also identified potential DEMs and DEPs during autophagy in WT or atg9∆ cells, and very few Atg proteins and autophagy regulators were covered (Fig. S2). The results indicated that most of Atg proteins and autophagy regulators in the Atg9 interactome were not significantly changed during autophagy in the mRNA or protein level with or without Atg9.
The development of iFIP for integrating the multi-omics data
From the above analysis, it could be found that a known Atg protein or autophagy regulator in the Atg9 interactome only underwent a moderate change at the mRNA or protein level after knocking out ATG9. Also, these proteins should tend to interact with other Atg proteins and/or autophagy regulators to synergistically orchestrate the autophagic process. If other proteins also exhibited similar transcriptomic, proteomic and/or interactomic features to these known Atg proteins and/or autophagy regulators, they might be potentially new autophagy regulators.
Based on a hypothesis that proteins with similar molecular features might have similar functions, we developed a machine learning-based method named iFIP to integrate the transcriptomic, proteomic and interactomic data sets for the prediction of new autophagy regulators, which interact with Atg9 to be potentially important in autophagy (). For the preparation of benchmark data sets, we took 174 yeast Atg proteins and autophagy regulators from THANATOS [Citation8], covering 39 Atg9-interacting partners that were regarded as the positive data. The remaining 302 proteins that interact with yeast Atg9 were taken as the negative data. For each Atg9-interacting protein, we considered 3 types of features including the differential levels of mRNA and protein expression in atg9∆ against WT strains, as well as the number of interacting Atg proteins and autophagy regulators. Then an initial model was trained with the LR classifier for maximally predicting known Atg proteins and autophagy regulators as positive hits, and the 3 weights of transcriptomic, proteomic and interactomic features were determined as 0.969, −1.654 and 2.290, respectively. In iFIP, a higher score denoted a higher probability of a protein to be a real Atg protein or autophagy regulator. Furthermore, an extensively used method named gene set enrichment analysis (GSEA) [Citation46] was adopted for the optimization of the computation model, with final weights of 0.269, 2.246 and 2.290, respectively.
Figure 4. The overview of iFIP algorithm. The experimentally identified PPIs in S. cerevisiae were downloaded from 4 public databases, including BioGRID [Citation37], IID [Citation38], HINT [Citation39] and iRefIndex [Citation40]. The 341 Atg9-interacting proteins were mapped to 174 Atg proteins and autophagy regulators from THANATOS database. After that, 39 known Atg proteins and autophagy regulators (Red circles) were regarded as the positive data, while the remaining 302 proteins (Blue circles) were taken as the negative data. Based on 3 types of features derived from the transcriptomic, proteomic and interactomic data, the LR classifier was adopted to train an initial model, which was further refined by the GSEA method [Citation46]
![Figure 4. The overview of iFIP algorithm. The experimentally identified PPIs in S. cerevisiae were downloaded from 4 public databases, including BioGRID [Citation37], IID [Citation38], HINT [Citation39] and iRefIndex [Citation40]. The 341 Atg9-interacting proteins were mapped to 174 Atg proteins and autophagy regulators from THANATOS database. After that, 39 known Atg proteins and autophagy regulators (Red circles) were regarded as the positive data, while the remaining 302 proteins (Blue circles) were taken as the negative data. Based on 3 types of features derived from the transcriptomic, proteomic and interactomic data, the LR classifier was adopted to train an initial model, which was further refined by the GSEA method [Citation46]](/cms/asset/6ba39013-9fa5-4f04-bbdb-2129b9bb25ac/kaup_a_1898749_f0004_oc.jpg)
From the results, we found the most weighted feature was derived from the interactomic data, indicating a protein interacting with more known Atg proteins and autophagy regulators had a higher probability to be involved in autophagy. The proteomic feature held a secondary and slightly lower weight value. The result was consistent with experimental observations that several Atg proteins and autophagy regulators are critical for the cargo delivery and subsequently degraded in vacuole together with their cargos, whereas the KO of ATG9 blocks the degradative process. In addition, the mRNA expression levels of other Atg proteins and autophagy regulators might be considerably induced for trying to complement the loss of ATG9. Thus, the differential mRNA levels in atg9∆ against WT strains are positively correlated with predicted values, although in a much less extent.
Prediction of Atg9-interacting proteins that are potentially functional in autophagy
To evaluate the accuracy of iFIP, 2 measurements of sensitivity (Sn) and specificity (Sp) were directly calculated based on the training data set, as the self-consistency validation. The receiver operating characteristic (ROC) curves were illustrated, and area under curve (AUC) values were calculated as 0.824 and 0.855 for the initial model determined by LR and the optimized model refined by GSEA (). From the results, it was demonstrated that the GSEA refinement considerably improve the prediction performance. Using a stringent cutoff value (Sp = 91%), we predicted 42 Atg9-interacting proteins to be potentially involved in autophagy, including 15 well-known Atg proteins and autophagy regulators, whereas the feature values in mRNA, protein and PPI levels were also visualized ( and Table S5).
Figure 5. The prediction of potential Atg proteins and autophagy regulators from Atg9-interacting proteins. (A) The ROC curves with corresponding AUC values of initial and final models determined by LR and GSEA, respectively. (B) The 42 predicted Atg9-interacting proteins, including 15 known Atg proteins and autophagy regulators marked in red. For each protein, the values of different features were illustrated, and more details were shown in Table S5. (C) The functional screen of 17 genes with their corresponding KO mutants through the GFP immunoblotting assay. For each KO strain, the ratio between free GFP and the total amount of free GFP and GFP-Atg8 was measured and compared with the WT strain. (D) The FPKM and normalized intensity values of mRNA and protein expressions were shown for GLO3 and SCS7 in different samples if quantified, respectively. All experiments were independently repeated 3 times. Statistical analyses were conducted by using the two-sided t-test.*p-value < 0.05; **p-value < 0.01; ****p-value < 0.0001
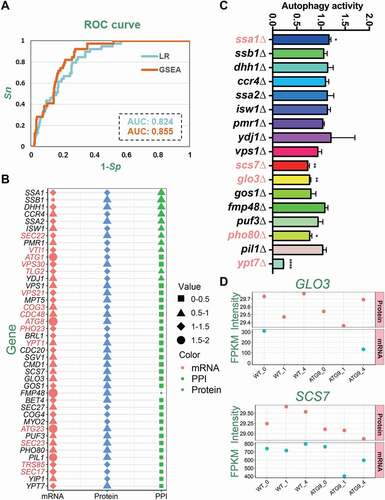
For the remaining 27 Atg9-interacting proteins, we checked the library of Yeast Deletion Clones and found 17 of them having KO strains. Then, we individually transformed a GFP-Atg8 plasmid to each KO strain, screened the 17 available candidates by immunoblotting after nitrogen starvation for 1 h, and calculated the ratio between free GFP and the total amount of free GFP and GFP-Atg8 (). From the results, we found that 5 KO mutants including ssa1∆, scs7∆, glo3∆, pho80∆, and ypt7∆ exhibited significantly altered autophagy activity compared with the WT strains (). To confirm whether the 5 genes were previously reported to regulate autophagy or not, we carefully conducted a literature biocuration since THANTOS database might have missed some important proteins. Ssa1, one of the counterparts of mammalian HSPA8/HSC70 (heat shock protein family A (Hsp70) member 8), has been documented as a critical autophagy regulator [Citation10]. Also, it was reported that Pho80, a component of Pho85-associated cyclin complexes, plays an important role in both inhibiting and enhancing autophagy [Citation47]. Previously, it was demonstrated that Ypt7 is required for the fusion of autophagosomes to the vacuole. The ypt7∆ cells under starvation have many fragmented vacuoles, and more autophagosomes are present in the cytoplasm of the ypt7∆ mutant than in the cytoplasm of WT cells [Citation10]. Moreover, Glo3 was identified as a GTPase-activating protein (GAP) that hydrolyzes GTP on the small GTPase Arf1 (ADP-ribosylation factor 1) [Citation48,Citation49]. As a part of coat protein complex-I (COPI) vesicles, Glo3 is required for retrograde transport vesicles from Golgi to endoplasmic reticulum (ER) [Citation48,Citation49]. The yeast Scs7 protein is a ceramide hydroxylase that participates in the hydroxylation of the very long chain fatty acid, and plays an essential role in sphingolipid biosynthesis [Citation50,Citation51]. It was not reported whether Glo3 and Scs7 were also involved in nitrogen starvation-induced autophagy.
Before further validations, we checked the transcriptomic and proteomic data of Glo3 and Scs7. In the transcriptomic data, the mRNA expression of GLO3 was only detected in 2 samples, while the mRNA expression levels of SCS7 were measured in all the 6 samples (). For SCS7, we found its FPKM value was lower in atg9∆ cells than that in WT cells under nitrogen starvation for 1 (FC = 0.56) or 4 (FC = 0.75) h. From the proteomic data, both Glo3 and Scs7 were simultaneously quantified in the 6 samples (). For Glo3, its normalized intensity was weakly decreased in atg9∆ cells at the time points of 0 (FC = 0.88), 1 (FC = 0.93) and 4 (FC = 0.95) h after nitrogen starvation, when compared to WT cells (). A similar but stronger effect was obtained for Scs7 in atg9∆ cells at the time points of 0 (FC = 0.91), 1 (FC = 0.67) and 4 (FC = 0.63) h (). These results suggested that at least protein expressions of Glo3 and Scs7 might be influenced in atg9∆ cells.
The effect of Atg9 on Glo3 and Scs7 during autophagy
Because the omic data of the 2 proteins was not intact, here we validated the effect of Atg9 on Glo3 and Scs7 expressions at mRNA and protein levels during nitrogen starvation-induced autophagy. First, the real-time polymerase chain reaction (RT-PCR) assay was utilized to measure the mRNA expressions of GLO3 and SCS7 in WT and atg9∆ cells cultured in the synthetic minimal medium lacking nitrogen (SD-N) for 0, 1, 2, 3, and 4 h. During autophagy, the mRNA expression levels of both GLO3 and SCS7 were significantly downregulated at all the 5 time points in atg9∆ cells, when compared to WT cells (). Next, to evaluate the role of Atg9 in altering the endogenous protein expression of Glo3 and Scs7 during autophagy, we separately tagged GLO3 or SCS7 with a C-terminal GFP in WT and atg9∆ cells, using the homologous recombination-based method [Citation52]. These cells were grown and then shifted to SD-N medium for 0, 1, 2, 3, and 4 h. The immunoblotting analyses indicated that the protein expressions of Glo3-GFP in atg9∆ cells were markedly lower than those in WT cells at 0, 1, and 2 h (). Compared to WT cells, the protein levels of Scs7-GFP were significantly reduced in atg9∆ cells under nitrogen deprivation at all the 5 time points ().
Figure 6. The mRNA and protein expressions of Glo3 and Scs7 were affected by Atg9 during autophagy. (A and B) The mRNA expressions of GLO3 and SCS7 in WT and atg9∆ cells, which were cultured in SD-N medium for 0, 1, 2, 3, and 4 h. (C and D) The WT and atg9∆ cells expressing Glo3-GFP were cultured under nitrogen starvation for 0, 1, 2, 3, and 4 h. The cell lysates were immunoblotted with anti-GFP antibodies, and the relative expressions of Glo3 were calculated by the ratios between Glo3-GFP and Pgk1. (E and F) The expressions of Scs7-GFP protein were detected and measured in WT and atg9∆ cells under nitrogen deprivation for 0, 1, 2, 3, and 4 h. (G and H) The mRNA expressions of GLO3 and SCS7 were detected in WT and Atg9-OE cells during autophagy. (I and L) The protein expressions of Glo3-GFP and Scs7-GFP in WT and Atg9-OE cells at 5 time points were separately detected by immunoblotting. The relative expressions of Glo3-GFP and Scs7-GFP were quantified by the ratios of Glo3-GFP vs. Pgk1 and Scs7-GFP vs. Pgk1, respectively. All experiments were independently repeated 3 times. The two-sided t-test was used for statistical analyses.*p-value < 0.05; **p-value < 0.01; ***p-value < 0.001; ****p-value < 0.0001
Furthermore, yeast cells with over-expression (OE) of Atg9 protein were constructed. Then, the mRNA and protein expressions of GLO3 and SCS7 were detected in Atg9-OE cells and WT cells under nitrogen starvation for 0, 1, 2, 3, and 4 h. Using the RT-PCR assay, our results indicated that the mRNA expression levels of GLO3 were significantly enhanced in Atg9-OE cells at 1, 2, 3, and 4 h, compared to WT cells (). Again, the over-expression of Atg9 significantly increased the mRNA expression of SCS7 at all the 5 time points (). In addition, we observed that the protein levels of both Glo3 and Scs7 in Atg9-OE cells were markedly higher than those in WT cells under autophagy at 3 and 4 h (). Taken together, our results supported that GLO3 and SCS7 were affected by Atg9 during autophagy in both mRNA and protein levels.
Next, we explored whether Atg9 affects intracellular localizations of Glo3 and Scs7 in response to starvation treatment (Fig. S3-6). It was observed that both Glo3-GFP and Scs7-GFP proteins were poorly colocalized with Atg8 N-terminally tagged with a red fluorescence protein (RFP) variant (2× Katushka-Atg8), and their corresponding localizations relative to 2× Katushka-Atg8 were not affected with or without ATG9 (Fig. S3A-D). Meanwhile, we found that Glo3-GFP proteins were distributed outside the vacuole in both WT and atg9∆ cells at all the 5 time points (Fig. S4A,C), indicating Glo3 might not be degraded by the autophagy pathway. The proportions of cells with Scs7-GFP entering the vacuole were gradually increased under nitrogen starvation (Fig. S4B,D), indicating Scs7 might be degraded during autophagy. The subcellular localizations of Glo3 and Scs7 relative to the vacuole were not altered with or without ATG9 (Fig. S4A-D).
In addition, we observed that Glo3-GFP was partially colocalized with a Golgi marker Sec7-DuDre (Fig. S5A,B) [Citation53], but poorly colocalized with SS-mCherry-HDEL (Fig. S5C,D), an ER marker [Citation53]. Thus, Glo3 could be localized at Golgi apparatus but not ER. Also, we found that Scs7-GFP was highly colocalized with SS-mCherry-HDEL (Fig. S6A,B), and had a partial colocalization with Sec7-DuDre (Fig. S6C,D). Thus, Scs7 mainly localized at ER, with a small proportion of localization at Golgi apparatus. Again, deleting ATG9 did not influence the subcellular localizations of both Glo3 and Scs7 relative to these markers (Fig. S5A,B and S6A,B).
Glo3 and Scs7 interact with Atg9 and participate in regulating autophagy
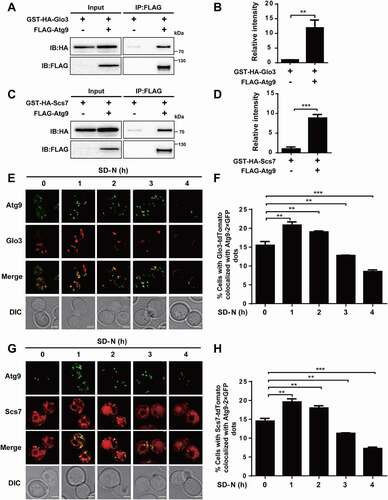
To validate whether the 2 proteins truly interact with Atg9, yeast cells expressing Atg9 tagged with FLAG and Glo3 or Scs7 tagged with glutathione S-transferase (GST) as well as hemagglutinin (HA) were generated, respectively. The Co-IP results supported that Glo3 and Scs7 potentially interact with Atg9 in vivo (). To analyze the subcellular colocalization of the 2 proteins and Atg9 during autophagy, yeast cells expressing Glo3 or Scs7 C-terminally tagged with an RFP variant (Glo3-tdTomato or Scs7-tdTomato) and Atg9-2× GFP were generated, respectively. The cells were grown and then followed by SD-N medium treatment for 0, 1, 2, 3, and 4 h (). Our results showed that there was a partial colocalization between Atg9-2× GFP and Glo3-tdTomato or Scs7-tdTomato at all the 5 time points (). Compared to 0 h, the proportion of cells containing Glo3-tdTomato or Scs7-tdTomato colocalized with Atg9-2× GFP dots at 1 or 2 h was markedly increased (), indicating that the interaction between Atg9 and Glo3 or Scs7 might be enhanced at early stages of the autophagic process. The colocalization proportions were then significantly reduced at 3 and 4 h in contrast to 0 h, and the results might be attributed the reduced protein expression of Glo3 or Scs7 in WT cells during autophagy ().
Figure 7. Glo3 and Scs7 interact and colocalize with Atg9. (A) The yeast cells expressed FLAG-tagged Atg9 and GST-HA-tagged Glo3 were collected and lysed. Then, the cell lysates were immunoprecipitated with anti-FLAG, and immunoprecipitates were analyzed with immunoblotting with the anti-FLAG and anti-HA antibodies. (B) The relative intensity of GST-HA-Glo3 in Co-IP was measured. (C) The Co-IP assay of FLAG-Atg9 and GST-HA-Scs7, and (D) the quantification of the relative expression of GST-HA-Scs7. (E) The WT cells expressing Glo3-tdTomato and Atg9-2× GFP were treated after nitrogen starvation for 0, 1, 2, 3, and 4 h, and then observed through confocal microscopy. Scale bar: 2 μm. (F) The proportion of cells with the colocalization between Glo3-tdTomato and Atg9-2× GFP was counted by analyzing > 300 cells. (G) The confocal observation for Scs7, and (H) the proportion of cells with Scs7-tdTomato colocalized with Atg9-2× GFP was counted by analyzing > 300 cells. Scale bar: 2 μm. DIC, differential interference contrast. All experiments were independently repeated 3 times. The two-sided t-test was used for statistical analyses.*p-value < 0.05; **p-value < 0.01; ***p-value < 0.001
Next, we focused on the 2 proteins to further investigate their potentially regulatory roles in autophagy. Under nitrogen deprivation, it was demonstrated the accumulation level of free GFP against the total amount of free GFP and GFP-Atg8 in glo3∆ strain is much less than that in WT cells (). Also, we monitored the free GFP generated within vacuole in glo3∆ and WT strains through the confocal fluorescence microscopy, and observed that more free GFP molecules were retained in vacuoles of WT cells compared with that of glo3∆ cells under nitrogen starvation (). To measure the phenotypic changes in glo3∆ strains, our recently developed DeepPhagy [Citation35] was utilized to quantitatively analyze autophagy activity in glo3∆ and WT cells, respectively. The analysis illustrated that the autophagy activity was dramatically attenuated in glo3∆ strains against WT cells (). Moreover, we investigated the effect of Glo3 on autophagy activity by using the Pho8∆60 assay. The WT cells (as a positive control), atg8∆ cells (as a negative control) and glo3∆ cells were treated under nitrogen starvation for 4 h, and alkaline phosphatase (ALP) activity was quantitatively measured in these cells. From the results, the ALP activity was significantly decreased in glo3∆ cells, compared with WT cells ().
Figure 8. GLO3 and SCS7 are essential for regulation of autophagy. (A) The immunoblotting results of the GFP-Atg8 cleavage and (B) the ratios between free GFP and the total amount of free GFP and GFP-Atg8 were presented in WT and glo3∆ strains after nitrogen starvation for 1 and 2 h. (C) The phenotypic observation was conducted by the confocal microscopy for WT and glo3∆ cells expressing GFP-Atg8, which were stained by FM 4–64 dye, and then treated with SD-N medium for 0, 1 and 2 h. Scale bar: 2 μm. (D) The autophagy activities were automatically determined by DeepPhagy in WT and glo3∆ strains. (E) The ALP activity was measured in WT and glo3∆ strains, after nitrogen starvation for 0 and 4 h. For scs7∆ strains, the same procedure of (F) the immunoblotting assay, (G) the measurement of the ratios between free GFP and the total amount of free GFP and GFP-Atg8, (H) the confocal observation, (I) the DeepPhagy analysis, and (J) the ALP activity analysis. Scale bar: 2 μm. DIC, differential interference contrast. All experiments were independently repeated 3 times. Statistical analyses were conducted by using the two-sided t-test. *p-value < 0.05; **p-value < 0.01
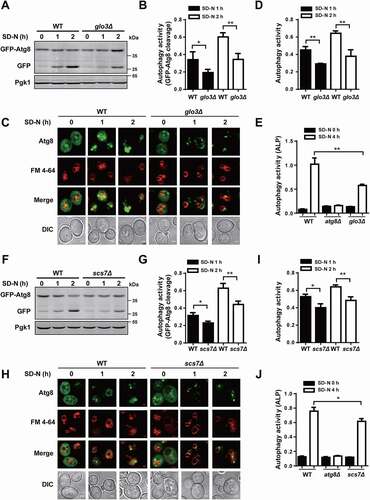
The same procedure was also conducted for Scs7 by using the scs7∆ strain. The immunoblotting assay indicated that the lower protein level of free GFP was produced in scs7∆ cells against that in WT cells (). Also, we discovered the SCS7 KO mutant decreased the amount of free GFP accumulation in vacuole by the GFP-Atg8 fluorescent assay (). Consistent with that, the lower autophagy activity was induced in scs7∆ cells compared to that in WT cells (). Meanwhile, we observed the ALP activity in scs7∆ cells was lower than that in WT cells by the Pho8∆60 assay (). Taken together, our studies validated 2 Atg9-interacting partners, Glo3 and Scs7, might be essential for regulating autophagy in S. cerevisiae.
Glo3 but not Scs7 regulates the retrograde transport of Atg9 during autophagy
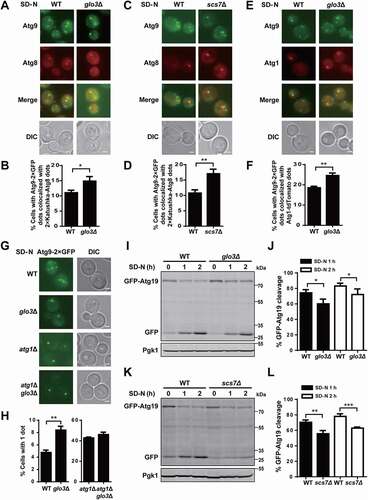
Previous studies reported Atg9 shuttles between PAS and peripheral vesicular pools, and is involved in transporting membrane resources to the PAS for the formation of autophagosome precursors [Citation17–20,Citation24,Citation54]. Above experiments demonstrated that Glo3 and Scs7 are important for autophagy. However, whether the 2 proteins affect Atg9 localization and trafficking during autophagy remained to be further studied. First, we utilized 2× Katushka-Atg8 as a PAS marker to study the effect of Glo3 and Scs7 on Atg9 localization to the PAS [Citation4,Citation52]. The WT and 2 KO mutant cells expressing Atg9-2× GFP and 2× Katushka-Atg8 were generated and treated with nitrogen deprivation medium for 1 h. It was found that the proportions of Atg9-2× GFP dots colocalized with 2× Katushka-Atg8 dots in both glo3∆ and scs7∆ cells were greater than that in WT cells (). Since knocking out GLO3 or SCS7 markedly reduced GFP-Atg8 cleavage and its vacuolar delivery (), enhanced colocalization of Atg9-2× GFP and 2× Katushka-Atg8 dots might be attributed to either defective Atg9 trafficking to or from the PAS, or GFP-Atg8 accumulation due to the reduction of autophagy activity. We separately counted the numbers of Atg9-2× GFP dots and 2× Katushka-Atg8 dots in the WT and 2 KO mutant cells. Although the numbers of 2× Katushka-Atg8 dots were markedly increased in both glo3∆ and scs7∆ cells, the number of Atg9-2× GFP dots was only considerably decreased in glo3∆ cells (Fig. S7A,B). Thus, although both proteins are required for maintaining autophagy activity, only Glo3 might be involved in affecting the Atg9 localization at the PAS.
Figure 9. The influence of GLO3 and SCS7 on Atg9 localization and trafficking, as well as selective autophagy. (A) The TN124 yeast cells expressing Atg9-2× GFP and 2× Katushka-Atg8 in WT and glo3∆ strains were cultured in SD-N medium for 1 h, and then observed by fluorescence microscope. Scale bar: 2 μm. (B) > 300 cells were counted to calculate the proportion of cells with Atg9-2× GFP dots colocalized with 2× Katushka-Atg8 dots. (C) Images of WT and scs7∆ cells expressing Atg9-2× GFP and 2× Katushka-Atg8, which were cultured under nitrogen starvation for 1 h. Scale bar: 2 μm. (D) > 300 cells were analyzed for the colocalization of Atg9-2× GFP dots and 2× Katushka-Atg8 dots. (E) The WT and glo3∆ cells expressing Atg9-2× GFP and Atg1-tdTomato were treated in SD-N medium for 1 h. Scale bar: 2 μm. (F) > 300 cells were counted to calculate the proportion of cells with Atg9-2× GFP dots colocalized with Atg1-tdTomato dots. (G) The cells expressing Atg9-2× GFP in WT, glo3∆, atg1∆, or atg1∆ glo3∆ strains were treated after nitrogen starvation for 1 h, and then observed through fluorescence microscope. Scale bar: 2 μm. (H) The proportion of cells with a single GFP dot was counted by analyzing > 300 cells for each strain. (I) The cells expressing GFP-Atg19 in WT and glo3∆ strains were cultured in SD-N medium for 0, 1, 2 h. The cell lysates were immunoblotted and analyzed by anti-GFP and anti-Pgk1 antibodies. (J) The analyses of GFP-Atg19 cleavage were conducted and quantified by the ratios between free GFP and the total amount of free GFP and GFP-Atg19. (K) The immunoblotting results of the GFP-Atg19 cleavage and (L) the ratios between free GFP and the total amount of free GFP and GFP-Atg19 were shown in WT and scs7∆ strains under nitrogen starvation treatment for 1 and 2 h. DIC, differential interference contrast. All experiments were independently repeated 3 times. The two-sided t-test was used for statistical analyses.*p-value < 0.05; **p-value < 0.01, ***p-value < 0.001
Then, we used another PAS marker Atg1 C-terminally tagged with an RFP variant (Atg1-tdTomato) to monitor the Atg9 localization in WT, glo3Δ, and scs7Δ cells under nitrogen starvation for 1 h. Atg1 is a conserved serine/threonine protein kinase, and plays a critical role in autophagy initiation [Citation55]. From the results, we found that the proportion of the colocalization of Atg9-2× GFP and Atg1-tdTomato dots in glo3∆ but not scs7Δ cells was significantly increased in response to nitrogen starvation, compared with that in WT cells ( and Fig. S7C,D). The results supported that Glo3 but not Scs7 influences the PAS localization of Atg9.
To analyze whether and how Atg9 trafficking was influenced by Glo3 and Scs7, we adopted the transport of Atg9 after knocking out ATG1 (TAKA) assay [Citation54,Citation56]. This assay was established to determine whether a protein is involved in regulating the anterograde or retrograde transport of Atg9 [Citation54,Citation56]. Previous studies revealed Atg1 is essential for the retrograde transport of Atg9 from the PAS to peripheral sites, and Atg9 accumulates at the PAS to form a single bright dot in atg1∆ cells [Citation19,Citation54]. If a second mutation in atg1∆ background results in Atg9 accumulation at the PAS, its corresponding protein might be functional at the same stage or after Atg1 in the retrograde transport of Atg9 [Citation54,Citation56]. However, if multiple dots of Atg9 occur in the double mutant strain, the protein might function before Atg1 in the anterograde transport of Atg9 [Citation4,Citation54]. Upon nitrogen deprivation for 1 h, we observed that the proportion of cells with a single Atg9-2× GFP dot in glo3∆ strain was significantly higher than that in WT cells (), suggesting Glo3 is required for Atg9 trafficking. Also, we observed that the proportion of cells with a single Atg9-2× GFP dot in atg1∆ glo3∆ double mutant cells was similar with that in atg1∆ cells (), indicating Glo3 is potentially involved in regulating the retrograde transport of Atg9. The TAKA assay was also performed for Scs7, whereas the results demonstrated that Scs7 does not affect Atg9 trafficking (Fig. S7E,F).
It was reported that Atg9 is indispensable for bulk autophagy and cytoplasm-to-vacuole targeting (Cvt) pathway [Citation4]. The Pho8∆60 assay demonstrated that both Glo3 and Scs7 are required for bulk autophagy, and here we further exploited whether the 2 proteins also contribute to selective autophagy. We used the N-terminally tagged GFP-Atg19 as a marker for monitoring selective autophagy under starvation [Citation35,Citation57], and transformed the corresponding plasmid into WT, glo3∆ and scs7∆ cells, respectively. After nitrogen starvation for 1 or 2 h, the GFP-Atg19 cleavage was analyzed through the immunoblotting assay. Clearly, the GFP-Atg19 cleavage levels in glo3∆ and scs7∆ cells were markedly reduced against that in WT cells (), indicating both proteins are involved in regulating selective autophagy.
Discussion
In S. cerevisiae, Atg9 is one of most important components of the core autophagy machinery. It has been postulated that Atg9 is not only involved in the supply of lipid bilayers required for the formation of autophagosome precursors, but also re-cycles and shuttles between the PAS and the peripheral vesicular pools during the early stages of autophagy [Citation58]. Atg9 is also required for the Cvt pathway, a type of selective autophagy in which a smaller autophagosome, known as the Cvt vesicle, is formed to selectively sequester a determined cargo, the Cvt complex [Citation59,Citation60]. In public PPI databases [Citation37–40], up to 341 proteins were experimentally identified to interact with yeast Atg9, including at least 39 known Atg proteins and autophagy regulators. However, it was not known whether other Atg9-interacting proteins also participate in regulating autophagy.
In this work, we conducted a time-course transcriptomic and proteomic profiling of WT and atg9∆ yeast cells, during nitrogen starvation-induced autophagy. No biological or technical replicates were provided, and we validated our multi-omics-based predictions by experiments but not statistics to ensure the reliability. Previous studies demonstrated that the correlation between steady-state mRNA and protein abundance is not strong, because post-transcriptional, translational and protein degradation regulatory mechanisms are also important in determining steady-state protein abundances, beyond mRNA expressions [Citation61,Citation62]. It was estimated that SCC values of the average correlation between steady-state mRNA and protein abundance ranged from 0.46 to 0.74 in yeast cells, and 0.46 to 0.63 in human cells [Citation61,Citation62]. For Atg9-interacting partners, we found SCC values of the average mRNA-protein correlations in WT yeast cells ranged from 0.500 to 0.698 (), which were comparable to previous studies [Citation61,Citation62]. The decreased mRNA-protein correlations in atg9∆ yeasts during starvation-induced autophagy indicated Atg9 is required for orchestrating the accordant changes in mRNA and protein abundances of its interacting partners ().
Together with the interactomic feature, we developed a novel computational method of iFIP to integrate the multi-omics data and prioritized 42 Atg9-interacting proteins to be potentially functional in autophagy, including 15 known Atg proteins or autophagy regulators (). Through a functional screening of 17 KO strains, we identified two proteins, Glo3 and Scs7, to be potentially new autophagy regulators (). We demonstrated that the mRNA and protein expressions but not subcellular localizations of Glo3 and Scs7 were markedly affected by Atg9 during nitrogen starvation-induced autophagy ( and Fig. S3-S6). Moreover, the Co-IP results indicated that Glo3 and Scs7 might physically interact with Atg9 in vivo (), while the subcellular colocalizations of Atg9 and Glo3 or Scs7 were markedly enhanced at the early stages of the autophagic process triggered by nitrogen deprivation (). Further experiments supported that both Glo3 and Scs7 are involved in regulating nitrogen deprivation-triggered autophagy, in the context of Atg9 (). Previously, it was reported that both membrane-trafficking small GTPases (e.g., Arf1, Rab1 and Sar1) and Tre2, Bub2, and Cdc16 (TBC) domain-containing Rab GAPs are involved in regulating yeast autophagy [Citation63,Citation64]. In this study, we found that Glo3, a GAP of Arf1 [Citation48,Citation49], is important for modulating autophagy (), and required for the retrograde transport of Atg9 from the PAS (), highlighting the importance of Arf GAPs in regulating autophagy. As a ceramide hydroxylase, Scs7 is essential for the generation of monohydroxylated inositolphosphorylceramide (IPC-C) in sphingolipid biosynthesis pathway [Citation50,Citation51]. In S. cerevisiae, there are three classes of sphingolipids including IPC, mannosylinositol phosphorylceramide (MIPC) and mannosyldiinositol phosphorylceramide [M(IP)2C], whereas only IPC is required for autophagosome but not PAS formation under nitrogen starvation-induced autophagy [Citation65,Citation66]. Indeed, we found SCS7 deletion decreases autophagy activity induced by the deprivation of nitrogen (), indicating an essential role of sphingolipid metabolism in regulating autophagy. Scs7 is not involved in affecting the Atg9 trafficking ( and Fig. S7C-F).
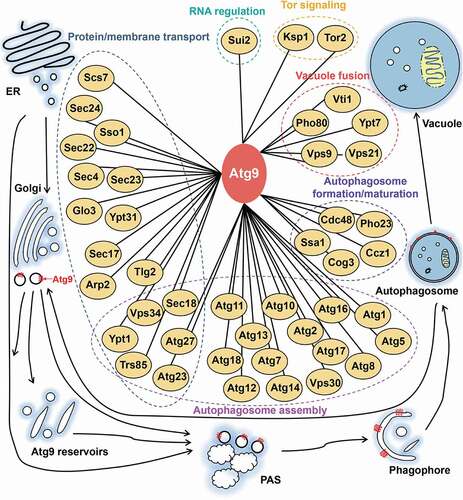
Based on our results as well as previous studies, we proposed a working model for highlighting the functional importance of the Atg9 interactome (). Based on the biological functions in autophagy, the 44 known Atg9-interacting partners were classified into 6 groups, including protein/membrane transport, autophagosome assembly, autophagosome formation/maturation, vacuole fusion, Tor signaling and RNA regulation (). From the results, there were 17 proteins involved in the protein/membrane transport, and 20 proteins implicated in the autophagosome assembly (). Recent studies proposed that the autophagosome formation requires multiple membrane sources [Citation17,Citation67]. One of the sources is derived from Atg9 reservoirs, which contain significant amounts of Atg9 proteins and have been found on distinct membrane structures in both yeast and mammalian cells [Citation16]. It was well documented that Atg9 vesicles can be produced from Atg9 reservoirs on the Golgi apparatus in a process involving Atg23 and Atg27 [Citation16]. The other is cytoplasmic coat protein complex-II (COPII) vesicles, which are budded from ER exit sites, and required for ER-Golgi trafficking and autophagy [Citation67]. Upon nutrient starvation, the phosphorylated Sec24 located on the membrane of the COPII vesicles interacts with Atg9 to rapidly increase the autophagosome number during the autophagic process [Citation67]. A number of proteins, including Atg23, Atg27, Sec18, Vps34, Ypt1 and Trs85, are not only important for providing membrane sources, but also participate in autophagosome assembly at PAS, together with other Atg proteins and autophagy regulators [Citation16,Citation68–71] (). Five additional proteins, such as Ssa1, Cdc48, Cog3, Ccz1 and Pho23, may also contribute for autophagosome formation/maturation [Citation10,Citation72–75] (). In addition, Atg9-interacting proteins also play a critical role in RNA regulation and Tor signaling. For example, Sui2 acts as a key component of eukaryotic translation initiation factor 2 (eIF-2) complex to be essential for autophagy activation [Citation76], whereas a serine/threonine protein kinase Ksp1 suppresses the autophagy as a negative regulator [Citation77]. Collectively, the available knowledge supported that the Atg9 interactome plays a central role in regulating autophagy.
Figure 10. An integrative model of the Atg9 interactome, which contained Atg9 and its known interacting partners derived from our results and previous studies. The 44 Atg9-interacting proteins were classified into 6 groups, based on their corresponding biological functions in autophagic process
In this study, we in total obtained 584,994 non-redundant PPIs for 5,965 yeast proteins, with an average number of 98.1 interacting partners per protein. We also counted the number of PPIs for each of the 174 known Atg proteins and autophagy regulators, and 153 (87.9%) of them having > 100 interacting partners (Table S7). The PPI data is noisy and the bona fide interactions among different proteins are dynamic and transient in vivo for synergistically orchestrating distinct biological processes. In this regard, the identification of functional interacting partners is a great challenge, and here we presented an integrative pipeline exemplified by finding 2 new autophagy regulators of Glo3 and Scs7 that interact with Atg9 in S. cerevisiae. We anticipate that such a strategy can be easily extended for other Atg proteins or autophagy regulators with numerous interacting partners.
Materials and methods
Yeast strains and plasmids
The WT haploid yeast strain used in this study was BY4741 (MATa his3D leu2D met15D ura3D). KO mutants in BY4741 background were bought from Thermo Fisher Scientific (Yeast Deletion Clones, Mat-A Complete set, 95,401.H2). The list of the KO mutant strains is presented in Table S6A. Plasmids expressing GFP-Atg8 were gifts from Prof. Li Yu (Tsinghua University) [Citation78]. Plasmids expressing GFP-Atg19 were provided by Prof. Cong Yi (Zhejiang University) [Citation35]. Plasmids generating Atg9-2× GFP (LDP209), plasmids expressing SS-mCherry-HDEL and Sec7-DuDre, and the yeast strain TN124 were developed in the previous studies [Citation52,Citation53]. The plasmids used as PCR templates, including pCLHN-GFP and pCLHN-Nat, were generated by Prof. Zhiping Xie’s lab (Shanghai Jiao Tong University, unpublished). The integration of GFP tag to the C terminus of GLO3 or SCS7 in WT and atg9∆ cells was generated using the homologous recombination-based method [Citation52]. Briefly, the DNA fragments flanked by short homologous regions were amplified using pCLHN-GFP with a selection marker URA3 as a template, as well as the GLO3 or SCS7-specific primers (Table S6B). The PCR products were transformed to WT or atg9∆ cells. Then, the DNA fragment containing GFP encoding sequence was inserted at the C terminus of GLO3 or SCS7 gene by homologous recombination. The plasmids pRS404-2× Katushka-Atg8 expressing Atg8 N-terminally tagged with an RFP variant, pRS404-Atg1-tdTomato expressing Atg1 C-terminally tagged with an RFP variant, pRS404-Glo3-tdTomato expressing Glo3 C-terminally tagged with an RFP variant, and pRS404-Scs7-tdTomato expressing Scs7 C-terminally tagged with an RFP variant were developed in this study.
Cell sample preparation
The WT and atg9∆ strains were maintained in YPD medium (Sangon Biotech, A507022). Yeast cells were grown to OD600 = 1.0 ~ 1.2. Then cells were treated with SD-N medium (0.17% yeast nitrogen base without amino acids and ammonium sulfate, 2% glucose) for 0, 1 and 4 h. The harvested cells were immediately treated by liquid nitrogen for 20 min. Finally, all the cells were stored at −80°C for the subsequent omics profiling.
RNA isolation
The yeast cells were lysed by using TRIzol (Thermo Fisher Scientific, 15,596,026) and the total RNAs were prepared by following the manufacturer’s instructions. First, the chloroform (Sinopharm Chemical Reagent Co., Ltd., 10,006,818) was added into the cell lysates, and the aqueous phase containing the RNA was formed after centrifuging. The total RNA precipitate was formed by adding the isopropanol (Sinopharm Chemical Reagent Co., Ltd., 40,064,360) into the aqueous phase, and then washed by the 75% ethanol (Sinopharm Chemical Reagent Co., Ltd., 80,176,961), and finally resolved in RNase-free water (Invitrogen, 10,977,023).
RNA-seq library preparation and sequencing
The concentration (ng/μL) and quality (A260/A280) of the total RNAs were measured by using a Nanodrop 2000 spectrophotometer (Thermo Fisher Scientific, USA), and the integrity of the RNA was determined on an Agilent Technologies 2100 Bioanalyzer. The high-quality total RNA in equal amount per sample was used to construct the RNA-seq libraries. RNA-seq library was constructed by The NEBNext Ultra™ II RNA Library Prep Kit for Illumina (NEB, E7770). Then, the library products were sequenced on HiSeq 4000 system (Illumina, San Diego, CA).
Total protein extraction
Cell pellets were lysed with lysis buffer (8 M urea; Sigma-Aldrich, 554,693) added with the protease inhibitor (Sigma-Aldrich, 539,137) on ice by using a high-intensity ultrasonic processor (Scientz) for 10 min. The supernatants were collected through centrifuging at 20,000 × g for 10 min at 4°C. The protein concentration was determined with bicinchoninic acid (BCA) protein quantification kit (Vazyme, E112).
HPLC fractionation
The protein sample was digested with trypsin (Macklin, T819144), and then fractionated into fractions by high-pH reverse-phase HPLC using the Thermo Fisher Scientific BETASIL C18 column (5 μm particles, 4.6 mm, 250 × 10 mm, SN:10,428,834). The peptides were separated with a gradient of 8% to 32% acetonitrile over 90 min into 80 fractions. After that, the peptides were combined into 16 fractions and dried by vacuum centrifuging.
LC-MS/MS analysis
The tryptic peptides were dissolved in 0.1% formic acid (solvent A; Sigma-Aldrich, 27,001), all at a constant flowrate of 700 nL/min on an EASY-nLC 1000 ultra-performance liquid chromatography (UPLC) system. The gradient was comprised of an increase from 5% to 8% solvent B (0.1% formic acid in 98% acetonitrile) for 13 min, 8% to 18% in 30 min, 19% to 32% in 22 min, and finally, holding at 95% for the last 30 min. The peptides were subjected to NSI source followed by MS/MS in Q ExactiveTM Plus (Thermo Fisher Scientific) coupled online to the UPLC. The electrospray voltage applied was 2.0 kV. The m/z scan range was 350 to 1600 for a full scan, and intact peptides were detected in the Orbitrap at a resolution of 60,000. Then peptides were selected for MS/MS using NCE and the fragments were detected in the Orbitrap at a resolution of 30,000. Fixed first mass was set as 100 m/z. Automatic gain control (AGC) was set at 5E4. A data-dependent procedure was conducted that alternated between one MS scan followed by 20 MS/MS scans with 15.0 s dynamic exclusion.
Database Search
The resulting MS/MS data were processed using MaxQuant search engine (v.1.5.3.30) [Citation33]. First, the proteome sequence set of S. cerevisiae was downloaded from UniProt (Version 201,809) [Citation79], which contained 6,049 unique yeast protein sequences for the construction of the reference protein database. For the parameters, Trypsin/P was specified as the cleavage enzyme. The mass tolerance for precursor ions was set as 20 ppm in First search and 4.5 ppm in Main search. Carbamidomethylation on Cys was specified as a fixed modification. Oxidation on Met and acetylation on protein N-termini were specified as variable modifications. The instrument type was Orbitrap. All the other parameters in MaxQuant [Citation33] were set as default values.
The detection of differentially regulated mRNAs and proteins
For the transcriptomic data, a classical pipeline including Bowtie, Tophat and Cufflinks [Citation30–32] were adopted for reads mapping, mRNA alignment, assembly and quantification. The FPKM values were then calculated to estimate the mRNA expression levels. The mRNAs with significantly changed FPKM values in at least one time point were regarded as potential DEMs (p-value < 0.05), based on the output results of Cufflinks that used a negative binomial model to calculate significance [Citation32]. For the proteomic data, the tool PANDA-view [Citation34] was first used for the imputation of missing protein intensities across different samples. The default multiple imputation, also called as multivariate normal imputation (MVNI), was selected with 5 imputation times. Then, the variance stabilization normalization (Vsn) in PANDA-view [Citation34], a method similar to the logarithmic transformation, was chosen for the normalization of raw MS/MS protein intensities. For a protein with the raw intensity x, its normalized intensity x’ was calculated based the arsinh function as below [Citation80]:
Previously, it was reported that Vsn outperformed than other methods in reducing the data variance in quantitative label-free proteomic data [Citation81]. Due to lack of efficient methods for statistically analyzing pairwise proteomic data, a threshold of FC > 3 or < 1/3 for raw MS/MS intensities was adopted to individually identify potential DEPs between the 3 time points of WT and atg9∆ strains.
The enrichment analysis
For the enrichment analysis of differentially regulated mRNAs or proteins, GO annotation files (On 7 November 2018) were first downloaded from the Gene Ontology Consortium Web site (http://www.geneontology.org/) and contained 6,576 yeast genes annotated with at least one GO biological process term [Citation82]. For each GO term t, we defined the following:
N = number of mRNAs/proteins annotated by at least one GO term
n = number of mRNAs/proteins annotated by GO term t
M = number of differentially regulated mRNAs/proteins annotated by at least one GO term
m = number of differentially regulated mRNAs/proteins annotated by GO term t
Then the enrichment ratio (E-ratio) of GO term t was computed, and the p-value was calculated with the hypergeometric distribution as below:
E-ratio =
p-value = (E-ratio ≥ 1), or
p-value = (E-ratio < 1)
In this study, only significantly enriched GO biological process terms with E-ratio > 1 were considered. The enrichment analysis was also conducted for Atg9-interacting proteins.
The integration of the interactomic data
Experimentally identified PPIs in S. cerevisiae were downloaded and integrated from 4 widely used databases including BioGRID [Citation37], IID [Citation38], HINT [Citation39] and iRefIndex [Citation40]. In total, we obtained 584,994 non-redundant PPIs for 5,965 unique proteins, including 341 Atg9-interacting proteins. According to the annotations in Ontobee (http://www.ontobee.org/) [Citation41], the 341 PPIs were identified by 14 types of methods, including affinity chromatography technology (MI:0004), anti tag coimmunoprecipitation (MI:0007), tandem affinity purification (MI:0676), genetic interference (MI:0254), imaging technique (MI:0428), protein complementation assay (MI:0090), biochemical (MI:0401), enzymatic study (MI:0415), ubiquitin reconstruction (MI:0112), pull down (MI:0096), two hybrid (MI:0018), two hybrid array (MI:0397), two hybrid pooling approach (MI:0398) and inferred by author (MI:0363) (Table S4). We carefully checked the PPIs derived from “inferred by author”, and found these PPIs were directly integrated from other public databases, in which the experimental methods for detecting these PPIs were not clearly annotated.
The iFIP algorithm
From THANATOS [Citation8], we obtained 39 known Atg proteins and autophagy regulators that interact with yeast Atg9, including Arp2, Atg1, Atg10, Atg11, Atg12, Atg13, Atg14, Atg16, Atg17, Atg18, Atg2, Atg23, Atg27, Atg5, Atg7, Atg8, Ccz1, Cdc48, Cog3, Ksp1, Pho23, Sec17, Sec18, Sec22, Sec23, Sec24, Sec4, Sso1, Sui2, Tlg2, Tor2, Trs85, Vps21, Vps30, Vps34, Vps9, Vti1, Ypt1, and Ypt31. The 39 proteins were taken as the positive data, whereas the other 302 Atg9-interacting proteins were taken as the negative data.
For each Atg9-interacting partner, 3 features at the transcriptomic, proteomic and interactomic levels were retrieved, including the ratio of FPKM value (ROF), the ratio of intensity (ROI) and the ratio of maximum interactions (ROM). With the FPKM values of 3 time points from atg9∆ and WT strains, here we defined the ROF of a protein t as below:
For the proteomic data, the normalized intensities were adopted, and we defined the ROI of the protein t as below:
For the interactomic data, the numbers of proteins (NP) in the 174 yeast Atg proteins and autophagy regulators that interact with each Atg9-interacting partner were calculated, separately. The protein t interacting with the maximum (MP) of Atg proteins and autophagy regulators was set as the background value. Then the ROM of the protein t was defined as below:
Thus, the final score of the protein t was defined as:
The weight of each feature was set as a, b or c, with a same initial value of 1. For model training, the LR (aka logit, MaxEnt) classifier in the open source package of scikit-learn (https://scikit-learn.org/stable/index.html) was employed with parameters including penalty = l2 (ridge regression), C = 1.0, intercept_scaling = 1, solver = “liblinear”, max_iter = 1000, and n_jobs = 10. Then the weights of transcriptomic, proteomic and interactomic features were automatically optimized by the LR classifier, to maximally predict known Atg proteins and autophagy as positive hits.
In addition, to further improve the accuracy of training model generated from the LR classifier, the GSEA method was adopted by using a python wrapper of GSEAPY (https://pypi.org/project/gseapy/) [Citation46]. Using the 341 Atg9-interacting partners containing 39 known Atg proteins and autophagy regulators, we first calculated the enrichment score (ES) as 0.332 by GSEAPY for the LR model. Then, 3 initial weights were randomly adding or subtracting 0.1, and a new ES value was calculated from the updated model. Only models with increased ES values were adopted for a next manipulation. Such a procedure was iteratively performed until the ES value reached a maximum as 0.360, and the final model was determined with optimized weights.
Culturing of yeast cells for screening and validation
All the yeast cells was transformed with the GFP-ATG8 plasmid first. The WT and KO mutants were inoculated into either YPD or SD medium (0.17% yeast nitrogen base w/o amino acids and ammonium sulfate, 0.5% ammonium sulfate and 2% glucose) with appropriate supplements and grown overnight. For nitrogen starvation conditions, the culture was then shifted to SD-N medium for 1 h.
The GFP-Atg8 immunoblotting assay
The cells were lysed with the total protein extraction kit for microbes with thick walls (Minute, YT-015) with protease inhibitor (Roche, 4,693,159,001). The protein quantification was detected by BCA kit (Beyotime, P0010). The boiled samples were subjected to SDS-PAGE on a 10% acrylamide gel and transferred to polyvinylidene difluoride (PVDF) membranes (Millipore, IPVH00010). The membranes were blocked for 1 h in 1× TBST (19.8 mM Tris base, 150 mM NaCl, 0.1% Tween-20 [Biosharp, BS100]) containing 5% nonfat milk (Sangon Biotech, A600669) and then probed with the appropriate primary and secondary antibodies. Anti-GFP (11,814,460,001) antibody was from Roche, anti-Pgk1 (ab113687) antibody was from Abcam, and donkey anti-mouse secondary antibody (926–32,212) was from LI-COR Biosciences. The band density was quantified by using the Odyssey_CLx imaging system (LI-COR Biosciences). Experiments were repeated for each immunoblotting assay, and the data were presented as the mean ± SEM of 3 independent experiments.
The GFP-Atg8 fluorescent assay
Yeast cells expressing GFP-Atg8 were grown to OD600 = 0.8 ~ 1.0 in appropriate selective medium. To visualize vacuoles, cells were incubated in rich medium containing 25 μg/mL FM 4–64 (Invitrogen, T3166) for 25 min, then chased for 40 min at 30°C and shifted to SD-N medium for 0, 1 and 2 h. The yeast cells were observed at room temperature using an Olympus FV-1000 confocal microscope.
For the quantitative analysis of autophagic phenotypes, 3 pictures were independently obtained at each time point for WT, glo3∆ and scs7∆ strains. Each image was directly inputted into DeepPhagy for determining the autophagy activity, which was denoted as the ratio of autophagic cells with GFP signals in the vacuole against all recognizable cells [Citation35]. The two-sided t-test was conducted to calculate the statistical significance (p-value < 0.05).
The Pho8∆60 assay
The plasmid pCLHN-Nat was used as a PCR template to amplify and produce linear DNA fragments encoding the Nat drug-resistance gene. PCR products were transformed into cells of the commonly used strain TN124 [Citation52,Citation83,Citation84] to generate glo3∆ and scs7∆ mutants. The detailed primer sequences were present in Table S6C. Briefly, yeast cells were grown to OD600 = 0.8 ~ 1.0 in YPD medium and shifted to SD-N medium for 0 and 4 h. For each sample, 3 OD600 of cells were suspended in 200 μL lysis buffer (20 mM PIPES, pH 6.8, 50 mM KCl, 100 mM potassium acetate, 10 mM MgSO4, 10 μM ZnSO4, 1 mM PMSF, 0.5% Triton X-100 [Sigma-Aldrich, X100]) with adding 100 μL glass beads (Scientific Industries, SI-BG05). The samples were vortexed for 3 min at 4°C, and paused to rest for 2 min. This procedure was repeated 5 times. The cell lysates were mixed with 200 μL reaction buffer (250 mM Tris-HCl, 0.4% Triton X-100, 10 mM MgSO4, 10 μM ZnSO4) containing 1.25 mM ρ-nitrophenyl phosphate (Sangon Biotech, A610365), then incubated for 30 min at 30°C, and finally supplemented with 100 μL stop buffer (1 M glycine-KOH, pH 11.0). The absorbance at 405 nm was detected using a microplate reader (Thermo Fisher Scientific, Multiskan FC). The protein concentration was measured by BCA protein quantification kit (Vazyme, E112).
The Co-IP assay
The full-length sequence of FLAG-tagged Atg9 was synthesized and cloned to pRS315 plasmid through restriction enzyme cutting sites of Sal I and Not I. The full-length sequence of HA-tagged Glo3 or Scs7 was synthesized and cloned to pEGH plasmid (GeneCreate Biological Engineering Co., Ltd.) via restriction enzyme cutting sites of Xho I and Hind III, and the plasmids expressing GST-HA-tagged Glo3 or GST-HA-tagged Scs7 were generated. The expression plasmids were separately transformed into cells. Yeast cells were grown to OD600 = 0.8 ~ 1.0 in SD medium with the 2% galactose (Aladdin, G100367) stock, and then lysed by the total protein extraction kit for Microbes with Thick Walls (Minute, YT-015) with protease inhibitor (Roche, 4,693,159,001), and the cell lysates were incubated with anti-FLAG agarose beads (Sigma-Aldrich, A2220). The beads were washed by low-salt lysis buffer (50 mM HEPES, pH 7.4, 150 mM NaCl, 1 mM EDTA, 1.5 mM MgCl2, 10% glycerol, 1% Triton X-100) with 5 times, and eluted in 2 × SDS Loading buffer (Fdbio, FD003). The prepared samples were separated by 10% SDS-PAGE. Proteins were transferred to PVDF membranes (Millipore, IPVH00010) and incubated with the appropriate antibodies. Horseradish peroxidase (HRP)-conjugated anti-FLAG antibody (A8592) was from Sigma-Aldrich, HRP-conjugated anti-HA antibody (12,013,819,001) was from Roche. The protein bands were detected by using a ChemiDoc XRS+ System (Bio-Rad) with Clarity Western ECL Substrate (Bio-Rad, 17–5060).
RNA preparation and RT-PCR
In YPD medium, the WT and atg9∆ cells were grown into mid-log phase, and then treated with SD-N medium for 0, 1 and 4 h. The total RNAs were isolated from the yeast cells according to the manufacturer’s instructions (Sangon Biotech, B518657). The cDNAs were synthesized by using PrimeScript RT reagent Kit with gDNA Eraser (Takara, RR047A), and RT-PCR was performed with AceQ qPCR SYBR Green Master Mix (Vazyme, Q141-02) and StepOne Real-time PCR systems (Thermo Fisher Scientific). The relative expression of each gene was normalized to the expression of AFT10 as determined by the ∆Ct method as described in previous studies [Citation85,Citation86]. The specific primers for each gene were presented in Table S6D.
Fluorescence microscopy
The yeast strains TN124 expressing fluorescent tags were grown into mid-log phase, and then cultured in SD-N medium for 1 h. The cells were observed, and the images were captured using the inverted fluorescence microscope (Leica, DMI8). The intensity of the excitation was adjusted to 100%, and the exposure time was 500 ms for GFP and RFP variants including Katushka and tdTomoto. Images were processed using ImageJ (NIH, 64-bit Java 1.8.0_112). If the overlapped areas of two fluorescent dots were more than 50%, the dots were determined to be colocalized. For each experiment, > 300 cells were counted and analyzed for colocalization ratios. The number of cells with a single Atg9 dot was determined by analyzing > 300 cells. All experiments were repeated independently with three times. The two-sided t-test was conducted to evaluate the statistical significance (p-value < 0.05).
Confocal microscopy
The yeast cells expressing Glo3 or Scs7 tagged with fluorescent proteins were grown to OD600 of 0.6 overnight at the permissive temperature, and then cultured in SD-N medium for 0, 1, 2, 3, and 4 h. The cells were immediately observed and scanned with confocal laser scanning microscope (Olympus, FV3000) using an UPlanSApo 100×/1,40 Oil DIC. A 488 nm laser and a 594 nm laser were utilized for observation. The ratios of colocalization were quantified and analyzed from > 300 cells in each experiment. The experiments were repeatedly performed with 3 times. The two-sided t-test was used to calculate the statistical significance (p-value < 0.05).
Data and code availability
The RNA-seq data has been deposited into NCBI Sequence Read Archive (SRA, https://www.ncbi.nlm.nih.gov/sra) with the dataset identifier PRJNA513224. The proteomic data including the annotated MS/MS spectra have been deposited into the integrated proteome resources (iProX, http://www.iprox.org/) with the dataset identifier IPX0001478000. The source code of iFIP was submitted to GitHub at: https://github.com/CuckooWang/ifip.
Statistical analysis
Except the multi-omic profiling, all experiments in this study were independently repeated 3 times. The two-sided t-test was used for statistical analyses. Mean value and standard deviation (S.D.) were calculated from 3 independently repeated experiments. The error bars represent the S.D., and p-value < 0.05 was considered to be statistically significant.
Supplemental Material
Download Zip (14.1 MB)Acknowledgments
The authors would like to thank Prof. Li Yu (Tsinghua University) and Prof. Cong Yi (Zhejiang University) for their great helps on plasmid sharing, and helpful suggestions on yeast experiments. This work was supported by grants from the Natural Science Foundation of China (31930021, 31970633, 81701567, 31670846 and 31801095), the National Program for Support of Top-Notch Young Professionals, Young Changjiang Scholars Program of China, the program for HUST Academic Frontier Youth Team, China Postdoctoral Science Foundation (2018M642816 and 2019T120648), and the Fundamental Research Funds for the Central Universities (2017KFXKJC001 and 2019kfyRCPY043).
Disclosure statement
No potential conflict of interest was reported by the authors.
Supplementary material
Supplemental data for this article can be accessed here.
Additional information
Funding
Related Research Data
References
- Xie Y, Kang R, Sun X, et al. Posttranslational modification of autophagy-related proteins in macroautophagy. Autophagy. 2015;11(1):28–45.
- Yu L, Chen Y, Tooze SA. Autophagy pathway: cellular and molecular mechanisms. Autophagy. 2018;14(2):207–215.
- Ohsumi Y. Historical landmarks of autophagy research. Cell Res. 2014;24(1):9–23.
- Klionsky DJ, Abdelmohsen K, Abe A, et al. Guidelines for the use and interpretation of assays for monitoring autophagy (3rd edition). Autophagy. 2016;12:1–222.
- Harding TM, Morano KA, Scott SV, et al. Isolation and characterization of yeast mutants in the cytoplasm to vacuole protein targeting pathway. J Cell Biol. 1995;131(3):591–602.
- Tsukada M, Ohsumi Y. Isolation and characterization of autophagy-defective mutants of Saccharomyces cerevisiae. FEBS Lett. 1993;333(1–2):169–174.
- Parzych KR, Ariosa A, Mari M, et al. A newly characterized vacuolar serine carboxypeptidase, Atg42/Ybr139w, is required for normal vacuole function and the terminal steps of autophagy in the yeast Saccharomyces cerevisiae. Mol Biol Cell. 2018;29(9):1089–1099.
- Deng W, Ma L, Zhang Y, et al. THANATOS: an integrative data resource of proteins and post-translational modifications in the regulation of autophagy. Autophagy. 2018;14(2):296–310.
- Fukuda T, Ebi Y, Saigusa T, et al. Atg43 tethers isolation membranes to mitochondria to promote starvation-induced mitophagy in fission yeast. Elife. 2020;9:e61245.
- Galluzzi L, Baehrecke EH, Ballabio A, et al. Molecular definitions of autophagy and related processes. Embo J. 2017;36(13):1811–1836. .
- Noda T, Ohsumi Y. Tor, a phosphatidylinositol kinase homologue, controls autophagy in yeast. J Biol Chem. 1998;273(7):3963–3966.
- Loewith R, Jacinto E, Wullschleger S, et al. Two TOR complexes, only one of which is rapamycin sensitive, have distinct roles in cell growth control. Mol Cell. 2002;10:457–468.
- Feng Y, Backues SK, Baba M, et al. Phosphorylation of Atg9 regulates movement to the phagophore assembly site and the rate of autophagosome formation. Autophagy. 2016;12(4):648–658.
- Young AR, Chan EY, Hu XW, et al. Starvation and ULK1-dependent cycling of mammalian Atg9 between the TGN and endosomes. J Cell Sci. 2006;119(18):3888–3900.
- Guardia CM, Tan X-F, Lian T, et al. Structure of Human ATG9A, the Only Transmembrane Protein of the Core Autophagy Machinery. Cell Rep. 2020;31(13):107837.
- Reggiori F, Tooze SA. Autophagy regulation through Atg9 traffic. J Cell Biol. 2012;198(2):151–153.
- Yamamoto H, Kakuta S, Watanabe TM, et al. Atg9 vesicles are an important membrane source during early steps of autophagosome formation. J Cell Biol. 2012;198(2):219–233.
- Mari M, Griffith J, Rieter E, et al. An Atg9-containing compartment that functions in the early steps of autophagosome biogenesis. J Cell Biol. 2010;190(6):1005–1022.
- Reggiori F, Tucker KA, Stromhaug PE, et al. The Atg1-Atg13 complex regulates Atg9 and Atg23 retrieval transport from the pre-autophagosomal structure. Dev Cell. 2004;6(1):79–90.
- Papinski D, Schuschnig M, Reiter W, et al. Early steps in autophagy depend on direct phosphorylation of Atg9 by the Atg1 kinase. Mol Cell. 2014;53(3):471–483.
- Matoba K, Kotani T, Tsutsumi A, et al. Atg9 is a lipid scramblase that mediates autophagosomal membrane expansion. Nat Struct Mol Biol. 2020;27(12):1185–1193.
- Maeda S, Yamamoto H, Kinch LN, et al. Structure, lipid scrambling activity and role in autophagosome formation of ATG9A. Nat Struct Mol Biol. 2020;27(12):1194–1201.
- Orii M, Tsuji T, Ogasawara Y, et al. Transmembrane phospholipid translocation mediated by Atg9 is involved in autophagosome formation. J Cell Biol. 2021;220(3):e202009194.
- Puri C, Renna M, Bento CF, et al. Diverse autophagosome membrane sources coalesce in recycling endosomes. Cell. 2013;154(6):1285–1299.
- Sawa-Makarska J, Baumann V, Coudevylle N, et al. Reconstitution of autophagosome nucleation defines Atg9 vesicles as seeds for membrane formation. Science. 2020;369(6508):7714. 369:aaz.
- Rao Y, Perna MG, Hofmann B, et al. The Atg1–kinase complex tethers Atg9-vesicles to initiate autophagy. Nat Commun. 2016;7(1):10338.
- Graef M, Friedman JR, Graham C, et al. ER exit sites are physical and functional core autophagosome biogenesis components. Mol Biol Cell. 2013;24(18):2918–2931.
- Suzuki SW, Yamamoto H, Oikawa Y, et al. Atg13 HORMA domain recruits Atg9 vesicles during autophagosome formation. Proc Natl Acad Sci U S A. 2015;112(11):3350–3355.
- Wang CW, Kim J, Huang WP, et al. Apg2 is a novel protein required for the cytoplasm to vacuole targeting, autophagy, and pexophagy pathways. J Biol Chem. 2001;276(32):30442–30451.
- Langmead B, Salzberg SL. Fast gapped-read alignment with Bowtie 2. Nature Methods. 2012;9(4):357–359.
- Kim D, Pertea G, Trapnell C, et al. TopHat2: accurate alignment of transcriptomes in the presence of insertions, deletions and gene fusions. Genome Biol. 2013;14(4):R36.
- Trapnell C, Roberts A, Goff L, et al. Differential gene and transcript expression analysis of RNA-seq experiments with TopHat and Cufflinks. Nat Protoc. 2012;7(3):562–578.
- Tyanova S, Temu T, Cox J. The MaxQuant computational platform for mass spectrometry-based shotgun proteomics. Nat Protoc. 2016;11(12):2301–2319.
- Chang C, Xu K, Guo C, et al. PANDA-view: an easy-to-use tool for statistical analysis and visualization of quantitative proteomics data. Bioinformatics. 2018;34(20):3594–3596.
- Zhang Y, Xie Y, Liu W, et al. DeepPhagy: a deep learning framework for quantitatively measuring autophagy activity in Saccharomyces cerevisiae. Autophagy. 2020;16(4):626–640.
- Horgan RP, Kenny LC. ‘Omic’ technologies: genomics, transcriptomics, proteomics and metabolomics. Obstet Gynaecol. 2011;13(3):189–195.
- Chatr-Aryamontri A, Oughtred R, Boucher L, et al. The BioGRID interaction database: 2017 update. Nucleic Acids Res. 2017;45:D369–d79.
- Kotlyar M, Pastrello C, Sheahan N, et al. Integrated interactions database: tissue-specific view of the human and model organism interactomes. Nucleic Acids Res. 2016;44(D1):D536–41.
- Das J, Yu H. HINT: high-quality protein interactomes and their applications in understanding human disease. BMC Syst Biol. 2012;6(1):92.
- Razick S, Magklaras G, Donaldson IM. iRefIndex: a consolidated protein interaction database with provenance. BMC Bioinformatics. 2008;9:405.
- Ong E, Xiang Z, Zhao B, et al. Ontobee: a linked ontology data server to support ontology term dereferencing, linkage, query and integration. Nucleic Acids Res. 2017;45(D1):D347–D52.
- Zou S, Sun D, Liang Y. The Roles of the SNARE Protein Sed5 in Autophagy in Saccharomyces cerevisiae. Mol Cells. 2017;40(9):643–654.
- Gan W, Zhang C, Siu KY, et al. ULK1 phosphorylates Sec23A and mediates autophagy-induced inhibition of ER-to-Golgi traffic. BMC Cell Biol. 2017;18(1):22.
- Noda T, Kim J, Huang W-P, et al. Apg9p/Cvt7p is an integral membrane protein required for transport vesicle formation in the Cvt and autophagy pathways. J Cell Biol. 2000;148(3):465–480.
- Zhang B, Wang J, Wang X, et al. Proteogenomic characterization of human colon and rectal cancer. Nature. 2014;513(7518):382–387.
- Subramanian A, Tamayo P, Mootha VK, et al. Gene set enrichment analysis: a knowledge-based approach for interpreting genome-wide expression profiles. Proc Natl Acad Sci U S A. 2005;102(43):15545–15550. .
- Yang Z, Geng J, Yen W-L, et al. Positive or negative roles of different cyclin-dependent kinase Pho85-cyclin complexes orchestrate induction of autophagy in Saccharomyces cerevisiae. Mol Cell. 2010;38(2):250–264.
- Poon PP, Cassel D, Spang A, et al. Retrograde transport from the yeast Golgi is mediated by two ARF GAP proteins with overlapping function. Embo J. 1999;18(3):555–564.
- Lewis SM, Poon PP, Singer RA, et al. The ArfGAP Glo3 is required for the generation of COPI vesicles. Mol Biol Cell. 2004;15(9):4064–4072.
- Dunn TM, Haak D, Monaghan E, et al. Synthesis of monohydroxylated inositolphosphorylceramide (IPC-C) in Saccharomyces cerevisiae requires Scs7p, a protein with both a cytochrome b5-like domain and a hydroxylase/desaturase domain. Yeast. 1998;14(4):311–321.
- Guan XL, Wenk MR. Mass spectrometry-based profiling of phospholipids and sphingolipids in extracts from Saccharomyces cerevisiae. Yeast. 2006;23(6):465–477.
- Li D, Song J-Z, Shan M-H, et al. A fluorescent tool set for yeast Atg proteins. Autophagy. 2015;11(6):954–960.
- Zhu J, Zhang ZT, Tang SW, et al. A Validated Set of Fluorescent-Protein-Based Markers for Major Organelles in Yeast (Saccharomyces cerevisiae). mBio. 2019;10(5):e01691–19.
- Klionsky DJ, Cuervo AM, Seglen PO. Methods for monitoring autophagy from yeast to human. Autophagy. 2007;3:181–206.
- Noda NN, Fujioka Y. Atg1 family kinases in autophagy initiation. Cell Mol Life Sci. 2015;72(16):3083–3096.
- Cheong H, Yorimitsu T, Reggiori F, et al. Atg17 regulates the magnitude of the autophagic response. Mol Biol Cell. 2005;16(7):3438–3453.
- Azoulay-Shemer T, Hsu PK, Schroeder JI. Seeing is believing. Nat Plants. 2017;3(10):765–766.
- Noda T. Autophagy in the context of the cellular membrane-trafficking system: the enigma of Atg9 vesicles. Biochem Soc Trans. 2017;45(6):1323–1331.
- Geng J, Klionsky DJ. Quantitative regulation of vesicle formation in yeast non-specific autophagy. Autophagy. 2008;4(7):955–957.
- Munakata N, Klionsky DJ. “Autophagy suite”: atg9 cycling in the cytoplasm to vacuole targeting pathway. Autophagy. 2010;6(6):679–685.
- De Sousa Abreu R, Penalva LO, Marcotte EM, et al. Global signatures of protein and mRNA expression levels. Mol Biosyst. 2009;5(12):1512–1526.
- Vogel C, Marcotte EM. Insights into the regulation of protein abundance from proteomic and transcriptomic analyses. Nat Rev Genet. 2012;13(4):227–232.
- Popovic D, Akutsu M, Novak I, et al. Rab GTPase-activating proteins in autophagy: regulation of endocytic and autophagy pathways by direct binding to human ATG8 modifiers. Mol Cell Biol. 2012;32(9):1733–1744.
- Yang S, Rosenwald A. Small GTPase proteins in macroautophagy. Small GTPases. 2018;9(5):409–414.
- Yamagata M, Obara K, Kihara A. Sphingolipid synthesis is involved in autophagy in Saccharomyces cerevisiae. Biochem Biophys Res Commun. 2011;410(4):786–791.
- Yamagata M, Obara K, Kihara A. Unperverted synthesis of complex sphingolipids is essential for cell survival under nitrogen starvation. Genes Cells. 2013;18(8):650–659.
- Wang J, Davis S, Zhu M, et al. Autophagosome formation: where the secretory and autophagy pathways meet. Autophagy. 2017;13:973–974.
- Ishihara N, Hamasaki M, Yokota S, et al. Autophagosome requires specific early Sec proteins for its formation and NSF/SNARE for vacuolar fusion. Mol Biol Cell. 2001;12(11):3690–3702.
- Kihara A, Noda T, Ishihara N, et al. Two Distinct Vps34 Phosphatidylinositol 3–Kinase Complexes Function in Autophagy and Carboxypeptidase Y Sorting inSaccharomyces cerevisiae. J Cell Biol. 2001;152(3):519–530.
- Tang H-W, Wang Y-B, Wang S-L, et al. Atg1-mediated myosin II activation regulates autophagosome formation during starvation-induced autophagy. Embo J. 2011;30(4):636–651.
- Lipatova Z, Belogortseva N, Zhang XQ, et al. Regulation of selective autophagy onset by a Ypt/Rab GTPase module. Proc Natl Acad Sci U S A. 2012;109(18):6981–6986.
- Krick R, Bremer S, Welter E, et al. Cdc48/p97 and Shp1/p47 regulate autophagosome biogenesis in concert with ubiquitin-like Atg8. J Cell Biol. 2010;190(6):965–973.
- Wang C-W, Stromhaug PE, Shima J, et al. The Ccz1-Mon1 protein complex is required for the late step of multiple vacuole delivery pathways. J Biol Chem. 2002;277(49):47917–47927.
- Jin M, Klionsky DJ. Transcriptional regulation of ATG9 by the Pho23-Rpd3 complex modulates the frequency of autophagosome formation. Autophagy. 2014;10(9):1681–1682.
- Yen W-L, Shintani T, Nair U, et al. The conserved oligomeric Golgi complex is involved in double-membrane vesicle formation during autophagy. J Cell Biol. 2010;188(1):101–114.
- Talloczy Z, Jiang W, Virgin HW, et al. Regulation of starvation- and virus-induced autophagy by the eIF2 kinase signaling pathway. Proc Natl Acad Sci U S A. 2002;99(1):190–195.
- Umekawa M, Klionsky DJ. Ksp1 kinase regulates autophagy via the target of rapamycin complex 1 (TORC1) pathway. J Biol Chem. 2012;287(20):16300–16310.
- Yi C, Ma M, Ran L, et al. Function and molecular mechanism of acetylation in autophagy regulation. Science. 2012;336(6080):474–477.
- UniProt Consortium T. UniProt: the universal protein knowledgebase. Nucleic Acids Res. 2018;46(5):2699.
- Huber W, Von Heydebreck A, Sultmann H, et al. Variance stabilization applied to microarray data calibration and to the quantification of differential expression. Bioinformatics. 2002;18(Suppl 1):S96–104.
- Valikangas T, Suomi T, Elo LL. A systematic evaluation of normalization methods in quantitative label-free proteomics. Brief Bioinform. 2018;19(1):1–11.
- The Gene Ontology Consortium. Expansion of the Gene Ontology knowledgebase and resources. Nucleic Acids Res. 2017;45(D1):D331–D338.
- Noda T, Matsuura A, Wada Y, et al. Novel system for monitoring autophagy in the yeast Saccharomyces cerevisiae. Biochem Biophys Res Commun. 1995;210(1):126–132.
- Noda T, Klionsky DJ. The quantitative Pho8Delta60 assay of nonspecific autophagy. Methods Enzymol. 2008;451:33–42.
- Hu G, McQuiston T, Bernard A, et al. A conserved mechanism of TOR-dependent RCK-mediated mRNA degradation regulates autophagy. Nat Cell Biol. 2015;17:930–942.
- Peng D, Wang Z, Huang A, et al. A Novel Function of F-Box Protein FBXO17 in Negative Regulation of Type I IFN Signaling by Recruiting PP2A for IFN Regulatory Factor 3 Deactivation. J Immunol. 2017;198(2):808–819.