
ABSTRACT
Myotubularin (MTM) and myotubularin-related (MTMR) lipid phosphatases catalyze the removal of a phosphate group from certain phosphatidylinositol derivatives. Because some of these substrates are required for macroautophagy/autophagy, during which unwanted cytoplasmic constituents are delivered into lysosomes for degradation, MTM and MTMRs function as important regulators of the autophagic process. Despite its physiological and medical significance, the specific role of individual MTMR paralogs in autophagy control remains largely unexplored. Here we examined two Drosophila MTMRs, EDTP and Mtmr6, the fly orthologs of mammalian MTMR14 and MTMR6 to MTMR8, respectively, and found that these enzymes affect the autophagic process in a complex, condition-dependent way. EDTP inhibited basal autophagy, but did not influence stress-induced autophagy. In contrast, Mtmr6 promoted the process under nutrient-rich settings, but effectively blocked its hyperactivation in response to stress. Thus, Mtmr6 is the first identified MTMR phosphatase with dual, antagonistic roles in the regulation of autophagy, and shows conditional antagonism/synergism with EDTP in modulating autophagic breakdown. These results provide a deeper insight into the adjustment of autophagy.
Abbreviations: Atg, autophagy-related; BDSC, Bloomington Drosophila Stock Center; DGRC, Drosophila Genetic Resource Center; EDTP, Egg-derived tyrosine phosphatase; FYVE, zinc finger domain from Fab1 (yeast ortholog of PIKfyve), YOTB, Vac1 (vesicle transport protein) and EEA1 cysteine-rich proteins; LTR, LysoTracker Red; MTM, myotubularin; MTMR, myotubularin-related; PI, phosphatidylinositol; Pi3K59F, Phosphotidylinositol 3 kinase 59F; PtdIns3P, phosphatidylinositol-3-phosphate; PtdIns(3,5)P2, phosphatidylinositol-3,5-bisphosphate; PtdIns5P, phosphatidylinositol-5-phosphate; ref(2)P, refractory to sigma P; Syx17, Syntaxin 17; TEM, transmission electron microscopy; UAS, upstream activating sequence; Uvrag, UV-resistance associated gene; VDRC, Vienna Drosophila RNAi Center; Vps34, Vacuolar protein sorting 34.
Introduction
Myotubularin (MTM) and myotubularin-related (MTMR) phosphatases share a Cys-X5-Arg motif, and their catalytic activity is specific to phosphoinositides, which are important components of lipid membranes [Citation1]. Out of the sixteen mammalian MTM/MTMR paralogs (MTM and MTMR1-MTMR15), nine have catalytic activity (). They dephosphorylate phosphatidylinositol-3-phosphate (PtdIns3P) and phosphatidylinositol-3,5-bisphosphate (PtdIns [Citation3,Citation5]P2) at the D3 position to generate phosphatidylinositol (PtdIns) and phosphatidylinositol-5-phosphate (PtdIns5P), respectively () [Citation1,Citation2]. The inactive members lack a Cys in the catalytic center, and form heterodimers with certain active MTMRs to modulate the active member’s subcellular localization, substrate preference and enzymatic activity [Citation3]. The discovery of human MTMRs was strongly linked to various muscle and neurodegenerative pathologies such as myotubular myopathy and Charcot-Marie-Tooth disease [Citation1,Citation4,Citation5]. MTMRs are known to be expressed differently in various tissues and cell types, and function at different cellular phosphoinositide pools [Citation3,Citation6].
Figure 1. Classification and molecular functions of MTMRs in flies and mammals. (A) Human myotubularin (MTM) and myotubularin-related (MTMR) phosphatases (black) and their fly orthologs (blue). Proteins were grouped according to the presence or absence of active phosphatase domain. EDTP and Mtmr6, the two Drosophila paralogs that were analyzed in this study, are underlined. (B) MTMRs dephosphorylate PtdIns3P to PtdIns, thereby antagonizing the class III PtdIns3K. MTMRs also convert PtdIns(3,5)P2 to PtdIns5P. PtdIns3P, PtdIns5P and PtdIns(3,5)P2 are each involved in autophagy. (C) Scaled representation of the protein domains of Drosophila myotubularins based on Pfam predictions. Abbreviations: 3-PAP: 3-phosphatase adapter protein; C1: phorbol esters/diacylglycerol binding; DENN: differentially expressed in neoplastic versus normal cells; FYVE: Fab1 (yeast ortholog of PIKfyve), YOTB, Vac1 (vesicle transport protein) and EEA1; GRAM: glucosyltransferases, Rab-like GTPase activators and myotubularins; PH: pleckstrin homology; Sbf: SET domain binding factor
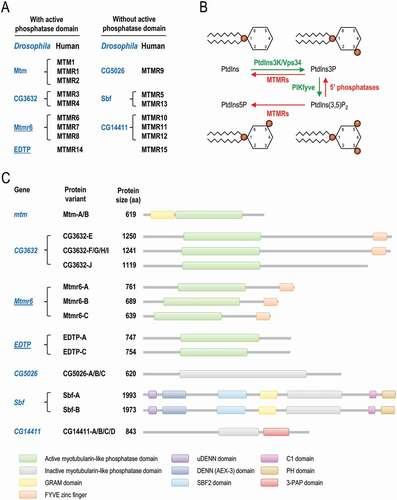
Phosphoinositides are present in relatively large quantities in autophagic membranes in every organism examined so far for this feature [Citation7,Citation8]. Autophagy (cellular self-degradation) acts as a major, lysosome-dependent catabolic process of eukaryotic cells [Citation9–12]. It effectively eliminates unwanted (superfluous and damaged) constituents from the cytoplasm, thereby contributing to macromolecule and organelle turnover required for cellular homeostasis [Citation13,Citation14]. Depending on the mechanism by which cytoplasmic materials are delivered into lysosomes, three major forms of autophagy can be distinguished, macroautophagy, chaperone-mediated autophagy and microautophagy. During the macroautophagic process (hereafter referred to as autophagy), a double membrane-bound structure, called the phagophore, is formed to sequester cytoplasmic materials destined for degradation. Closure of the phagophore generates a vesicle termed an autophagosome, which eventually fuses with a lysosome to generate an autolysosome, in which the cargo becomes degraded by acidic hydrolases [Citation15]. The mechanisms and regulation of autophagy are highly conserved among eukaryotes, and mediated by different Atg (autophagy-related) proteins, which are organized into distinct functional complexes [Citation16]. The class III phosphatidylinositol 3-kinase (PtdIns3K), Vps34, participates in the so-called vesicle nucleation complex that converts PtdIns into PtdIns3P, which is an important signaling component of the forming phagophore membrane (). In yeast, worms, flies, and mammals, PtdIns3P is abundantly present in endosomal membranes too [Citation17–20]. In the aforementioned organisms, PtdIns(3,5)P2 and, at least in mammals, PtdIns5P also play important roles in autophagy control () [Citation21–25]. MTM and MTMRs can modulate autophagy in various models by dephosphorylating PtdIns3P and PtdIns(3,5)P2 [Citation26]. Indeed, inhibiting MTM1, MTMR1, MTMR2 or MTMR3 in mammalian cells, flies, zebrafish and mice can lead to an increased amount of autophagic structures [Citation27–31]. In the nematode Caenorhabditis elegans, contribution of MTM-3/MTMR3 to autophagy regulation remains controversial as depletion of the protein enhances autophagy in muscle fibers [Citation32], whereas another study found that decreased levels of the protein limit autolysosome formation in various cell types during embryogenesis [Citation33]. MTMR6 does not influence basal autophagy, but inhibits starvation-induced autophagy in human macrophages [Citation34]. However, the latter effect was not observed in HeLa cells [Citation35]. MTMR7 has a subtle or no effect on Atg8/LC3B conjugation to autophagic membranes in human macrophages [Citation34]. At the same time, MTMR7, at least in colorectal cancer cell lines, inhibits insulin signaling, which negatively regulates the autophagic process [Citation36]. In mammalian cell cultures, MTMR6, MTMR7 and MTMR8 compete with each other to bind inactive MTMR9 [Citation35]. MTMR6-MTMR9 heterodimer prefers PtdIns(3,5)P2 as a substrate, while MTMR8-MTMR9 heterodimer is more specific to PtdIns3P [Citation35]. Association of MTMR8 with MTMR9 lowers autophagic activity [Citation35].
The role of a catalytically inactive MTMR, Sbf/SBF2/MTMR13 (), was also revealed in endo-lysosomal trafficking and autophagosome-lysosome fusion in flies and mammalian cells [Citation37] In mtmr14 knockout mice, autophagic activity is much higher than in control [Citation38]. MTMR14 downregulation can also induce autophagy in murine embryonic fibroblasts [Citation39]. In human macrophages, MTMR14 inhibits autophagosome formation under both well-fed and starvation-induced conditions [Citation34]. Furthermore, silencing of MTMR14 enhances the ratio of the membrane-conjugated form of Atg8/LC3B (Atg8–PE/LC3B-II) relative to its soluble form (Atg8/LC3B-I). Overexpressing MTMR14 in mouse C2C12 myoblast cells elevates SQSTM1/p62 (sequestosome 1) levels, which is indicative of reduced autophagy [Citation34]. MTMR14 is present on phagophore membranes, where it regulates the recruitment of WIPI1/Atg18 (WD repeat domain, phosphoinositide interacting 1) and ATG9 [Citation34]. Mtmr14 inactivation also induces autophagy in zebrafish [Citation28]. EDTP (Egg-derived tyrosine phosphatase), the sole Drosophila ortholog of human MTMR14, which has two predicted isoforms, EDTP-A and -C (), effectively hampers autophagy in the larval fat body [Citation40,Citation41]. Together, the regulatory roles of MTMR paralogs on autophagy are rather complex and still poorly explored.
Here we performed a genetic analysis of two Drosophila MTMR lipid phosphatases, EDTP and Mtmr6/CG3530, which are orthologous to human MTMR14 and MTMR6 to MTMR8, respectively. We found that EDTP inhibits basal autophagy by antagonizing PtdIns3K, but does not affect the process under stress-induced conditions. In contrast, CG3530, which we termed Mtmr6, exhibits novel, antagonistic roles in autophagy control. The protein promoted basal autophagy at a later stage of the process, but inhibited autophagosome formation under stress-induced conditions by interfering the PtdIns3K vesicle nucleation complex. Thus, EDTP and Mtmr6 regulate autophagy in a highly complex, condition-dependent way.
Results
The expression of EDTP and Mtmr6 in the larval fat body is increased upon starvation
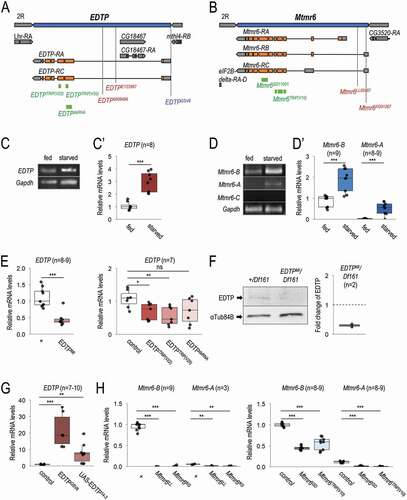
EDTP and Mtmr6 are located on chromosome II in the Drosophila genome (). We first investigated whether the two genes are expressed in the larval fat body, which is a tractable model organ for studying the regulation of autophagy [Citation42]. Transcript levels were determined under nutrient-rich (well-fed) and amino acid-depleted conditions by feeding animals on extra yeast-, sugar- and cornmeal-containing medium or on 20% sucrose medium, respectively. Using semi-qPCR and qRT-PCR, we found that EDTP, which encodes two highly similar isoforms, EDTP-A and -C (), is abundantly expressed in larval fat body cells, and its transcription becomes elevated in response to starvation ( and C’). Mtmr6 codes for three splice variants, Mtmr6-A, -B and -C (). In the fat body, the transcript level of Mtmr6-B was also abundant, Mtmr6-A was expressed at relatively low quantities, while Mtmr6-C activity was below detectable levels ( and D’). The amounts of both visible Mtmr6 transcript variants were significantly higher in starved animals than in well-fed ones. These data indicate that both EDTP and Mtmr6 are active in larval fat body cells, and responsive to food deprivation.
Figure 2. Mutant alleles, RNAi and overexpression constructs of EDTP and Mtmr6. (A) Exon/intron structure of EDTP. Specific positions of on-target sequences of RNAi constructs (green), inactivating mutations (red) and overexpressing insertion (blue) are shown. (B) Genomic structure of Mtmr6/CG3530. RNAi constructs (green) and mutant alleles (red) are indicated. (C-C’) EDTP is expressed in larval fat body cells of well-fed larvae, and its expression becomes elevated upon amino acid starvation, based on semi-quantitative RT-PCR (C) and quantitative real-time (qRT-) PCR (C’) analyses. (D) Splice-variants of Mtmr6 are expressed at different levels in the larval fat body. Under nutrient-rich condition, only Mtmr6-B is detectable by semi-qRT-PCR, the level of which becomes elevated in response to amino acid starvation. The expression of Mtmr6-A can be observed only under the latter condition. Mtmr6-C expression is not detectable under either circumstance. (D’) Based on qRT-PCR results, Mtmr6-B is markedly expressed, while Mtmr6-A shows a very weak expression in well-fed larvae. Expression of both splice variants is elevated upon starvation. (E) Relative transcript levels of the EDTPMI gene trap mutant allele and EDTP RNAi constructs, determined by qRT-PCR. (F) EDTPMI gene trap mutant allele also effectively lowers EDTP protein level. (G) Relative EDTP mRNA level is increased upon applying overexpression constructs. (H) Expression levels of active Mtmr6 splice variants (A and B) in control, mutant and RNAi-treated samples. qRT-PCR and semi-qRT-PCR were used on total RNA samples isolated from larval fat bodies of well-fed (C-D’) or 3 h-starved (C-H) animals at the third instar feeding larval (L3F) stage. Protein samples also stem from larval fat bodies of 3 h-starved animals at the third instar feeding larval (L3F) stage. Gapdh and αTub84B were used as internal controls for PCR experiments and in western blot analysis, respectively. Expression of UAS constructs was driven by Act5C-Gal4. In the case of long hairpin RNAi constructs, UAS-Dcr-2 was also coexpressed. w1118 animals (indicated by “+”) served as control for mutant strains, Act5C-Gal4/+ animals did for short hairpin RNAi and overexpression constructs, and UAS-Dcr-2/+; Act5C-Gal4/+ animals did for long hairpin RNAi constructs. Quantifications of normalized mRNA and protein levels are shown in box plots. *: p < 0.05, **: p < 0.01 ***: p < 0.001, ns: not significant. For statistics, see the Materials and Methods section
Characterization of mutant alleles, as well as RNAi and overexpression constructs of EDTP and Mtmr6
We next examined mutant alleles, as well as RNA interference (RNAi) and overexpression constructs of the two lipid phosphatase-encoding genes to explore how these genetic interventions affect their activity. In the case of EDTP, an insertional gene trap mutant allele (EDTPMI0849, hereafter EDTPMI), three RNAi constructs [two short hairpins, EDTPTRiP(V20) and EDTPTRiP(V22), and a long hairpin, EDTPdsRNA], and two overexpression constructs (GSV6 and UAS-EDTP14−3) were assessed (). The mutant allele and RNAi constructs each lowered the EDTP transcript levels as compared with control (). A strong reduction in protein level was observed previously in EDTPMI mutant fat body cells of well-fed, DMSO-treated animals [Citation40,Citation41]. We detected a similar decrease in EDTP protein level in starved animals relative to control (). The overexpressing constructs markedly increased EDTP expression (). For Mtmr6, we analyzed two insertional mutations (Mtmr6LL02467 and Mtmr6KG01267, hereafter Mtmr6LL and Mtmr6KG) and two RNAi constructs [Mtmr6GD and Mtmr6TRiP(V10)] (). Transcripts were isolated from starved larvae to detect sufficient amounts of Mtmr6-A mRNA. We observed very low levels of Mtmr6 isoforms in either mutant (), suggesting that both alleles function as a strong reduction-of-function mutation. We chose Mtmr6LL allele for further analyses. Both Mtmr6-RNAi constructs decreased transcript levels of Mtmr6-A and -B isoforms ().
EDTP- and Mtmr6-defective animals display distinct phenotypes
The gross morphology of adult EDTPMI mutant animals appeared to be normal (100%). In contrast, Mtmr6LL mutants (DGRC: 140,628) exhibited a fully penetrant (100%) pupal-lethal phenotype, while the vast majority of Mtmr6LL transheterozygous pupae that carry deficiencies covering Mtmr6 locus (Df778 and Df661) could develop into adults (84.71% and 82.68%, respectively). This suggests that a background mutation is responsible for lethality in the canonical Mtmr6LL mutant strain. This prompted us to outcross the strain by selecting on DsRed marker encoded by PBac transposon that generates the mutant LL allele, and viable lines were established. In a recent study, a genetic null mutation of Mtmr6 was associated with a fully penetrant lethal phenotype manifesting during development [Citation43]. Thus, Mtmr6LL probably represents a reduction-of-function allele. A genetic analysis of Mtmr6 we presented in this study involved this outcrossed Mtmr6LL mutant strain. We found that nearly 20% of Mtmr6LL mutant animals display an abnormal wing morphology (Figure S1A). To confirm the wing phenotype associated with defects in Mtmr6 function, we applied a deficiency, Df778, which overlaps the genomic region of Mtmr6 to generate transheterozygous (or hemizygous) animals. Consistent with Mtmr6LL homozygous mutant adults, Mtmr6LL/Df778 animals also showed an aberrant wing morphology. In addition, we generated a genomic BAC clone-based Mtmr6-rescuing construct called Mtmr6rescue. The presence of Mtmr6rescue in Mtmr6LL mutant genetic background effectively restored the wild-type wing phenotype (Figure S1A), further confirming that the observed aberrant wing morphology in flies defective for Mtmr6 is indeed the consequence of the disrupted Mtmr6 function.
By testing viability in these mutant strains, we revealed that both EDTPMI and Mtmr6LL alleles cause a semi-lethal phenotype. EDTPMI mutation killed animals primarily at the embryonic stage (penetrance: 38.98%), while Mtmr6LL mutation triggered death predominantly at embryonic and larval stages (26.55% and 24.29%, respectively) (Figure S1B). However, when gene silencing was initiated from the onset of adulthood only, EDTP-RNAi animals lived significantly longer than control (GFP-RNAi) (Figure S1C, Table S1). The life span of Mtmr6-RNAi and Mtmr6LL mutant animals was shorter than the corresponding control flies (Figure S1C, Table S1). These results point to distinct physiological and developmental roles for the two MTMR paralogs. Next, we analyzed the combined effects of the two MTMRs on life span. Accordingly, EDTP was downregulated in the Mtmr6LL mutant background throughout adulthood. We found that Mtmr6LL mutation suppresses the long-lived phenotype of EDTP-RNAi animals (Figure S1C, Table S1), suggesting that EDTP and Mtmr6 act in the same genetic pathway to influence organismal aging.
EDTP inhibits, while Mtmr6 promotes, basal autophagy
Basal levels of autophagy are required for maintaining cellular homeostasis by degrading damaged intracellular macromolecules and organelles. We first monitored the involvement of EDTP and Mtmr6 in the regulation of autophagy under nutrient-rich conditions in the larval fat body. We used an mCherry-labeled Atg8a reporter (mCherry-Atg8a), which is widely used to detect early and late autophagic structures (phagophores, autophagosomes and autolysosomes) [Citation44]. In the EDTPMI mutant genetic background, an elevated amount of mCherry-Atg8a-positive structures was detected as compared with control w1118 animals transgenic for mCherry-Atg8a (Figure S2A). Similar results were obtained from EDTPMI/Df161 hemizygous samples (). Using two independent (non-overlapping) RNAi constructs, EDTP downregulation also increased the amount of Atg8a-positive foci (Figure S2B). This set of gene silencing experiments was performed in a clonal system, in which the green, GFP-positive fat body cells express the RNAi construct while the neighboring, non-green cells do not, serving as a genetically identical control. In accordance with these results, upregulation of EDTP significantly lowered the amount of mCherry-Atg8a-positive compartments under well-fed conditions (Figure S2C). By examining Mtmr6 mutant and RNAi animals, similar results were obtained; the amount of mCherry-Atg8a-positive compartments was markedly higher in Mtmr6LL and Mtmr6LL/Df778 mutants, and also in Mtmr6-specific dsRNA-treated cells, as compared to control (, S2A, and S2B). These findings indicate that in larval fat body cells both EDTP and Mtmr6 affect autophagy under nutrient-rich conditions.
Figure 3. Under nutrient-rich conditions, EDTP suppression leads to increased amounts of early and late autophagic structures whereas Mtmr6 inactivation causes the accumulation of early autophagic structures only. (A) Deficiencies that overlap the genomic region of EDTP or Mtmr6 were used to generate transheterozygous (or hemizygous) animals. Mutational inactivation of EDTP (EDTPMI/Df161) and Mtmr6 (Mtmr6LL/Df778) in hemizygous backgrounds increases the amounts of mCherry-Atg8a-positive structures (red foci; forming phagophores, autophagosomes, and autolysosomes). (B) Clonal silencing of EDTP and Mtmr6 elevates the quantity of mCherry-Atg18a-positive early autophagic structures. Clonal cells (green) treated with RNAi are outlined by a white dotted line. Analysis was performed by using hsFLP; UAS-Dcr-2; r4-mCherry-Atg18a, Act<CD2< Gal4, UAS-nlsGFP animals. (C) EDTP deficiency enhances the amount of acidic compartments, primarily autolysosomes, labeled by LysoTracker Red (LTR, red dots), as compared to control. Inhibiting Mtmr6 does not elevate the amount of LTR-positive structures. (D) Ultrastructural analysis of autophagy in fat body cells under well-fed conditions. In control (w1118) larvae maintained under nutrient-rich condition, autophagic structures cannot essentially be observed by transmission electron microscopy (TEM). In well-fed EDTPMI mutant larvae elevated numbers of autophagic structures are observed by TEM. In the homozygous Mtmr6LL mutant genetic background more extensive internal membrane formation can be detected. Arrowheads indicate autophagic structures. Scale bars: 1 µm. In panels A-C, Hoechst staining (blue) indicates nuclei, scale bars: 10 μm. Fluorescence microscopy images were composed of multiple optical sections. Quantifications are shown in box plots, *: p < 0.05, **: p < 0.01 ***: p < 0.001, ns: not significant. For statistics, see the Materials and Methods section. In panel A, +/Df161 and +/Df778 were used as controls. In panel C and D, w1118 was used as a control (indicated as “+”). Fat bodies were prepared from well-fed animals at the third instar feeding larval (L3F) stage
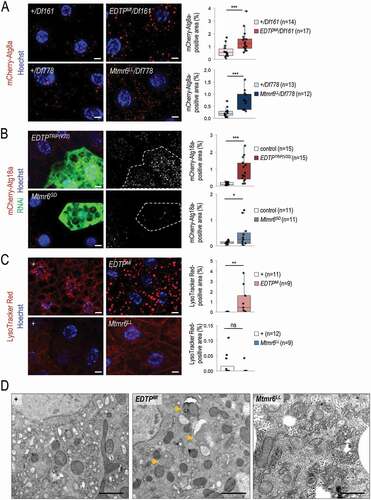
We also assessed the effect of the two enzymes on the amount of Atg18a-positive structures. Yeast and human orthologs of Atg18a, Atg18 and WIPI2B, respectively, directly bind PtdIns3P localized in the phagophore membrane, thereby serving as an early marker for autophagy [Citation45]. Silencing of EDTP and Mtmr6 each led to increased levels of mCherry-Atg18a-positive structures (). This could result from an increased autophagy flux or, alternatively, a blockage in the autophagic process at a later stage, such as autophagosome-lysosome fusion or acidic degradation. Therefore, we asked whether increased amounts of autophagic structures accompany with increased amounts of acidic compartments. LysoTracker Red (LTR) is a reliable marker for detecting acidic structures, primarily autolysosomes, in larval fat body cells [Citation42]. We found a significant increase in the amount of LTR-positive structures in mutant flies deficient in EDTP function (i.e., homozygous EDTPMI and hemizygous EDTPMI/Df161 mutants), as compared to control (w1118 and +/Df161) ( and S3A). A similar extent of increase was observed in fat body cells clonally downregulated for EDTP, relative to neighboring control cells (Figure S3B). However, EDTP overexpression was unable to lower the amount of acidic structures (Figure S3C). It is worthy to note that larval fat body cells contain very low (basal) levels of acidic compartments under well-fed conditions. Contrary to EDTP downregulation, inhibiting Mtmr6 was not associated with increased amounts of LTR-positive structures under well-fed conditions (, S3A, and S3B). Even a slight reduction in the number of acidic structures could be detected in Mtmr6 mutants relative to control. Because EDTP deficiency increased, while Mtmr6 dysfunction moderately decreased, the amount of autolysosomes under nutrient-rich conditions, we conclude that the two Mtmr lipid phosphatases differently influence basal autophagy in the larval fat body.
To confirm these results above, an ultrastructural analysis of EDTP- and Mtmr6-deficient animals was performed, using a TEM analysis. We could detect no autophagic structure (double membrane-bound vesicles) in ultrastructural images of fat body cells prepared from well-fed w1118 mutant animals regarded as control (). In EDTP mutants, however, significant amounts of autophagosomes and autolysosomes were identified. This was not evident for Mtmr6LL mutants, although much more intracellular membranes were formed in this genetic background as compared with control (). This finding further supports the antagonistic roles of EDTP and Mtmr6 in controlling the autophagic process under well-fed conditions in the Drosophila larval fat body.
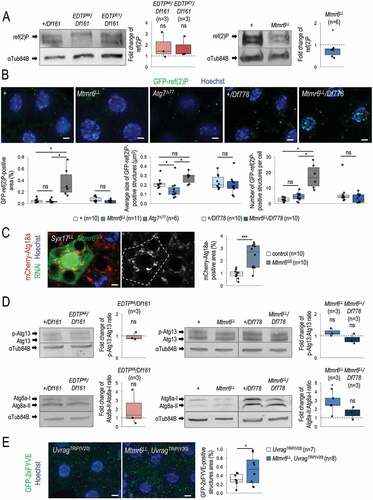
Autophagic degradation was subsequently tested by monitoring the intracellular level of ref(2)P, the sole Drosophila ortholog of mammalian SQSTM1 [Citation45]. ref(2)P serves as an autophagy receptor, which itself becomes degraded during the autophagic process. We determined the soluble fraction of ref(2)P by western blot analysis, and identified its protein-aggregated form by fluorescence microscopy, using a GFP-ref(2)P reporter. The amount of soluble ref(2)P was considerably decreased in EDTP mutant backgrounds relative to control (). In contrast, mutational inactivation of Mtmr6 (Mtmr6LL allele) triggered the intracellular accumulation of both soluble and aggregated forms of ref(2)P (). We also analyzed Atg7 loss-of-function mutant animals, in which autophagosome formation is impaired, leading to a significant increase in both the number and size of ref(2)P-positive structures. Mtmr6 deficiency however increased only the number, but not the size, of these structures (). These results imply that autophagosomes are formed in Mtmr6 mutants, but autophagy becomes compromised at a later stage of the process. Together, EDTP represses basal autophagy in fat body cells of well-fed animals as EDTP deficiency increased the amount of autophagic and acidic structures, and lowered ref(2)P levels. In contrast, Mtmr6 promotes the autophagic process at a later stage under the same condition, as defects in Mtmr6 function led to elevated amounts of early autophagic structures but decreased the amount of acidic compartments, and also enhanced ref(2)P accumulation in the larval fat body.
Figure 4. EDTP inhibits whereas Mtmr6 moderately promotes basal autophagy under nutrient-rich conditions. (A) Western blot analysis showing that soluble ref(2)P levels become lowered in fat body cells deficient in EDTP, but become highly elevated in cells defective for Mtmr6, as compared with control. ref(2)P serves as an autophagic substrate, thereby is widely used to monitor the autophagic degradation. (B) In Mtmr6 mutant genetic backgrounds, the amount of insoluble GFP-ref(2)P-containing protein aggregates becomes elevated. This change stems from the difference in the number of GFP-ref(2)P-positive structures and not from the alteration in the size of structures. Atg7Δ77 mutant animals defective for autophagosome formation were also involved. (C) Clonal silencing of EDTP highly elevates the quantity of mCherry-Atg18a-positive early autophagic structures in Syx17LL mutant fat body cells, which are deficient in autophagosome-lysosome fusion. Clonal green cells treated with RNAi are outlined by a white dotted line. Analysis was performed by using hsFLP; Syx17LL, r4-mCherry-Atg18a, Act<CD2< Gal4, UAS-nlsGFP animals. (D) The ratio of hyperphosphorylated and non-hyperphosphorylated Atg13 levels is slightly decreased in EDTP mutant, but not altered in Mtmr6 mutant samples compared to the corresponding control, indicating that the activity of the induction complex is not enhanced by these genes. Atg8a-II/Atg8a-I ratio is not altered in fat body cells deficient in EDTP, but increased in Mtmr6 mutant samples. Atg8a-I is a cytosolic, Atg8a-II is a membrane-conjugated protein form. (E) Mutation of EDTP significantly elevates the quantity of GFP-2xFYVE-positive structures in Uvrag-RNAi cells, in which only the autophagy-specific PtdIns3K complex is active. GFP-2xFYVE bounds PtdIns3P and labels only early autophagic structures in Uvrag-downregulated cells. UAS-GFP-2xFYVE transgene is expressed by Cg-Gal4 driver. In panels A and D, αTub84B was used as an internal control. In panels A, B and D, “+” indicates w1118 mutant control larvae. In panels B, C and E, Hoechst staining (blue) indicates nuclei, scale bar: 10 μm. Fluorescence microscopy images were composed of multiple optical sections. Quantifications are shown in box plots, *: p < 0.05, **: p < 0.01, ***: p < 0.001, ns: not significant. For statistics, see the Materials and Methods section. Fat body samples were prepared from well-fed animals at the third instar feeding larval (L3F) stage
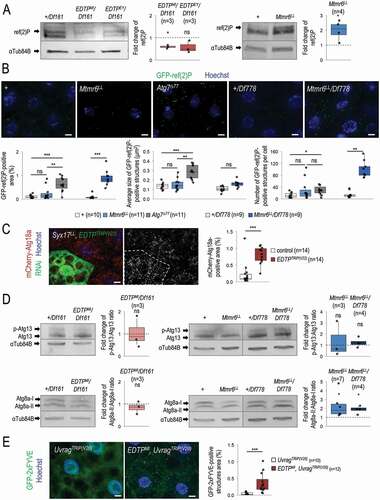
EDTP inhibits basal autophagy by antagonizing PtdIns3P production
We further investigated the mechanisms by which EDTP inhibits basal autophagy. To this end, we first examined EDTP-RNAi cells in a Syx17 (Syntaxin 17) mutant genetic background in larval fat body cells. Syx17 is a Q-type soluble NSF attachment proteins receptor (SNARE) protein required for the autophagosome-lysosome fusion in flies and mammals [Citation46,Citation47]. Hence, the level (generation) of autophagosomes can be examined in Syx17 mutant (Syx17LL) animals. We observed a significant increase in the amount of autophagosomes in fat body cells of EDTP-RNAi; Syx17LL genotype as compared to Syx17LL mutant control cells (). This further indicates that EDTP inhibits autophagosome formation under nutrient-rich conditions. To address the issue of whether the inhibition occurs at the level of the induction complex containing Atg1 and Atg13, or even upstream, or at the level of vesicle nucleation (i.e., the class III PtdIns3K/Pi3K59F/Vps34 complex), we performed a western blot analysis using an anti-Atg13 antibody to reveal the hyperphosphorylated state of Atg13, which is indicative for the activity of the induction complex [Citation48]. The ratio of hyperphosphorylated and non-hyperphosphorylated forms of Atg13 remained unchanged between EDTP mutant and control samples (). Thus, EDTP inhibits autophagosome formation downstream of the induction complex. Because EDTP is likely to dephosphorylate PtdIns3P generated by PtdIns3K, we analyzed the quantity of GFP-2xFYVE-positive structures. GFP-2xFYVE labels PtdIns3P-rich membrane structures including early (sorting) endosomes and autophagosomes [Citation49]. EDTP downregulation moderately enhanced the amount of GFP-2xFYVE-positive structures (Figure S3D). To reveal the effect of EDTP on the amount of GFP-2xFYVE-positive structures specific for autophagy only, we next performed the analysis in an Uvrag-RNAi genetic background, in which the PtdIns3K complex participating in endocytosis was blocked [Citation50,Citation51]. We found that EDTPMI mutation remarkably increased the amount of the autophagy-specific GFP-2xFYVE-positive structures ().
The potential influence of EDTP on autophagosome maturation was also examined. During autophagosome formation, the initially soluble Atg8a (Atg8a-I) becomes covalently bound to the phagophore membrane (Atg8a-II), and eventually is degraded in mature autolysosomes [Citation45]. We found that the ratio of Atg8a-II and Atg8a-I levels is not altered in EDTP mutants contrary to the control genetic background (). Although EDTP deficiency enhanced autophagosome formation (), it did not increase Atg8a-II:Atg8a-I ratio as compared with control. This suggests that autophagosome maturation is also promoted in EDTP mutants. We conclude that EDTP antagonizes PtdIns3K to prevent autophagosome formation and also inhibits maturation in fat body cells under nutrient-rich conditions.
Next, we monitored the effect of Mtmr6 on the ratio of Atg8a-II and Atg8a-I, as well as on Atg13 hyperphosphorylation. In Mtmr6 mutant samples, the level of Atg8a-II was increased relative to Atg8a-I, indicating that the accumulation of autophagic structures is a consequence of impaired autolysosomal degradation (). The activity of the induction complex was unaltered in Mtmr6 mutant genetic backgrounds compared to control (). These data further support that Mtmr6 promotes autophagy at a later stage of the process in the larval fat body under nutrient-rich conditions.
EDTP does not affect, while Mtmr6 inhibits, starvation-induced autophagy
Limitations in food availability significantly increase the amount of autophagic structures labeled by mCherry-Atg8a, mCherry-Atg18a and LTR in the affected cells, and enhanced autophagy provides energy and building blocks for the synthetic processes [Citation44,Citation52]. By applying a 3 to 4 h-long amino acid restriction treatment, the amount (area ratio) of mCherry-Atg8a-, mCherry-Atg18a- and LTR-positive structures remained constant in fat body cells between EDTP mutant and control animals (, S4A and S5A). EDTP downregulation similarly resulted in no alteration in autophagic activity under identical conditions (Figure S4B and S5B). Consistent with these data, we observed no significant difference in the amount of soluble ref(2)P and in the ratio of Atg8a-II and Atg8a-I in EDTP mutants relative to control (), as well as hyperphosphorylation of Atg13 was unchanged, too (). However, we noticed that soluble ref(2)P tends to accumulate in EDTP mutants as compared with control (). The potential effect of EDTPMI mutation on ref(2)P expression was also tested, and the results showed that EDTP deficiency leads to increased ref(2)P transcript levels in starved animals (Figure S5D). Thus, the accumulation of soluble ref(2)P was a consequence of enhanced transcription rather than decreased protein degradation. In addition, EDTP overexpression lowered the amount of both mCherry-Atg8a- and LTR-positive structures, as compared with the corresponding control genetic backgrounds (Figure S4C and S5C). We conclude that although overexpression of EDTP can hamper starvation-induced autophagy, the endogenous level of the protein does not modulate the process in larval fat body cells. These results are particularly interesting because MTMR14 has been suggested to repress autophagy in mammalian cells exposed to nutrient deprivation [Citation34]. Either the role of MTMR14 was previously mis-specified (see the Discussion section) or mammals and flies significantly differ from each other in executing autophagy repression under cellular stress conditions.
Figure 5. In starved animals, the amount of autophagic structures is not influenced by EDTP deficiency, but becomes elevated in response to Mtmr6 inactivation. (A) Mutational inactivation of EDTP in a hemizygous background (EDTPMI/Df161) does not influence the amount of mCherry-Atg8a-positive structures. In contrast, mutation in mtmr6 in a hemizygous background (Mtmr6LL/Df778) increases the number of autophagic structures relative to control. mCherry-Atg8a (red) labels forming phagophores, autophagosomes and autolysosomes. (B) Clonal silencing of EDTP in fat body cells does not influence the quantity of mCherry-Atg18a-positive early autophagic structures. Downregulation of Mtmr6 significantly enhances the number of these structures. Clonal cells (green) treated with RNAi are outlined by white dotted lines. Analysis was performed by using hsFLP; UAS-Dcr-2; r4-mCherry-Atg18a, Act<CD2< Gal4, UAS-nlsGFP animals. (C) Defects in EDTP function do not alter the number and size of acidic compartments labeled by LysoTracker Red (LTR), as compared to control. An inactivating mutation in Mtmr6 enhances the amount of LTR-positive structures, which are effectively rescued by an Mtmr6rescue clone to nearly normal levels. LTR (red) stains acidic structures including autolysosomes. (D) Ultrastructural analysis of autophagy in fat body cells under starved condition. Starvation triggers the formation of autophagic structures including autophagosomes and autolysosomes in control animals. In Mtmr6LL mutant samples, fusing autophagic structures (right up) and digesting autolysosomes with degrading materials become abundantly apparent in response to nutritional stress (right down). Arrowheads indicate autophagic structures. Scale bar: 1 µm in large images and 125 nm in small ones. In panels A-C, Hoechst staining (blue) indicates nuclei, and scale bar: 10 μm. Fluorescence microscopy images were composed of multiple optical sections. Quantifications are shown in boxplots, *: p < 0.05, **: p < 0.01, ***: p < 0.001, ns: not significant (for statistics, see the Materials and Methods section). In panels C and D, w1118 was used as a control, indicated by “+”. Fat bodies were prepared from starved animals at the third instar feeding larval (L3F) stage
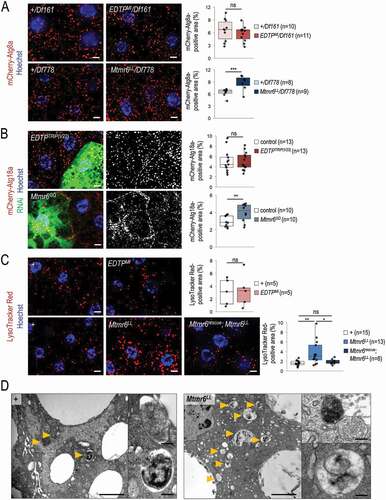
Figure 6. Under starvation, EDTP does not affect, while Mtmr6 inhibits autophagy. (A) In nutrient-deprived animals, the level of soluble ref(2)P is not modulated significantly by EDTP deficiency, but becomes decreased in samples defective for Mtmr6 (western blot analysis). (B) In Mtmr6 mutant genetic backgrounds, the area ratio of insoluble GFP-ref(2)P-containing protein aggregates is not altered significantly but the size of structures is lowered. Atg7Δ77, as a mutant background deficient in autophagosome formation, was also involved in comparison. (C) Clonal silencing of Mtmr6 markedly elevates the quantity of mCherry-Atg18a-positive early autophagic structures in Syx17LL mutant fat bodies, which are defective for autophagosome-lysosome fusion. Clonal cells (green) treated with RNAi are outlined by a white dotted line and also expressed Dcr-2. Analysis was performed by using hsFLP; Syx17LL, r4-mCherry-Atg18a, Act<CD2< Gal4, UAS-nlsGFP animals. (D) The ratio of hyperphosphorylated and non-hyperphosphorylated Atg13 levels is not altered in either EDTP or Mtmr6 mutant samples as compared to controls, indicating that the activity of the induction complex is not influenced. In fat body cells, Atg8a-II:Atg8a-I ratio is not changed in EDTP mutants but becomes increased in Mtmr6 mutant animals as compared to control. Atg8a-I is a cytosolic, Atg8a-II is a membrane-bound form. (E) Mutation of Mtmr6 elevates the quantity of GFP-2xFYVE-positive structures in Uvrag-silenced cells, in which only the autophagy-specific PtdIns3K complex is active. GFP-2xFYVE bounds PtdIns3P and labels only early autophagic structures in Uvrag-silenced cells. UAS-GFP-2xFYVE transgene is expressed by Cg-Gal4 driver. In panels A, B and D, “+” indicates w1118 mutant larvae. In panels A and D, αTub84B was used as an internal control. In panels B, C and E, Hoechst staining (blue) indicates nuclei, and scale bar: 10 μm. Fluorescence microscopy images were composed of multiple optical sections. Quantifications are shown in boxplots, *: p < 0.05, ***: p < 0.001, ns: not significant (for statistics, see the Materials and Methods section). Fat bodies were prepared from starved animals at the third instar feeding larval (L3F) stage
In fat body cells of starved animals, mutations in Mtmr6 led to an enhanced amount of mCherry-Atg8a-positive structures relative to the corresponding controls ( and S4A). A similar increase in the number of LTR-positive acidic structures (autolysosomes) was also observed in mutants defective for Mtmr6 ( and S5A). The rescuing construct Mtmr6rescue effectively restored the amount of LTR-positive structures in the Mtmr6LL mutant background to levels observed in control (). Similar to the mutant phenotype, Mtmr6 downregulation resulted in higher amounts of autophagic structures relative to control (, S4B, and S5B). In fat body samples obtained from starved control (w1118) animals, a subsequent TEM analysis also identified a relatively high number of autophagosomes and autolysosomes (). Mtmr6LL mutant fat body cells contained more autophagic structures, mainly containing degraded materials than control ones. Furthermore, Mtmr6LL mutation markedly decreased soluble ref(2)P protein levels () without affecting ref(2)P expression (Figure S5D). Mtmr6LL mutation also reduced the size of particles containing GFP-ref(2)P (). These results indicate that Mtmr6 deficiency leads to a significant increase in the autophagic degradation in larval fat body cells under starvation. This suggests that Mtmr6 inhibits starvation-induced autophagy in the model.
We also examined the amount of Atg8a-I and Atg8a-II protein forms in control versus Mtmr6 mutant genetic backgrounds under starvation conditions. The ratio of Atg8a-II and Atg8a-I levels was higher in Mtmr6 mutants, suggesting that Mtmr6 protein inhibits Atg8a lipidation in starved animals (). To test whether increased conjugation of Atg8a is accompanied by enhanced autophagosome formation, we analyzed clone cells downregulated for Mtmr6 in a Syx17 mutant genetic background, in which the fusion of autophagosomes to lysosomes is blocked [Citation46]. Mtmr6-RNAi clonal cells displayed increased amounts of autophagosomes relative to control cells (). We conclude that Mtmr6 prevents autophagosome formation during starvation. Furthermore, this effect of Mtmr6 seems to be independent of the induction complex because mutational inactivation of Mtmr6 did not change the hyperphosphorylated state of Atg13 (). We also monitored whether Mtmr6 is capable of modulating the amount of autophagy-related PtdIns3P-positive structures (phagophore membranes and autophagosomes). Mtmr6 deficiency was found to slightly increase the quantity of GFP-2xFYVE-positive structures in a Uvrag-RNAi genetic background, in which the PtdIns3K complex participating in endocytosis was specifically blocked (). Together, we propose that Mtmr6 lipid phosphatase acting at the vesicle nucleation stage prevents starvation-induced autophagy by interfering with PtdIns3P production in larval fat body cells.
Autophagic response to oxidative stress is inhibited by Mtmr6 but not EDTP
Besides starvation, autophagy can be upregulated under various adverse environmental conditions, such as oxidative stress and high temperatures [Citation53,Citation54]. Interestingly, different stress factors activate autophagy through distinct regulatory circuits. For example, oxidative stress, but not starvation, triggers autophagy through JNK (c-Jun N-terminal kinase) signaling [Citation55]. Data presented above show that EDTP does not influence, while Mtmr6 effectively represses, starvation-induced autophagy in the Drosophila larval fat body. To address whether EDTP and Mtmr6 modulate autophagic activity under other stress conditions, we treated animals with paraquat, which is a 1-methyl-4-phenyl-1,2,3,6-tetrahydropyridine (MPTP)-like compound causing the production of free oxygen radicals, potent inducers of autophagy in the fruit fly [Citation55]. Although EDTP overexpression inhibited the formation of mCherry-Atg8a-positive structures, which normally occurs in control cells in response to paraquat treatment, downregulation of the gene did not affect autophagic structure formation in treated animals (Figure S6A). Inhibiting Mtmr6, however, further increased the amount of such structures in fat body cells of treated animals (Figure S6A). To distinguish whether the increased level of mCherry-Atg8a-positive foci reflects an elevated autophagic flux or merely defects in the process at a later stage (e.g., at autophagosome-lysosome fusion or autolysosomal breakdown), the amount of GFP-ref(2)P-positive protein aggregates was identified. In Mtmr6LL and Mtmr6LL/Df778 mutant samples, there were significantly less GFP-ref(2)P-labeled structures relative to control (Figure S6B). We suggest that similar to what happens during starvation, oxidative stress-induced autophagy is repressed by Mtmr6, but independent of EDTP in the larval fat body.
Discussion
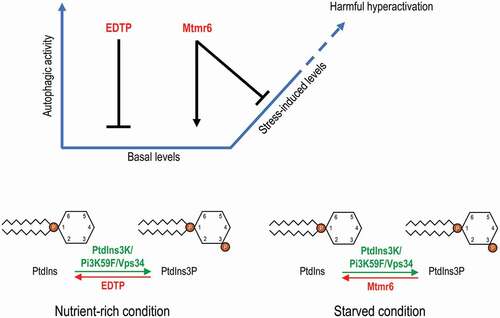
In this study, we investigated the regulatory role of two Drosophila myotubularin-related lipid phosphatases, EDTP and Mtmr6, in the autophagic process. Both nutrient-rich and starvation/oxidative stress-induced conditions were conducted for the analysis. We found that the two enzymes control autophagy in markedly different ways (). Their human orthologs, MTMR14 and MTMR6 to MTMR8, may also have complex, condition-dependent specific roles in autophagy control.
Figure 7. Model for the distinct regulation of autophagy by EDTP and Mtmr6. Under nutrient-rich condition, EDTP inhibits basal autophagy by antagonizing PtdIns3P production and suppressing autophagosome maturation. In contrast, Mtmr6 promotes autophagy in well-fed animals, affecting the process at a later stage. Under conditions of cellular stress, the autophagy flux is not altered by EDTP, but is markedly lowered by Mtmr6. Mtmr6 prevents the harmful hyperactivation of autophagy during stress by antagonizing PtdIns3K
In fat body cells of well-fed Drosophila larvae, both mutational inhibition and RNAi-mediated downregulation of EDTP enhanced autophagic activity (, S2A, S2B, S3A, and S3B). These genetic interventions also lowered cytoplasmic levels of ref(2)P serving as a substrate for autophagic degradation (). Based on these data, one can conclude that EDTP inhibits autophagy in the larval fat body under nutrient-rich conditions. EDTP suppresses autophagosome formation by antagonizing PtdIns3K/Pi3K59F/Vps34 and restricting maturation (). These results are consistent with previous findings observed for human and murine MTMR14; downregulation of these proteins has been reported to upregulate autophagic activity by enhancing autophagosome formation and/or maturation in human macrophages, HeLa cells, as well as in mouse neuro- and myoblasts, and embryonic fibroblasts [Citation34,Citation39]. Therefore, the inhibitory role of EDTP/MTMR14 lipid phosphatases in autophagy under nutrient-rich conditions appears to be evolutionarily conserved from insects to mammals.
In the fat body isolated from well-fed larvae, inactivation of Mtmr6 led to a moderate accumulation of early autophagic structures, but this change was not associated with increased amounts of acidic structures, predominantly autolysosomes (, S2A, S2B, S3A, and S3B). There were even fewer acidic compartments in mutant samples than in control ones (). Consistent with these data, both soluble and insoluble forms of ref(2)P displayed increased levels in Mtmr6 mutant backgrounds (), suggesting that Mtmr6 promotes autophagy under well-fed conditions. Moreover, the number, but not the size, of GFP-ref(2)P-positive protein aggregates was increased in samples defective for Mtmr6 (). It is worth noting that inactivating mutations in Atg genes enlarge both the size and amount of protein aggregates [Citation56]. Because Mtmr6 mutant cells contained early but not late autophagic structures, Mtmr6 affects basal autophagy at a later stage of the process, after autophagosome formation. This stage could be at the autophagosome-lysosome/endosome fusion, acidification of autolysosomes, transport of acidic hydrolases or reformation of autophagic lysosomes. Hence, EDTP and Mtmr6 lipid phosphatases have antagonistic roles in controlling basal autophagy; the former inhibits while the latter promotes the process. In addition, the two proteins affect autophagy at different stages; EDTP downregulates the process at vesicle nucleation, while Mtmr6 enhances it after autophagosome formation.
We showed that EDTP and Mtmr6-B are expressed in larval fat body cells under well-fed conditions, and their transcription becomes highly increased in response to amino acid withdrawal (, 2C’, 2D, and 2D’). In contrast with this observation, EDTP did not influence starvation-induced autophagy in fat body cells (, S4A, S4B, S5A, and S5B). EDTP proteins may be recruited to other compartments by (an) interaction partner(s) to modulate other processes during starvation. Such processes may include endocytosis, as it has been shown that certain MTMRs can localize to endocytic structures [Citation57], or phagocytosis through its potential interaction with Rab14 [Citation58]. Thus, in Drosophila fat body cells exposed to nutrient deprivation, the regulation of autophagy is largely independent of EDTP function. In mammals, however, MTMR14 has been suggested to repress the autophagic process under adverse conditions [Citation34]. It is possible that these MTMR14-related results were misspecified as a relatively short (only 2 h-long) regimen of amino acid depletion was examined during which the inhibitory effect of MTMR14 deficiency on basal autophagy was actually observed (i.e., this short starvation period applied to mammalian cells was not long enough to eliminate the effect of MTMR14 downregulation on basal autophagy). A longer period of treatment may be required for examining the net effect of MTMR14 deficiency on stress-induced autophagy. Indeed, we could previously observe increased levels of autophagic structures followed by 2 h of amino acid withdrawal [Citation41], but here found no evidence for autophagy induction when extending the treatment to 3–4 h (, 6A, 6D, S4A, S4B, S5A, and S5B). It is also possible that different mechanisms may operate in insects and mammals by which stress-induced autophagy is regulated; MTMR14, but not EDTP, is involved in the process.
Contrary to EDTP, Mtmr6 represses starvation- and oxidative stress-induced autophagy, since its deficiency led to a robust increase in the amount of autophagic structures, and lowered the amount of ref(2)P under these inducing conditions (, S4A, S4B, S5A, S5B, and S6). It is intriguing that another, recently published study on the role of Drosophila Mtmr6 in controlling autophagy has identified, contrary to what we found in this study, a promoting effect for the protein under starvation-induced conditions [Citation43]. The authors applied a newly generated null mutant allele and an RNAi construct that was not tested in our present work, and found that decreased Mtmr6 function results in autophagic vesicle accumulation in various cell types when animals were exposed to nutrient deprivation. The accumulation of autophagic vesicles was found to be due to abortive autolysosomal degradation. This result was however established by assessing a single RNAi construct only, the specificity of which was not verified by a rescuing experiment. Taken together, according to results presented in this study Mtmr6 is the first identified MTMR protein that has environment-dependent antagonistic roles in autophagy control. This issue raises an intriguing question about the molecular mechanisms by which Mtmr6 promotes basal autophagy but inhibits stress-induced autophagy in the Drosophila fat body. MTMRs are known to act not only as monomers but also as heterodimers with inactive family members. Interaction between a catalytically active MTMR and an inactive MTMR can alter the enzymatic activity, substrate preference and subcellular localization of the former [Citation3]. In humans, inactive MTMR9 is able to form heterodimers with active MTMR6, MTMR7 and MTMR8 lipid phosphatases, thereby influencing their features [Citation35]. The sole Drosophila counterpart of mammalian MTMR9 is an uncharacterized gene, CG5026. It is possible that Mtmr6 can interact with CG5026 in a context-dependent manner, thereby affecting distinct cellular phosphoinositide pools under nutrient-rich and stress-induced conditions. Furthermore, while only Mtmr6-B splice variant was active in the larval fat body of well-fed animals, starvation could also induce Mtmr6-A expression ( and D’). In Mtmr6LL mutants, the expression of both isoforms was affected. In addition, RNAi constructs we used interfered with each splice variant. Hence, one can argue that a pleiotropic phenotypic effect of the two Mtmr6 isoforms can be detected in mutant and RNAi-treated animals. Another possibility is that Mtmr6-B does not participate in the regulation of stress-induced autophagy, only Mtmr6-A attenuates the process. Further investigation should elicit splice variant-specific functions of Mtmr6. It is intriguing that Mtmr6 acts at the same stage of starvation-induced autophagy where EDTP does under nutrient-rich condition; downstream of the induction complex and upstream of Atg8a lipidation, likely at vesicle nucleation. Mtmr6 dephosphorylates PtdIns3P during starvation, while EDTP does the same during nutrient-rich conditions (). It is still unknown why EDTP does not participate in the control of stress-induced autophagy though it accumulates in fat body cells under starvation.
We observed that under normal, well-fed conditions, the life span of EDTP and Mtmr6 defective flies differ from each other. Downregulation of EDTP throughout adulthood promoted longevity while inhibiting Mtmr6 caused a short-lived phenotype (Figure S1C). Enhanced autophagic activity may be the underlying mechanism of life span extension in EDTP-RNAi flies, while decreased autophagic degradation may in turn contribute to life span shortening in Mtmr6 mutant and RNAi animals [Citation59]. In this study, we explored the regulatory effect of EDTP and Mtmr6 on autophagy in the fat body only. We assume that the two myotubularin-related lipid phosphatases have similar regulatory functions in other tissues and cell types in order to control aging in the above-described manner.
Defects in autophagy could also lead to an early death at different stages of development [Citation42]. Further research should explore whether the semi-lethal phenotype of EDTP and Mtmr6 mutant animals, and the abnormal wing phenotype of Mtmr6 mutants are related to their autophagic functions. Defective wing development in Mtmr6 mutant flies may be a consequence of compromised endocytosis as Mtmr6, like its nematode ortholog, is also involved in the endocytic process [Citation60], and the endocytosis-related PtdIns3K complex has been shown to be required for normal wing morphogenesis [Citation61].
In this work, we explored that two Drosophila Mtmr paralogs, EDTP and Mtmr6, execute distinct roles in autophagy control in the larval fat body. EDTP hampers basal autophagy, but does not influence starvation-induced autophagy. In contrast, Mtmr6 promotes basal autophagy, while represses stress (starvation and oxidative)-induced autophagic degradation. The latter function of Mtmr6 may protect the affected cells from undergoing death triggered by hyperactivated autophagy [Citation62]. Understanding better the complex regulation of autophagy in physiology and pathology also has a huge medical relevance. Defects in autophagy have been implicated in the pathomechanism of various human diseases [Citation63,Citation64]. Autophagy is thus becoming a promising drug target in current pharma research. Acting as negative regulators of autophagy, certain MTMRs are being targeted by small molecules in order to identify drug candidates with potent neuroprotective (and antiaging) effects [Citation40,Citation41,Citation65]. To explore the complex regulation of autophagy by different MTMR lipid phosphatases is therefore a particularly important and relevant issue in both cell biology and medicine.
Materials and methods
Fly stocks and culturing
Drosophila strain stocks were maintained on standard cornmeal-sugar-agar medium at 18–25°C, and experiments with flies were carried out at 25°C unless noted. Strains were obtained from the Bloomington Drosophila Stock Center (BDSC), Vienna Drosophila RNAi Center (VDRC) and Drosophila Genetic Resource Center, Kyoto (DGRC), or kindly provided by other researchers.
The following alleles were used (strain):
w1118 (BDSC 5905)
Oregon-R as wild-type (kindly provided by Rita Sinka, University of Szeged, Szeged, Hungary [Citation66])
Mtmr6KG01267 (BDSC 14,361)
w*; FRT40A, PBac{SAstopDsRed}Mtmr6LL02467, bw1 (outcrossed variant of DGRC 140,628)
EDTPMI08496 (BDSC 44,782)
EDTPEY22967 (BDSC 22,600)
Atg7Δ77 (as a gift of Gábor Juhász, ELTE Eötvös Loránd University, Budapest, Hungary [Citation67])
Syx17LL06330 (outcrossed variant of DGRC 140,948 was kindly provided by Szabolcs Takács and Gábor Juhász, ELTE Eötvös Loránd University, Budapest, Hungary [Citation46])
Df(2 R)BSC161 (BDSC 9596)
Df(2 R)BSC778 (BDSC 27,350)
Df(2 R)BSC661 (BDSC 26,513)
The following RNAi lines were used:
Mtmr6GD11001 (VDRC v26216)
UAS-Dcr-2, Mtmr6 GD11001 [UAS-Dcr-2 (II): BDSC 24,650]
Mtmr6JF01885 [BDSC 25,864, denoted as TRiP(V10)]
UAS-Dcr-2; Mtmr6JF01885 [UAS-Dcr-2 (II): BDSC 24,650]
EDTPGL01215 [BDSC 41,633, denoted as TRiP(V22)]
EDTPHMS01577 [BDSC 36,917, denoted as TRiP(V20)]
EDTPdsRNA (described in this study)
UvragHMS01577 [BDSC 36,917, denoted as TRiP(V20)]
GFP dsRNA.shRNA.UAS.V20.4 [on Chr. II: BDSC 41,552 denoted as TRiP(V20) (II), and on Chr. III: BDSC 41,553 denoted as TRiP(V20) (III)]
In overexpression experiments, the following strains were used:
EDTPGSV6 (DGRC 202,239)
hsFlp; UAS-HA-EDTP(/TM6B) [Citation41]
Others strains (either obtained from BDSC or provided by Gábor Juhász, ELTE Eötvös Loránd University, Budapest):
hsFlp; pAct<CD2< Gal4 UAS-nlsGFP [Citation42]
hsFlp; UAS-Dcr-2; Act<CD2< Gal4, UAS-nlsGFP [Citation42]
hsFlp; pAct<CD2< Gal4, UAS-nlsGFP, r4-mCherry-Atg8a [Citation56]
hsFlp; UAS-Dcr-2; Act<CD2< Gal4, UAS-nlsGFP, r4-mCherry-Atg8a [Citation56]
hsFLP; UAS-Dcr-2; r4-mCherry-Atg18a, Act<CD2< Gal4, UAS-nlsGFP [Citation68]
Act5C-Gal4 (BDSC 3954)
hs-GAL4 (BDSC 1799)
Cg-Gal4 (BDSC 7011)
UAS-GFP-2xFYVE (BDSC 42,712)
TubGFP-ref(2)P3−4M [Citation56]
Mtmr6rescue (described in this study)
In the case of EDTPMI08496 experiments, when mutants and controls were obtained from the F1 generation, the P generation was shifted from 25°C to 29°C 2–3 d before females laid eggs, and F1 animals were also kept at 29°C. During clonal RNAi and overexpression experiments, the larvae were kept at 29°C for 16–20 h before dissection.
Generation of EDTPdsRNA transgenic flies
pWizMod vector for RNAi experiments was generated by inserting the 1.2 kb long third intronic sequence of wg gene into pUAST plasmid [Citation69]. The UAS-EDTP-RNAi construct contains a PCR amplified 702 bp (2 R: 17,431,976 … 17,436,975) long fragment of the second exon of EDTP. The following primers were used for PCR amplification: forward: 5ʹ-cag atc tGC CAT GAA GTA TTT GAT TTT GCG G-3ʹ reverse: 5ʹ-cct cga gGG TAC CGG GAA ATG GAC TCT TCG G-3ʹ. The resulting fragment was inserted into a PCR cloning vector, Topo-TA (Thermo Fisher Scientific, 450,641). The fragment was subsequently transferred into pWizMod by BglII, XhoI double digestion. In an additional cloning step, the same insert was cut out from Topo-TA by KpnI, XbaI double digestion and inserted into the KpnI, XbaI sites of the intermediate plasmid, resulting in the desired inverted repeat arrangement. Microinjection of EDTPdsRNA into M{3xP3-RFP.attP}ZH-86Fb (with M{vas-int.Dm}ZH-2A) embryos was carried out by the ΦC31-based integration system [Citation70].
Generation of Mtmr6rescue transgenic flies
A Pacman BAC clone containing the Drosophila genomic sequence CH322-185K17 that overlaps with Mtmr6 (CG3530) [Citation71] was obtained from the BACPAC Resources Center, Children’s Hospital Oakland Research Institute. BAC DNA was purified by QIAGEN Large Construct Kit (QIAGEN, 12,462). The Drosophila genomic insert was verified by end-sequencing, making use of attB-Pacman-CmR-BW1 5ʹ-GAT GTG CTG CAA GGC GAT TAA GT-3ʹ and attB-Pacman-CmR-BW2 5ʹ-ATC GGC ATA GTA TAT CGG CAT AG-3ʹ sequencing primers. The verified CH322-185K17 BAC was injected into y1 M{3xP3-RFP.attP}ZH-2A w*; M{vas-int.Dm}ZH-102D recipient embryos, then stable homozygous transformant lines were established.
Treatments
74- to 92-h-old third instar larvae were used. Starvation was achieved by transferring larvae onto 20% sucrose solution for 3 h except for GFP-ref(2)P-related experiments, when we applied a 4 h-long treatment [Citation42]. Nutrient-rich/well-fed conditions were provided by using a medium containing 0.825 g cornmeal (Nett food [SPAR], 347,959,009), 0.405 g sucrose (Magyar Cukor Zrt [SPAR], 79,306,003), 0.585 g yeast (Saf-Instant ROUGE dried yeast; Lesaffre Ltd., ETT538-V1), 3 ml water 3 h prior to dissection. For inducing oxidative stress, larvae were placed into 50 mM paraquat (1,1ʹdimethyl-4-4ʹ-bipyridinium dichloride; Sigma-Aldrich, 180,858)-containing well-fed medium (described above) for 3 h before dissection except for ref(2)P-related experiments, where a 4-h-long treatment was applied. Paraquat concentration was selected within a range that was well tolerated by larvae.
Western blot analysis
Total proteins from Drosophila larval fat body cells (74–92 h) were extracted (~20 larvae per genotype or condition). Samples were homogenized in 40 μL 2x Laemmli Sample Buffer (Bio-Rad, 161–0737) and 40 μL Fly Lysis Buffer containing 1.0% Tween 20 (Bio-Rad, 170–6531), 50 mM Tris, pH 7.5, 150 mM NaCl, 1 mM EDTA, bidistilled water, and protease inhibitor (Sigma, 11,836,153,001). Twenty microliters were loaded for each sample and resolved on 4–20% gradient gels (Min-Protean, Bio-Rad, 456–1093). Membranes were probed with anti-EDTP (rat, 1:500 [Citation41]), anti-ref(2)P (rabbit, 1:2500 [Citation56]), anti-Atg13 (rat, 1:5000, diluted in 3% milk powder in TBST [Citation72]) and anti-Atg8a (rabbit, 1:2500 [Citation46,Citation72]) antibodies (gift from G. Juhász, ELTE Eötvös Loránd University, Budapest, Hungary). Anti-αTub84B (mouse, 1:2500, Sigma-Aldrich, T6199; or mouse, 1:2000 DSHB, AA4.3) was used as a loading control. For secondary staining, anti-rabbit IgG alkaline phosphatase (1:1000; Sigma-Aldrich, A3687), anti-rat IgG alkaline phosphatase (1:1000; Sigma-Aldrich, A8438) and anti-mouse IgG alkaline phosphatase (1:1000; Sigma-Aldrich, A5153) were applied. Proteins were visualized by using an NBT-BCIP solution (Sigma-Aldrich, 72,091). Two-six biological parallels were examined. Image Studio Lite 5.2 (Li-Cor Bioscience) and ImageJ 1.50i softwares were used to examine and evaluate data [Citation73].
Quantitative and semi-quantitative RT-PCR analysis
Fat bodies were dissected from ten-twenty L3F larvae (74–92 h) in PBS (Sigma-Aldrich, P4417), collected in TRI Reagent® solution (Zymo Research, R2050-1-50), and homogenized. RNA isolation was performed according to the Direct-zol™ RNA MiniPrep kit (Zymo Research, R2050) protocol, and we applied a DNase treatment. Reverse transcription was performed by using RevertAid First Strand cDNA Synthesis Kit (Thermo Fisher Scientific, K1621).
SYBR Green I-based real-time PCR was performed by a LightCycler® 96 Instrument (Roche). Real-time PCR was performed in 20-μL reactions containing 10 μL of 2x FastStart Essential DNA Green Master (Roche, 06402712001), 1 μl water (PCR Grade), 500 ng cDNA and pretested gene-specific primers into 96-well optical plates. Cycling conditions were performed at 95°C for 600 s, and at 95°C for 10 s, at 58°C for 10 s and at 72°C for 20 s 45 times. Product specificity was confirmed by melting curve analysis. Real-time efficiencies were calculated from the slopes of standard dilution curves. Ct values were normalized to the Gapdh curve. Results were quantified using the improved 2−ΔΔCT method [Citation74]. PCR experiments were performed in triplicates.
For semi-quantitative PCR, 100 ng of cDNA samples was used in a total reaction volume of 15 μL. PCR mix was composed of 1.5 μL 10x DreamTaq Green Buffer (Thermo Fisher Scientific, EP0712), 0.15 μL DreamTaqTM Green DNA Polymerase (Thermo Fisher Scientific, EP0712), 10 mM of each dNTP, and gene-specific oligonucleotide primers (5 μM).
For PCR experiments, the following primers were used. For Gapdh, forward: 5ʹ-AAA AAG CTC CGG GAA AAG G-3ʹ, reverse: 5ʹ-AAT TCC GAT CTT CGA CAT GGC-3ʹ; for Mtmr6-A, forward: 5ʹ-ATC GAG GAG GAG TTC AAC GA-3ʹ, reverse: 5ʹ-CCG TGG GAT TTT TGG TAT TG-3ʹ; for Mtmr6-B, forward: 5ʹ-ACG AAA TAA AGC TCG CCA AG-3ʹ, reverse: 5ʹ-CAA GGG AAG CTT CTC AAT GC-3ʹ; for Mtmr6-C, forward: 5ʹ-CGG TTG AGT GGG GAA AAG T-3ʹ and 5ʹ-GAG GAA GAC AGC GGT TGA GT-3ʹ, reverse: 5ʹ-CAA GGG AAG CTT CTC AAT GC-3ʹ; for EDTP qPCR, forward: 5ʹ-GGG CTG TGA GTT CTT CAA AAA G-3ʹ, reverse: 5ʹ-GGG AAT GTT GAT ATT CGC ATC G-3ʹ; for EDTP sqPCR, forward: 5ʹ-TAC TTC ATG GCC GTT TCC TC-3ʹ, reverse: 5ʹ-AGA TCC CAA TCC CGG TAC TC-3ʹ; for ref(2)P, forward 5ʹ-TGG ATC GAC GCT GAT AAA GAT G-3ʹ, reverse: 5ʹ-TGG TGA AAT TGC TCG GAT CG-3ʹ. In each PCR experiment, appropriate positive and negative controls were included to verify the results, and to avoid false-positive signals due to contamination.
Dissection and fluorescent microscopy of Drosophila larval fat body samples
Preparation of larval fat bodies (74–92 h) was carried out in PBS (Sigma-Aldrich, P4417) solution. In the case of LysoTracker Red (Life Technologies, L7528) staining, 1:1000 dilution was used for 2 min [Citation41]. Samples were washed once with PBS, and incubated 2x in PBS (for 2.5 min). Covering was achieved in glycerin (Sigma, G2289)-PBS (4:1) solution containing Hoechst 33,342 (Molecular Probes, H-1399) at 10 mM final concentration.
Microscopy was performed with a Zeiss AxioImager Z1 epifluorescence microscope equipped with an ApoTome semiconfocal setup (objective Plan-NeoFluar 40 × 0.75 NA). Images were analyzed using AxioVision 4.82 and ImageJ 1.50i software [Citation73].
Electron microscopy
Ultrastructural analysis of fat bodies was essentially performed as described previously [Citation9]. Samples were fixed overnight and embedded on Durcupan/Fluca, as described in the manufacturer’s protocol (Sigma-Aldrich, 44,610–1EA). 70 nm sections were stained in Reynold’s lead citrate, and viewed on a transmission electron microscope (JEOL, JEM-1011, ELTE Eötvös Loránd University, Budapest) equipped with a Morada digital camera (Olympus), using iTEM software (Olympus).
Life span assays
Assays were started with newly emerged male and female imago (day 0) placed into glass vials (ten male and ten female animals per vial). Flies were transferred into new vials (containing fresh media) every second day. The number of dead animals was counted daily. Experiments were carried out at 32°C. For data representation, the Kaplan-Meier method was used [Citation75], and for statistical analysis log-rank (Mantel-Cox) test was applied in SPSS 17.0 program and we performed Mann Whitney U test or Kruskal Wallis test for the evaluation of mean life spans in SPSS 22.0.
Determination of animal viability and lethal phase
The period from egg-laying until eclosion was examined, and the number of alive and dead animals was counted in each developmental stage (embryonic, larval, pupal, adult).
Data visualization and statistical analysis
Results are presented in box plots. Lines, boxes, and whiskers represent median values, 25th–75th percentiles and 10th–90th percentiles, respectively. Statistics for fluorescent microscopic images, PCR and western blot results were calculated by RStudio (Version 1.1.463). Lilliefors test was used to know whether the distribution of samples examined is normal or not. If it was normal, F test was performed to compare 2 variances in case of independent samples. If variances were homogeneous/equal, a two-sample Student’s t-test was used, and a t-test for unequal variances (also called the Welch’s t-test) was applied. If the distribution of a sample was not normal, Mann-Whitney U-test was performed. In case of paired samples, paired t-test was applied for normal distribution; otherwise, Wilcoxon signed-rank test was used. Bonferroni correction was applied when it was necessary.
Supplemental Material
Download Zip (4.3 MB)Acknowledgments
This work was supported by the grants OTKA (Hungarian Scientific Research Fund) K109349 to T.V., MEDinPROT Protein Science Research Synergy Program (provided by the Hungarian Academy of Sciences) to T.V., GINOP-2.3.2-15-2016-00032 and GINOP-2.3.2.-15-2016-00001 (from the National Research, Development and Innovation Office) to M.E., VEKOP (VEKOP-2.3.2-16-2017-00014) to T.V. was supported by the European Union and the State of Hungary, co-financed by the European Regional Development Fund. A.M., V.B. and T.V. were supported by the MTA-ELTE Genetics Research Group (01062). This work was also supported by the ÚNKP-20-4 New National Excellence Program of the Ministry for Innovation and Technology from the source of the National Research, Development and Innovation Fund to V.B. This work was completed in the ELTE Institutional Excellence Program and in the ELTE Thematic Excellence Program 2020 Supported by National Research, Development and Innovation Office (NKFIH-1157-8/2019-DT and TKP2020-IKA-05, respectively), and in the ELTE Thematic Excellence Programme (Szint+) supported by the Hungarian Ministry for Innovation and Technology. Some Drosophila stocks were obtained from the Bloomington Drosophila Stock Center (NIH P40OD018537) and Vienna Drosophila Resource Center (VDRC, www.vdrc.at). Other Drosophila strains and reagents were kindly provided by Gábor Juhász (ELTE Eötvös Loránd University, Budapest, Hungary). The authors also thank Beatrix Supauer, Erzsébet Gatyás, Regina Preisinger, Tünde Pénzes, Gabriella Szabados, Judit Botond and Sára Simon for excellent technical assistance.
Disclosure statement
No potential conflict of interest was reported by the authors.
Supplementary material
Supplemental data for this article can be accessed here.
Additional information
Funding
Related Research Data
References
- Robinson FL, Dixon JE. Myotubularin phosphatases: policing 3-phosphoinositides. Trends Cell Biol. 2006 Aug;16(8):403–412.
- Alonso A, Sasin J, Bottini N, et al. Protein tyrosine phosphatases in the human genome. Cell. 2004 Jun 11 117;(6):699–711.
- Raess MA, Friant S, Cowling BS, et al. WANTED - Dead or alive: myotubularins, a large disease-associated protein family. Adv Biol Regul. 2017 Jan;63:49–58.
- Laporte J, Hu LJ, Kretz C, et al. A gene mutated in X-linked myotubular myopathy defines a new putative tyrosine phosphatase family conserved in yeast. Nature Genet. 1996 Jun 13;(2):175–182.
- Laporte J, Bedez F, Bolino A, et al. Myotubularins, a large disease-associated family of cooperating catalytically active and inactive phosphoinositides phosphatases. Hum Mol Genet. 12(2): Spec No. R285–92. 2003 Oct 15.
- Hnia K, Vaccari I, Bolino A, et al. Myotubularin phosphoinositide phosphatases: cellular functions and disease pathophysiology. Trend Molecul Med. 2012 Jun;18:(6)317–327.
- Dall’Armi C, Devereaux KA, Di Paolo G. The role of lipids in the control of autophagy. Curr Biol. 2013 Jan 7;23(1):R33–45.
- Martens S, Nakamura S, Yoshimori T. Phospholipids in Autophagosome Formation and Fusion. J Mol Biol. 2016 Oct;428:4819–4827.
- Billes V, Kovacs T, Manzeger A, et al. Developmentally regulated autophagy is required for eye formation in Drosophila. Autophagy. 2018;14(9):1499–1519.
- Fodor E, Sigmond T, Ari E, et al. Methods to Study Autophagy in Zebrafish. Methods Enzymol. 2017;588:467–496.
- Sigmond T, Barna J, Toth ML, et al. Autophagy in Caenorhabditis elegans. Methods Enzymol. 2008;451:521–540.
- Varga M, Fodor E, Vellai T. Autophagy in zebrafish. Methods. 2015 Mar;75:172–180.
- Vellai T, Takacs-Vellai K. Regulation of protein turnover by longevity pathways. Adv Exp Med Biol. 2010;694:69–80.
- Takacs-Vellai K, Bayci A, Vellai T. Autophagy in neuronal cell loss: a road to death. Bioessays 2006 Nov;28(11):1126–1131.
- Feng Y, He D, Yao Z, et al. The machinery of macroautophagy. Cell Res. 2014 Jan;24(1):24–41.
- Meijer WH, Van Der Klei IJ, Veenhuis M, et al. ATG genes involved in non-selective autophagy are conserved from yeast to man, but the selective Cvt and pexophagy pathways also require organism-specific genes. Autophagy. 2007 Mar-Apr;3(2):106–116.
- Gillooly DJ, Morrow IC, Lindsay M, et al. Localization of phosphatidylinositol 3-phosphate in yeast and mammalian cells. Embo J. 2000 Sep 1;19(17):4577–4588.
- Petiot A, Ogier-Denis E, Blommaart EF, et al. Distinct classes of phosphatidylinositol 3ʹ-kinases are involved in signaling pathways that control macroautophagy in HT-29 cells. J Biol Chem. 2000 Jan 14;275(2):992–998.
- Roggo L, Bernard V, Kovacs AL, et al. Membrane transport in Caenorhabditis elegans: an essential role for VPS34 at the nuclear membrane. Embo J. 2002 Apr 2;21(7):1673–1683.
- Wucherpfennig T, Wilsch-Brauninger M, Gonzalez-Gaitan M. Role of Drosophila Rab5 during endosomal trafficking at the synapse and evoked neurotransmitter release. J Cell Biol. 2003 May 12;161(3):609–624.
- Gary JD, Wurmser AE, Bonangelino CJ, et al. Fab1p is essential for PtdIns(3)P 5-kinase activity and the maintenance of vacuolar size and membrane homeostasis. J Cell Biol. 1998 Oct 5;143(1):65–79.
- Nicot AS, Fares H, Payrastre B. The Phosphoinositide Kinase PIKfyve/Fab1p Regulates Terminal Lysosome Maturation in Caenorhabditis elegans? Mol Biol Cell. 2006;17(7):3062–3074.
- Rusten TE, Vaccari T, Lindmo K, et al. ESCRTs and Fab1 regulate distinct steps of autophagy. Curr Biol. 2007 Oct 23;17(20):1817–1825.
- Ferguson CJ, Lenk GM, Meisler MH. Defective autophagy in neurons and astrocytes from mice deficient in PI(3,5)P2. Hum Mol Genet. 2009 Dec 15;18(24):4868–4878.
- Vicinanza M, Korolchuk VI, Ashkenazi A, et al. PI(5)P Regulates Autophagosome Biogenesis. Mol Cell. 2015 Jan 22;57(2):219–234.
- Vergne I, Deretic V. The role of PI3P phosphatases in the regulation of autophagy. FEBS Lett. 2010 Apr 2;584(7):1313–1318.
- Al-Qusairi L, Prokic I, Amoasii L, et al. Lack of myotubularin (MTM1) leads to muscle hypotrophy through unbalanced regulation of the autophagy and ubiquitin-proteasome pathways. Faseb J. 2013 Aug 27;(8):3384–3394.
- Dowling JJ, Low SE, Busta AS, et al. Zebrafish MTMR14 is required for excitation-contraction coupling, developmental motor function and the regulation of autophagy. Hum Mol Genet. 2010 Jul 1;19(13):2668–2681.
- Hao F, Itoh T, Morita E, et al. The PtdIns3-phosphatase MTMR3 interacts with mTORC1 and suppresses its activity. FEBS Lett. 2016 Jan;590(1):161–173.
- Taguchi-Atarashi N, Hamasaki M, Matsunaga K, et al. Modulation of local PtdIns3P levels by the PI phosphatase MTMR3 regulates constitutive autophagy. Traffic. 2010 Apr;11(4):468–478.
- Velichkova M, Juan J, Kadandale P, et al. Drosophila Mtm and class II PI3K coregulate a PI(3)P pool with cortical and endolysosomal functions. J Cell Biol. 2010 Aug 9;190(3):407–425.
- Yu X, Ma J, Lin F, et al. Myotubularin family phosphatase ceMTM3 is required for muscle maintenance by preventing excessive autophagy in Caenorhabditis elegans. BMC Cell Biol. 2012;13(1):28.
- Wu Y, Cheng S, Zhao H, et al. PI3P phosphatase activity is required for autophagosome maturation and autolysosome formation. EMBO Rep. 2014 Aug;15(9):14.
- Vergne I, Roberts E, Elmaoued RA, et al. Control of autophagy initiation by phosphoinositide 3-phosphatase Jumpy. Embo J. 2009 Aug 5;28(15):2244–2258.
- Zou J, Majerus PW, Wilson DB, et al. The role of myotubularin-related phosphatases in the control of autophagy and programmed cell death. Adv Biol Regul. 2012 Jan;52(1):282–289.
- Weidner P, Sohn M, Gutting T, et al. Myotubularin-related protein 7 inhibits insulin signaling in colorectal cancer. Oncotarget. 2016 Aug 02;7(31):50490–50506.
- Jean S, Cox S, Nassari S, et al. Starvation-induced MTMR13 and RAB21 activity regulates VAMP8 to promote autophagosome-lysosome fusion. EMBO Rep. 2015 Feb;16(3):3.
- Hnia K, Kretz C, Amoasii L, et al. Primary T-tubule and autophagy defects in the phosphoinositide phosphatase Jumpy/MTMR14 knockout mice muscle. Adv Biol Regul. 2012 Jan;52(1):98–107.
- Liu J, Lv Y, Liu QH, et al. Deficiency of MTMR14 promotes autophagy and proliferation of mouse embryonic fibroblasts. Mol Cell Biochem. 13. 2014 Mar;392(1–2):31–37.
- Kovács T, Billes V, Komlós M, et al. The small molecule AUTEN-99 (autophagy enhancer-99) prevents the progression of neurodegenerative symptoms. Sci Rep. 2017 Feb 16;7(1):42014.
- Papp D, Kovács T, Billes V, et al. AUTEN-67, an autophagy-enhancing drug candidate with potent antiaging and neuroprotective effects. Autophagy. 2016 Feb;12(2):273–286.
- Scott RC, Schuldiner O, Neufeld TP. Role and regulation of starvation-induced autophagy in the Drosophila fat body. Dev Cell. 2004 Aug;7(2):167–178.
- Allen EA, Amato C, Fortier TM, et al. A conserved myotubularin-related phosphatase regulates autophagy by maintaining autophagic flux. J Cell Biol. 2020 Nov 2;219(11):11.
- Mauvezin C, Ayala C, Braden CR, et al. Assays to monitor autophagy in Drosophila. Methods. 2014 Mar 22;68(1):134–139.
- Klionsky DJ, Abdelmohsen K, Abe A, et al. Guidelines for the use and interpretation of assays for monitoring autophagy (3rd edition). Autophagy. 2016;12(1):1–222.
- Takáts S, Nagy P, Á V, et al. Autophagosomal Syntaxin17-dependent lysosomal degradation maintains neuronal function in Drosophila. J Cell Biol. 2013 May 13;201(4):531–539.
- Jiang P, Nishimura T, Sakamaki Y, et al. The HOPS complex mediates autophagosome-lysosome fusion through interaction with syntaxin 17. Mol Biol Cell. 2014 Apr;25(8):1327–1337.
- Chang YY, Neufeld TP. An Atg1/Atg13 complex with multiple roles in TOR-mediated autophagy regulation. Mol Biol Cell. 2009 Apr;20(7):2004–2014.
- Nascimbeni AC, Codogno P, Morel E. Local detection of PtdIns3P at autophagosome biogenesis membrane platforms. Autophagy. 2017 Sep 2;13(9):1602–1612.
- Itakura E, Kishi C, Inoue K, et al. Beclin 1 forms two distinct phosphatidylinositol 3-kinase complexes with mammalian Atg14 and UVRAG. Mol Biol Cell. 2008 Dec;19(12):5360–5372.
- Hegedűs K, Takáts S, Boda A, et al. The Ccz1-Mon1-Rab7 module and Rab5 control distinct steps of autophagy. Mol Biol Cell. 2016 Oct 15;27(20):3132–3142.
- Rabinowitz JD, White E. Autophagy and metabolism. Science. 2010 Dec 03;330(6009):1344–1348.
- Chen Y, Azad MB, Gibson SB. Superoxide is the major reactive oxygen species regulating autophagy. Cell Death Diff. 2009 Jul;16(7):1040–1052.
- Nivon M, Richet E, Codogno P, et al. Autophagy activation by NFkappaB is essential for cell survival after heat shock. Autophagy. 2009 Aug 5;(6)766–783.
- Wu H, Wang MC, Bohmann D. JNK protects Drosophila from oxidative stress by trancriptionally activating autophagy. Mech Dev. 2009 Aug-Sep;126(8–9):624–637.
- Pircs K, Nagy P, Varga A, et al. Advantages and limitations of different p62-based assays for estimating autophagic activity in Drosophila. PloS One. 2012;7(8):e44214.
- Cao C, Backer JM, Laporte J, et al. Sequential actions of myotubularin lipid phosphatases regulate endosomal PI(3)P and growth factor receptor trafficking. Mol Biol Cell. 2008 Aug;19(8):3334–3346.
- Gillingham AK, Sinka R, Torres IL, et al. Toward a comprehensive map of the effectors of rab GTPases. Dev Cell. 2014 Nov 10;31(3):358–373.
- Vellai T, Takacs-Vellai K, Sass M, et al. The regulation of aging: does autophagy underlie longevity? Trends Cell Biol. 2009 Oct;19(10):487–494.
- Maekawa M, Terasaka S, Mochizuki Y, et al. Sequential breakdown of 3-phosphorylated phosphoinositides is essential for the completion of macropinocytosis. Proc Natl Acad Sci U S A. 2014 Mar 18;111(11):E978–87.
- Lőrincz P, Lakatos Z, Maruzs T, et al. Atg6/UVRAG/Vps34-containing lipid kinase complex is required for receptor downregulation through endolysosomal degradation and epithelial polarity during Drosophila wing development. Biol Med Res Int. 2014;2014:851349.
- Erdélyi P, Borsos E, Takács-Vellai K, et al. Shared developmental roles and transcriptional control of autophagy and apoptosis in Caenorhabditis elegans. J Cell Sci. 2011 May 1;124(Pt 9):1510–1518.
- Mizushima N, Levine B, Cuervo AM, et al. Autophagy fights disease through cellular self-digestion. Nature. 2008 Feb 28;451(7182):1069–1075.
- Towers CG, Thorburn A. Therapeutic Targeting of Autophagy. EBioMedicine. 2016 Dec;14:15–23.
- Billes V, Kovács T, Hotzi B, et al. AUTEN-67 (Autophagy Enhancer-67) Hampers the Progression of Neurodegenerative Symptoms in a Drosophila model of Huntington’s Disease. J Huntington’s Dis. 2016 May 07 5;(2)133–147.
- Vedelek V, Laurinyecz B, Kovács AL, et al. Testis-Specific Bb8 Is Essential in the Development of Spermatid Mitochondria. PloS One. 2016;11(8):e0161289.
- Juhász G, Érdi B, Sass M, et al. Atg7-dependent autophagy promotes neuronal health, stress tolerance, and longevity but is dispensable for metamorphosis in Drosophila. Genes Dev. 2007 Dec 1 21;(23)3061–3066.
- Nagy P, Hegedűs K, Pircs K, et al. Different effects of Atg2 and Atg18 mutations on Atg8a and Atg9 trafficking during starvation in Drosophila. FEBS Lett. 2013 Dec 588;(3)24.
- Brand AH, Perrimon N. Targeted gene expression as a means of altering cell fates and generating dominant phenotypes. Development. 1993 Jun;118(2):401–415.
- Bischof J, Maeda RK, Hediger M, et al. An optimized transgenesis system for Drosophila using germ-line-specific phiC31 integrases. Proc Natl Acad Sci U S A. 2007 Feb 27;104(9):3312–3317.
- Venken KJ, Carlson JW, Schulze KL, et al. Versatile P[acman] BAC libraries for transgenesis studies in Drosophila melanogaster. Nat Methods. 2009 Jun;6(6):431–434.
- Nagy P, Karpati M, Varga A, et al. Atg17/FIP200 localizes to perilysosomal Ref(2)P aggregates and promotes autophagy by activation of Atg1 in Drosophila. Autophagy. 2014 Jan 6;10(3):3.
- Schneider CA, Rasband WS, Eliceiri KWNIH. Image to ImageJ: 25 years of image analysis. Nat Methods. 2012 Jul;9(7):671–675.
- Rao X, Huang X, Zhou Z, et al. An improvement of the 2ˆ(-delta delta CT) method for quantitative real-time polymerase chain reaction data analysis. Biostat Bioinforma Biomath. [2013 Aug];3(3):71–85.
- Bland JM, Altman DG. Survival probabilities (the Kaplan-Meier method). BMJ (Clin Res Ed). 1998 Dec 5;317(7172):1572.