
ABSTRACT
CREG1 (cellular repressor of E1A-stimulated genes 1) is involved in tissue homeostasis and influences macroautophagy/autophagy to protect cardiovascular function. However, the physiological and pathological role of CREG1 in the skeletal muscle is not clear. Here, we established a skeletal muscle-specific creg1 knockout mouse model (creg1;Ckm-Cre) by crossing the Creg1-floxed mice (Creg1fl/fl) with a transgenic line expressing Cre recombinase under the muscle-specific Ckm (creatine kinase, muscle) promoter. In creg1;Ckm-Cre mice, the exercise time to exhaustion and running distance were significantly reduced compared to Creg1fl/fl mice at the age of 9 months. In addition, the administration of recombinant (re)CREG1 protein improved the motor function of 9-month-old creg1;Ckm-Cre mice. Moreover, electron microscopy images of 9-month-old creg1;Ckm-Cre mice showed that the mitochondrial quality and quantity were abnormal and associated with increased levels of PINK1 (PTEN induced putative kinase 1) and PRKN/PARKIN (parkin RBR E3 ubiquitin protein ligase) but reduced levels of the mitochondrial proteins PTGS2/COX2, COX4I1/COX4, and TOMM20. These results suggested that CREG1 deficiency accelerated the induction of mitophagy in the skeletal muscle. Mechanistically, gain-and loss-of-function mutations of Creg1 altered mitochondrial morphology and function, impairing mitophagy in C2C12 cells. Furthermore, HSPD1/HSP60 (heat shock protein 1) (401–573 aa) interacted with CREG1 (130–220 aa) to antagonize the degradation of CREG1 and was involved in the regulation of mitophagy. This was the first time to demonstrate that CREG1 localized to the mitochondria and played an important role in mitophagy modulation that determined skeletal muscle wasting during the growth process or disease conditions.
Abbreviations: CCCP: carbonyl cyanide m-chlorophenylhydrazone; CKM: creatine kinase, muscle; COX4I1/COX4: cytochrome c oxidase subunit 4I1; CREG1: cellular repressor of E1A-stimulated genes 1; DMEM: dulbecco’s modified eagle medium; DNM1L/DRP1: dynamin 1-like; FCCP: carbonyl cyanide p-trifluoro-methoxy phenyl-hydrazone; HSPD1/HSP60: heat shock protein 1 (chaperonin); IP: immunoprecipitation; MAP1LC3B/LC3B: microtubule-associated protein 1 light chain 3 beta; MFF: mitochondrial fission factor; MFN2: mitofusin 2; MYH1/MHC-I: myosin, heavy polypeptide 1, skeletal muscle, adult; OCR: oxygen consumption rate; OPA1: OPA1, mitochondrial dynamin like GTPase; PINK1: PTEN induced putative kinase 1; PPARGC1A/PGC-1α: peroxisome proliferative activated receptor, gamma, coactivator 1 alpha; PRKN/PARKIN: parkin RBR E3 ubiquitin protein ligase; PTGS2/COX2: prostaglandin-endoperoxide synthase 2; RFP: red fluorescent protein; RT-qPCR: real-time quantitative PCR; SQSTM1/p62: sequestosome 1; TFAM: transcription factor A, mitochondrial; TOMM20: translocase of outer mitochondrial membrane 20; VDAC: voltage-dependent anion channel.
Introduction
The skeletal muscle constitutes approximately 50% of body mass in healthy and lean individuals. It plays a critical determinant role in metabolic homeostasis and whole-body energy expenditure. Loss of muscle mass or strength due to aging or diseases may result in decreased physical activity and elevated risks for cardiovascular diseases, type 2 diabetes mellitus (T2DM), and cancer [Citation1–3]. Conversely, maintaining skeletal muscle mass might be effective in the prevention and treatment of T2DM, cardiovascular diseases and cancer/cachexia [Citation4–6]. However, the precise molecular mechanisms underlying the effects of skeletal muscle damage are not clear.
Earlier studies on the ablation of skeletal muscles have focused on overstimulation of the ubiquitin-proteasome pathway, which promotes the loss of myofibrillar proteins [Citation7,Citation8]. Recently, extensive studies have revealed that mitochondria-mediated macroautophagy/autophagy, also known as mitophagy, is essential in maintaining myofiber homeostasis under physiological or pathological conditions and supports skeletal muscle plasticity [Citation9–11]. In addition, mitophagy plays a critical role in maintaining skeletal muscle mass via tightly regulated mitochondrial biogenesis turnover and reduction of abnormal proteins, which accumulate in response to chronic exercise, disuse, aging, and disease [Citation12–15]. However, excessive mitophagy flux appears to be detrimental to the skeletal muscle. In contrast, deficient mitophagy initiates myopathies due to accumulation of dysfunctional mitochondria and myofibrillar proteins. Elucidation of the exact mechanism underlying the modulation of mitophagy in the physiology and pathology of the skeletal muscle might allow us to control its wasting and develop new therapeutic approaches.
CREG1 (cellular repressor of E1A-stimulated genes 1) is a protein involved in cellular differentiation and regulation of homeostasis. It acts by antagonizing transcriptional activation and cellular transformation induced by the adenovirus E1A oncoprotein [Citation16]. Previous studies have shown that CREG1 is highly expressed in differentiated and mature tissue and cells, such as differentiated smooth muscle cells and mature cardiomyocytes, but expressed less in immature cells, such as embryonic stem cells and tumor cells [Citation17–19]. Several studies have revealed that CREG1 is a senescence-related protein, and its expression is reduced with age due to high methylation in its gene promoter region [Citation20]. A recent study has indicated that CREG1 might be a lysosomal protein [Citation21] that improves cardiomyocyte autophagy to maintain cardiac function in both angiotensin II–induced heart fibrosis and ischemia-reperfusion injury [Citation22,Citation23]. Since autophagy plays a crucial role in skeletal muscle homeostasis, understanding its dysfunction in the pathogenesis of different diseases is critical to develop new therapies against muscle damage and abnormalities. However, the physiological and pathological role of CREG1 in the skeletal muscle has not yet been investigated from the perspective of its homeostasis regulating function. In this study, we constructed a skeletal muscle-specific knockout creg1 mice model to examine CREG1 mediated modulation of skeletal muscle homeostasis and investigate the underlying molecular mechanism, both in vivo and in vitro.
Results
Generation of skeletal muscle specific Creg1 knockout mice
To explore the role of CREG1 in muscle function, we generated a muscle-specific creg1 knockout mouse (creg1;Ckm-Cre). Creg1-floxed mice (Creg1fl/fl) were crossed with a transgenic line expressing Cre recombinase under the muscle-specific Ckm (creatine kinase, muscle) promoter, whose expression began during embryogenesis (Fig. S1A). The effective ablation of the floxed sequence in genomic DNA was confirmed by PCR genotyping (Fig. S1B). Quantitative real-time PCR (RT-PCR, Fig. S1C and S1D) and western blotting (Fig. S1E and S1F) revealed efficient reduction of Creg1 transcripts and protein levels in some tissues (heart, liver and spleen, et al) and several hind limb skeletal muscles, including the soleus, extensor digitorum longus (EDL), peroneus, tibialis anterior (TA), gastrocnemius, and quadriceps. Meanwhile, the expression of CREG1 was reduced to half that in heart tissue from creg1;Ckm-Cre mice compared to Creg1fl/fl mice (Fig. S1G and S1H).
Lack of CREG1 reduced the capacity of endurance exercise in the skeletal muscle in 9-month-old mice
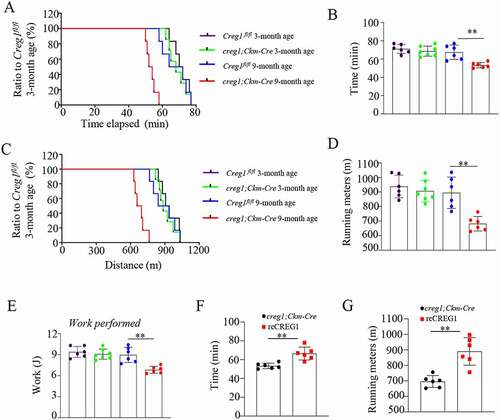
Using a treadmill exhaustion test [Citation24,Citation25], we estimated the capacity for exercise endurance in Creg1fl/fl and creg1;Ckm-Cre mice. Interestingly, the exercise time to exhaustion ( and ) and running distance ( and ) of creg1;Ckm-Cre mice was significantly shorter than those of Creg1fl/fl mice at age 9 months, but not at age 3 months. In contrast, mice with CREG1 deficiency in the skeletal muscle performed 25% less work than 9-month-old Creg1fl/fl mice aged (). The results indicate that the lack of CREG1 in the skeletal muscle could reduce the anti-fatigue capacity in endurance exercise in 9-month-old mice.
Figure 1. Lack of CREG1 remarkedly reduced in endurance performance in 9-month-old mice. (A and E) Exercise performance was assessed in age-matched Creg1fl/fl and creg1;Ckm-Cre mice by performing a treadmill exhaustion test. Time to exhaustion (A) and corresponding quantitative analysis (B); running distance (C) and corresponding quantitative analysis (D); and work (E) performed during the test. (Creg1fl/fl 3-month-old: n = 6, creg1;Ckm-Cre 3-month-old age: n = 7, Creg1fl/fl 9-month-old: n = 6, creg1;Ckm-Cre 9-month-old age: n = 6). (F and G) Exercise performance was also assessed in 9-month-old creg1;Ckm-Cre and reCREG1-treated mice by performing a treadmill exhaustion test. Quantitative analysis of time to exhaustion (F). Quantitative analysis of running distance (n = 6) (G). Data are shown as mean ± SEM, **p < 0.01. Creg1fl/fl: mice bearing Creg1-floxed alleles; creg1;Ckm-Cre: skeletal muscle-specific knockout creg1 mice; reCREG1: treated with recombinant CREG1 protein
Recovery of CREG1 expression rescued the exercise capacity in creg1;Ckm-Cre mice
To elucidate whether CREG1 could modulate the endurance of exercise, we administered an infusion of recombinant (re)CREG1 protein (reCREG1, 1 mg/kg•d) for 3 d in 9-month-old creg1;Ckm-Cre mice, as reported previously [Citation26]. Both western blotting (Fig. S2A and S2B) and immunofluorescent staining (Fig. S2C) showed that reCREG1 infusion clearly increased the expression of CREG1 in the skeletal muscle of 9-month-old creg1;Ckm-Cre mice compared to a control group treated with only vehicle (saline). As expected, the potential for physical exercise, including the exercise time to exhaustion () and running distance () also improved in mice with reCREG1 treatment compared to that in control mice treated with saline. These results confirm that CREG1 regulates the potential for exercise capacity in the skeletal muscle.
CREG1 regulated the exercise capacity independent of heart function
Because Ckm is partly expressed in cardiomyocytes, we examined whether the reduction of exercise capacity was due to heart dysfunction. Using micro-ultrasound, we showed that no difference in heart function, including EF and FS values in Creg1fl/fl and creg1;Ckm-Cre, either in 3- or 9-month-old mice, before or after endurance exercise. However, the EF and FS values of each group did not increase significantly after exercise (Fig. S3A-D). These results suggest that the impairment of exercise capacity induced by the lack of CREG1 is independent of heart function.
CREG1 ablation reduced the distribution of type I fiber in the skeletal muscle in 9-month-old creg1;Ckm-Cre mice
We further investigated whether CREG1 could modulate the morphology and distribution of different fiber types in the skeletal muscle. H&E staining, RT-PCR and immunohistochemical staining revealed that there were no obvious changes in the expression and distribution of type I or type II fibers in the skeletal muscle of Creg1fl/fl and creg1;Ckm-Cre mice at 3-month-old (Fig. S4A-F). However, with 9-month-old creg1;Ckm-Cre mice, we found a reduction of type I fiber size both in the soleus and gastrocnemius, not see in Creg1fl/fl mice ( and ). Moreover, RT-PCR analysis also highlighted that the expression of the Myh1/Mhc-I isoform was markedly reduced in the gastrocnemius from 9-month-old creg1;Ckm-Cre mice but not Creg1fl/fl mice. In contrast, the expression of the Myh2/Mhc2a isoform was significantly higher, while Myh4/Mhc2b isoform did not change, in 9-month-old creg1;Ckm-Cre mice compared to Creg1fl/fl mice (). This suggests that CREG1 deficiency primarily could decrease type I fiber in skeletal muscles of 9-month-old creg1;Ckm-Cre mice.
Figure 2. Creg1 ablation reduced the distribution of type I fiber and modulated the skeletal muscle mitochondrial morphology in 9-month-old creg1;Ckm-Cre mice. (A and B) Representative photomicrographs used for quantitative analysis of immunostaining for MYH1/MHC-I in the gastrocnemius and soleus of 9-month-old creg1;Ckm-Cre mice. Type II fibers were negative to antibody anti-MYH1. The analysis was performed using 5 fields per section (50 μm). An average of 400 fibers was analyzed in the gastrocnemius and soleus for each mouse. (C) RT-PCR analysis of Myh isoforms (Myh1, Myh2/Mhc2a and Myh4/Mhc2b) expression in the gastrocnemius. (D) Electron microscopy (EM) analysis of gastrocnemius from 9-month-old Creg1fl/fl and 9-month-old creg1;Ckm-Cre, scale bars: 1.0 μm. Size (E), mitochondrial number (F) and the ratio of abnormal mitochondria (G) in the two groups. (H) MtDNA analysis of gastrocnemius in the two groups (n = 3). (I and J) Western blotting analysis of mitochondrial marker proteins in the gastrocnemius of 9-month-old Creg1fl/fl and 9-month-old creg1;Ckm-Cre, PTGS2, COX4I1, and TOMM20 expression. (K) Confocal microscopy analysis of the localization of his-CREG1 and MYH1, scale bars: 50 μm. (L and M) Western blotting analysis of mitochondrial marker proteins in the gastrocnemius of 9-month-old creg1;Ckm-Cre treated with saline and treated with recombinant (re)CREG1 protein (reCREG1), PTGS2, COX4I1, and TOMM20 expression. (N) Electron microscopy (EM) analysis of gastrocnemius from 9-month-old creg1;Ckm-Cre treated or not treated with reCREG1, scale bars: 1.0 μm. (O) Size, mitochondrial number (P) and the ratio of abnormal mitochondria (Q) in the two groups. Yellow asterisks represented normal mitochondria. Red asterisks represented abnormal mitochondria. Data are shown as mean ± SEM, *p < 0.05, **p < 0.01
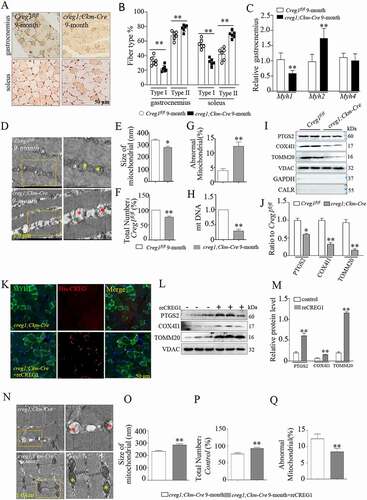
CREG1 ablation modulated the skeletal muscle mitochondrial morphology
Mitochondria are key organelles for energy production, which is closely related to exercise endurance in the type I fibers [Citation27–29]. Therefore, we further investigated whether loss of CREG1 changed the biofunction of mitochondria in skeletal muscle. Electron microscopy (EM) images () and quantification analysis () revealed the accumulation of abnormal mitochondria in CREG1-deficient muscles in 9-month-old mice. It showed that the average size () and number of mitochondria () decreased, and the proportion of abnormal mitochondria () increased progressively in 9-month-old creg1;Ckm-Cre mice compared to the corresponding age Creg1fl/fl mice. Similar morphological changes, the ratio of mitochondrial DNA (mtDNA) to nuclei DNA (nuDNA; mtDNA: nuDNA) was found to be significantly reduced in CREG1-deficient muscles from 9-month-old mice (). Meanwhile, the expression of mitochondrial proteins (PTGS2/COX2, COX4I1/COX4, and TOMM20) markedly decreased in CREG1-deficient skeletal muscle in 9-month-old mice ( and ). However, there were no obvious changes in the mRNA level of these proteins in creg1;Ckm-Cre and Creg1fl/fl mice, either at 3-month-old or 9-month-old (Fig. S4G-I).
In contrast, reCREG1 treatment significantly increased the percentage of type I fiber () and expression of mitochondrial proteins (PTGS2, COX4I1, and TOMM20) ( and ) in the skeletal muscle compared to that in untreated mice. Consistent with these results, EM images confirmed that reCREG1 treatment rescued mitochondrial impairment in creg1;Ckm-Cre mice (). Taken together, these results imply that the lack of CREG1 impairs the morphology and numbers of mitochondria in the skeletal muscle, while overexpression of CREG1 can improve them.
Deficiency of CREG1 did not change the biogenesis of mitochondrial
Because the reduction of mitochondria depends both on its biogenesis and mitophagy in the skeletal muscle, we first measured the expression of related proteins that regulated mitochondrial biogenesis with or without CREG1. As shown in Fig. S5A to S5E, the transcription related proteins that were involved in mitochondrial biogenesis PPARGC1A/PGC1-a (peroxisome proliferative activated receptor, gamma, coactivator 1 alpha) and TFAM (transcription factor A, mitochondrial) did not change in Creg1fl/fl and creg1;Ckm-Cre mice, both at the mRNA level (Fig. S5D and S5E) and protein level (Fig. S5A-C), either in 3-month- or 9-month-old mice.
CREG1 ablation increased the mitophagy in the skeletal muscle tissue
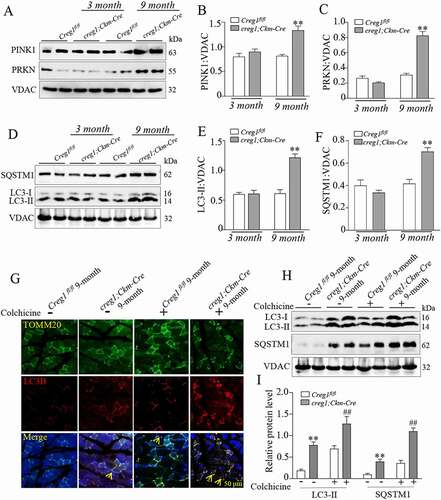
Next, we analyzed mitophagy in the skeletal muscle with or without CREG1. The protein levels of PINK1 (PTEN induced kinase 1) and PRKN/PARKIN (RBR E3 ubiquitin protein ligase), proteins directly involved in mitophagy, increased in the mitochondrial fraction () in 9-month-old creg1;Ckm-Cre mice. In contrast, the expression of PINK1 in the cytoplasm decreased in the skeletal muscle of 9-month-old creg1;Ckm-Cre mice compared to that in Creg1fl/fl mice (Fig. S5F and S5G), and the mRNA expression of Prkn and Pink1 also increased in the skeletal muscle of 9-month-old creg1;Ckm-Cre mice (Fig. S5H and S5I). Consistently, the autophagic marker proteins SQSTM1 and LC3-II were also increased in the mitochondrial protein fractions in the skeletal muscle of 9-month-old creg1;Ckm-Cre mice compared to Creg1fl/fl mice, which suggested an increased state of mitophagy in CREG1-deficient skeletal muscle (). To confirm the findings, we further assessed the mitophagy flux in the skeletal muscle of 9-month-old creg1;Ckm-Cre mice and Creg1fl/fl mice with colchicine treatment in vivo. Colocalization of LC3B and TOMM20 showed that colchicine-mediated autophagy inhibition resulted in significant accumulation of LC3B in 9-month-old creg1;Ckm-Cre skeletal muscle mitochondria compared to Creg1fl/fl mice (). Furthermore, western blotting analysis also confirmed significant accumulation of LC3-II on mitochondria from the skeletal muscle of 9-month-old creg1;Ckm-Cre treated with or without colchicine ( and ). The results suggest that CREG1 ablation could increase mitophagy in the skeletal muscle in vivo.
Figure 3. Deficiency of CREG1 enhanced mitophagy in the gastrocnemius of 9-month-old creg1;Ckm-Cre mice. (A and C) Western blotting (A) and quantification analysis showed the expression of PINK1 (B) and PRKN (C) in the mitochondria of the gastrocnemius of 3- and 9-month-old Creg1fl/fl and creg1;Ckm-Cre mice. (D and F) Western blotting (D) and quantification analysis (E and F) showed the expression of LC3-II and SQSTM1 protein in the mitochondria of the gastrocnemius of 3- and 9-month-old Creg1fl/fl and creg1;Ckm-Cre mice. (G) Confocal microscopy analysis of the colocalization of LC3B and TOMM20, yellow asterisks represented the colocalization of LC3B and TOMM20, scale bars: 50 μm. (H and I) Western blotting (H) and quantification analysis (I) showed the expression of SQSTM1 and LC3-II protein in the mitochondria of the gastrocnemius treated with colchicine (0.4 mg/kg·day). Data are shown as mean ± SEM, **p < 0.01, ##p < 0.01
CREG1 modulated the mitochondrial morphology and function in myoblast cells
To confirm the in vivo result, we altered the expression of CREG1 in a cultured myoblast cell line (C2C12) using gain- and loss-of-function approaches. As shown in Fig. S6A-C, CREG1 levels were higher at both the mRNA and protein levels in C2C12 cells infected with adenovirus-carrying Creg1 gene (named AdCREG1) than in those infected with adenovirus carrying green fluorescent protein (named AdGFP). Meanwhile, a reduction in CREG1 was detected in cells transfected with silent-Creg1 vector (named siCreg1) compared to control cells (named siScramble) in both mRNA and protein levels. Using MitoTracker Red probe, we found that the mitochondria were more elongated and tubular in AdCREG1 than those in AdGFP cells (). These features implied that the mitochondria in cells with AdCREG1 infection were healthy. In contrast, accumulation of MitoTracker Red was significantly reduced in siCreg1-treated C2C12 cells as compared to siScramble-treated cells (). Moreover, EM images also showed that overexpression of CREG1 increased the numbers of mitochondria and improved their morphology in C2C12 cells (). Conversely, the numbers of mitochondria were decreased and the morphology of mitochondria was the punctate and fragmented in siCreg1-treated cells compared to siScramble-treated ones (). Furthermore, more impaired mitochondria were detected in autophagosome in siCreg1-treated C2C12 cells (). Similarly, mtDNA analysis also identified an increase in mitochondria in AdCREG1-infected C2C12 cells, but a decrease in siCreg1-treated C2C12 cells (). Consistently, the protein levels of PTGS2, COX4I1, and TOMM20 were decreased in siCreg1-treated cells, while they increased in AdCREG1 cells ( and ), while no differences were found in mRNA levels (data not shown). To confirm the morphological changes, we also detected expression of fusion proteins and fission proteins in C2C12 cells with or without CREG1 expression. As expected, the fusion proteins MFN2 (mitofusin 2) and OPA1 (OPA1, mitochondrial dynamin like GTPase) were increased in C2C12 cells with overexpression of CREG1 and were decreased in cells with silenced CREG1. Moreover, the fission proteins DNM1L/DRP1 (dynamin 1-like) and MFF (mitochondrial fission factor) exhibited the reduced expression in AdCREG1-infected C2C12 cells but were enhanced in expression in siCreg1-treated cells ( and ).
Figure 4. CREG1 altered the morphology and function of mitochondria in C2C12 cells. (A) MitoTracker Red staining revealed the morphology of mitochondria in the AdGFP, AdCREG1, siScramble, and siCreg1-treated C2C12 cells. Scale bars, left column: 20 μm. Right column, magnified view of the area in the image from the left column indicated with a yellow square. Yellow arrows pointed out mitochondria. (B and D) Electron microscopy (EM) analyzed the morphology of mitochondria in the AdGFP, AdCREG1, siScramble, and siCreg1-treated C2C12 cells, left column, scale bars: 1.0 μm. Right column, magnified view of the area marked with a yellow square. Quantification for mitochondrial number (C) and the ratio of abnormal mitochondria (D). (E) MtDNA analysis in the AdGFP, AdCREG1, siScramble, and siCreg1-treated C2C12 cells. Yellow asterisks represented normal mitochondria. Red asterisks represented abnormal mitochondria. (F and G) Western blotting (F) and quantification analysis (G) revealed the expression of PTGS2, COX4I1, and TOMM20 in mitochondrial fraction of AdGFP, AdCREG1, siScramble, and siCreg1-treated C2C12 cells. (H and I) Western blotting (H) and quantification analysis (I) revealed the expression of DNM1L, MFF, OPA1 and MFN2 in mitochondrial fraction of AdGFP, AdCREG1, siScramble and siCreg1-treated C2C12 cells. Representative oxygen consumption curves (J) and quantification analysis (K) in the AdGFP, AdCREG1, siScramble, and siCreg1-treated C2C12 cells. Basal respiration rate was measured followed by proton leak after the addition of oligomycin, maximal respiration after the addition of FCCP, and non-mitochondrial respiration after the addition of rotenone. Data are shown as mean ± SEM, n = 3, *p < 0.05, **p < 0.01, ##p < 0.01
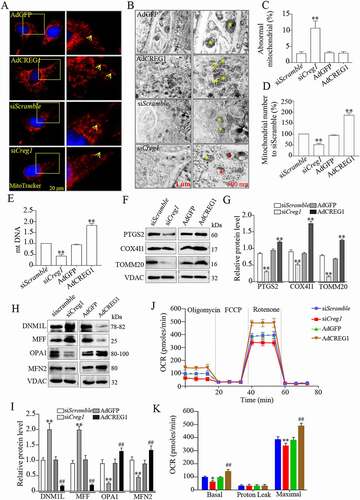
We also used oxygen consumption rate (OCR) to evaluate the mitochondrial respiration capacity in C2C12 cells with or without CREG1 expression. As shown in and , overexpression of CREG1 increased the OCR, including maximal respiration and spare respiratory capacity. Moreover, the ablation of CREG1 significantly dropped the OCR in siCreg1-treated C2C12 cells compared to siScramble. These results suggest that CREG1 could modulate both mitochondrial morphology and function in myoblast cells.
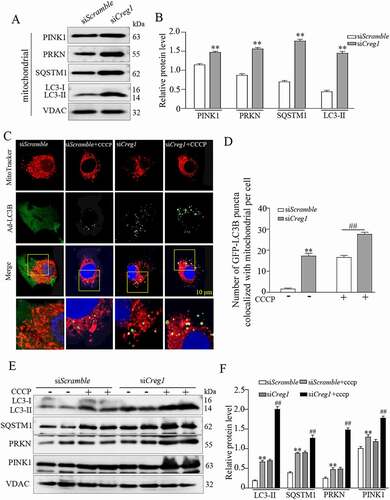
CREG1 deficiency induced mitophagy in myoblasts
We further examined whether ablation of CREG1 could induce mitophagy in C2C12 cells. First, we detected the accumulation of PINK1 and PRKN by western blotting in mitochondrial fraction from siCreg1-treated C2C12 cells compared to those treated with siScramble. As shown in and , moderate PINK1 and PRKN accumulation was detected in the mitochondrial fraction from siCreg1-treated C2C12 cells compared to siScramble. Meanwhile, SQSTM1 and LC3-II also accumulated in the mitochondrial fraction of siCreg1-treated C2C12 cells compared to siScramble. Further, to confirm the result, we also assessed mitophagy flux using carbonyl cyanide m-chlorophenylhydrazone (CCCP) [Citation30], which uncouples mitochondrial oxidative phosphorylation, damaging the mitochondria and initiating mitophagy. Confocal images and quantification analysis identified that higher LC3B protein levels and increased co-localization of LC3B and the MitoTracker probe were detected in mitochondria from siCreg1-treated C2C12 with CCCP treatment compared to siScramble-treated cells ( and ). Similarly, western blotting analysis also showed that mitophagy proteins such as PINK1, PRKN, LC3-II and SQSTM1 increased in the mitochondrial fraction from siCreg1-treated-C2C12 cells with or without CCCP treatment ( and ). Consistent with these results, staining of mt-Keima and co-localization of PINK1/MitoTracker also confirmed that inhibition of CREG1 increased mitophagy in C2C12 cells with or without CCCP treatment (Fig. S6D-G).
Figure 5. Deficiency of CREG impaired the mitophagy in C2C12 cells. (A and B) Western blotting analysis to measure the expression of PINK1, PRKN, LC3-II and SQSTM1 in the mitochondria from the siScramble and siCreg1 cell groups. (C) Confocal images of colocalization of GFP-LC3B puncta and mitochondria (red-MitoTracker) in C2C12 cells transfected with the Creg1 siRNA during growth in CCCP (10 μM) for 1 h. Scale bar: 10 μm. (D) Quantification of colocalization of GFP-LC3B puncta and mitochondria. n = 3. (E and F) Western blotting (E) and quantification analysis (F) showed the expression of LC3-II and SQSTM1 protein in the mitochondria of the gastrocnemius treated with carbonyl cyanide m-chlorophenylhydrazone (CCCP, 10 μΜ, 1 h). Data are shown as mean ± SEM, **p < 0.01, ##p < 0.01
CREG1 interacted with HSPD1/HSP60 in vitro and in vivo
To elucidate how CREG1 modulated mitophagy, we isolated CREG1-interacting proteins from C2C12 myotubes by expressing His-tagged CREG1. Using Mud-PIT mass spectrometric analysis, we identified HSPD1 (heat shock protein 1), a mitochondrial chaperon protein [Citation31], in immunopurified CREG1 complexes (Fig. S7A). To confirm the results, we further analyzed the relationship between CREG1 and HSPD1 protein. As shown in and , co-IP assay confirmed the interaction between CREG1 and HSPD1 by co-transfection with HA-tagged Hspd1 and FLAG-tagged Creg1 plasmids into 293 T cells. Furthermore, immunofluorescent staining showed colocalization between the CREG1 and HSPD1 in C2C12 cells when transfected with Creg1-GFP infusion plasmid (). Similarly, co-IP analysis also showed that CREG1 interacted with HSPD1 in the skeletal muscle in Creg1fl/fl mice but not in creg1;Ckm-Cre mice ( and ). These results suggest that CREG1 interacts with HSPD1 directly both in vivo and in vitro.
Figure 6. Interaction between CREG1 and HSPD1 in vitro and in vivo. (A and B) 293 T cells were transfected with Creg1-HA plasmid and Hspd1-FLAG plasmid together. Co-IP of CREG1 and HSPD1 in 293 T cells. (C) Confocal microscopy analysis of the colocalization of CREG1-GFP and HSPD1, scale bars: 20 μm. (D and E) Co-IP assay showed the interaction between CREG1 and HSPD1 in the skeletal muscle protein from 9-month-old creg1;Ckm-Cre and Creg1fl/fl mice. (F and G) Western blotting and quantification analysis showed the expression of HSPD1 protein in the skeletal muscles of 3-month or 9-month-old mice Creg1fl/fl and creg1;Ckm-Cre mice. (H and I) Western blotting analysis demonstrated the expression of HSPD1 protein in the skeletal muscles of 9-month-old creg1;Ckm-Cre with or without reCREG1 protein treatment. (J and K) Western blotting and quantification analysis showed the expression of HSPD1 protein in siScramble, siCreg1, and siCreg1+ MG132 (10 μmol/L) cells. (L and M) Western blotting and quantification analysis showed the expression of CREG1 protein in siScramble, siHspd1, and siHspd1+ MG132 (10 μmol/L) cells. Data are shown as mean ± SEM, **p < 0.01, &p < 0.01
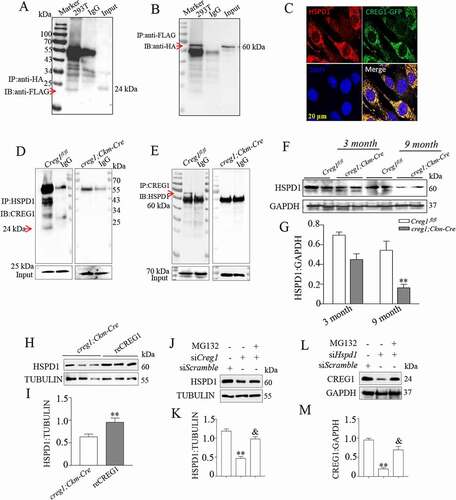
CREG1 and HSPD1 regulated the stability of one another in vivo and in vitro
HSPD1 has been reported to regulate mitophagy in vitro or in vivo [Citation32–34]. To elucidate whether HSPD1 could mediate the CREG1-regulated mitophagy in the skeletal muscle, first, we evaluated the expression of HSPD1 in the skeletal muscle from Creg1fl/fl mice or creg1;Ckm-Cre in 3-month-old and 9-month-old mice. As shown in and , the expression of HSPD1 protein was significantly lower in the skeletal muscle from creg1;Ckm-Cre than Creg1fl/fl mice, in both 3-month-old mice and 9-month-old mice. Conversely, recovery of CREG1 in creg1;Ckm-Cre mice by fusion into reCREG1 protein clearly increased the HSPD1 expression in the skeletal muscle ( and ). In contrast, the mRNA expression of Hspd1 did not change in creg1;Ckm-Cre or reCREG1-treated mice compared to Creg1fl/fl mice (Fig. S8A). Similarly, when Creg1 expression was silenced in C2C12, HSPD1 protein level remarkably decreased ( and ) but not in mRNA level (Fig. S8B). To examine how the CREG1 modulated the reduction of HSPD1 protein level, we further measured the expression of HSPD1 in siCreg1-treated C2C12 cells with or without MG132 treatment (10 μmol/L). As shown in and , MG132 administration rescued the reduction of HSPD1 induced by CREG1 deficiency in C2C12. Interestingly, we found that when Hspd1 was silenced in C2C12, the expression of CREG1 also reduced in protein level ( and ) but not in mRNA level (Fig. S8C). Similarly, the decrease of CREG1 was also inhibited by MG132 in C2C12 with silencing of Hspd1. These results indicate that the CREG1 and HSPD1 could regulate the protein stability of one another.
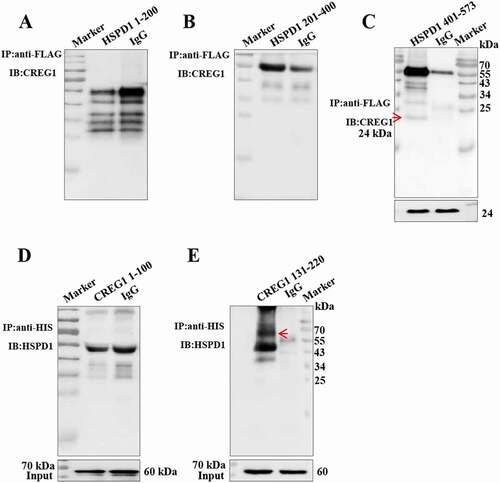
CREG1 small peptide (130-220 aa) interacted with HSPD1 through its 401–573 amino acids peptide fragment
To study how CREG1 regulated the degradation of HSPD1 in protein level, we constructed the vector that expressed the three short peptides of HSPD1 protein, according to its crystal structure (Fig. S8D and S8E). As shown in to , co-IP analysis showed that the interaction of CREG1 with HSPD1 occurred in cells when infected with the short peptide 401–573 fragment of Hspd1 plasmid (). To clarify whether the protein fragment that CREG1 protein interacted directly with HSPD1 small peptide, we further produced two small peptides of CREG1 protein (from 1–100 aa and 130–220 aa respectively). In contrast, the C-terminal peptide of CREG1 (130–220 aa), but not N-terminal peptide of CREG1 (1–100 aa), interacted with HSPD1 in AD293T cells ( and ).
Figure 7. CREG1 directly interacted with the peptide fragment 401–573 aa of HSPD1. (A and C) Co-IP analysis to detect interaction between CREG1 and peptide fragments 1–200 aa (A), 201–400 aa (B), and 401–573 aa (C) of HSPD1. IP antibody: anti-FLAG, IB antibody: anti-CREG1. Input: CREG1. (D and E) Co-IP analysis to detect interaction between HSPD1 with different peptide fragments of CREG1: 1–100 aa (D) and 130–220 aa (E). IP antibody: anti-HIS, IB antibody: anti-HSPD1. Input: HSPD1
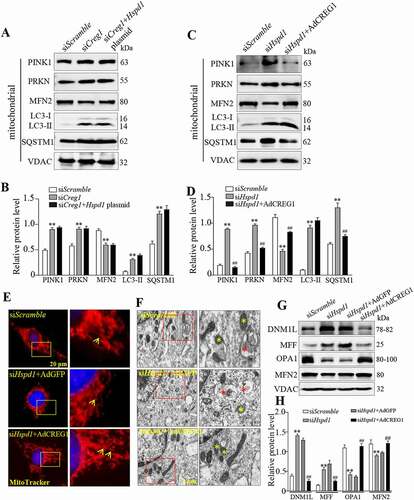
CREG1 rescued HSPD1 deficiency-induced mitophagy in C2C12 cells
To clarify the role of the CREG1 and HSPD1 interaction in skeletal muscle mitophagy, we overexpressed HSPD1 in siCreg1-treated C2C12 cells. As shown in and , overexpression of HSPD1 could not mitigate siCreg1-induced mitophagy in C2C12 cells. Interestingly, western blotting showed that overexpression of CREG1 could rescue mitophagy induced by siHspd1 in C2C12 ( and ). In contrast, the MitoTracker staining (), EM images () and western blotting of fusion and fission proteins ( and ) also showed that overexpression of CREG1 protein could rescue the impairment of mitochondrial morphology induced by silencing Hspd1 in C2C12 cells.
Figure 8. Overexpression of CREG1 rescued siHspd1-induced mitophagy in C2C12. (A and B) Western blotting analysis showed the expression of PINK1, PRKN, MFN2, LC3-I/LC3-II and SQSTM1 protein in siScramble, siCreg1, and siCreg1+ Hspd1 plasmid cells. (C and D) Western blotting analysis showed the expression of PINK1, PRKN, MFN2, LC3-I/LC3-II and SQSTM1 protein in the siScramble, siHspd1, and siHspd1+ AdCREG1 cells. (E) MitoTracker Red staining revealed the expression of mitochondria in siScramble, siHspd1+ AdGFP and siHspd1+ AdCREG1 three C2C12 cells, scale bars: 20 μm. (F) Electron microscopy (EM) analysis of cells from the three groups, scale bars: 1.0 μm. Yellow asterisks represented normal mitochondria, red asterisks represented abnormal mitochondria. (G and H) Western blotting analysis to measure the expression of DNM1L, MFF, OPA1 and MFN2 in the mitochondria from the cell groups. Data are shown as mean ± SEM, **p < 0.01, ##p < 0.01
Discussion
In the present study, we demonstrated for the first time that CREG1 was localized to the mitochondria both in vivo and in vitro and played an important role in mitophagy. creg1;Ckm-Cre mice significantly showed reduction of exercise capacity, a phenotype explained by mitophagy impairment. These observations established that CREG1 played a crucial role in the homeostasis of mitochondria and can improve abnormal skeletal muscle energy metabolism. Mechanistically, CREG1 mediated the effect of HSPD1, a mitochondrial chaperon protein, the instability of which resulted in increased mitophagy and muscle dysfunction (Fig. S8F). Overall, our findings showed an important function of CREG1 that it was to maintain exercise capacity in adult skeletal muscle.
Skeletal muscle homeostasis is affected by many different types of stimuli and stresses. Loss of muscle mass and strength is already a well-known feature of aging in humans [Citation35–38]. However, direct and robust evidence on the molecular mechanisms of the growth process in skeletal muscle function is lacking. In the present study, we reported that CREG1 deficiency directly modulated injury to skeletal muscle function, which could shorten the time and distance of exercise endurance in mice. To elucidate the mechanism by which CREG regulated skeletal muscle damage, we first determined that the quantity of type I fiber was reduced both in the soleus and gastrocnemius of 9-month-old creg1;Ckm-Cre mice compared to Creg1fl/fl mice. Moreover, RT-PCR analysis revealed that the expression of Myh1 was significantly reduced in gastrocnemius of 9-month-old creg1;Ckm-Cre mice compared to in Creg1fl/fl mice. The data showed that deficiency of CREG1 decreased the expression of type I fiber in skeletal muscles in 9-month-old creg1;Ckm-Cre mice. Then we monitored the mitochondrial morphology of the skeletal muscle with or without CREG1 expression. Interestingly, more abnormal mitochondria were found in the gastrocnemius from creg1;Ckm-Cre mice than Creg1fl/fl mice according to EM images. Furthermore, western blotting analysis confirmed that loss of CREG1 significantly reduced mitochondrial marker proteins and mtDNA expression in 9-month-old creg1;Ckm-Cre mice as compared to Creg1fl/fl mice. These results suggested that CREG1 deficiency induced mitochondrial impairment. Meanwhile, the accumulation of damaged mitochondria in autophagosomes was shown in the skeletal muscle with CREG1-deficient mice, using EM images and expression of autophagy marker proteins LC3-II and SQSTM1. Some studies have found that mitochondrial fusion and fission proteins are essential for muscle homeostasis, mitochondrial development and function [Citation39,Citation40]. We analyzed the expression of the fusion (OPA1, MFN2) and fission (DNM1L, MFF) factors, the fission proteins DNM1L and MFF increased, but the fusion proteins OPA1 and MFN2 were reduced in 9-month-old creg1;Ckm-Cre gastrocnemius muscle compared to Creg1fl/fl mice (data not shown). Meanwhile, we also obtained similar results on the expression of the fusion and fission proteins in C2C12 cells using overexpressed or silent Creg1. This indicated that CREG1 deficiency affected the dynamic balance of mitochondrial fusion and fission and led to the changes in muscle phenotype and mitochondrial morphology.
As reported, the maintenance of a functional mitochondrial machinery is probably critical for skeletal muscle mass, quality, and function [Citation38,Citation41]. Therefore, the abnormal accumulation of damaged mitochondria could point to the failure of mitochondrial protein turnover, either through impaired mitochondrial biogenesis or degradation [Citation42–45]. Here, we further identified that CREG1 modulated mitochondrial impairment through inhibition of its autophagic degradation in vivo and in vitro. Autophagy is long considered to be a nonselective degradation system, but it is now widely acknowledged that autophagy promotes the degradation of specific cellular components with concomitant specific pathways. The selective autophagic elimination of defective mitochondria is called mitophagy. The mitochondrial life cycle includes the biogenesis, maintenance, and clearance of damaged or inefficient mitochondria [Citation46–50]. Although mitophagy is the most important turnover activity of mitochondria in cellular pathophysiology, the detailed mechanisms that regulate mitophagy are still unclear. In this study, we used Creg1fl/fl and creg1;Ckm-Cre mice models to confirm that the lack of CREG1 led to mitophagy in the skeletal muscle by promoting the mitophagy proteins PINK1 and PRKN, both at the mRNA and protein levels, while overexpression of CREG1 ablated the expression of these proteins in cells. Similar to previous reports [Citation16,Citation51] that CREG1 is also involved in the modulation of autophagy by maintenance of lysosome homeostasis, we identified that a lack of CREG1 in the skeletal muscle not only promoted mitophagy but also increased the SQSTM1 in 9-month-old creg1;Ckm-Cre mice, which implied that the impairment of autophagocytosis was through impaired lysosome homeostasis. Therefore, CREG1 deficiency exhibited two functions in regulating mitophagy, one caused mitochondrial damage, the other was impairment of autophagy.
More interestingly, we found that CREG1 promoted mitophagy by direct interaction with the chaperon protein HSPD1. HSPD1 is classically described as a mitochondrial protein with multiple roles in health and disease [Citation52–54], participating in the maintenance of protein homeostasis. The eukaryotic HSPD1 belongs to chaperonins group I that assists with the correct folding of mitochondrial proteins [Citation55], together with its co-chaperonin, HSPE1/HSP10 [Citation56,Citation57]. Several studies have demonstrated that HSPD1 deficiency is involved in mitophagy in many kinds of cells and tissues [Citation58]. Moreover, the potential usage of HSPD1 as a marker for disease and the evaluation of novel treatment options are also discussed [Citation59]. However, the current literature is lacking in information regarding HSPD1 involvement in skeletal muscle fiber biogenesis and regeneration during exercise, aging, and under disease conditions. Here, we demonstrated that the stability of HSPD1 was regulated by CREG1, which directly interacted with HSPD1 short peptide fragment (401–573 aa) to sustain its expression and mediated the regulation for mitochondrial housekeeping proteins in vivo and in vitro. Meanwhile, we also showed that the c-terminal peptide of CREG1 (130–220 aa) was involved in the interaction with HSPD1.
Taken together, our results revealed a pathway regulated by CREG1, which protected skeletal muscle homeostasis by improving mitochondrial function. These findings have implications for our understanding of the mechanisms involved in the development of skeletal muscle rescue of reductions in endurance performance associated with growth and disease and, therefore, important clinical implications.
Materials and methods
Generation of muscle-specific creg1 knockout mice and treatment groups
Mice bearing Creg1-floxed alleles (Creg1fl/fl) (GemPharmatech Co.,Ltd. B004226) were crossed with transgenic mice expressing Cre recombinase (GemPharmatech Co.,Ltd. B004226) under muscle-specific Ckm (creatine kinase, muscle) promoter. Genomic DNA isolated tail clips from Creg1fl/fl mice were used to confirmed mouse genotypes by real-time PCR analysis. Cre-mediated recombination was also determined by PCR from the skeletal muscle. All male mice were used and maintained in a C57BL/6 background, creg1;Ckm-Cre mice, and the control mice Creg1fl/fl were used in all experiments. Mice were 3- to 9-month-old when used for each experiment. creg1;Ckm-Cre 9-month-old mice were treated with recombinant (re)CREG1 protein (reCREG1, 1 mg/kg·d; Origene, TP750059) subcutaneously for three days by osmotic pumps (DURECT Corporation, Alzet model 1004). All mice were fed and placed in a 12:12 h light/dark cycle system by an automated light switching project and temperature-controlled conditions at 22°C. All experiments were approved by the Animal Ethics Committee of Shenyang General Hospital and conducted in accordance with existing guidelines on the care and use of laboratory animals.
Training and fatigue experiments
Mice were treated with a run-to-exhaustion protocol on a motorized treadmill [Citation24,Citation25], after familiarization with the treadmill for 30 min at 10 m/min for 3 consecutive days. The mice were then tested by running at 10 m/min for 10 min, while the speed was increased by 2 m/min every 10 min until reaching 20 m/min, when the mice were considered exhausted. The exhaustion endpoint was confirmed when the mice sat on the shock grid at the back of the treadmill for longer than 5 s. Work was calculated as Work = body weight (kg) × running time (min) × running speed (m/min) × grade × 9.8 (J/kg × m); values were averaged from two sessions to determine exercise capacity as described [Citation25].
Western blotting and antibodies
Homogenized tissues were lysed in RIPA buffer (Thermo Fisher Scientific, UJ289235) and then centrifuged at 12,000 × g for 10 min at 4°C. Equal amounts of gastrocnemius muscle samples were separated by SDS-PAGE (at 120 V for 1 h), and then proteins were transferred onto a polyvinylidene difluoride membrane (Merck Millipore Ltd. R9KA84149). After 5% nonfat dry milk (Sangon Biotech Co.,Ltd, A600669-0250) in TBST (Sangon Biotech Co.,Ltd, G901BA0002) blocking, the membrane was incubated with antibodies against GAPDH (Cell Signaling Technology, 5174S), TUBA/alpha TUBULIN (Abcam, ab7291), CREG1 (Abcam, ab191909), PINK1 (Abcam, ab23707), PRKN/PARKIN (Abcam, ab77924), MFN2 (Cell Signaling Technology, 9482S), LC3B (Cell Signaling Technology, 3868S), SQSTM1/p62 (Cell Signaling Technology, 16177S), PPARGC1A/PCG1a (Abcam, ab54481), TFAM (Abcam, ab176558), HSPD1/HSP60 (Abcam, ab46798), COX4I1/COX4 (Abcam, ab153709), TOMM20 (Abcam, ab56783), PTGS2/COX2 (Abcam, ab179800), VDAC (Cell Signaling Technology, 4866T), OPA1 (Cell Signaling Technology, 80471S), DNM1L/DRP1 (Cell Signaling Technology, 8570S), MFF (Cell Signaling Technology, 84,580 T), MYH1/MHC-I (NOVUS, NB120-15,680), or CALR/CALRETICULIN (Abcam, ab92615) at 4°C overnight, all antibodies were diluted 1:1000. After washing, the membrane was incubated with goat anti-rabbit or mouse (1:5000; Jackon ImmunoResearch, 150,783) for 2 h at 25°C.
Immunoprecipitation (IP)
CREG1 protein was synthesized with several small peptides (Mimotopes, p190411-SJ703366). The skeletal muscle cell line C2C12 (NanJing KeyGen Biotech Co.,Ltd, KG349) were collected at indicated time points, then homogenized and lysed with IP lysis buffer for 60 min on ice. The lysate was centrifuged at 14,000 × g for 15 min. The protein was mixed and incubated with antibody-conjugated beads (Thermo Fisher Scientific, UE284649) and rotated overnight at 4°C. Then, the beads were washed 3 times with IP lysis buffer. Western blotting was performed as described previously [Citation60].
Cell culture, adenovirus vector, plasmid, siRNA and transfection reagent
293 T and C2C12 cell lines were purchased from the Chinese Academy of Sciences Shanghai Institute for Cell Resource Center; they were cultured in 5% CO2 at 37°C in the 10% FBS (Biological industries, 2,025,067) DMEM (life technologies corporation, 2,230,808). Adenoviral vector (AdGFP and AdCREG1) (OBiO Technology Corp., Ltd, K0030 and HYKY-190,530,019-YADV) and siCreg1 RNA were transfected to establish C2C12 cell lines with up-and-down regulated Creg1 expression. Ad-GFP-LC3B (Hanbio Biotechnology Co., Ltd. AP20033001) was also transfected into C2C12 cells treated with carbonyl cyanide m-chlorophenylhydrazone (CCCP, 10 μM; Solarbio, C6700). Hspd1/Hsp60 plasmid (Genewiz, 80–420,360,134) and siRNAs of Creg1 (Thermo Fisher Scientific, 14,291,308) and Hspd1 (Santa Cruz Biotechnology, 12,404) were infected into C2C12 cells by using lipofectamine RNAi MAX (Thermo Fisher Scientific, 2,103,411). C2C12 cells were treated with MG132 (Sigma-Aldrich, M8699; 10 μmol/L) 24 h. Adenoviral vector RFP-GFP-LC3B (Hanbio Biotechnology Co., Ltd, HS-AP2100001) infected cells were used to monitor autophagic flow.
Real-time PCR
The gastrocnemius and soleus muscle of mice and C2C12 cells were prepared. According to the Eastep® Super kit’s instructions (Promega, 0000287896), RNA was reverse transcribed using the SuperScript™ III First-Strand Kit (Thermo Fisher Scientific, 18,080,400) for 5 min at 85°C according to the manufacturer’s instructions. Real-time PCR was performed on an ABI 7300 PCR System. The sequences of primers (forward and reverse) for mouse were as follows:
Creg1, 5ʹ-TGTCGGGAACTGTGACCAAG-3ʹ and 5ʹ-CTTTAGTTGTTGAAATCTGTG-3ʹ; Gapdh, 5ʹ-TCAACGACCCCTTCATTGAC-3ʹ and 5ʹ-ATGCAGGGATGATGTTCTGG-3ʹ; Hspd1/Hsp60: 5ʹ- CCGCCCCGCAGAAATGCTTCGAA-3ʹ and 5ʹ-AGGCTCGAGCATCCGCACCAA-3ʹ; Pink1, 5ʹ-CGACAACATCCTTGTGGAGTGG-3ʹ and 5ʹ-CATTGCCACCACGCTCTACACT-3ʹ; Nd1, 5ʹ-CCCATTCGCGTTATTCTT-3ʹand 5ʹ-AAGTTGATCGTAACGGAAGC’; Ppargc1a/Pgc1a, 5ʹ- CTGCGGGATGATGGAGACAG-3ʹand 5ʹ-TCGTTCGACCTGCGTAAAGT-3ʹ; Ptgs2/Cox2, 5ʹ-TTCAACACACTCTATCACTGGC-3ʹ and 5ʹ- AGAAGCGTTTGCGGTACTCAT-3ʹ; Cox4i1/Cox4, 5ʹ-CTGCCCGGAGTCTGGTAATG −3ʹ and 5ʹ-CAGTCAACGTAGGGGGTCATC-3ʹ; Tomm20, 5ʹ- GCCCTCTTCATCGGGTACTG-3ʹ and 5ʹ-ACCAAGCTGTATCTCTTCAAGGA-3ʹ; Tfam, 5ʹ-ATTCCGAAGTGTTTTTCCAGCA-3ʹ and 5ʹ- TCTGAAAGTTTTGCATCTGGGT-3ʹ; Prkn/Parkin, 5ʹ- TCTTCCAGTGTAACCACCGTC-3ʹ and 5ʹ-GGCAGGGAGTAGCCAAGTT-3ʹ; Myh1, 5ʹ-ACTGTCAACACTAAGAGGGTCA’ and 5ʹ-GGCAG TTGGATGATTTGATCTTCCAGGG’; Myh2/Mhc2a, 5ʹ- AAGTGACTGTGAAAACAGAAGCA’ and 5ʹ-GCAGCCATTTGTAAGGGTTGAC’; Myh4/Mhc2b, 5ʹ-TTGAAAAGACGAAGCAGCGAC’ and 5ʹ- AGAGAGCGGGACTCCTTCTG’.
Mitochondrial Assays
Mitochondria from the gastrocnemius muscle of mice and C2C12 Cells were isolated as described [Citation61]; the key steps when isolating mitochondria from skeletal muscle or C2C12 cells were always the same using a Mitochondria Isolation Kit (Abcam, ab110170). Mitochondria oxygen consumption rate (OCR) was measured in C2C12 cells using the Seahorse Extracellular Flux (XF96) Analyzer (Seahorse Bioscience Inc. North Billerica, MA, USA) as described previously. C2C12 cells were grown overnight, treated with AdCREG1 and siRNA for Creg1 (upregulated and downregulated CREG1 expression), then the cells were consecutively administrated oligomycin A (Sigma-Aldrich, 75,351; 2.5 µM), FCCP (Sigma-Aldrich, C2920; 0.7 µM) and rotenone (Sigma-Aldrich, R8875; 2 µM) [Citation62,Citation63].
Autophagic flux quantification
As previously described [Citation39], autophagic flux was monitored in mice using colchicine (0.4 mg/kg; Sangon Biotech, A600322). Briefly, skeletal muscle creg1 KO mice were treated with colchicine or saline by intraperitoneal injection. The treatment was repeated at 15 h prior to muscle harvesting. C2C12 cells were transfected with Adenoviral vector RFP-GFP-LC3; 48 h later, the cells were fixed in 4% formaldehyde solution for 15 min, then dyed with DAPI and visualized by fluorescence microscopy. The number of GFP and mRFP dots was detected by counting fluorescent puncta in five fields from three different C2C12 cell preparations [Citation64].
Electron microscopy (EM)
The gastrocnemius muscle was removed and quickly fixed using 2% glutaraldehyde for 24 h. C2C12 cells were treated with adenoviral vector, Hspd1 plasmid and siRNA for Creg1 and Hspd1 for 48 h, and the samples were fixed using 2% glutaraldehyde for 24 h. The samples were subjected to different processing steps, such as fixation, gradient alcohol dehydration, and displacement, prior to imaging them with a transmission electron microscope (JEM-2000EX TEM, Japan). Morphometric analysis of mitochondria’s number and size was done with iTEM software. The number of mitochondria was analyzed using the same magnification in a 100 μm square field. For each experiment, mitochondrial diameter was measured from 3 mice per group as previously described [Citation40]. In the images yellow asterisks represent normal mitochondria, red asterisks represent abnormal mitochondria.
Hematoxylin and eosin (H&E) and immunohistochemical staining
At 3 and 9 months of age, mice were anesthetized with isoflurane and their skeletal muscles removed. Isolated gastrocnemius and soleus muscles were fixed for 24 h using 4% formaldehyde. They were then dehydrated, embedded in paraffin, dewaxed, stained with eosin, and dehydrated with alcohol. Immunohistochemical analysis was performed as previously described [Citation65], according to kit instruction (MX biotechnologies, KIT-9720).
Immunofluorescent and mitotracker staining
Fluorescence of mt-Keima (Public Protein/Plasmid Library, ADY190808) was detected in 2 channels (488 nm, green; 561 nm, red). The mitophagy index was identified by the ratio of 561 nm: 488 nm fluorescence [Citation66]. Cells were transfected with Ad-GFP-LC3B 48 h, treated with carbonyl cyanide m-chlorophenylhydrazone (CCCP, 10 μM) for 1 h, and then stained with MitoTracker® Red FM (Thermo Fisher Scientific, 1,941,460; 100 nM) for 15–30 min. After staining, washing, and fixing the cells with 4% formaldehyde for 15 min, they were subjected to 0.1% Triton X-100 (Sangon Biotech, T0694) for 10 min permeabilization and animal nonimmune serum (Biomics Biotech, SP KIT-B3) blocking 15 min. The cells were then incubated with PINK1-specific antibody.
Mitochondria fraction isolation
Briefly, as previously described [Citation67], the gastrocnemius muscle and C2C12 cells were prepared. Mitochondria Isolation Kit (Abcam, ab110170) was used for Mitochondria fraction isolation. Cells underwent freeze-thaw to weaken membranes. They were then suspended in Reagent A at 5.0 mg/ml, incubated on ice for 10 min, and homogenized with a Dounce homogenizer (Sangon Biotech, F519064). After centrifugation at 1,000 × g for 10 min at 4°C, the supernatant was collected and the pellet was resuspended and re-centrifuged; the supernatant was again saved. After another re-suspension and centrifugation at 12,000 × g for 10 min at 4°C, the pellet was resuspended in Reagent C supplemented with Protease inhibitor cocktail (Sangon Biotech, C600386), aliquoted, and frozen at −80°C.
Statistical analysis
Data are presented as the mean ± standard error of the mean (SEM). All data were analyzed using the statistical software SPSS 13.0 (SPSS, Chicago, IL, USA). Differences between two groups were compared using an unpaired Student’s t-test. Differences among three or more groups were compared using a one-way analysis of variance (ANOVA). P < 0.05 was considered statistically significant.
Statement of Ethics
Authors have no ethical conflicts to disclose
Supplemental Material
Download Zip (11 MB)Acknowledgments
Thanks to editors and reviewers for improving this article throughout the revision process. This study was supported by National Science Funding of China (81670276, 91739118, 81870553, 81770303, 82070875 and 82070308). Major Research and Development Program of Liaoning Province (2019JH2/10300025 and 20180540136). Science and technology program of Shenyang (20-205-4-057).
Disclosure statement
The authors have no conflicts of interest to declare.
Supplementary material
Supplemental data for this article can be accessed here.
Additional information
Funding
Related Research Data
References
- Kim TN, Choi KM. Sarcopenia: definition, epidemiology, and pathophysiology. J Bone Metab. 2013 May;20(1):1–10. PMID: 24524049, PMCID: PMC3780834.
- Balan E, Schwalm C, Naslain D, et al. Regular endurance exercise promotes fission, mitophagy, and oxidative phosphorylation in human skeletal muscle independently of age. Front Physiol. 2019 Aug 22;10:1088. PMID: 31507451, PMCID: PMC6713923;10:1088.
- Baracos VE, Martin L, Korc M, et al. Cancer-associated cachexia. Nat Rev Dis Primers. 2018 Jan 18;4:17105. PMID: 29345251.
- Toth MJ, Callahana DM, Miller MS et al., Skeletal muscle fiber size and fiber type distribution in human cancer: effects of weight loss and relationship to physical function. Clin Nutr. 2016 Dec;35(6):1359–1365. PMID: 27010836 PMCID: PMC6411286. 2016
- Baracos VE, Mazurak VC, Bhullar AS. Cancer cachexia is defined by an ongoing loss of skeletal muscle mass. Ann Palliat Med. 2019;8(1):3–12. PMID: 30685982.
- Zieff GH, Wagoner CW, Paterson C, et al. Cardiovascular consequences of skeletal muscle impairments in breast cancer. Sports (Basel). 2020 May 31;8(6):80. PMID: 32486406 PMCID: PMC7353641.
- Ono T, Takada S, Kinugawa S, et al. Curcumin ameliorates skeletal muscle atrophy in type 1 diabetic mice by inhibiting protein ubiquitination. Exp Physiol. 2015 Sep;100(9):1052–1063. PMID: 25998196.
- Bilodeau PA, Coyne ES, Wing SS. The ubiquitin proteasome system in atrophying skeletal muscle: roles and regulation. Am J Physiol Cell Physiol. 2016 Sep 1;311(3):C392–403. PMID: 27510905.
- Borgia D, Malena A, Spinazzi M, et al. Increased mitophagy in the skeletal muscle of spinal and bulbar muscular atrophy patients. Hum Mol Genet. 2017 Mar 15;26(6):1087–1103. PMID: 28087734 PMCID: PMC5409076.
- Sato Y, Ohtsubo H, Nihei N, et al. Apobec2 deficiency causes mitochondrial defects and mitophagy in skeletal muscle. Faseb J. 2018 Mar;32(3):1428–1439. PMID: 29127187 PMCID: PMC5892721.
- Castagnaro S, Chrisam M, Cescon M, et al. Extracellular collagen vi has prosurvival and autophagy instructive properties in mouse fibroblasts. Front Physiol. 2018 Aug 17 PMID: 30174616 PMCID: PMC6107713;9:1129.
- Sin J, Andres AM, Taylor DJR, et al. Mitophagy is required for mitochondrial biogenesis and myogenic differentiation of C2C12 myoblasts. Autophagy. 2016;12(2):369–380. PMID: 26566717 PMCID: PMC4836019.
- Sarparanta J, García-Macia M, Singh R. Autophagy and mitochondria in obesity and type 2 diabetes. Curr Diabetes Rev. 2017;13(4):352–369. PMID: 26900135.
- Baechler BL, Bloemberg D, Quadrilatero J. Mitophagy regulates mitochondrial network signaling, oxidative stress, and apoptosis during myoblast differentiation. Autophagy. 2019 Sep;15(9):1606–1619. PMID: 30859901 PMCID: PMC6693454.
- Ji LL, Yeo D. Mitochondrial dysregulation and muscle disuse atrophy. F1000Res. 2019 Sep;8 (F1000Faculty Rev):1621. PMID: 31559011 PMCID: PMC6743252.
- Veal E, Eisenstein M, Tseng ZH, et al. A cellular repressor of e1a-stimulated genes that inhibits activation by E2F. Mol Cell Biol. 1998 Sep;18(9):5032–5041. PMID: 9710587 PMCID: PMC109088.
- Veal E, Groisman R, Eisenstein M, et al. The secreted glycoprotein CREG enhances differentiation of NTERA-2 human embryonal carcinoma cells. Oncogene. 2000 Apr 20;19(17):2120–2128. PMID: 10815803.
- Veal E, Groisman R, Eisenstein M, et al. The crystal structure of CREG, a secreted glycoprotein involved in cellular growth and differentiation. Proc Natl Acad Sci USA. 2005 Dec 20;102(51):18326–18331. PMID: 16344469 PMCID: PMC1317909.
- Ya-Ling H, Peng G, Ming-Yu S, et al. Secreted CREG inhibits cell proliferation mediated by mannose 6-phosphate/insulin-like growth factor II receptor in NIH3T3 fibroblasts. Genes Cells. 2008 Sep;13(9):977–986. PMID: 18691225.
- Liu Y, Tian X, Liu S et al. DNA hypermethylation: a novel mechanism of creg gene suppression and atherosclerogenic endothelial dysfunction Redox Biol 2020May; 32: 101444. PMID: 32067910.
- Sacher M, Bacco AD, Lunin VV, et al. Cellular repressor of e1a-stimulated genes is a bona fide lysosomal protein which undergoes proteolytic maturation during its biosynthesis. Exp Cell Res. 2008 Oct 1;314(16):3036–3047. PMID: 18621046.
- Yan C-H, Yang L, Tian X-X, et al. CREG1 ameliorates myocardial fibrosis associated with autophagy activation and Rab7 expression. Biochim Biophys Acta. 2015 Feb;1852(2):353–364. PMID: 25774384.
- Song H, Yan C, Tian X, et al. CREG protects from myocardial ischemia/reperfusion injury by regulating myocardial autophagy and apoptosis. Biochim Biophys Acta Mol Basis Dis. 2017 Aug;1863(8):1893–1903. PMID: 27840305.
- Fujita R, Yoshioka K, Seko D, et al. Zmynd17 controls muscle mitochondrial quality and whole-body metabolism. Faseb J. 2018 Sep;32(9):5012–5025. PMID: 29913553.
- Sánchez BJ, Anne-Marie K, Jean-Philippe Leduc-Gaudet T, et al. Depletion of HuR in murine skeletal muscle enhances exercise endurance and prevents cancer-induced muscle atrophy. Nat Commun. 2019 Sep 13;10(1):4171. PMID: 31519904 PMCID: PMC6744452.
- Yang L, Liu Y, Tian X, et al. Cellular repressor of E1A-stimulated genes is a critical determinant of vascular remodeling in response to angiotensinII. Arterioscler Thromb Vasc Biol. 2017 Mar;37(3):485–494. PMID: 28062494.
- Russell AP, Foletta VC, Snow RJ, et al. Skeletal muscle mitochondria: a major player in exercise, health and disease. Biochim Biophys Acta. 2014 Apr;1840(4):1276–1284. PMID: 24291686.
- Lundby C, Jacobs RA. Adaptations of skeletal muscle mitochondria to exercise training. Exp Physiol. 2016 Jan;101(1):17–22. PMID: 26440213.
- Meinild Lundby A-K, Jacobs RA, Gehrig S, et al. Exercise training increases skeletal muscle mitochondrial volume density by enlargement of existing mitochondria and not de novo biogenesis. Acta Physiol (Oxf). 2018 Jan;222(1). PMID: 28580772 https://doi.org/10.1111/apha.12905
- Yin Y, Guoliang L, Yang J, et al. PTENα regulates mitophagy and maintains mitochondrial quality control. Autophagy. 2018;14(10):1742–1760. PMID: 29969932 PMCID: PMC6135630.
- Okamoto T, Ishida R, Yamamoto H, et al. Functional structure and physiological functions of mammalian wild-type HSP60. Arch Biochem Biophys. 2015 Nov 15 PMID: 26427351;586:10–19.
- Lian W-S, Jih-Yang K, Chen Y-S, et al. Chaperonin 60 sustains osteoblast autophagy and counteracts glucocorticoid aggravation of osteoporosis by chaperoning RPTOR. Cell Death Dis. 2018 Sep 17;9(10):938. PMID: 30224697 PMCID: PMC6141469.
- Marino Gammazza A, Macaluso F, Di Felice V, et al. Hsp60 in skeletal muscle fiber biogenesis and homeostasis: from physical exercise to skeletal muscle pathology. Cells. 2018 Nov 22;7(12):224. PMID: 30469470 PMCID: PMC6315887.
- Lian WS, Ko JY, Chen YS, et al. Chaperonin 60 sustains osteoblast autophagy and counteracts glucocorticoid aggravation of osteoporosis by chaperoning RPTOR. Cell Death Dis. 2018 Sep 17;9(10). 938.PMID: 30224697.
- Gomes MJ, Martinez PF, Pagan LU, et al. Skeletal muscle aging: influence of oxidative stress and physical exercise. Oncotarget. 2017 Mar 21;8(12):20428–20440. PMID: 28099900 PMCID: PMC5386774.
- Tieland M, Trouwborst I, Clark BC et al. Skeletal muscle performance and ageing J Cachexia Sarcopenia Muscle 2018Feb;9(1)3–19. PMID: 29151281 PMCID: PMC5803609.
- Landers-Ramos RQ, Prior SJ. The microvasculature and skeletal muscle health in aging. Exerc Sport Sci Rev. 2018 Jul;46(3):172–179. PMID: 29652695 PMCID: PMC6005745.
- Leduc-Gaudet J-P, Reynaud O, Hussain SN, et al. Parkin overexpression protects from ageing-related loss of muscle mass and strength. J Physiol. 2019 Apr;597(7):1975–1991. PMID: 30614532 PMCID: PMC6441909.
- Favaro G, Romanello V, Varanita T, et al. DRP1-mediated mitochondrial shape controls calcium homeostasis and muscle mass. Nat Commun. 2019 Jun 12;10(1):2576. PMID: 31189900 PMCID: PMC6561930.
- Mansueto G, Armani A, Viscomi C, et al. Transcription factor EB controls metabolic flexibility during exercise. Cell Metab. 2017 Jan 10;25(1):182–196. PMID: 28011087 PMCID: PMC5241227.
- Gouspillou G, Godin R, Piquereau J, et al. Protective role of Parkin in skeletal muscle contractile and mitochondrial function. J Physiol. 2018 Jul;596(13):2565–2579. PMID: 29682760 PMCID: PMC6023825.
- Gan Z, Tingting F, Kelly DP, et al. Skeletal muscle mitochondrial remodeling in exercise and diseases. Cell Res. 2018 Oct;28(10):969–980. PMID: 30108290 PMCID: PMC6170448.
- Carter HN, Kim Y, Erlich AT, et al. Autophagy and mitophagy flux in young and aged skeletal muscle following chronic contractile activity. J Physiol. 2018 Aug;596(16):3567–3584. PMID: 29781176 PMCID: PMC6092298.
- Leermakers PA, Kneppers AEM, Schols AMWJ, et al. Skeletal muscle unloading results in increased mitophagy and decreased mitochondrial biogenesis regulation. Muscle Nerve. 2019 Dec;60(6):769–778. PMID: 31495926 PMCID: PMC6900132.
- Triolo M, Hood DA. Mitochondrial breakdown in skeletal muscle and the emerging role of the lysosomes. Arch Biochem Biophys. 2019 Jan;661:66–73. PMID: 30439362.
- Ashrafi G, Schwarz TL. The pathways of mitophagy for quality control and clearance of mitochondria. Cell Death Differ. 2013 Jan;20(1):31–42. PMID: 22743996 PMCID: PMC3524633.
- Kim I, Rodriguez-Enriquez S, Lemasters JJ. Selective degradation of mitochondria by mitophagy. Arch Biochem Biophys. 2007 Jun 15;462(2):245–253. PMID: 17475204 PMCID: PMC2756107.
- Vigié P, Camougrand N. Role of mitophagy in the mitochondrial quality control. Med Sci (Paris). 2017 Mar;33(3):231–237. PMID: 28367808.
- Pickles S, Vigié P, Youle RJ. Mitophagy and quality control mechanisms in mitochondrial maintenance. Curr Biol. 2018 Feb 19;28(4):R170–R185. PMID: 29462587.
- Hood DA, Memme JM, Oliveira AN, et al. Maintenance of skeletal muscle mitochondria in health, exercise, and aging. Annu Rev Physiol. 2019 Feb 10; 81:19–41. PMID: 30216742.
- Ghobrial G, Araujo L. The structure and biological function of CREG. Front Cell Dev Biol. 2018 Oct 26; 6: 136. PMID: 30416997 PMCID: PMC6212480;
- Tian K, Song Y, Zhou K, et al. Chaperonin of group I: upregulation of HSP60 expression in the postnatal rat cochlea and rats with drug-induced hearing loss. Cell Stress Chaperones. 2018 Nov;23(6):1311–1317. PMID: 30196524 PMCID: PMC6237686.
- Cappello F, De Macario EC, Rappa F, et al. Immunohistochemistry of human hsp60 in health and disease: from autoimmunity to cancer. Methods Mol Biol. 2018;1709:293–305. PMID: 29177667
- Guo J, Xiao L, Zhang W, et al. HSP60-regulated mitochondrial proteostasis and protein translation promote tumor growth of ovarian cancer. Sci Rep. 2019 Sep 2;9(1):12628. PMID: 31477750 PMCID: PMC6718431.
- Vilasi S, Bulone D, Bavisotto CC, et al. Chaperonin of group I: oligomeric spectrum and biochemical and biological implications. Front Mol Biosci. 2018 Jan 25;4:99. PMID: 29423396 PMCID: PMC5788889.
- Tan Y, Zhang Y, Huo Z-J, et al. Molecular Cloning of Heat Shock Protein 10 (Hsp10) and 60 (Hsp60) cDNAs from Galeruca Daurica (Coleoptera: chrysomelidae) and their expression analysis. Bull Entomol Res. 2018 Aug;108(4):510–522. PMID: 29081303.
- Ishida R, Okamoto T, Motojima F, et al. Physicochemical properties of the mammalian molecular chaperone HSP60. Int J Mol Sci. 2018 Feb 6;19(2):489. PMID: 29415503 PMCID: PMC5855711.
- Livingston MJ, Wang J, Zhou J, et al. Clearance of damaged mitochondria via mitophagy is important to the protective effect of ischemic preconditioning in kidneys. Autophagy. 2019 Dec;15(12):2142–2162. PMID: 31066324 PMCID: PMC6844514.
- Meng Q, Li BX, Xiao X. Toward developing chemical modulators of Hsp60 as potential therapeutics. Front Mol Biosci. 2018 Apr 20;5:35. PMID: 29732373 PMCID: PMC5920047.
- Xianming D, Jiang X, Tian R, et al. RAB2 regulates the formation of autophagosome and autolysosome in mammalian cells. Autophagy. 2019 Oct;15(10):1774–1786. PMID: 30957628 PMCID: PMC6735470.
- Frezza C, Cipolat S, Scorrano L, et al. Organelle isolation: functional mitochondria from mouse liver, muscle and cultured fibroblasts. Nat Protoc. 2007;2(2):287–295. PMID: 17406588.
- Cardenes N, Corey C, Geary L, et al. Platelet bioenergetic screen in sickle cell patients reveals mitochondrial complex V inhibition, which contributes to platelet activation. Blood. 2014 May 1;123(18):2864–2872. PMID: 24677541 PMCID: PMC4007612.
- Nayak MK, Dhanesha N, Doddapattar P, et al. Dichloroacetate, an inhibitor of pyruvate dehydrogenase kinases, inhibits platelet aggregation and arterial Thrombosis. Blood Adv. 2018 Aug 14;2(15):2029–2038. PMID: 30108111 PMCID: PMC6093723.
- Hariharan N, Zhai P, Sadoshima J. Oxidative stress stimulates autophagic flux during ischemia/reperfusion. Antioxid Redox Signal. 2011 Jun;14(11):2179–2190. PMID: 20812860 PMCID: PMC3085947.
- Dimauro I, Antonioni A, Mercatelli N et al. The early response of αB-crystallin to a single bout of aerobic exercise in mouse skeletal muscles depends upon fiber oxidative features Redox Biol. 2019Jun;24:101183. PMID: 30974319 PMCID: PMC6454247.
- Guang X, Ting L, Chen J, et al. Autosomal dominant retinitis pigmentosa-associated gene PRPF8 is essential for hypoxia-induced mitophagy through regulating ULK1 mRNA splicing. Autophagy. 2018;14(10):1818–1830. PMID: 30103670 PMCID: PMC6135625.
- Guoliang L, Yang J, Yang C, et al. PTEN regulates mitophagy and maintains mitochondrial quality control. Autophagy. 2018;14(10):1742–1760. PMID: 29969932 PMCID: PMC6135630.