
ABSTRACT
Mitochondria are the main cellular energy powerhouses and supply most of the energy in the form of ATP to fuel essential neuronal functions through oxidative phosphorylation (OXPHOS). In Alzheimer disease (AD), metabolic and mitochondrial disruptions are an early feature preceding any histopathological and clinical manifestations. Mitochondrial malfunction is also linked to synaptic defects in early AD. Mitophagy serves as a key cellular quality control mechanism involving sequestration of damaged mitochondria within autophagosomes and their subsequent degradation in lysosomes. However, it remains largely unknown whether mitophagy is involved in the regulation of energy metabolism in neurons, and if so, whether metabolic deficiency in AD is attributed to mitophagy dysfunction. Here we reveal that mitophagy is broadly activated in metabolically enhanced neurons upon OXPHOS stimulation, which sustains high energetic activity by increasing mitochondrial turnover and hence facilitating mitochondrial maintenance. Unexpectedly, in AD-related mutant HsAPP Tg mouse brains, early stimulation of OXPHOS activity fails to correct energy deficits but exacerbates synapse loss as a consequence of mitophagy failure. Excitingly, lysosomal enhancement in AD neurons restores impaired metabolic function by promoting elimination of damaged mitochondria, protecting against synaptic damage in AD mouse brains. Taken together, we propose a new mechanism by which mitophagy controls bioenergetic status in neurons, furthering our understanding of the direct impact of mitophagy defects on AD-linked metabolic deficits and shedding light on the development of novel therapeutic strategies to treat AD by the early stimulation of mitochondrial metabolism combined with elevation of lysosomal proteolytic activity.
Abbreviations: AD: Alzheimer disease; Aβ: amyloid-β; APP: amyloid beta precursor protein; AV: autophagic vacuole; CHX: cycloheximide; CYCS: cytochrome c, somatic; DIV: days in vitro; FRET: Förster resonance energy transfer; Gln, glutamine; LAMP1: lysosomal associated membrane protein 1; LE: late endosome; Mito: mitochondria; Δψm: mitochondrial membrane potential; OCR: oxygen consumption rate; OXPHOS: oxidative phosphorylation; SQSTM1/p62: sequestosome 1; RHEB: Ras homolog, mTORC1 binding; ROS: reactive oxygen species; STX1: syntaxin 1; SYP: synaptophysin; Tg: transgenic; TMRE: tetramethylrhodamine ethyl ester; TEM: transmission electron microscopy; WT: wild type
Introduction
Mitochondria are indisputably critical to neuronal function and survival. Impaired mitochondrial function underlies cognitive decline in aging and is one of the most notable hallmarks of age-associated neurodegenerative diseases [Citation1–8]. Mitochondria are termed the “powerhouses” of the cell, supplying most of cellular ATP through oxidative phosphorylation (OXPHOS) in which high-energy electrons produced by the citric acid cycle are transferred down the mitochondrial respiratory complexes to generate a proton gradient for ATP production. Neurons have particularly high and continuous energy demands but have limited ability to generate ATP through glycolysis in the cytoplasm. Therefore, neurons rely heavily on mitochondria-based ATP supply and are especially sensitive to mitochondrial dysfunction. Mitochondrial damage can cause energy crisis, oxidative stress, and impaired cellular signaling, which have been linked to the pathogenesis of neurodegenerative diseases [Citation2,Citation9–11]. Defects in the elimination of damaged mitochondria could be detrimental to neuronal health. Mitophagy, a selective form of autophagy, is a key mechanism to control mitochondrial quality in neurons through which damaged mitochondria are engulfed by autophagosomes followed by degradation within lysosomes [Citation1,Citation2,Citation8,Citation12,Citation13]. However, the critical understanding of the physiological roles of mitophagy in neurobiology remains very limited.
Mitochondrial function is essential for maintaining neuronal integrity and responsiveness [Citation1–7]. In response to the changes in cellular energetic status, mitochondrial content/mass should be finely tuned to renew and maintain a healthy and active mitochondrial pool in support of high-energy demand [Citation14]. Highly active mitochondria are more sensitive to injury which leads to the loss of their ability to produce ATP. Therefore, in neurons, efficient removal of damaged mitochondria through mitophagy is crucial for the maintenance of bioenergetic homeostasis. However, the nature of the intersection of mitophagy and energy metabolism is poorly understood. An important long-standing question remains to be answered: Does mitophagy regulate bioenergetic status in neurons through modulating mitochondrial quality and quantity?
Mitochondria enact essential reactions of metabolism [Citation15]. Metabolic deficiency has been indicated to play a crucial role in the onset and progression of Alzheimer disease (AD). AD patients display early metabolic deficits associated with impaired mitochondrial function before the emergence of any histopathological or clinical abnormalities [Citation16–18]. Importantly, the earliest features of the onset of the highly prevalent AD have been linked to mitochondrial pathology – aberrant accumulation of damaged mitochondria [Citation2,Citation8,Citation19–21]. Whereas autophagocytosis of mitochondria in vulnerable neurons was shown to be a prominent characteristic in AD patient brains [Citation22–26], recent studies reported that mitophagy stimulation abolished AD pathology and rescued memory deficits in AD models [Citation27,Citation28]. These observations raise a fundamental question: Is mitophagy failure involved in AD-linked metabolic deficiency?
In the current study, we reveal, for the first time, that metabolically enhanced neurons exhibit extensive activation of mitophagy, which promotes maintenance of healthy and active mitochondrial populations by facilitating mitochondrial turnover and thus sustains high energetic activity. Surprisingly, in the primary cortical neurons derived from AD-related mutant human APP (amyloid beta precursor protein; HsAPP) transgenic (Tg) mouse brains, early stimulation of OXPHOS activity intensifies mitophagy stress and fails to rectify energy deficits, resulting in exacerbation of synaptic damage. However, lysosomal enhancement augments mitophagy clearance and restores impaired energetic activity, thus counteracting synapse loss in AD mouse brains. Therefore, these findings provide new insights into the involvement of mitophagy in the control of bioenergetic status in healthy neurons and advance our understanding of the mechanism underlying AD-linked metabolic dysfunction, one of the earliest defects in stricken neurons. Moreover, the current study sheds light on the new strategy of the early stimulation of OXPHOS activity combined with elevation of lysosomal proteolytic activity for the future development of potential AD therapeutics.
Results
High energetic activity of mitochondria induces mitochondrial stress and enhances mitochondrial turnover in neurons
Mitophagy, a selective form of macroautophagy for the removal of damaged mitochondria, is a crucial quality control mechanism for mitochondria in neurons [Citation1,Citation2,Citation8]. Whether mitophagy plays a role in the regulation of bioenergetics in neurons remains poorly understood. We sought to address this important question by determining whether mitophagy is efficiently activated in metabolically enhanced neurons. We stimulated mitochondrial OXPHOS in primary mature cortical neuron cultures by switching from media containing glucose but no glutamine to glucose-free media supplemented with glutamine. As previously reported, cells under glutamine-supplemented conditions exhibited a significant increase in the routine oxygen consumption rate (OCR) compared to the cells grown in the presence of glucose only, suggesting enhanced OXPHOS activity [Citation29–32]. Given that such an effect was shown to reach a saturated level with the concentration of glutamine at between 8 mM and 12 mM [Citation31], we applied 10 mM glutamine to primary neuron cultures. To examine whether glutamine oxidation elevates cellular ATP levels in mature cortical neurons, we first utilized AT1.03, a genetically encoded Förster resonance energy transfer (FRET)-based ATP indicator [Citation33], in which the ε subunit of Bacillus subtilis FoF1-ATP synthase was connected to YFP and CFP. Given that the ATP-bound form increases FRET efficiency, an enhanced FRET signal (YFP:CFP emission ratio) indicates an increase in cellular ATP levels. Stimulation of OXPHOS activity by glutamine supplementation resulted in higher YFP:CFP ratios in both the soma and the axons of neurons than those in control neurons in the absence of glutamine () and (b)), suggesting that glutamine oxidation effectively raises energy production. Alternatively, we applied an engineered fluorescent ATP sensor PercevalHR [Citation34,Citation35]. The fluorescence intensity ratio (F 488nm:F 405nm) of PercevalHR reflects the relative ATP:ADP ratio within cells. Consistent with the findings in neurons expressing AT1.03, OXPHOS stimulation markedly elevated ATP:ADP ratio in neurons (Figure S1A and B). Thus, our data indicate that glutamine supplementation can efficiently elevate mitochondrial energy metabolism in neurons.
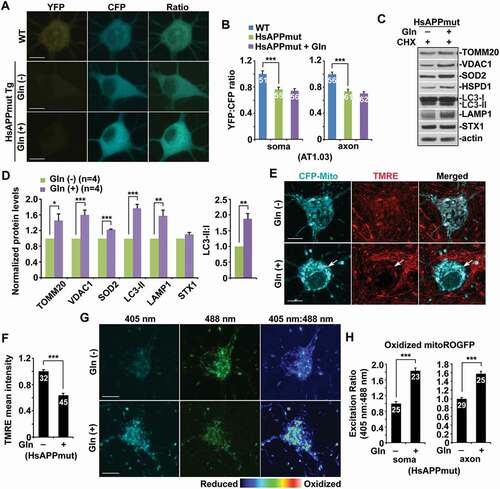
Figure 1. High energetic activity of mitochondria induces mitochondrial stress and enhances mitochondrial turnover in neurons. (a-b) Elevated cytoplasmic ATP levels in cortical neurons under the condition of glutamine-stimulated oxidative phosphorylation (OXPHOS). Representative images (a) and quantitative analysis (b) showing increased cellular ATP levels indicated an enhanced YFP:CFP emission ratio in neurons expressing AT1.03 grown in the media with glutamine for 24 hours. The YFP:CFP emission ratios in the soma and the axons of neurons in the presence of glutamine were normalized to those of neurons in the absence of glutamine. (c-d) Oxidized mitochondria were significantly increased in metabolically enhanced neurons. The fluorescence of MitoROGFP was emitted at 510 nm and excited at 405 nm or 488 nm, respectively. Ratiometric images were generated from fluorescence excited by 405-nm light relative to that excited by 488 nm light. The ratio has been false colored with the indicated heat map, with high intensity indicative of ROGFP fluorescence in a more oxidative environment. Mean fluorescence intensity ratios evoked by the two excitation wavelengths at individual mitochondria in the soma and the axons of neurons under glutamine oxidation were quantified and normalized to those in the control neurons, respectively (d). (e-f) Decreased mitochondrial membrane potential (Δψm) in neurons upon high OXPHOS activity. Cortical neurons transfected with mitochondrial marker CFP-Mito were loaded with Δψm-dependent dye TMRE for 30 min prior to imaging. The mean intensity of TMRE in the soma of neurons grown in glutamine media was normalized to that in control neurons without stimulation of OXPHOS. While arrows represent relatively polarized “healthy” mitochondria marked by both CFP-Mito and TMRE, arrowheads indicate depolarized mitochondria labeled by CFP-Mito but unlabeled by TMRE. Note that neurons treated with glutamine showed reduced mean intensity of TMRE fluorescence relative to that of control neurons. (g-h) Metabolically enhanced neurons exhibited mitophagy activation along with elevated mitochondrial turnover. Cultured cortical neurons at DIV14-15 were treated with glutamine (Gln) (10 mM) for 24 h in the presence of cycloheximide (CHX) (10 μg/mL). Neuron lysates were solubilized, and equal amounts of protein (20 μg) were loaded for sequential detection with antibodies on the same membrane after stripping between applications of each antibody as indicated. Actin was detected as a loading control. The intensities of mitophagy/autophagy-lysosomal markers LC3-II, SQSTM1/p62, and LAMP1 along with mitochondrial proteins TOMM20, VDAC1, and HSPD1/HSP60 were calibrated with actin levels and normalized to those in the control neurons in the absence of glutamine. Note increased levels of LC3-II and LAMP1 in neurons grown in the glutamine media, accompanied by decreased levels of SQSTM1 and mitochondrial proteins TOMM20, VDAC1, and HSPD1. Gln: glutamine. Data were quantified from four independent repeats (h) and a total number of neurons (n) indicated on the top of bars (b, c, and f) from at least four independent experiments. Scale bars: 10 μm. Error bars: SEM. Student’s t test: ***p < 0.001
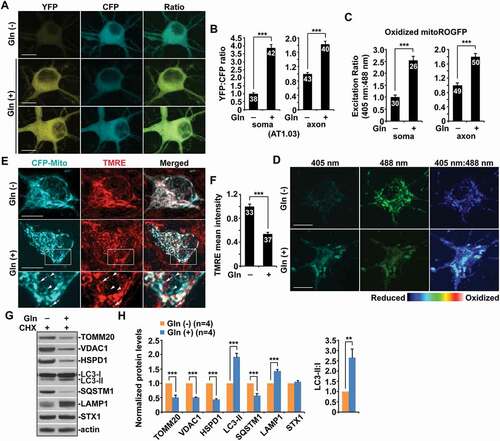
We next assessed mitochondrial oxidation upon stimulation of energetic activity by utilizing Matrix-roGFP, Reduction-Oxidation-sensitive GFP (RoGFP) in the mitochondrial matrix [Citation36,Citation37]. Compared to control neurons under the glycolytic condition, neurons grown in the presence of glutamine exhibited a significant increase in oxidized mitochondria in the soma and the axons () and (d), S1F), suggesting that enhanced OXPHOS activity triggers oxidative damage of mitochondria. We further measured mitochondrial membrane potential (Δψm) by employing tetramethylrhodamine ethyl ester (TMRE), a Δψm-dependent dye, that was loaded into live neurons expressing mitochondrial marker CFP-Mito at 14–15 days in vitro (DIV). Healthy mitochondria accumulate TMRE, thus displaying high TMRE intensity [Citation24,Citation38], whereas damaged mitochondria with depolarized Δψm show reduced TMRE fluorescent intensity although they retain CFP-Mito signals. The majority of CFP-Mito-labeled mitochondria in the soma of control neurons were co-labeled by TMRE, reflecting their electrochemically active status. However, mitochondria in neurons under glutamine oxidation displayed reduced TMRE staining, suggesting depolarized Δψm () and (f)). This data indicates mitochondrial stress in neurons under oxidation conditions, which raises the question as to whether mitophagy is activated in eliminating damaged mitochondria to sustain high energy metabolism. Indeed, in neurons with enhanced OXPHOS, the levels of LC3-II and LAMP1 (lysosomal associated membrane protein 1) were increased while accompanied by reduced SQSTM1/p62 () and (h)). Importantly, mitochondrial proteins were remarkably decreased in the presence of cycloheximide (CHX) (10 μg/ml). This result supports the notion that metabolic enhancement in neurons is coupled with marked mitochondrial damage, and elevated mitochondrial turnover by mitophagy activation is critical to sustaining high OXPHOS activity.
Mitochondrial maintenance involves not only mitophagy-mediated elimination of damaged mitochondria but also mitochondrial renewal through biogenesis [Citation13]. We utilized mitAT1.03 and directly monitored the healthy mitochondrial pool in live neurons by measuring the ATP status of individual mitochondria. mitAT1.03 is localized to the mitochondrial matrix through the N terminus of AT1.03 fusion to a duplex of the mitochondrial targeting signal of cytochrome c oxidase subunit VIII [Citation33]. Compared to the glycolytic condition, glutamine oxidation markedly raised the population of healthy and active mitochondria as evidenced by high ATP levels of mitochondria (Figure S1C and D). Furthermore, we examined the mRNA levels of mitochondrial biogenesis genes PPARGC1A/PGC1α, TFAM, NRF1, and NFE2L22, as previously described [Citation39–42]. OXPHOS stimulation induced significant increases in the mRNA levels of these genes, suggesting that mitochondrial biogenesis is enhanced (Figure S1E). These results collectively indicate that high energy metabolism in neurons drastically activates mitophagy for the removal of damaged mitochondria. Such a mechanism coordinates with mitochondrial biogenesis to promote mitochondrial turnover and maintain high bioenergetic capacity.
OXPHOS stimulation broadly activates mitophagy in neurons
To carefully examine mitophagy activation in neurons upon OXPHOS stimulation, we performed multiple lines of experiments. PRKN/parkin-mediated mitophagy is the most heavily studied and the best-understood mitophagy pathway in which PRKN translocates from the cytoplasm onto damaged mitochondria to facilitate their sequestration within mitophagosomes for subsequent lysosomal degradation [Citation1,Citation8,Citation12,Citation13,Citation43]. We and others have demonstrated that PRKN-mediated mitophagy primarily occurs in the soma of neurons, where degradative lysosomes are highly enriched [Citation24,Citation38,Citation44–51]. Thus, we first assessed PRKN recruitment to mitochondria in neurons under the conditions of low and high energetic activities. Under oxidative conditions, we detected a drastic increase in the percentage of neurons showing PRKN association with mitochondria in the somatodendritic region, relative to neurons under the glycolytic condition () and (b)). This observation suggests that PRKN-mediated mitophagy is induced upon stimulation of OXPHOS activity.
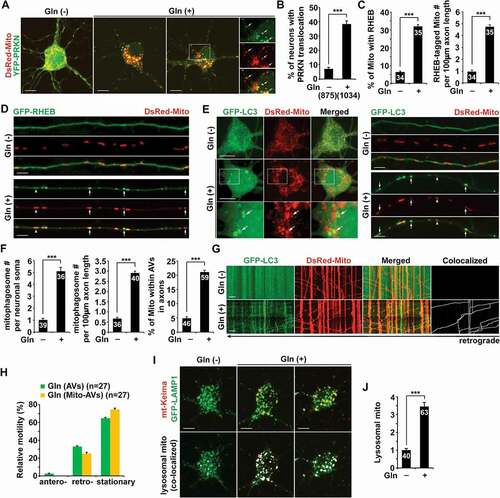
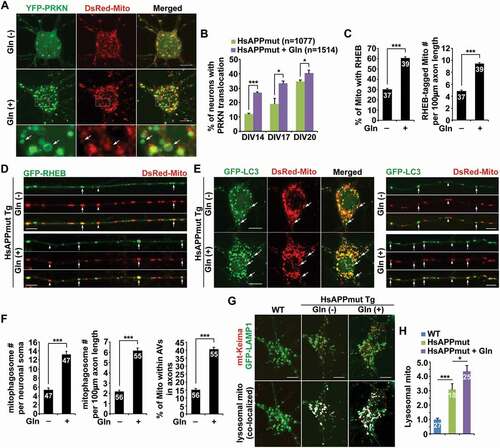
Figure 2. OXPHOS stimulation broadly activates mitophagy in neurons. (a-b) Increased percentage of neurons with PRKN localization to mitochondria in the soma of neurons grown in glutamine media. Cortical neurons were co-transfected with YFP-PRKN/parkin and DsRed-Mito, followed by 24 h incubation with or without glutamine prior to imaging at DIV14-15. (c-d) RHEB is recruited to mitochondria in axons under glutamine oxidation. The percentage of mitochondria (Mito) targeted by RHEB and the number of RHEB-tagged mitochondria in axons in the presence and absence of glutamine were quantified, respectively (c). (e-f) Increased numbers of mitophagosomes in the soma and axons of neurons incubated with glutamine media. Arrows indicate mitophagosomes – LC3-labeled autophagosomes containing engulfed mitochondria. The numbers of mitophagosomes per neuron soma and per 100 μm axon and the percentage of mitochondria within autophagic vacuoles (AVs) in axons were quantified, respectively (f). (g-h) Representative dual-channel kymographs (g) and quantitative analysis (h) showing the robust retrograde movement of mitophagosomes in the axons of metabolically enhanced neurons. The relative motilities of autophagosomes (AVs) and mitophagosomes (Mito-AVs) in axons with and without glutamine treatment were quantified. Cortical neurons expressing GFP-LC3 and DsRed-Mito at DIV14-15 were treated with or without glutamine for 24 h, followed by about 20 min time-lapse recordings. Vertical lines represent stationary organelles. Slanted lines or curves to the right (negative slope) represent anterograde movement; those to the left (positive slope) indicate retrograde movement. An organelle was considered stationary if it remained immotile (displacement ≤ 5 µm). (i-j) Increased mt-Keima-marked acidic mitochondria within LAMP1-indicated lysosomal compartments in the soma of neurons following 24-h glutamine incubation. Visualization of acidic mitochondria is achieved by collecting emission of mt-Keima at 550 nm (i). The mean intensity of acidic mitochondria within lysosomes per neuron was quantified and compared to that in the control neurons (j). Data were quantified from a total number of neurons (n) indicated in parentheses (b and h) or on the top of bars (c, f, and j) from at least four independent experiments. Scale bars: 10 μm. Error bars: SEM. Student’s t test: ***p < 0.001
Activation of PRKN-mediated mitophagy is known to trigger widespread degradation of mitochondrial outer membrane proteins including VDAC1 and TOMM20 via the ubiquitin-proteasomal system preceding mitophagy [Citation52,Citation53]. In metabolically enhanced neurons, we have shown that mitochondrial protein levels are markedly decreased () and (h)). Given robust induction of PRKN-mediated mitophagy (), and S2E), reductions in the levels of VDAC1 and TOMM20 could be attributed to PRKN-induced proteasomal degradation upon mitophagy activation. Importantly, besides mitochondrial outer membrane proteins, we also observed a significant decrease in HSPD1, a mitochondrial matrix protein () and (h)), which was shown to be degraded within lysosomes after engulfment of damaged mitochondria by autophagosomes [Citation52]. Thus, the data collectively indicate that decreases in mitochondrial protein levels under glutamine metabolism could be the result of enhanced mitophagic clearance along with proteasomal degradation.
We have recently revealed that RHEB (Ras homolog, mTORC1 binding) is recruited to damaged mitochondria for their engulfment within mitophagosomes in the axons of neurons. Such a mechanism promotes mitophagic removal of stressed mitochondria from distal axons to maintain mitochondrial homeostasis [Citation25,Citation26]. In line with our previous studies, glutamine oxidation led to enhanced RHEB association with axonal mitochondria as evidenced by an increased percentage of mitochondria targeted by RHEB () and (d)), suggesting activation of RHEB-dependent mitophagy in axons. These imaging data collectively suggest that mitophagy is extensively induced in metabolically enhanced neurons.
To further confirm mitophagy activation, we examined mitophagosome biogenesis in neurons grown in glutamine media. While GFP-LC3 was diffuse in the cytoplasm of control neurons, GFP-LC3 appeared as ring-like structures surrounding mitochondria as mitophagosomes, which were markedly increased in both the soma and the axons of neurons in the presence of glutamine () and (f)). Importantly, mitophagosomes formed in axons display exclusive retrograde movement toward the soma () and (h)). This data indicates that retrograde transport motility of mitophagosomes advances returning stressed axonal mitochondria to the soma for their clearance within lysosomes. Consistently, we observed reduced anterograde transport, but increased retrograde transport, of mitochondria along axons upon OXPHOS stimulation (Figure S2A and B). Thus, while impeded anterograde transport of mitochondria is most likely attributed to activation of PRKN-mediated mitophagy that enhances turnover of Mitochondrial Rho GTPase 1 (Miro1), a component of the adaptor-motor complex essential for KIF5 motors to drive anterograde transport of mitochondria in axons () and (b)) [Citation52,Citation54–57], increased mitochondrial retrograde movement could be the result of RHEB-associated mitophagy induction () and (d)).
We next determined the kinetics of mitophagy induction at 8 h and 18 h after glutamine incubation, respectively. As early as 8 h following the treatment, we detected increased levels of LC3-II and LAMP1 along with reduced SQSTM1 (Figure S2C and D), suggesting an early and robust response of mitophagy to mitochondrial stress under glutamine oxidation. Furthermore, we isolated mitochondria-enriched fractions from neurons supplemented with and without glutamine. The purity of mitochondrial fractions was confirmed by relative enrichment of mitochondrial protein VDAC1 and by less abundance of cytosolic protein GAPDH. When equal amounts of post-nuclear supernatants (P), mitochondrial fractions (M), and cytosolic supernatant (S) were loaded, increased levels of PRKN and RHEB along with LC3-II were detected in mitochondrial fractions in neurons under oxidation conditions as compared to those in control neurons under the glycolytic condition (Figure S2E). This result suggests that OXPHOS stimulation activates both PRKN- and RHEB-mediated mitophagy pathways, which is consistent with our light imaging data ()). These observations indicate that high energy metabolism in neurons promotes mitochondrial turnover by markedly enhancing mitophagy-mediated elimination of damaged mitochondria.
It has been well established that mitophagic clearance mostly occurs in the soma of neurons, where mature lysosomes are mainly located [Citation25,Citation38,Citation44,Citation45,Citation48,Citation50,Citation58,Citation59]. Thus, we next assessed mt-Keima Red-labeled acidic mitochondria within degradative organelles in live neurons in the presence and absence of glutamine [Citation60,Citation61]. Acidic mitochondria indicated by mt-Keima Red were mainly detectable in the soma and co-localized with the lysosome, suggesting that these damaged mitochondria are trapped within lysosomes for degradation [Citation25,Citation48]. In accord with our biochemical evidence () and (h); S2A and B), sequestration of acidic mitochondria within LAMP1-labeled somatic lysosomes was remarkably increased in neurons after stimulating OXPHOS activity () and (j)). Therefore, these observations suggest that mitophagy clearance within lysosomes facilitates the maintenance of a healthy mitochondrial pool to sustain enhanced metabolism in neurons.
Glutamine supplementation induces extensive mitophagy activation in mouse brains
Next, we addressed whether metabolic enhancement activates mitophagy in mouse brains. Previous studies have shown that supplementation of 4% glutamine induces neuroprotective effects in mice with no toxicity [Citation62,Citation63]. We supplemented WT mice at 4 months of age with 4% glutamine for 8 weeks, followed by the OCR measurement in mitochondria freshly isolated from the cortices of these mouse brains. Mitochondrial basal and maximal respiration rates along with ATP production-linked respiration were significantly increased in mice after glutamine supplementation as compared to those of control mice fed with regular water ()), suggesting that glutamine oxidation effectively elevates mitochondrial energetic activity in mouse brains. To determine whether mitophagy is activated in these metabolically enhanced mouse brains, we conducted immunostaining with antibodies against CYCS (cytochrome c, somatic), a mitochondrial intermembrane space protein, and the autophagy marker LC3. In control mouse brains, LC3 appeared as a diffuse pattern in a non-lipidated LC3-I form and was predominantly present in the cytoplasm of hippocampal neurons. However, in mouse brains supplemented with glutamine, LC3 displayed as vesicular structures indicating LC3-II-decorated autophagic vacuoles (AVs). A significant portion of AVs was co-labeled by the CYCS antibody in the soma of hippocampal neurons () and (c)), suggesting that these vesicles represent mitophagosomes containing engulfed mitochondria. We observed similar results when using alternative antibodies against HSPD1/HSP60, a mitochondrial matrix protein, and the autophagy marker SQSTM1 (Figure S3A and B). Moreover, glutamine treatment significantly increased mitochondrial recruitment to lysosomes in the hippocampal neurons of WT mouse brains () and (e)), suggesting that mitophagic clearance within lysosomes is elevated under oxidative metabolism. These observations are in line with the results from cultured neurons and consistently indicate mitophagy activation in mouse brains following glutamine supplementation.
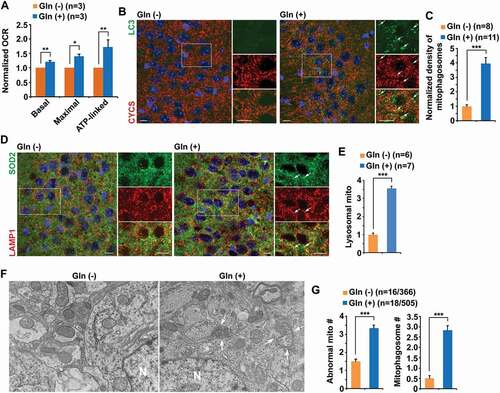
Figure 3. Glutamine supplementation induces extensive mitophagy activation in mouse brains. (a) Seahorse mitochondrial stress assay using freshly isolated cortical mitochondria from six-month-old WT mouse brains after two-month glutamine treatment showing elevated mitochondrial energetic activity, as evidenced by increased basal, maximal, and ATP-linked respiration rates. (b-c) Representative images (b) and quantitative analysis (c) showing an increase in the number of mitophagosomes co-labeled by antibodies against LC3 and CYCS (cytochrome c, somatic) in the hippocampal CA3 regions of mouse brains with OXPHOS stimulation. Note that mitophagosomes were not readily observed in control mouse brains. The mean intensity of co-localized pixels that represent mitophagosomes was quantified and normalized to that of control mice supplemented with water. (d-e) Oxidative metabolism increased mitochondrial recruitment to lysosomes in the hippocampus of mouse brains. The mean intensity of co-localized pixels that represent SOD2-marked mitochondria within lysosomes labeled by LAMP1 was quantified and normalized to that of control mice fed with water (e). (f-g) Representative TEM images (f) and quantitative analysis (g) showing a striking increase of AVs and mitophagosome-like structures – AVs containing engulfed mitochondria in the soma of hippocampal neurons of mouse brains under glutamine oxidation. Note that mitophagosome-like structures were not readily detected in control mouse brains. Quantitative analysis was expressed as the averaged numbers of morphologically abnormal mitochondria with swollen shape and loss of cristae integrity (asterisks) and mitochondria within AV-like organelles (arrows) per neuronal perikaryal (g). N indicates the nucleus in the soma of neurons. The densities of mitophagosomes or mitolysosomes per section (320 μm × 320 μm)) were quantified from a total number of brain slice sections (n) indicated in parentheses (c and e) from three pairs of mice treated with and without glutamine. Data were quantified from a total number of cells and mitochondria (n) indicated in parentheses (g). Scale bars: 10 µm (b and d) and 200 nm (f). Error bars represent SEM. Student’s t test: *p < 0.05; **p < 0.01; ***p < 0.001
To confirm mitophagy activation at the ultrastructural level, we performed transmission electron microscopy (TEM) analysis. In mouse brains under glutamine oxidation, the number of abnormal mitochondria, characterized by swollen round shape and perturbed or loss of cristae organization, in the soma of hippocampal neurons was significantly increased, relative to that in the neurons of control mouse brains fed with water () and (g)). Indeed, we frequently detected mitophagosomes – initial AVs (AVi)-like structures engulfing or containing abnormal mitochondria () and (g)). The average number of mitophagosomes – mitochondria sequestered within AV-like organelles – per neuronal somata was markedly increased in the brains of mice supplemented with glutamine ()). Thus, our in vivo data are in agreement with the in vitro findings in cultured primary neurons and consistently suggest that mitophagy is broadly activated in neurons with high energy metabolism. To be noted, there were more mitochondria including morphologically normal (healthy) mitochondria in metabolically enhanced neurons as compared to those in control neurons in the absence of glutamine (Figure S3C), which is consistent with our in vitro evidence showing elevated healthy and active mitochondrial population and increased mitochondrial biogenesis upon OXPHOS stimulation (Figure S1C-E).
Early OXPHOS stimulation exacerbates synaptic damage along with bioenergetic deficiency and mitophagy stress in AD-related mutant HsAPP Tg mouse brains
Synaptic defects occur early in AD brains and correlate with memory deficits. Previous studies reported that early deficits in synaptic mitochondria were involved in the development of synaptic degeneration in AD [Citation64]. Given the fact that metabolic dysfunction plays a crucial role in the early pathophysiology of AD [Citation16], we next determined whether early OXPHOS stimulation reverses energy deficits and thus counteracts synaptic damage in AD mouse brains. Synapse loss has been well established at early disease stages in AD-related mutant HsAPP Tg (J20) mouse line [Citation25,Citation65–68]. Before the onsets of mitochondrial abnormalities and synaptic defects, we supplemented four-month-old mutant HsAPP Tg (J20) mice with glutamine and then examined the impact of early OXPHOS stimulation on synaptic pathology 8 weeks after the treatment. Consistent with previous studies [Citation65–68], mutant HsAPP mice at the age of 6 months exhibited a reduced density of synaptophysin (SYP)-marked presynaptic terminals in the hippocampal mossy fibers as compared to that of WT mouse brains () and (b)). Surprisingly, synapse loss was intensified in AD mouse brains supplemented with glutamine, as evidenced by decreases in mean intensity and area of SYP-marked presynaptic terminals () and (b)). Importantly, presynaptic densities showed no detectable change in WT mouse brains under oxidative conditions () and 4(b)), indicating that stimulation of energetic activity has no impact on synaptic integrity in WT neurons. This result raises the possibility that glutamine supplementation in AD mouse brains fails to correct energy deficits. We further examined the OCR in mitochondria freshly isolated from the cortices of AD mouse brains with and without glutamine treatment. Indeed, there were no increases in the rates of basal, maximal, and ATP-linked respirations in AD mouse brains under glutamine metabolism ()), suggesting energetic deficiency upon stimulation of OXPHOS.
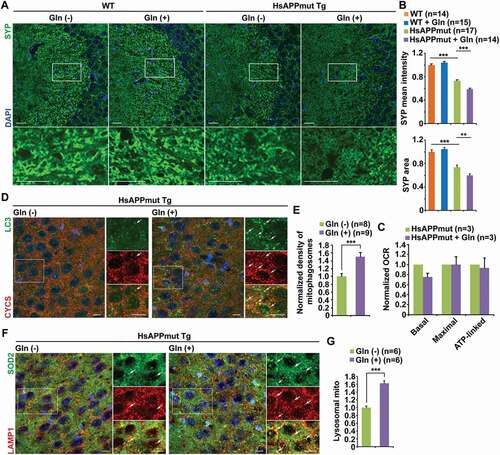
Figure 4. Early OXPHOS stimulation exacerbates synaptic damage along with bioenergetic deficiency and augmentation of mitophagy stress in AD-related mutant HsAPP Tg mouse brains. (a-b) Augmentation of synapse loss in the hippocampal mossy fibers of AD mouse brains after glutamine supplementation. The mean intensity and the area of synaptophysin (SYP)-labeled presynaptic terminals were quantified and compared to those in the WT mouse brains fed with water, respectively (b). (c) Seahorse mitochondrial stress assay using freshly isolated cortical mitochondria from the brains of six-month-old mutant HsAPP Tg mice fed with glutamine for two months showing no increase in mitochondrial metabolism. (d-e) Representative images (d) and quantitative analysis (e) showing enhanced mitophagosome accumulation in the hippocampal neurons of mutant HsAPP mouse brains treated with glutamine. The density of mitophagosomes in the hippocampal CA3 regions per section (320 μm × 320 μm) was quantified and normalized to that of littermate control AD mice supplemented with water (e). (f-g) Glutamine metabolism intensifies mitochondrial accumulation within lysosomes in the hippocampal CA3 regions of AD mouse brains. The mean intensity of co-localized pixels that represent lysosomal retention of mitochondria was quantified and normalized to that of control AD mice supplemented with water (g). Data were quantified from a total number of brain slice sections (n) indicated in parentheses (b, e, and g) from three pairs of WT and mutant HsAPP Tg mice with and without glutamine treatment. Scale bars: 25 µm (a); 10 µm (d and f). Error bars represent SEM. Student’s t test: **p < 0.01; ***p < 0.001
We have demonstrated that mitophagy activation facilitates sustaining high energy metabolism by enhancing mitochondrial turnover in healthy neurons under oxidation conditions. Next, we determined whether mitophagy is activated in AD mouse brains supplemented with glutamine. Our previous studies have revealed mitophagy stress in the brains of this AD mouse model at basal conditions [Citation24,Citation25,Citation48]. Glutamine oxidation augmented mitophagic accumulation in the hippocampal CA3 region of AD mouse brains, as evidenced by substantial increases in mitophagosomes () and (e), S4A and B). Moreover, our previous work showed lysosomal defects in the elimination of damaged mitochondria as the consequence of protease deficits within lysosomes in AD neurons [Citation25,Citation48]. In the brains of AD mice treated with glutamine, mitochondria were increasingly retained within lysosomes () and (g)), indicating that lysosomal failure curbs mitophagy clearance. Collectively, these findings suggest the possibility that deficiency in energetic enhancement upon OXPHOS stimulation in AD mouse brains could be attributed to impaired mitochondrial turnover as the consequence of defects in mitophagy clearance, which exacerbates mitophagy stress.
Bioenergetic deficiency coupled with impaired mitochondrial turnover in AD neurons
To test this possibility, we utilized primary cortical neurons derived from AD-related mutant HsAPP Tg mouse brains and examined cellular ATP levels under glutamine oxidation conditions. Compared to WT littermate controls, AD neurons displayed decreased ATP levels under basal conditions () and (b)). Importantly, we failed to detect any increase in energy production in AD neurons incubated with the glutamine media, as evidenced by no increase in YFP:CFP ratio that indicates cellular ATP production within cells expressing AT1.03 () and (b)). This result is consistent with our in vivo observations in mutant HsAPP Tg mouse brains ()) and allows us to further address whether defective mitochondrial turnover leads to energetic failure in AD neurons. In contrast to reduced levels of mitochondrial proteins in WT neurons () and 1(h)), OXPHOS stimulation in AD neurons markedly increased mitochondrial protein levels () and (d)), suggesting the view that mitochondrial turnover is impaired. We further tested this view by first examining Δψm in AD neurons in the presence and absence of glutamine. Mitochondria in AD neurons displayed depolarized Δψm as compared to those in WT neurons under the basal condition (Figure S5A). Upon the stimulation of energetic activity, Δψm depolarization was enhanced in AD neurons () and (f)). This data is consistent with the augmentation of oxidatively damaged mitochondrial accumulation () and (h), S5B), indicating that bioenergetic deficiency in AD neurons is likely attributed to impaired mitochondrial turnover. We have shown that mitophagy plays a critical role in renewing mitochondrial populations in metabolically enhanced healthy neurons. Glutamine treatment in AD neurons increased levels of LC3-II and LAMP1 () and (d)). Thus, these results raise the possibility that stimulating OXPHOS activity augments mitophagy in AD neurons, increasingly targeting stressed mitochondria for autophagy.
Figure 5. Bioenergetic deficiency coupled with impaired mitochondrial turnover in AD neurons. (a-b) Representative images (a) and quantitative analysis (b) showing that OXPHOS stimulation failed to elevate energy metabolism in cultured cortical neurons derived from mutant HsAPP Tg mouse brains. Note no increase in cellular ATP levels in mutant HsAPP neurons following glutamine incubation. The YFP:CFP emission ratios in the soma and the axon of mutant HsAPP neurons grown in media with and without glutamine were normalized to those in the neurons from WT littermate controls, respectively. (c-d) Defective mitochondrial turnover in AD neurons upon stimulating OXPHOS activity. Note increased levels of LC3-II and LAMP1 along with TOMM20, VDAC1, and SOD2 in mutant HsAPP neurons treated with glutamine as compared to those of control mutant HsAPP neurons in the absence of glutamine. Data were quantified from four independent experiments. (e-f) Augmentation of Δψm depolarization in AD neurons under glutamine oxidation. Note that the mean intensity of TMRE fluorescence was decreased in the soma of mutant HsAPP neurons in the presence of glutamine relative to that of control neurons under the glycolytic condition. (g-h) OXPHOS stimulation exacerbated the accumulation of oxidized mitochondria in AD neurons. Mean fluorescence intensity ratios evoked by the two excitation wavelengths (405 nm or 488 nm) at individual mitochondria in the soma and the axons of AD neurons incubated with glutamine were quantified and normalized to those of control AD neurons grown in media without glutamine, respectively (g). Data were quantified from a total number of neurons (n) indicated on the top of bars (b, f, and g) from at least four independent repeats. Scale bars: 10 μm. Error bars: SEM. Student’s t test: *p < 0.05; **p < 0.01; ***p < 0.001
Augmented mitophagy activation but impaired lysosomal clearance in AD neurons upon stimulation of OXPHOS activity
Mitophagy abnormalities in AD have been indicated in several recent studies [Citation22–28,Citation48,Citation69]. Thus, we next sought to addressed whether bioenergetic dysfunction in AD neurons is caused by mitophagy defects. We first examined PRKN-mediated mitophagy in AD neurons grown in the media with and without glutamine. Consistent with our previous studies [Citation24], AD neurons exhibited mitophagy activation in the absence of glutamine, as reflected by increased PRKN localization to mitochondria. Importantly, glutamine treatment resulted in an additional increase in the percentage of neurons showing PRKN translocation onto mitochondria () and (b)), suggesting that mitochondrial stress under oxidation conditions augments PRKN-mediated mitophagy in the soma of AD neurons. Besides, our recent study documented increased initiation of RHEB-mediated mitophagy in the axons of AD neurons [Citation25]. Stimulating OXPHOS activity further enhanced RHEB-mediated mitophagy in AD axons, as reflected by an increase in the number of mitochondria tagged by RHEB () and (d)).
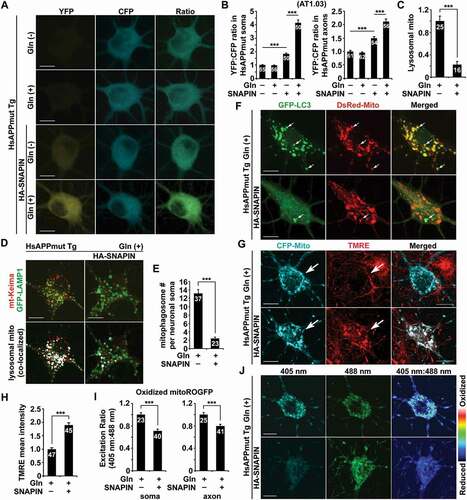
Figure 6. Augmented mitophagy activation but impaired lysosomal clearance in AD neurons upon stimulation of OXPHOS activity. (a-b) Glutamine treatment intensified PRKN-mediated mitophagy in mutant HsAPP Tg neurons, as reflected by additional increases in the percentage of neurons showing PRKN association with mitochondria, compared to that of control neurons grown without glutamine. (c-d) Increased activation of RHEB-dependent mitophagy in mutant HsAPP axons incubated with glutamine. Note a marked elevation in mitochondria targeted by RHEB in glutamine-treated AD axons as compared to control AD axons in the absence of glutamine. (e-f) Mitophagy stress was exacerbated in AD neurons under oxidative conditions. Note increased numbers of mitophagosomes in the soma and the axons of mutant HsAPP neurons after glutamine supplementation. (g-h) Enhanced retention of mt-Keima-labeled acidic mitochondria within LAMP1-marked lysosomes in mutant HsAPP neurons following 24-h glutamine incubation. Data were quantified from a total number of neurons (n) indicated in parentheses (b) or on the top of bars (c, f, and h) from more than three independent repeats. Scale bars: 10 μm. Error bars: SEM. Student’s t test: *p < 0.05; ***p < 0.001
We next assessed whether enhanced mitophagy activation efficiently targets stressed mitochondria for autophagy in AD neurons under glutamine oxidation. In agreement with our previous studies [Citation24,Citation25], AD neurons exhibited mitophagic accumulation at the basal level, which was significantly intensified under oxidation conditions as evidenced by marked increases of mitophagosomes in the soma and the axons of AD neurons () and (f)). These results indicate that stimulation of OXPHOS augments PRKN-mediated mitophagy in the soma and RHEB-dependent mitophagy in the axons of AD neurons. Moreover, contrary to dominant retrograde transport of mitophagosomes in WT axons () and (h)), their retrograde movement was halted in AD axons supplemented with glutamine (Figure S6A and B). Such a defect likely exacerbated mitophagy stress in AD axons, leading to a deficiency in response to metabolic stimulation. Consistently, the recruitment of PRKN and RHEB along with LC3-II to mitochondria was drastically elevated in AD neurons after glutamine treatment (Figure S6C).
We next determined lysosomal clearance of damaged mitochondria in AD neurons grown in the presence of glutamine. Our previous study uncovered lysosomal protease deficits and impaired lysosomal proteolysis in these mutant HsAPP Tg neurons [Citation25,Citation48]. Consistently, compared to WT littermate control neurons, we detected increased lysosomal retention of acidic mitochondria marked by mt-Keima in the soma of AD neurons () and (h)), which was exacerbated in AD neurons under glutamine oxidation. These observations support the notion that lysosomal failure intensifies mitophagy stress and hence curbs mitochondrial turnover in AD neurons upon OXPHOS stimulation. Our recent studies provided direct evidence showing that mitophagy is critical for synaptic maintenance by regulating the integrity of mitochondria at synapses [Citation25,Citation26]. These findings allow us to propose that the stimulation of OXPHOS activity in AD neurons augments mitophagy defects and mitochondrial stress, thus triggering bioenergetic deficiency and exacerbating synaptic damage associated with AD.
Lysosomal enhancement restores mitochondrial energetic activity in AD neurons
We have previously uncovered a mechanism through which SNAPIN regulates autophagy-lysosomal function in neurons [Citation49,Citation70]. SNAPIN serves as an adaptor of dynein motors and SNAPIN-dynein-mediated retrograde transport of late endosomes (LEs) promotes axonal retromer trafficking to the soma, facilitating the delivery of lysosomal proteases to lysosomes [Citation48]. Overexpression of SNAPIN in AD neurons rescues lysosomal protease deficits and restores lysosomal proteolytic activity, thereby enhancing mitophagy clearance [Citation25,Citation48]. Given lysosomal defects in the elimination of damaged mitochondria under glutamine oxidation, we next determined whether SNAPIN-enhanced lysosomal function ameliorates the bioenergetic deficiency in AD neurons by promoting lysosomal degradation of damaged mitochondria. Strikingly, compared to control AD neurons without overexpression of SNAPIN or in the absence of glutamine, increasing SNAPIN levels drastically raised cellular ATP levels in the soma and the axons of AD neurons following glutamine incubation, as reflected by an elevated YFP:CFP ratio indicated by AT1.03 () and (b)). We detected similar results in AD neurons expressing another ATP indicator, PercervalHR (Figure S7A). Importantly, this rescue effect was accompanied by a marked reduction of lysosomal retention of acidic mitochondria () and (d)), suggesting SNAPIN-enhanced clearance of damaged mitochondria within lysosomes.
Figure 7. Lysosomal enhancement restores mitochondrial energetic activity in AD neurons. (a-b) Representative images (a) and quantitative analysis (b) showing that overexpression of SNAPIN elevated cellular ATP levels in mutant HsAPP Tg neurons grown in glutamine media. The YFP:CFP ratios in the soma and the axons of AD neurons were normalized to those in control AD neurons expressing vector in the absence of glutamine incubation, respectively (b). (c-d) Increasing SNAPIN levels decreased acidic mitochondrial retention within lysosomes in the soma of mutant HsAPP neurons treated with glutamine. (e-f) Attenuation of mitophagic accumulation in mutant HsAPP neurons with elevated SNAPIN expression under glutamine oxidation, as evidenced by a reduction in the number of mitophagosomes (e). (g-h) OXPHOS stimulation increases Δψm in AD neurons with SNAPIN overexpression. The mean intensity of TMRE fluorescence in the soma of SNAPIN-expressed mutant HsAPP neurons was measured and normalized to that in control mutant HsAPP neurons (h). (i-j) SNAPIN elevation ameliorated aberrant accumulation of oxidatively damaged mitochondria in AD neurons in the presence of glutamine. Mean fluorescence intensity ratios evoked by the two excitation wavelengths (405 nm or 488 nm) at individual mitochondria in the soma and the axons of AD neurons expressing SNAPIN were quantified and normalized to those of control AD neurons, respectively (i). Data were quantified from a total number of neurons (n) indicated on the top of bars (b, c, e, h, and i) from at least four independent repeats. Scale bars: 10 μm. Error bars: SEM. Student’s t test: ***p < 0.001
We next addressed whether SNAPIN-induced rescue effects on bioenergetic deficiency in AD neurons are attributed to increased mitochondrial turnover by enhancing the elimination of damaged mitochondria. Indeed, mitophagic accumulation was attenuated in AD neurons with overexpression of SNAPIN () and (f)), suggesting that SNAPIN-enhanced protease trafficking to lysosomes promotes mitophagy clearance. In line with our recent studies [Citation25,Citation26], elevated SNAPIN expression facilitated the removal of damaged mitochondria from distal axons by increasing retrograde movement of mitophagosomes and hence reduces mitophagy stress in distal AD axons (Figures S7B-E). We further assessed whether lysosomal enhancement ameliorates the accumulation of damaged mitochondria in AD neurons under glutamine oxidation. While Δψm was significantly elevated () and (h)), the levels of oxidized mitochondria were remarkably decreased in the soma and the axons of AD neurons with SNAPIN elevation () and (j), S7F). Together, these results consistently indicate that SNAPIN-enhanced lysosomal clearance of damaged mitochondria promotes mitochondrial turnover, thus restoring glutamine-stimulated bioenergetic activity in AD neurons.
Bioenergetic stimulation combined with enhancement of mitophagy clearance counteracts synapse loss in AD mouse brains
To determine the in vivo rescue effects on bioenergetic deficits in AD mouse brains, we conducted bilateral injection of AAV-mCherry-SNAPIN into the hippocampus, an established in vivo delivery procedure by us and others [Citation25,Citation46,Citation65,Citation66,Citation68,Citation71,Citation72]. Assessment of AAV-injected mouse brains revealed widespread expression of AAV-mCherry or AAV-mCherry-SNAPIN in the hippocampal regions ()). We further verified SNAPIN expression in the hippocampi of AAV-injected mouse brains by western blot analysis. SNAPIN expression was dramatically increased in mutant HsAPP mouse brains at the age of 6–7 months after injection with AAV-mCherry-SNAPIN (Figure S8A), relative to that of control mutant HsAPP mouse brains expressing AAV-mCherry. Next, we examined whether overexpression of SNAPIN protects against AD-associated synapse loss following stimulation of OXPHOS. Indeed, mutant HsAPP mouse brains transduced with AAV-mCherry-SNAPIN exhibited pronounced increases in the density and the area of SYP-labeled presynaptic terminals () and (c)). We next addressed whether such protective effects are attributed to SNAPIN-enhanced lysosomal clearance of damaged mitochondria in AD neurons. Excitingly, increasing SNAPIN levels significantly ameliorated aberrant accumulation of mitophagosomes in the hippocampal neurons of AD mouse brains supplemented with glutamine as compared to control AD brains infected with AAV-mCherry (Figure S8B and C). Moreover, attenuation of mitophagic accumulation was accompanied by a significant reduction in lysosomal retention of mitochondria () and (e)), suggesting SNAPIN-enhanced elimination of damaged mitochondria within lysosomes. Our TEM analysis has further demonstrated that, while AD neurons displayed aberrant accumulations of morphologically abnormal (damaged) mitochondria and mitophagosomes under basal conditions, such defects were exacerbated upon stimulation of OXPHOS activity () and (g)). Importantly, overexpression of SNAPIN significantly decreased the number of damaged mitochondria, coupled with amelioration of mitophagic accumulation in the hippocampal neurons of AD mouse brains () and (g)). Collectively, these findings indicate that SNAPIN-enhanced lysosomal function alleviates mitochondrial stress by promoting mitophagic clearance in AD neurons under oxidative metabolism. Therefore, combined with the observations in vitro in cultured AD neurons (), these results suggest a critical role of mitophagy failure in the metabolic deficiency linked to AD, and such a defect is involved in the pathogenesis of synaptic defects in AD brains.
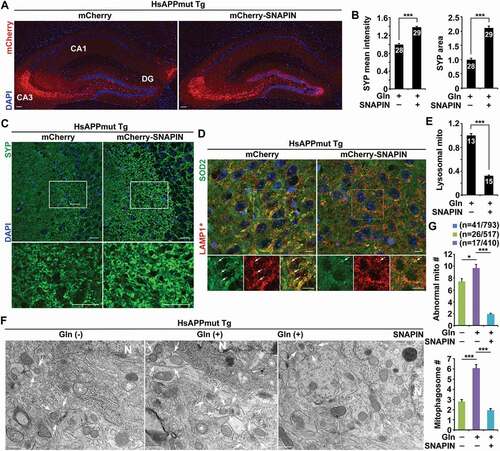
Figure 8. Bioenergetic stimulation combined with enhancement of mitophagy clearance counteracts synapse loss in AD mouse brains. (a) Representative images showing gene delivery into the hippocampus of mutant HsAPP Tg mouse brains injected with AAV-mCherry or AAV-mCherry-SNAPIN. (b-c) Quantitative analysis (b) and representative images (c) showing that glutamine supplementation increases the density of presynaptic terminals in the hippocampal mossy fibers of AD mouse brains after injection of AAV-mCherry-SNAPIN. Blue indicates the signal of DAPI staining. The mean intensity and area of SYP-labeled presynaptic terminals were quantified and normalized to those of control AD mouse brains expressing AAV-mCherry, respectively (b). (d-e) Overexpression of SNAPIN decreased mitochondrial retention within lysosomes in the AAV-mCherry-SNAPIN-infected brains of AD mice supplemented with glutamine. The mean intensity of co-localized pixels that represent lysosomal mitochondria was quantified and normalized to control AD mouse brains transduced with AAV-mCherry (e). LAMP1*: color is converted from blue to red for better contrast (d). (f-g) Representative TEM images (f) and quantitative analysis (g) showing that SNAPIN elevation reduced the numbers of damaged mitochondria and mitophagosomes in the soma of hippocampal neurons of AD mouse brains under glutamine metabolism. Note that glutamine treatment exacerbated abnormal mitochondrial retention and mitophagosome accumulation in AD mouse brains injected with AAV-mCherry. Quantitative analysis was expressed as the numbers of morphologically abnormal mitochondria with swollen shape and loss of cristae integrity (asterisks) and mitochondria within AV-like organelles (arrows) per neuronal perikaryal (g). N indicates the nucleus in the soma of neurons. Data were quantified from a total number of brain slices sections (n) indicated on the top of bars (b and e) and a total number of cells and mitochondria (n) indicated in parentheses (g) from two pairs of mutant HsAPP Tg mice with AAV injection. Scale bars: 250 µm (a), 10 µm (c and d), and 200 nm (f). Error bars represent SEM. Student’s t test: *p < 0.05; ***p < 0.001
Discussion
Neurons have limited ability to generate ATP through glycolysis in the cytoplasm and hence depend mainly on mitochondrial OXPHOS for energy production. Mitochondria with high energy metabolism are more vulnerable to various insults and injuries. Thus, mitochondrial quality and quantity should be tightly controlled to maintain bioenergy homeostasis, particularly in neurons with high energy demand. Given that mitophagy is the only known cellular pathway through which entire mitochondria can be eliminated within cells, the current study sought to address the intersection of mitophagy and bioenergetic status in healthy and diseased neurons. AD patients exhibit early metabolic and mitochondrial deficits preceding the onset of histopathological or clinical features [Citation16]. Such defects have been proposed to play an essential role in the pathogenesis of AD [Citation16,Citation18,Citation73–76]. Our study provides the first indication that mitophagy acts as a key player modulating bioenergetic capacity in neurons and that mitophagy dysfunction is involved in AD-linked metabolic deficiency.
PRKN-mediated mitophagy is initiated with PRKN translocation onto damaged mitochondria followed by their sequestration within autophagosomes [Citation12,Citation13,Citation43]. Upon CCCP-induced Δψm depolarization, we and others have shown that PRKN-mediated mitophagy primarily occurs in the soma of neurons, where degradative lysosomes are highly enriched [Citation24,Citation38,Citation45–47,Citation49,Citation58,Citation77–83]. Our recent work further uncovered that, in axons, RHEB-dependent mitophagy targets damaged mitochondria for autophagy. By coordination with retrograde transport, mitophagosomes can be removed from distal axons for lysosomal degradation in the soma [Citation25,Citation26]. Our current studies reveal that metabolic enhanced neurons exhibit robust mitochondrial stress, which drastically activates these two mitophagy pathways in the soma and the axons of neurons and promotes mitochondrial turnover. Such a mechanism is critical for neurons to maintain bioenergetic capacity and thus sustain high metabolic activity. These new findings provide direct and strong evidence that mitophagy participates in the regulation of bioenergetics in neurons by facilitating the maintenance of a functional mitochondrial pool.
Mitochondrial perturbation has been indicated as a hallmark of AD. Mitochondrial malfunction, oxidative stress, and mitochondrial DNA changes are prominent pathological features in AD brains [Citation2,Citation3,Citation8,Citation69,Citation84–98]. Earlier studies revealed mitophagy alterations in AD patient brains, as evidenced by autophagic accumulation of mitochondria in vulnerable neurons [Citation22–26,Citation69]. Our previous studies have shown that PRKN-mediated mitophagy is activated at early disease stages in AD patient brains and mouse models [Citation24,Citation48]. Moreover, our recent work documented that increased initiation of RHEB-mediated mitophagy, coupled with impeded retrograde transport, leads to mitophagy stress and thereby augments mitochondrial deficits at the synaptic terminals of AD-related mutant HsAPP neurons [Citation25,Citation26]. In the current study, we addressed whether early metabolic stimulation reverses energy deficits and protects against synapse loss, an early defect associated with AD. We demonstrate that the PRKN- and RHEB-dependent pathways are augmented in AD neurons upon stimulating OXPHOS activity. However, lysosomal failure impairs mitophagy clearance and consequently halts mitochondrial turnover needed for the renewal of mitochondrial populations, leading to energetic deficiency and exacerbation of synaptic damage in AD mouse brains. Therefore, these results collectively support the notion that mitophagy deficits in AD neurons disrupt energetic capacity and induce metabolic dysfunction. Given the fact that mitophagy failure is an early event in AD brains [Citation24,Citation27], the observations from the current work further indicate that such a defect plays an essential role in the metabolic disruption linked to early AD.
Mitophagy is a lysosomal degradation pathway. In neurons, proteolytically active lysosomes are highly enriched in the soma [Citation38,Citation46–51,Citation81,Citation82]. We and others have shown that defects in lysosomal proteolysis result in lysosomal accumulation of undigested substrates, including damaged mitochondria, in the neuronal soma [Citation38,Citation46–51]. In line with the somatic localization of mature lysosomes, we observed an increase in lysosomal acidic mitochondria in the soma of metabolically enhanced neurons () and (j)), suggesting mitophagy activation in targeting stressed mitochondria for lysosomal degradation. Lysosomal deficiency has been implicated as one of the main cellular defects in AD brains [Citation99,Citation100]. Our previous studies reported that lysosomal protease deficiency impaired lysosomal proteolysis of autophagic substrates in AD neurons [Citation24,Citation48]. In the current study, we demonstrate that, upon stimulation of OXPHOS activity, lysosomal deficits intensify aberrant retention of damaged mitochondria and thus exacerbate mitochondrial stress, leading to the inability of AD neurons to correct metabolic deficiency.
Our previous studies have established that SNAPIN acts as a dynein motor adaptor to mediate retrograde transport of late endosomes (LEs) in axons [Citation49,Citation70]. Through its direct interaction with the dynein intermediate chain, SNAPIN recruits dynein motors to LEs, enabling LE retrograde movement toward the soma. Newly synthesized protease precursors need to traffic from the trans-Golgi network through LEs to lysosomes, a lysosomal protease-loading process that mainly occurs in neuronal soma [Citation46,Citation48,Citation49,Citation77,Citation80,Citation81,Citation101]. We have demonstrated that SNAPIN-mediated LE retrograde transport promotes the retrograde trafficking of the retromer from distal axons toward the soma, where the retromer facilitates loading the lysosome with critical proteases [Citation48]. Importantly, retrograde transport of LEs is impaired in AD neurons, leading to lysosomal protease deficits and impaired proteolytic clearance of defective mitochondria within lysosomes. Moreover, increasing SNAPIN levels rescues lysosomal protease deficiency by enhancing LE retrograde transport [Citation48]. Our current study further shows that, while enhancing metabolic activity in AD neurons augments lysosomal retention of damaged mitochondria, SNAPIN-enhanced lysosomal functional capacity rectifies such a mitophagy failure and thus restores impaired energetic function. These observations support the premise that AD-associated lysosomal defects serve as an important mechanism underlying the involvement of mitophagy failure in bioenergetic dysfunction by disrupting mitochondrial turnover.
Early deficits in synaptic mitochondria have been linked to AD pathophysiology [Citation64]. Our recent work proposed that such a defect is the consequence of impaired mitochondrial maintenance due to defective mitophagy [Citation25,Citation26]. We have demonstrated that newly generated mitophagosomes fuse rapidly with LEs to form amphi-mitophagosomes, allowing mitophagosomes to load dynein-SNAPIN transport machinery and hence enabling their retrograde movement. Importantly, SNAPIN-enhanced retrograde transport mitigates synaptic mitochondrial deficits by facilitating the removal of nascent mitophagosomes from AD synapses [Citation25,Citation26]. In accord with this model, exacerbation of synaptic damage in AD mouse brains after OXPHOS stimulation is likely caused by augmentations in mitochondrial stress and energy crisis at synaptic terminals as the result of mitophagy failure. Moreover, elevated SNAPIN expression alleviates synapse loss in AD mouse brains. We attribute SNAPIN-induced beneficial effects against AD-linked synaptic injury to restored bioenergetic activity by enhancing mitophagy clearance at AD synapses.
In summary, mitochondrial and metabolic disturbances have been indicated as early deficits in AD brains and are critically linked to AD pathophysiology. Understanding how mitochondrial integrity and function are maintained and how mitochondrial quality impacts metabolic function and neuron health constitutes major goals in the field and is required for effective design of interventions that prevent or delay AD. The findings from this study provide novel insights into the neuronal mechanism of mitophagy in the regulation of energy metabolism. Our work thereby conceptually advances current knowledge as to how mitophagy failure and impaired mitochondrial maintenance lead to metabolic disruptions and thus intensify synaptic defects linked to early AD. Elucidation of this pathological mechanism has a broad neurobiological impact because mitochondrial malfunction, lysosomal deficits, and synaptic pathology all have been associated with human neuronal aging and other age-related neurodegenerative diseases. Our study could influence the development of necessary, new AD protective and therapeutic approaches based on the control of functional mitochondrial populations and bioenergetic status by mitophagy/lysosomal enhancement to combat AD-linked cognitive impairment.
Materials and methods
Mouse line and animal care
HsAPP mice (C57BL/6 J) from line J20 (https://www.jax.org/strain/006293) [Citation67] were purchased from the Jackson Laboratory. All animal procedures were carried out following the Rutgers Institutional Animal Care and Use Committee (IACUC). The animal facilities at Rutgers University are fully AAALAC accredited.
Reagents and antibodies
Sources of antibodies or reagents are as follows: polyclonal antibodies against LC3 (2775), RHEB (13,879), and HSPD1/HSP60 (12,165) from Cell Signaling Technology; SQSTM1/p62 (MBL, PM045); LC3 (L7543), actin (A2103), and SOD2 (HPA001814) from Sigma-Aldrich; STX1/syntaxin 1 (sc-12,736) and TOMM20 (sc-11,415) from Santa Cruz Biotechnology; monoclonal antibodies against LAMP1 (Developmental Studies Hybridoma Bank, 1D4B); CYCS/cytochrome c (556,432) and USO1/p115 (612,261) from BD Biosciences; VDAC1 (Abcam, ab14734); PRKN/parkin (sc-32,282) and actin (sc-47,778) from Santa Cruz Biotechnology; SYP/synaptophysin (MAB5258-1) and GAPDH (CB1001) from Millipore/CHEMICON. TMRE (Invitrogen, T669); glutamine (Gibco, 25,030–061); pyruvate (P5280), lactate (71,718), Z-VAD-FMK (V116), and DMSO (D2650) from Sigma-Aldrich; Alexa fluor 488- (A-11,017; A-11,070) and 546- (A-11,018; A-11,071) conjugated secondary antibodies from Invitrogen.
Transfection of cultured cortical neurons
Cortices were dissected from E18-19 embryos of WT or mutant HsAPPSwe/Ind Tg (J20 line) mice as described [Citation16,Citation38,Citation49]. Cortical neurons were dissociated by papain (Worthington) and plated at a density of 100,000 cells per cm2 on polyornithine- (Sigma-Aldrich, P4957) and fibronectin- (Sigma-Aldrich, F1141) coated coverslips. Neurons were grown overnight in plating medium (5% FBS, insulin, glutamate, G5, and 1x B27) supplemented with 100 × L-glutamine in Neurobasal medium (Invitrogen, 21,103–049). Starting at DIV2, cultures were maintained in conditioned medium with half-feed changes of neuronal feed (1x B27 in Neurobasal medium) every 3 d. Primary HsAPP Tg neurons were cultured from breeding mice of hemizygous mutant HsAPPSwe/Ind Tg with WT animals [Citation67]. Genotyping assays were performed following culture plating to verify mouse genotypes. In our study, we examined both transgenic and non-transgenic neurons derived from their littermates. WT and mutant HsAPP Tg neurons were transfected with various constructs at DIV5-7 using Lipofectamine 2000 (Invitrogen, 11,668,019) followed by 30 min pulse with 50 nM TMRE dye before imaging, or time-lapse imaging 10–14 d after transfection prior to quantification analysis. To stimulate OXPHOS, neurons were treated with 10 mM glutamine in Neurobasal-A medium (no D-glucose, no sodium pyruvate; Invitrogen, A24775-01) supplemented with B27 together with 1 mM pyruvate and 1 mM lactate. Control neurons were incubated in the medium in which 10 mM glutamine was replaced by 25 mM glucose.
Determination of cellular and mitochondrial ATP levels in live neurons
AT1.03 probe, a genetically-encoded fluorescence resonance energy transfer (FRET)-based ATP indicator, was used to examine cellular ATP levels [Citation33]. CFP (mseCFP) and YFP (cp173-mVenus) variants of AT1.03 were connected by the ε subunit of Bacillus subtilis FoF1-ATP synthase. While the ATP-free form results in low FRET efficiency, the ATP-bound form increases FRET efficiency. Moreover, mitAT1.03 was utilized to indicate the ATP status of individual mitochondria, which is localized to the mitochondrial matrix through the N terminus of AT1.03 fusion to a duplex of the mitochondrial targeting signal of cytochrome c oxidase subunit VIII. Alternatively, the engineered fluorescent sensor, PercevalHR (Addgene, 49,082; deposited by G. Yellen), was also used to monitor the ATP:ADP ratio in live neurons. PercevalHR is an improved variant of Perceval, and was constructed by combining a circularly permuted variant of GFP with a bacterial ATP-binding protein GlnK1 [Citation35]. PercevalHR has an increased fluorescence response and senses a greater range of ATP:ADP ratios [Citation34] to report the relative ATP:ADP ratio with real-time changes in fluorescence, and thus allows better temporal and spatial detection of cellular ATP changes. AT1.03 or PercevalHR was transfected into cortical neurons at DIV5-6 using Lipofectamine 2000, followed by imaging on an Olympus FV1000 microscope at DIV10-14. The FRET signal (YFP:CFP emission ratio) was measured and calculated from the individual cells expressing AT1.03, which reflects the intracellular ATP levels. PercevalHR was excited at 405 nm and 488 nm respectively and was detected in the 505–550 nm range. The fluorescence intensities (F 488nm:F 405nm) reflect the relative cellular ATP:ADP ratio.
Determination of mitochondrial oxidation in live neurons
MitoROGFP (Addgene, 49,437; deposited by P. Schumacker) was used to measure mitochondrial oxidation in live neurons [Citation36]. Neurons expressing MitoROGFP were excited at 405 nm or 488 nm with a sequential line scanning method. The emission was configured and detected at 510 nm. Images were processed using FV1000 software, Image J, and Adobe Photoshop CS6 (Adobe systems). To compare the intensities of the soma and axons of neurons between two excitation wavelengths (405 nm and 488 nm), the same ROIs were chosen to obtain intensity values for both excitation wavelengths. The 405:488 ratios in each experiment were normalized to the values of WT or mutant HsAPP Tg neurons in the presence or absence of glutamine.
Determine acidic mitochondria in live neurons
Live-cell imaging was performed in WT or mutant HsAPP cortical neurons expressing mt-Keima and GFP-LAMP1 with and without glutamine supplementation. Neurons were visualized with an FV3000 oil immersion 60× objective with two sequential excitation lasers at 440 nm (green, healthy mitochondria at neutral pH) and 586 nm (red, damaged mitochondria engulfed by lysosomes under acidic pH) and an emission spectrum from 590–680 nm [Citation60,Citation61,Citation102]. Images were sequentially acquired from top to bottom with Z-step (0.5 μm) at a resolution of 1024 × 1024 pixels, 8 bit, and stacked using Z-projection (maximum intensity). Images were imported into ImageJ (NIH) and the background was removed using the built-in plugin “remove background” prior to quantification.
Real time qRT-PCR measurements
Total RNAs were extracted from cultured neuron lysates treated with and without glutamine using Trizol (Invitrogen, 15,596–026) according to the manufacturer’s instruction. PCR was performed in an Eco real-time qPCR system (Illumina, San Diego,CA) using iScriptTM One-Step RT-PCR Kit With SYBR Green (Bio-Rad Laboratories Inc., Hercules, CA) in 20 µL reactions with 20 ng of RNA template. We used as forward (5′- ACC ACA GTC CAT GCC ATC AC −3′) and reverse (5′- TCC ACC ACC CTG TTG CTG TA −3′) primers for GAPDH, forward (5′- GCA GTC GCA ACA TGC TCA AG −3′) and reverse (5′- GGG AAC CCT TGG GGT CAT TT −3′) primers for PPARGC1A/PGC1α, forward (5′- TCC ACA GAA CAG CTA CCC AA −3′) and reverse (5′- CCA CAG GGC TGC AAT TTT CC −3′) and (5′- AGA CGG TTG TTG ATT AGG CGT −3′) primers for TFAM, forward (5′- AGA AAC GGA AAC GGC CTC AT −3′) and reverse (5′- CAT CCA ACG TGG CTC TGA GT −3′) primers for NRF1, and forward (5′- ATG GAG CAA GTT TGG CAG GA −3′) and reverse (5′- GCT GGG AAC AGC GGT AGT AT −3′) primers for NFE2L2, respectively. Samples were measured two to three times and average values were used for the calculation of relative fold changes. The relative levels of PPARGC1A, TFAM, NRF1 or NFE2L2 mRNA were normalized to the levels of GAPDH mRNA in each preparation. For each experiment, the values for control neurons in the absence of glutamine were set to 1 and other values were normalized accordingly.
Image acquisition and quantification
Confocal images were obtained using an Olympus FV3000 oil immersion 60x objective (1.3 numerical aperture) with a sequential-acquisition setting. For fluorescent quantification, images were acquired using the same settings below saturation at a resolution of 1,024 × 1,024 pixels (8 bit). Eight to ten sections were taken from the top-to-bottom of the specimen and brightest point projections were made. Morphometric measurements were performed using NIH ImageJ. Measured data were imported into Excel software for analysis. The thresholds in all images were set to similar levels. Fluorescence intensity of TMRE was expressed as arbitrary units of fluorescence per square area. The mean intensity of TMRE in the soma of WT or mutant HsAPP neurons treated with glutamine was normalized as a percentile ratio relative to that in control neurons in the absence of glutamine. Data were obtained from at least three independent experiments and the number of neurons used for quantification is indicated in the figures.
Criteria for axon selection in cultured neurons
For analyzing the motility of membranous organelles in live neurons, we selected axons for time-lapse imaging and measuring organelle motility because axons, but not dendrites, have uniform microtubule organization and polarity. Axonal processes were selected as we previously reported [Citation38,Citation49,Citation103]. Briefly, axons in live images were distinguished from dendrites based on known morphologic characteristics: greater length, thin and uniform diameter, and sparse branching [Citation104]. Only those that appeared to be single axons and separate from other processes in the field were chosen for recording axonal mitochondrial transport. Regions, where crossing or fasciculation occurred, were excluded from the analysis.
For live-cell imaging, custom ordered Hibernate medium (HE-CUSTOM no glucose, no sodium pyruvate, no phenol red) supplemented with 10 mM glutamine, 1 mM pyruvate, and 1 mM lactate was used for imaging neurons following 24 h glutamine incubation. As for control neurons, Hibernate medium supplemented with 10 mM glucose, 0.5 mM glutamine, 1 mM pyruvate, and 1 mM lactate was used. The temperature was maintained at 37°C with an air stream incubator. Cells were visualized with a 60x oil immersion lens (1.3 numerical aperture) on an Olympus FV1000 confocal microscope, using 458 excitation for CFP, 488 nm for GFP or YFP, and 559 nm for DsRed or TMRE. Time-lapse sequences of 1,024 × 1,024 pixels (8 bit) were collected at 5-s intervals with 1% intensity of the laser to minimize laser-induced bleaching and cell damage while maximizing pinhole opening. Time-lapse images were captured at a total of 100 frames. Recordings were started 6 min after the coverslip was placed in the chamber. The stacks of representative images were imported into NIH ImageJ software and converted to QuickTime movies. A membranous organelle was considered stopped if it remained stationary for the entire recording period; a motile one was counted only if it displaced at least 5 μm.
To trace the anterograde or retrograde movement of axonal mitochondria and to count stationary ones, kymographs were made as described previously [Citation38,Citation105] with extra plug-ins for NIH ImageJ. Briefly, we used the “Straighten” plugin to straighten curved axons and the “Grouped ZProjector” to z-axially project re-sliced time-lapse images. The height of the kymographs represents recording time (300 s unless otherwise noted), while the width represents the length (μm) of the axon imaged. Counts were averaged from 100 frames for each time-lapse image to ensure the accuracy of stationary and motile events. Relative motility of vesicles or organelles is described as the percentage of anterograde, retrograde, or stationary events of total vesicles or organelles. Measurements are presented as mean ± SEM. Statistical analyses were performed using unpaired Student’s t-tests.
Cell fractionation and immunoblotting
The mitochondria-enriched membrane was prepared as previously described [Citation24,Citation25,Citation38]. Briefly, cortical neurons were cultured in 100-mm plates at a density of 5 × 10⁶ in the presence and absence of glutamine for 24 h at DIV14. After washing once with PBS (Quality Biological, 114–058-131), cells were harvested and suspended in ice-cold Isolation Buffer (IB) [10 mM Tris-HCl, 1 mM EGTA, 1 mM EDTA, 0.25 M sucrose, and protease inhibitors (Roche, 4,693,159,001), pH7.4]. Cells were then homogenized 20 times by passing through a 25-gauge needle using a 1-ml syringe on ice. Following centrifugation at 1,000 × g for 10 min at 4°C, the supernatant was saved as post-nuclear supernatant (PNS). PNS was centrifuged at 15,000 × g for 10 min to separate the mitochondria-enriched fraction (Mito) from the cytosol-enriched fraction (Sup). The same amount of protein (10 μg) from each fraction was resolved by 4–12% Bis-Tris PAGE for sequential western blots on the same membranes after stripping between each application of antibody. For semi-quantitative analysis, protein bands detected by ECL were scanned into Adobe Photoshop CS6 and analyzed using NIH ImageJ. Care was taken during exposure of the ECL film to ensure that intensity readouts were in a linear range of standard curve blot detected by the same antibody. Paired Student t-tests were carried out and results are expressed as mean ± SEM.
Measurement of mitochondrial respiration rates from mouse brains
Cortical tissues from WT or mutant HsAPP Tg mice with or without glutamine supplementation were used as a source for mitochondrial preparations. The tissues were rinsed in ice-cold mitochondrial isolation buffer (70 mM sucrose, 210 mM mannitol, 5 mM HEPES, 1 mM EGTA, 0.5% [w:v] fatty acid-free BSA [Sigma-Aldrich, A8806], pH 7.2), then homogenized using a glass Dounce tissue grinder (10 strokes with a loose pestle, 10 strokes with a tight pestle; Thomas Scientific, 8243–01). Mitochondria were freshly isolated from tissue homogenates using a differential centrifugation method [Citation106,Citation107]. Briefly, the homogenate was centrifuged at 1,000 × g for 10 min at 4°C. Following centrifugation, the supernatant was transferred to a separate tube and centrifuged at 8000 × g for 15 min at 4°C and washed once more with the same buffer and centrifugation procedure. Protein concentrations were measured using BCA protein assay (Pierce Chemical Co., 23,225).
Seahorse XF24 Analyzer (Agilent Technologies, CA) was used to measure bioenergetic function in freshly isolated mitochondria from the cortex. The XF24 creates a transient 7-μl chamber in specialized 24-well microplates that allows for oxygen consumption rate (OCR) to be monitored in real time [Citation108]. 40 μg of isolated mitochondria was added to each well in 50 μl of mitochondrial assay solution (MAS: 70 mM sucrose, 220 mM mannitol, 10 mM KH2PO4, 5 mM MgCl2, 5 mM HEPES, 1 mM EGTA, 0.2% [w:v] fatty acid free BSA, pH 7.2). The plate was then transferred to a centrifuge equipped with a swinging bucket microplate adaptor and spun at 2,000 g for 20 min at 4°C. After centrifugation, 450 μl of MAS with pyruvate (10 mM; Sigma-Aldrich, P5208) and malate (2 mM; Sigma-Aldrich, M6413) was added to each well. Oligomycin (1 μM; Sigma-Aldrich, O4876), FCCP (4 μM; Sigma-Aldrich, C2920) and rotenone (1 μM; Sigma-Aldrich, R8875) + antimycin A (1 μM; Sigma-Aldrich, A8674) were injected sequentially through ports in the Seahorse Flux Pak cartridges. Each loop began with mixing for 1 min, followed by OCR measurement for 3 min. This allowed the determination of the basal level of oxygen consumption as well as maximal and ATP-linked respirations [Citation108,Citation109].
Transmission electron microscopy
Hippocampi from WT or mutant HsAPP Tg mice were cut into small specimens (one dimension < 1 mm) and fixed in Trump’s fixative (Electron Microscopy Sciences) for 2 h at RT. The sections were then washed by 0.1 M Cacodylate buffer, and post-fixed in 1% osmium tetroxide, followed by dehydrating in ethanol, and embedding using the EM bed 812 kit (Electron Microscopy Sciences) according to a standing procedure. Images were acquired on an electron microscope (1200EX; JEOL) (Electron Imaging Facility in the Department of Pathology and Laboratory Medicine, Robert Wood Johnson Medical School). For quantitative studies, the numbers of morphologically abnormal (damaged) and normal mitochondria (healthy) and mitophagosomes – mitochondria within autophagic vacuole (AV)-like organelles – in the soma were counted from electron micrographs, respectively. Abnormal mitochondria were defined as having swollen round shape, and reduced, disorganized, or loss of internal cristae [Citation24,Citation110]. MVs were characterized by mitochondria within double-membrane structures (initial AVs, AVi) or amphisomes containing partially degraded cytoplasmic components, vesicles, or high electron dense materials [Citation49,Citation111,Citation112]. Quantification analysis was performed blindly to the condition.
Tissue preparation and immunohistochemistry
Animals were anesthetized with 2.5% avertin (0.35 ml per mouse) and transcardially perfused with fixation buffer (4% paraformaldehyde in PBS, pH 7.4). Brains were dissected out and post-fixed in fixation buffer overnight and then placed in 30% sucrose at 4°C. Ten-µm-thick coronal sections were collected consecutively to the level of the hippocampus and used to study co-localization of various markers. After incubation with blocking buffer (5% goat serum [Sigma-Aldrich, G9023], 0.3% Triton X-100 [Sigma-Aldrich, T8787], 3% BSA, 1% glycine in PBS) at RT for 1 h, the sections were incubated with primary antibodies at 4°C overnight, followed by incubating with secondary fluorescence antibodies at 1:600 dilution at RT for 1 h. After fluorescence immunolabeling, the sections were stained with DAPI and washed three times in PBS. The sections were then mounted with anti-fading medium (vector laboratories, H-5000) for imaging. Confocal images were obtained using an Olympus FV3000 oil immersion 40x objective with sequential-acquisition setting. Eight to ten sections were taken from top-to-bottom of the specimen and brightest point projections were made.
Glutamine supplementation
For glutamine supplementation experiments, 4% glutamine (Sigma) in sterile tap water was made fresh daily and offered as the sole source of drinking water for 5 consecutive days (Monday through Friday), as previously described [Citation62,Citation63]. Control mice were fed with only sterile tap water. To avoid undue stress from elevated ammonia concentrations, all mice drank glutamine-free water 2 d each week (Saturday and Sunday).
In vivo gene delivery
The AAV2/9-mCherry and AAV2/9-mCherry-SNAPIN constructs were kindly provided by Z.-H. Sheng and as described previously [Citation25,Citation46,Citation68]. The AAV2/9-mCherry-SNAPIN construct contains an IRES segment between mouse SNAPIN and mCherry sequences, resulting in separate expression of mouse SNAPIN and mCherry. The AAV2/9-mCherry and AAV2/9-mCherry-SNAPIN viruses were produced by Vector BioLabs. Adult mutant HsAPP Tg mice at 2–3 months of age were injected into the hippocampus (AP: – 2 mm, LAT: – 1.5 mm, DV: + 1.75 mm) of both cerebral hemispheres according to the stereotaxic atlas of Franklin and Paxinos (2001) using 4–8 × 10⁹ total viral particles per side and analyzed 6–7 months after injection.
Statistical analysis
All statistical analyses were performed using the Student’s t-test and are presented as mean ± SEM.
Supplemental Material
Download PDF (4.6 MB)Acknowledgments
We thank Z-H. Sheng for GFP-LAMP1, SNAPIN, and pMT-mKeima-Red plasmids; G. Yellen for GW1-PercevalHR; S. Yamanaka for pMXs-EGFP-RHEB-IP; H. Imamura for AT1.03 and mitAT1.03; P. Schumacker for Matrix-roGFP; B. Albensi at the University of Manitoba and R. Patel at EM facility in the Department of Pathology and Laboratory Medicine, Robert Wood Johnson Medical School for technical help; E. Gavin, X. Su, J. Cheung, P. Sheshadri, and other members in the Cai Lab for their research assistance and constructive discussion. Y. Zuo, J. Cheung, and J. Yoon for critical reading.
Disclosure statement
The authors declare no competing financial interests.
Supplementary material
Supplemental data for this article can be accessed here.
Additional information
Funding
References
- Sheng ZH, Cai Q. Mitochondrial transport in neurons: impact on synaptic homeostasis and neurodegeneration. Nat Rev Neurosci. 2012 Jan 5;13(2):77–93.
- Cai Q, Tammineni P. Alterations in mitochondrial quality control in alzheimer’s disease. Front Cell Neurosci. 2016;10:24.
- Cai Q, Tammineni P. Mitochondrial aspects of synaptic dysfunction in alzheimer’s disease. J Alzheimers Dis. 2017;57(4):1087–1103.
- Chamberlain KA, Sheng ZH. Mechanisms for the maintenance and regulation of axonal energy supply. J Neurosci Res. 2019 Aug;97(8):897–913.
- Nicholls DG, Budd SL. Mitochondria and neuronal survival. Physiol Rev. 2000 Jan;80(1):315–360.
- Mishra P, Chan DC. Mitochondrial dynamics and inheritance during cell division, development and disease. Nat Rev Mol Cell Biol. 2014 Oct;15(10):634–646.
- Lou G, Palikaras K, Lautrup S, et al. Mitophagy and Neuroprotection. Trends Mol Med. 2020 Jan;26(1):8–20.
- Cai Q, Jeong YY. Mitophagy in alzheimer’s disease and other age-related neurodegenerative diseases. Cells. 2020. 8. 9(1):Jan.
- Lin MT, Beal MF. Mitochondrial dysfunction and oxidative stress in neurodegenerative diseases. Nature. 2006 Oct 19;443(7113):787–795.
- Bose A, Beal MF. Mitochondrial dysfunction in parkinson’s disease. J Neurochem. 2016 Oct;139(Suppl 1):216–231.
- Fivenson EM, Lautrup S, Sun N, et al. Mitophagy in neurodegeneration and aging. Neurochem Int. 2017;109:202–209.
- Youle RJ, Narendra DP. Mechanisms of mitophagy. Nat Rev Mol Cell Biol. 2011 Jan;12(1):9–14.
- Pickles S, Vigie P, Youle RJ. Mitophagy and quality control mechanisms in mitochondrial maintenance. Curr Biol. 2018 Feb 19;28(4):R170–R185.
- Melser S, Lavie J, Benard G. Mitochondrial degradation and energy metabolism. Biochim Biophys Acta. 2015 Oct;1853(10Pt B):2812–2821.
- Wallace DC. A mitochondrial bioenergetic etiology of disease. J Clin Invest. 2013 Apr;123(4):1405–1412.
- Gibson GE, Shi Q. A mitocentric view of alzheimer’s disease suggests multi-faceted treatments. J Alzheimers Dis. 2010;20(Suppl 2):S591–607.
- Cunnane SC, Trushina E, Morland C, et al. Brain energy rescue: an emerging therapeutic concept for neurodegenerative disorders of ageing. Nat Rev Drug Discov. 2020 Sep;19(9):609–633.
- Camandola S, Mattson MP. Brain metabolism in health, aging, and neurodegeneration. Embo J. 2017 Jun 1;36(11):1474–1492.
- Reddy PH, Beal MF. Are mitochondria critical in the pathogenesis of alzheimer’s disease? Brain Res Brain Res Rev. 2005 Nov;49(3):618–632.
- Reddy PH, Reddy TP, Manczak M, et al. Dynamin-related protein 1 and mitochondrial fragmentation in neurodegenerative diseases. Brain Res Rev. 2011 Jun 24;67(1–2):103–118.
- Kerr JS, Adriaanse BA, Greig NH, et al. Mitophagy and alzheimer’s disease: cellular and molecular mechanisms. Trends Neurosci. 2017 Mar;40(3):151–166.
- Moreira PI, Siedlak SL, Wang X, et al. Increased autophagic degradation of mitochondria in alzheimer disease. Autophagy. 2007 Nov-Dec;3(6):614–615.
- Moreira PI, Siedlak SL, Wang X, et al. Autophagocytosis of mitochondria is prominent in alzheimer disease. J Neuropathol Exp Neurol. 2007 Jun;66(6):525–532.
- Ye X, Sun X, Starovoytov V, et al. Parkin-mediated mitophagy in mutant hAPP neurons and alzheimer’s disease patient brains. Hum Mol Genet. 2015 May 15;24(10):2938–2951.
- Han S, Jeong YY, Sheshadri P, et al. Mitophagy regulates integrity of mitochondria at synapses and is critical for synaptic maintenance. EMBO Rep. 2020;6:e201949801.
- Han S, Jeong YY, Sheshadri P, et al. Mitophagy coordination with retrograde transport ensures the integrity of synaptic mitochondria. Autophagy. 2020 Oct 16;(10):1925–1927.
- Fang EF, Hou Y, Palikaras K, et al. Mitophagy inhibits amyloid-beta and tau pathology and reverses cognitive deficits in models of alzheimer’s disease. Nat Neurosci. 2019 Mar;22(3):401–412.
- Du F, Yu Q, Yan S, et al. PINK1 signalling rescues amyloid pathology and mitochondrial dysfunction in alzheimer’s disease. Brain. 2017 Dec 1;140(12):3233–3251.
- Reitzer LJ, Wice BM, Kennell D. Evidence that glutamine, not sugar, is the major energy source for cultured Hela cells. J Biol Chem. 1979 Apr 25;254(8):2669–2676.
- Rossignol R, Gilkerson R, Aggeler R, et al. Energy substrate modulates mitochondrial structure and oxidative capacity in cancer cells. Cancer Res. 2004 Feb 1;64(3):985–993.
- Melser S, Chatelain EH, Lavie J, et al. Rheb regulates mitophagy induced by mitochondrial energetic status. Cell Metab. 2013 May 7;17(5):719–730.
- Weinberg F, Hamanaka R, Wheaton WW, et al. Mitochondrial metabolism and ROS generation are essential for Kras-mediated tumorigenicity. Proc Natl Acad Sci U S A. 2010 May 11;107(19):8788–8793.
- Imamura H, Nhat KP, Togawa H, et al. Visualization of ATP levels inside single living cells with fluorescence resonance energy transfer-based genetically encoded indicators. Proc Natl Acad Sci U S A. 2009 Sep 15;106(37):15651–15656.
- Tantama M, Martinez-Francois JR, Mongeon R, et al. Imaging energy status in live cells with a fluorescent biosensor of the intracellular ATP-to-ADP ratio. Nat Commun. 2013;4:2550.
- Berg J, Hung YP, Yellen G. A genetically encoded fluorescent reporter of ATP:ADP ratio. Nat Methods. 2009 Feb;6(2):161–166.
- Waypa GB, Marks JD, Guzy R, et al. Hypoxia triggers subcellular compartmental redox signaling in vascular smooth muscle cells. Circ Res. 2010 Feb 19;106(3):526–535.
- Xie H, Guan J, Borrelli LA, et al. Mitochondrial alterations near amyloid plaques in an alzheimer’s disease mouse model. J Neurosci. 2013 Oct 23;33(43):17042–17051.
- Cai Q, Zakaria HM, Simone A, et al. Spatial parkin translocation and degradation of damaged mitochondria via mitophagy in live cortical neurons. Curr Biol. 2012 Mar 20;22(6):545–552.
- Wu Z, Puigserver P, Andersson U, et al. Mechanisms controlling mitochondrial biogenesis and respiration through the thermogenic coactivator PGC-1. Cell. 1999 Jul 9;98(1):115–124.
- Picca A, Lezza AM. Regulation of mitochondrial biogenesis through TFAM-mitochondrial DNA interactions: useful insights from aging and calorie restriction studies. Mitochondrion. 2015 Nov;25:67–75.
- Uittenbogaard M, Brantner CA, Chiaramello A. Epigenetic modifiers promote mitochondrial biogenesis and oxidative metabolism leading to enhanced differentiation of neuroprogenitor cells. Cell Death Dis. 2018 Mar 2;9(3):360.
- Sivalingam K, Cirino TJ, McLaughlin JP, et al. HIV-Tat and cocaine impact brain energy metabolism: redox modification and mitochondrial biogenesis influence NRF transcription-mediated neurodegeneration. Mol Neurobiol. 2021 Feb;58(2):490–504.
- Pickrell AM, Youle RJ. The roles of PINK1, parkin, and mitochondrial fidelity in parkinson’s disease. Neuron. 2015 Jan 21;85(2):257–273.
- Devireddy S, Liu A, Lampe T, et al. The organization of mitochondrial quality control and life cycle in the nervous system in vivo in the absence of PINK1. J Neurosci. 2015 Jun 24;35(25):9391–9401.
- Sung H, Tandarich LC, Nguyen K, et al. Compartmentalized regulation of parkin-mediated mitochondrial quality control in the drosophila nervous system in vivo. J Neurosci. 2016 Jul 13;36(28):7375–7391.
- Xie Y, Zhou B, Lin MY, et al. Endolysosomal deficits augment mitochondria pathology in spinal motor neurons of asymptomatic fals mice. Neuron. 2015 Jul 15;87(2):355–370.
- Maday S, Holzbaur EL. Compartment-specific regulation of autophagy in primary neurons. J Neurosci. 2016 Jun 1;36(22):5933–5945.
- Tammineni P, Jeong YY, Feng T, et al. Impaired axonal retrograde trafficking of the retromer complex augments lysosomal deficits in alzheimer’s disease neurons. Hum Mol Genet. 2017 Nov 15;26(22):4352–4366.
- Cai Q, Lu L, Tian JH, et al. Snapin-regulated late endosomal transport is critical for efficient autophagy-lysosomal function in neurons. Neuron. 2010 Oct 06;68(1):73–86.
- Cheng XT, Xie YX, Zhou B, et al. Characterization of LAMP1-labeled nondegradative lysosomal and endocytic compartments in neurons. J Cell Biol. 2018 Sep 3;217(9):3127–3139.
- Lee JH, Rao MV, Yang DS, et al. Transgenic expression of a ratiometric autophagy probe specifically in neurons enables the interrogation of brain autophagy in vivo. Autophagy. 2019 Mar;15(3):543–557.
- Chan NC, Salazar AM, Pham AH, et al. Broad activation of the ubiquitin-proteasome system by parkin is critical for mitophagy. Hum Mol Genet. 2011 May 1;20(9):1726–1737.
- Yoshii SR, Kishi C, Ishihara N, et al. Parkin mediates proteasome-dependent protein degradation and rupture of the outer mitochondrial membrane. J Biol Chem. 2011 Jun 3;286(22):19630–19640.
- Birsa N, Norkett R, Wauer T, et al. Lysine 27 ubiquitination of the mitochondrial transport protein miro is dependent on serine 65 of the parkin ubiquitin ligase. J Biol Chem. 2014 May 23;289(21):14569–14582.
- Bingol B, Tea JS, Phu L, et al. The mitochondrial deubiquitinase USP30 opposes parkin-mediated mitophagy. Nature. 2014 Jun 19;510(7505):370-+.
- Liu S, Sawada T, Lee S, et al. Parkinson’s disease-associated kinase PINK1 regulates miro protein level and axonal transport of mitochondria. PLoS Genet. 2012;8(3):e1002537.
- Wang X, Winter D, Ashrafi G, et al. PINK1 and Parkin target miro for phosphorylation and degradation to arrest mitochondrial motility. Cell. 2011 Nov 11;147(4):893–906.
- Cai Q, Zakaria HM, Sheng ZH. Long time-lapse imaging reveals unique features of PARK2/Parkin-mediated mitophagy in mature cortical neurons. Autophagy. 2012 Jun;8(6):976–978.
- Lin MY, Cheng XT, Tammineni P, et al. Releasing syntaphilin removes stressed mitochondria from axons independent of mitophagy under pathophysiological conditions. Neuron. 2017 May 03;94(3):595–610 e6.
- Bingol B, Tea JS, Phu L, et al. The mitochondrial deubiquitinase USP30 opposes parkin-mediated mitophagy. Nature. 2014 Jun 19;510(7505):370–375.
- Katayama H, Kogure T, Mizushima N, et al. A sensitive and quantitative technique for detecting autophagic events based on lysosomal delivery. Chem Biol. 2011 Aug 26;18(8):1042–1052.
- Chen J, Herrup K. Glutamine acts as a neuroprotectant against DNA damage, beta-amyloid and H2O2-induced stress. PLoS One. 2012;7(3):e33177.
- Chen J, Chen Y, Vail G, et al. The impact of glutamine supplementation on the symptoms of ataxia-telangiectasia: a preclinical assessment. Mol Neurodegener. 2016 Aug 18;11(1):60.
- Du H, Guo L, Yan S, et al. Early deficits in synaptic mitochondria in an alzheimer’s disease mouse model. Proc Natl Acad Sci U S A. 2010 Oct 26;107(43):18670–18675.
- Nagahara AH, Merrill DA, Coppola G, et al. Neuroprotective effects of brain-derived neurotrophic factor in rodent and primate models of alzheimer’s disease. Nat Med. 2009 Mar;15(3):331–337.
- Nagahara AH, Mateling M, Kovacs I, et al. Early BDNF treatment ameliorates cell loss in the entorhinal cortex of APP transgenic mice. J Neurosci. 2013 Sep 25;33(39):15596–15602.
- Mucke L, Masliah E, Yu GQ, et al. High-level neuronal expression of abeta 1-42 in wild-type human amyloid protein precursor transgenic mice: synaptotoxicity without plaque formation. J Neurosci. 2000 Jun 1;20(11):4050–4058.
- Ye X, Feng T, Tammineni P, et al. Regulation of synaptic amyloid-beta generation through BACE1 retrograde transport in a mouse model of alzheimer’s disease. J Neurosci. 2017 Mar 08;37(10):2639–2655.
- Hirai K, Aliev G, Nunomura A, et al. Mitochondrial abnormalities in alzheimer’s disease. J Neurosci. 2001 May 1;21(9):3017–3023.
- Cai Q, Sheng ZH. Uncovering the role of snapin in regulating autophagy-lysosomal function. Autophagy. 2011 Apr;7(4):445–447.
- Polito VA, Li H, Martini-Stoica H, et al. Selective clearance of aberrant tau proteins and rescue of neurotoxicity by transcription factor EB. EMBO Mol Med. 2014 Sep;6(9):1142–1160.
- Xiao Q, Yan P, Ma X, et al. Neuronal-targeted TFEB accelerates lysosomal degradation of APP, reducing abeta generation and amyloid plaque pathogenesis. J Neurosci. 2015 Sep 2;35(35):12137–12151.
- Banerjee K, Munshi S, Frank DE, et al. Abnormal glucose metabolism in alzheimer’s disease: relation to autophagy/mitophagy and therapeutic approaches. Neurochem Res. 2015 Dec;40(12):2557–2569.
- Neth BJ, Craft S. Insulin resistance and alzheimer’s disease: bioenergetic linkages. Front Aging Neurosci. 2017;9:345.
- Sorrentino V, Menzies KJ, Auwerx J. Repairing mitochondrial dysfunction in disease. Annu Rev Pharmacol Toxicol. 2018 Jan;6(58):353–389.
- Sorrentino V, Romani M, Mouchiroud L, et al. Enhancing mitochondrial proteostasis reduces amyloid-beta proteotoxicity. Nature. 2017 Dec 14;552(7684):187–193.
- Lee S, Sato Y, Nixon RA. Lysosomal proteolysis inhibition selectively disrupts axonal transport of degradative organelles and causes an alzheimer’s-like axonal dystrophy. J Neurosci. 2011 May 25;31(21):7817–7830.
- Maday S, Wallace KE, Holzbaur EL. Autophagosomes initiate distally and mature during transport toward the cell soma in primary neurons. J Cell Biol. 2012 Feb 20;196(4):407–417.
- Sepuri NBV, Tammineni P, Mohammed F, et al. Nuclear transcription factors in the mitochondria: a new paradigm in fine-tuning mitochondrial metabolism. Handb Exp Pharmacol. 2017;240:3–20.
- Cheng XT, Xie YX, Zhou B, et al. Characterization of LAMP1-labeled nondegradative lysosomal and endocytic compartments in neurons. J Cell Biol. 2018 Sep 3;217(9):3127–3139.
- Yap CC, Digilio L, McMahon LP, et al. Degradation of dendritic cargos requires Rab7-dependent transport to somatic lysosomes. J Cell Biol. 2018 Sep 3;217(9):3141–3159.
- Gowrishankar S, Yuan P, Wu Y, et al. Massive accumulation of luminal protease-deficient axonal lysosomes at alzheimer’s disease amyloid plaques. Proc Natl Acad Sci U S A. 2015 Jul 14;112(28):E3699–708.
- Overly CC, Lee KD, Berthiaume E, et al. Quantitative measurement of intraorganelle pH in the endosomal-lysosomal pathway in neurons by using ratiometric imaging with pyranine. Proc Natl Acad Sci U S A. 1995 Apr 11;92(8):3156–3160.
- Smith MA, Perry G, Richey PL, et al. Oxidative damage in alzheimer’s. Nature. 1996 Jul 11;382(6587):120–121.
- Maurer I, Zierz S, Moller HJ. A selective defect of cytochrome c oxidase is present in brain of alzheimer disease patients. Neurobiol Aging. 2000 May-Jun;21(3):455–462.
- Devi L, Prabhu BM, Galati DF, et al. Accumulation of amyloid precursor protein in the mitochondrial import channels of human alzheimer’s disease brain is associated with mitochondrial dysfunction. J Neurosci. 2006 Aug 30;26(35):9057–9068.
- Caspersen C, Wang N, Yao J, et al. Mitochondrial abeta: a potential focal point for neuronal metabolic dysfunction in alzheimer’s disease. Faseb J. 2005 Dec;19(14):2040–2041.
- Manczak M, Park BS, Jung Y, et al. Differential expression of oxidative phosphorylation genes in patients with alzheimer’s disease: implications for early mitochondrial dysfunction and oxidative damage. Neuromolecular Med. 2004;5(2):147–162.
- Manczak M, Calkins MJ, Reddy PH. Impaired mitochondrial dynamics and abnormal interaction of amyloid beta with mitochondrial protein Drp1 in neurons from patients with alzheimer’s disease: implications for neuronal damage. Hum Mol Genet. 2011 Jul 1;20(13):2495–2509.
- Parker WD Jr., Filley CM, Parks JK. Cytochrome oxidase deficiency in alzheimer’s disease. Neurology. 1990 Aug;40(8):1302–1303.
- Butterfield DA, Drake J, Pocernich C, et al. Evidence of oxidative damage in alzheimer’s disease brain: central role for amyloid beta-peptide. Trends Mol Med. 2001 Dec;7(12):548–554.
- Lin MT, Simon DK, Ahn CH, et al. High aggregate burden of somatic mtDNA point mutations in aging and alzheimer’s disease brain. Hum Mol Genet. 2002 Jan 15;11(2):133–145.
- Coskun PE, Beal MF, Wallace DC. Alzheimer’s brains harbor somatic mtDNA control-region mutations that suppress mitochondrial transcription and replication. Proc Natl Acad Sci U S A. 2004 Jul 20;101(29):10726–10731.
- Tonnies E, Trushina E. Oxidative stress, synaptic dysfunction, and alzheimer’s disease. J Alzheimers Dis. 2017;57(4):1105–1121.
- Flannery PJ, Trushina E. Mitochondrial dynamics and transport in alzheimer’s disease. Mol Cell Neurosci. 2019 Jul;98:109–120.
- Oliver DMA, Reddy PH. Molecular basis of alzheimer’s disease: focus on mitochondria. J Alzheimers Dis. 2019;72(s1):S95–S116.
- Wang W, Zhao F, Ma X, et al. Mitochondria dysfunction in the pathogenesis of Alzheimer’s disease: recent advances. Mol Neurodegener. 2020 May 29;15(1):30.
- Santos RX, Correia SC, Wang X, et al. Alzheimer’s disease: diverse aspects of mitochondrial malfunctioning. Int J Clin Exp Pathol. 2010 Jun 25;3(6):570–581.
- Nixon RA. The role of autophagy in neurodegenerative disease. Nat Med. 2013 Aug;19(8):983–997.
- Menzies FM, Fleming A, Rubinsztein DC. Compromised autophagy and neurodegenerative diseases. Nat Rev Neurosci. 2015 Jun;16(6):345–357.
- Winckler B, Faundez V, Maday S, et al. The endolysosomal system and proteostasis: from development to degeneration. J Neurosci. 2018 Oct 31;38(44):9364–9374.
- Puri R, Cheng XT, Lin MY, et al. Mul1 restrains Parkin-mediated mitophagy in mature neurons by maintaining ER-mitochondrial contacts. Nat Commun. 2019 Aug 13;10(1):3645.
- Ye X, Cai Q. Snapin-mediated BACE1 retrograde transport is essential for its degradation in lysosomes and regulation of APP processing in neurons. Cell Rep. 2014 Jan 16;6(1):24–31.
- Banker GA, Cowan WM. Further observations on hippocampal neurons in dispersed cell culture. J Comp Neurol. 1979 Oct 1;187(3):469–493.
- Kang JS, Tian JH, Pan PY, et al. Docking of axonal mitochondria by syntaphilin controls their mobility and affects short-term facilitation. Cell. 2008 Jan 11;132(1):137–148.
- Frezza C, Cipolat S, Scorrano L. Organelle isolation: functional mitochondria from mouse liver, muscle and cultured fibroblasts. Nat Protoc. 2007;2(2):287–295.
- Djordjevic J, Thomson E, Chowdhury SR, et al. Brain region- and sex-specific alterations in mitochondrial function and NF-kappaB signaling in the TgCRND8 mouse model of alzheimer’s disease. Neuroscience. 2017 Oct 11;361:81–92.
- Hill BG, Dranka BP, Zou L, et al. Importance of the bioenergetic reserve capacity in response to cardiomyocyte stress induced by 4-hydroxynonenal. Biochem J. 2009 Oct 23;424(1):99–107.
- Brand MD, Nicholls DG. Assessing mitochondrial dysfunction in cells. Biochem J. 2011 Apr 15;435(2):297–312.
- Trushina E, Nemutlu E, Zhang S, et al. Defects in mitochondrial dynamics and metabolomic signatures of evolving energetic stress in mouse models of familial alzheimer’s disease. PLoS One. 2012;7(2):e32737.
- Nixon RA, Wegiel J, Kumar A, et al. Extensive involvement of autophagy in Alzheimer disease: an immuno-electron microscopy study. J Neuropathol Exp Neurol. 2005 Feb;64(2):113–122.
- Klionsky DJ, Abdelmohsen K, Abe A, et al. Guidelines for the use and interpretation of assays for monitoring autophagy (3rd edition). Autophagy. 2016;12(1):1–222.