
ABSTRACT
Dysfunction of macroautophagy/autophagy in macrophages contributes to atherosclerosis. Impaired autophagy-lysosomal degradation system leads to lipid accumulation, facilitating atherosclerotic plaque. ATG14 is an essential regulator for the fusion of autophagosomes with lysosomes. Whether ATG14 plays a role in macrophage autophagy dysfunction in atherosclerosis is unknown. To investigate the effects of ATG14 on macrophage autophagy, human atherosclerotic plaque, apoe−/- mice and cultured mouse macrophages were evaluated. Overexpression of ATG14 by adenovirus was used to reveal its function in autophagy, inflammation and atherosclerotic plaque formation. Results showed that impaired autophagy function with reduction of ATG14 expression existed in macrophages of human and mouse atherosclerotic plaques. Ox-LDL impaired autophagosome-lysosome fusion with reduction of ATG14 expression in macrophages. Overexpression of ATG14 in macrophages enhanced fusion of autophagosomes with lysosomes and promoted lipid degradation, decreasing Ox-LDL-induced apoptosis and inflammatory response. Augmenting ATG14 expression reversed the autophagy dysfunction in macrophages of apoe−/- mice plaque, blunted SQSTM1/p62 accumulation, inhibited inflammation, and upregulated the population of Treg cells, resulting in alleviating atherosclerotic lesions.
Abbreviations: ABCC1: ATP-binding cassette, sub-family C (CFTR/MRP), member 1; ABCA1: ATP-binding cassette, sub-family A (ABC1), member 1; Ad-Atg14: adenovirus vector carrying the mouse Atg14 gene; Ad-LacZ: adenovirus vector carrying the gene for bacterial β-galactosidase; apoe−/-: apolipoprotein E knockout; ATG14: autophagy-related 14; CD68: CD68 antigen; DAPI: 4ʹ,6-diamidino-2-phenylindole; Dil-ox-LDL: Dil-oxidized low density lipoprotein; ELISA: enzyme-linked immunosorbent assay; HFD: high-fat diet (an atherogenic diet); IL: interleukin; LAMP2: lysosomal-associated membrane protein 2; LDL-C: low density lipoprotrein cholesterol; MAP1LC3/LC3: microtubule-associated protein 1 light chain 3; ND: normal diet; Ox-LDL: oxidized low density lipoprotein; PBMC: peripheral blood mononuclear cells; SQSTM1/p62: sequestosome 1; SREBF1/SREBP1c: sterol regulatory element binding transcription factor 1; SREBF2/SREBP2: sterol regulatory element binding factor 2; STX17: syntaxin 17; TC: serum total cholesterol; TG: triglyceride; TNF: tumor necrosis factor; IFN: interferon; Treg cell: regulatory T cell
Introduction
Atherosclerosis is a chronic inflammatory disease arising from an imbalance in lipid metabolism and an unhealthy immune response mediated by the accumulation of cholesterol-laden macrophages in the artery wall [Citation1]. Subendothelial macrophages phagocytizing the modified lipoproteins and cellular debris, foam cell formation and inflammatory response constitute some of major event during atherogenesis [Citation2]. Dysfunction of the cholesterol-laden macrophage in the atherosclerotic plaques promotes disease progression [Citation3]. Understanding the cellular progress that underlies macrophage dysfunction remains an important field of investigation.
Macroautophagy/autophagy, an evolutionarily conserved catabolic process of the lysosomal degradation of cellular components including accumulated lipids, has been shown to be crucial in cell function and body metabolism [Citation4]. However, overactivation of autophagy leads to impairment of autophagic flow, resulting in accumulation of autophagosomes, increased SQSTM1/p62 (a selective autophagy receptor that detects and delivers large biomolecules such as protein aggregates or organelles to phagophores, the precursors to autophagosomes) and apoptosis [Citation5]. Accumulation of SQSTM1 in macrophages in the developing plaque suggests that impaired autophagy in macrophages also contributes to atherosclerosis [Citation6,Citation7]. In addition, impaired autophagy in macrophage led to inflammasome hyperactivation, which further promoted atherosclerosis progression by enhanced production of inflammatory cytokine such as IL1B/IL-1β and IL18 [Citation8–10]. Overexpressing TFEB, a transcriptional activator of autophagy-lysosomal biogenesis in macrophage, reversed the autophagy dysfunction of plaques and blunt macrophage apoptosis and pro-inflammatory IL1B levels, leading to reduced atherosclerosis [Citation11]. Thus, further explore the underlying mechanisms of the impaired autophagy in atherosclerotic macrophages will lay the foundation for future atheroprotective therapeutics.
The dynamic process of autophagy is usually beginning with the formation of double membrane autophagosomes that engulf cytosolic cargo and ending by fusing autophagosomes with lysosomes for degradation [Citation12,Citation13]. Thus, enhancing autophagosome formation/maturation and promoting the autophagosome/lysosome fusion are crucial for autophagy function [Citation4,Citation14]. Recently, fusing autophagosomes with lysosomes for degradation was regulated by ATG14, an essential autophagy-specific regulator of the class III phosphatidylinositol 3-kinase complex [Citation15]. ATG14 directly binds to STX17 at least partly, on mature autophagosomes adjacent to or overlapping with LAMP2-labeled lysosomes and promotes autophagosome fusion with a lysosome for degradation [Citation16]. We have shown that inhibiting ATG14 expression leaded to endothelial cells autophagic apoptosis through impairing autophagosome-lysosomes fusion [Citation13]. However, whether induction of ATG14 can enhance macrophage autophagy-lysosomal biogenesis and alleviate atherosclerosis, need further exploration.
In the present study, we sought to explore the defect of the autophagy function and the autophagosome/lysosome fusion in freshly isolated atherosclerotic macrophage from patients and apoe−/- mice, and investigate the role of ATG14 in reversing macrophage dysfunction by promoting autophagosome-lysosomal fusion in atherosclerosis.
Results
Autophagy dysfunction with reduction of ATG14 expression was detected in macrophage in human atherosclerotic plaque
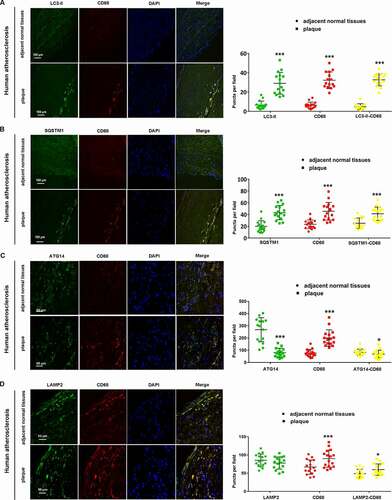
To evaluate the link between deficient macrophage autophagy and atherosclerosis, we analyzed atherosclerotic plaques from atherosclerotic human artery samples by immunofluorescence. Each removed artery vascular specimen was divided into two parts (plaque VS. adjacent normal tissues), and paired samples were evaluated (Figure S1A,B). As shown in (), compared to adjacent minimally diseased regions, the number of both LC3-II-bound puncta (green) and CD68 (red) puncta were markedly higher in atherosclerotic plaques, and colocalization of LC3-II and CD68 (yellow puncta) was enhanced in plaques. Meanwhile, the accumulation of SQSTM1 was also detected in CD68-positive cells in atherosclerotic plaques (), indicating that deficient macrophage autophagy existed in human atherosclerotic plaque. The fusion of autophagosomes and lysosomes is a critical step in the process of autophagy, which is regulated by ATG14 (an essential autophagosome-lysosomal fusion regulator) [Citation15]. As shown in (), although the intensity of CD68 (red) staining was increased in plaques, both the intensity of ATG14 (green) and colocalization of ATG14 and CD68 were reduced, comparable with adjacent normal tissue. Meanwhile, there was no difference in the intensity of LAMP2 (a marker of lysosomes [Citation17]) (green) in both adjacent normal tissue and plaques, even more LAMP2 and CD68-positive cells were present in plaques, suggesting the unaffected biological function of lysosomes in atherosclerotic plaque (). Taken together, overall impaired macrophage autophagy with a reduction of ATG14 expression existed in human atherosclerotic plaque.
Figure 1. Autophagy dysfunction with decreased ATG14 in macrophage in human atherosclerotic plaque. (A) Immunofluorescence analysis of human artery vascular specimens, which are separated as atherosclerotic regions (plaque) and adjacent normal tissues. Specimens were co-stained with LC3-II (green) and CD68 (red). The mean intensity for LC3-II and CD68 staining were analyzed, and colocalization (yellow) as well as correlation of staining intensity between plaque and adjacent normal tissues is quantified. (B) Plaque regions had higher levels of SQSTM1 (green) and CD68 (red) compared to adjacent normal tissues, and merged images (yellow) puncta were higher in plaque regions. (C) Representative confocal images show ATG14 (green), CD68 (red) and merged images (yellow) puncta in plaque regions and adjacent normal tissues. (D) Representative confocal images show LAMP2 (green), CD68 (red) and merged images (yellow) puncta in plaque regions and adjacent normal tissues. Values are expressed as the mean±SD, n = 16; *p ≤ 0.05, **p ≤ 0.01, ***p ≤ 0.001 vs. adjacent normal tissues
Ox-LDL induced autophagy dysfunction and decreased the expression of ATG14 in macrophages
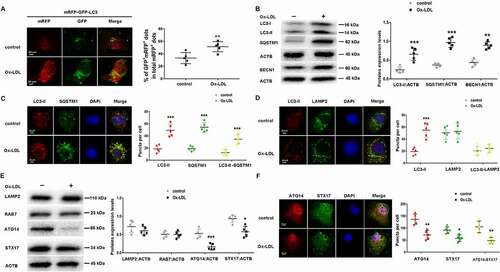
Raw 264.7 cells were treated with Ox-LDL (from 10 ng/ml to 50 µg/ml) and cells viability was determined by CCK-8 assay. Ox-LDL significantly decreased cell survival in a dose-dependent manner (Figure S1C). We treated Raw264.7 cells with Ox-LDL (10 ng/ml) for 24 h, finding increased apoptosis and autophagosomes accumulation with decreased expression of BCL2 (Figure S2). We examined the effect of Ox-LDL on macrophage autophagy using tandem fluorescent-tagged LC3 (mRFP-GFP-LC3) by confocal microscopy. As the GFP signal is quenched under acidic conditions, autolysosomes are labeled only by mRFP (GFP− mRFP+ puncta), while yellow puncta (GFP+ mRFP+ puncta) indicates pH-neutral autophagosomes, but after fusion with lysosomes, the pH-sensitive GFP signal diminishes and only red mRFP signal can be detected [Citation18,Citation19]. Ox-LDL significantly increased the yellow puncta (GFP+ mRFP+ puncta) meaning autophagosomes accumulation (). Western blot showed that LC3-II, SQSTM1 and BECN1/Beclin-1 were increased in Ox-LDL-treated cells, compared with controls (). Immunofluorescence revealed that both LC3-II (red) and SQSTM1 (green) intensity elevated in Ox-LDL-treated cells, and much of the LC3-II showed colocalization with SQSTM1 (yellow puncta) (). These results indicated that autophagy function was impaired in Ox-LDL-treated macrophage. To further visualize the state of autophagosome-lysosomal fusion, autophagosomes were stained with LC3-II (red) and lysosomes were stained with LAMP2 (green). After treatment of Ox-LDL for 24 h, the LC3-II-containing autophagosomes (red) were significantly elevated with no change of LAMP2-labeled lysosomes (green) and LC3-II colocalized with LAMP2 (yellow puncta), compared with controls, suggesting the defect of autophagosome-lysosomal fusion (). Next, compared with controls, reduction the ATG14 and STX17 with no change of RAB7 and LAMP2 in Ox-LDL-treated macrophage were detected (). Immunofluorescence revealed that the intensity of ATG14 (red) and STX17 (green) were reduced, and co-localization of ATG14 (red) with STX17 (green) was significantly decreased in Ox-LDL-treated cells (), suggesting that Ox-LDL impaired autophagosome-lysosomal fusion with reduction of ATG14 expression in macrophage.
Figure 2. Ox-LDL induced autophagy dysfunction and reduction in ATG14 expression in macrophage. (A) RAW264.7 cells were transfected with mRFP-GFP-LC3 or co transfected with 10 ng/ml oxidized-LDL (Ox-LDL) for 24 h. Representative confocal images show the images of GFP puncta and mRFP puncta. (B) RAW264.7 cells were exposed to 10 ng/ml Ox-LDL for 24 h, the expression of LC3-II, BECN1 and SQSTM1 were increased. (C) Representative confocal images show LC3-II (red), SQSTM1 (green) and merged images (yellow) puncta in Ox-LDL-treated RAW264.7 cells for 24 h. (D) Representative confocal images show LC3-II (red), LAMP2 (green) and merged images (yellow) puncta in Ox-LDL-treated RAW264.7 cells for 24 h. RAW264.7 cells were treated with Ox-LDL (10 ng/ml) for 24 h. (E) Western blots and quantification analysis showed the expressions of LAMP2, RAB7, ATG14 and STX17. (F) Representative confocal images show ATG14 (red), STX17 (green) and merged images (yellow) puncta in Ox-LDL-treated RAW264.7 cells for 24 h. Values are expressed as the mean±SD, n = 5; *p ≤ 0.05, **p ≤ 0.01, ***p ≤ 0.001 vs. the controls
ATG14 overexpression promotes autophagosome-lysosome fusion in Ox-LDL treated macrophage
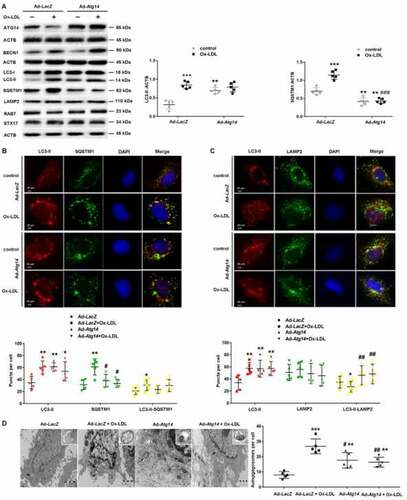
To investigate the effect of ATG14 on autophagosome fusion with lysosomes in Ox-LDL-treated macrophage, we infected RAW264.7 cells with Ad-Atg14 or Ad-LacZ for 48 h, and followed with Ox-LDL (10 ng/ml) treatment for 24 h. The expression of ATG14 was markedly upregulated after Ad-Atg14 infection, which was not inhibited by Ox-LDL (). In Ad-LacZ groups, Ox-LDL increased LC3-II and SQSTM1 expression. Interestingly, in Ad-Atg14 groups, the LC3-II expression was increased in all experimented cells. In contrast, Ox-LDL failed to increase the SQSTM1 levels in cells with Ad-Atg14 (). Additionally, no change of related proteins such as LAMP2, RAB7 and STX17 was detected in Ox-LDL-treated macrophage with Ad-Atg14 or Ad-LacZ. In the absence of Ox-LDL, ATG14 overexpression did not affect BECN1, compared with Ad-LacZ groups. However, higher levels of BECN1 were detected in Ox-LDL-treated macrophage with Ad-Atg14 (). Moreover, confocal images showed that the yellow puncta (GFP+ mRFP+ puncta) were decreased in Ad-Atg14 treated cells, comparable with Ad-LacZ groups (Figure S3). Next, we examined the LC3-II and SQSTM1 double-stained “yellow” puncta in these groups. Results showed that the numbers of yellow puncta were higher in Ad-LacZ and Ad-Atg14 groups, compared with controls. No different in the numbers of yellow puncta (LC3-II colocalized with SQSTM1) were detected between the Ad-LacZ and Ad-Atg14 groups (Figure S4). As shown in (), exogenous ATG14 expressing elevated the LC3-II(red) intensity and decreased SQSTM1 positive puncta (green dots) in Ox-LDL-treated cells, compared with Ad-LacZ. These results suggested that ATG14 is critical for SQSTM1 degradation in macrophage exposed to Ox-LDL. In (), exposed to Ox-LDL, in Ad-LacZ treated cells, the LC3-II-containing autophagosomes (red) were still higher, and the LC3-II co-localized with LAMP2 (yellow puncta) were declined. However, overexpressing ATG14 promoted the LC3-II (red) colocalization with LAMP2 (green), implying that ATG14 acted as a regulator during autophagosomes fuse lysosomes in Ox-LDL-treated macrophage. Electron microscopy showed that exposed to Ox-LDL, complete double-membrane autophagosome (bold arrows) were accumulation in Ad-LacZ-treated cells. Exogenous ATG14 expressing increased the autophagosomes adjacent to lysosomes and reduction in the number of autophagosome, suggesting formed in autolysosome in Ad-Atg14 groups (). Together, these results suggested that ATG14 may improve autophagosome-lysosome fusion.
Figure 3. ATG14 overexpression induces autophagosome-lysosome fusion in Ox-LDL-treated macrophage. RAW264.7 cells were infected with adenoviruses harboring ATG14 (Ad-Atg14) or adenovirus vector (Ad-LacZ) for 48 h, and followed with Ox-LDL (10 ng/ml) for 24 h. (A) Western blots and quantification analysis showed the expressions of ATG14, BECN1, LC3-II, SQSTM1, LAMP2, RAB7 and STX17. (B) Representative confocal images show LC3-II (red), SQSTM1 (green) and merged images (yellow) puncta in experimental cells. (C) Representative confocal images show LC3-II (red), LAMP2 (green) and merged images (yellow) puncta in experimental cells. (D) Representative images of electron microscopy reveal autophagic vacuoles accumulating in the cytoplasm of RAW264.7 cells. The arrows indicated autophagic vacuoles. Values are expressed as the mean±SD, n = 5; *p < 0.05, **p < 0.01, ***p ≤ 0.001 vs. the Ad-LacZ groups; #<0.05, ##p < 0.01, ###p ≤ 0.001 vs. the Ad-LacZ+Ox-LDL groups. Scale bars: 20 µm
ATG14 overexpression inhibits apoptosis and inflammatory cytokines secretion in Ox-LDL treated macrophage
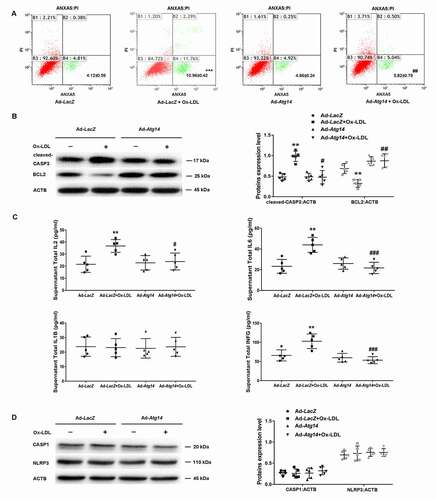
Next, we evaluated the effect of ATG14 overexpression on apoptosis of Ox-LDL-treated macrophage. Results showed that Ad-Atg14 significantly decreased Ox-LDL-induced apoptosis with declined cleaved-CASP3 (caspase 3) (), implying that ATG14 could withstand Ox-LDL-induced apoptosis in macrophage. Since autophagy dysfunction of macrophage promoted a proinflammatory state [Citation20], we examined the effects of ATG14 overexpression on cytokines production in RAW264.7 cells. When exposed to Ox-LDL, IL6, IL2 and INFG/INF-γ markedly increased in supernatants from Ad-LacZ-infected cells, which were markedly inhibited in Ad-Atg14-treated cells, with no difference in levels of IL1B (). However, there were no difference in expression of CASP1 and NLRP3 in all experimented cells (). Overall, these data suggest that ATG14 overexpression is a viable approach to reverse autophagy dysfunction by promoting autophagosome-lysosomal fusion in Ox-LDL-treated macrophage, resulting in the reduction of apoptosis and inflammatory cytokines production.
Figure 4. ATG14 overexpression inhibits apoptosis and inflammatory cytokines secretion in Ox-LDL-treated macrophage. (A) RAW264.7 cells were infected with adenoviruses harboring ATG14 (Ad-Atg14) or adenovirus vector (Ad-LacZ) for 48 h, and followed with Ox-LDL (10 ng/ml) for 24 h, Flow cytometry examined ANXA5 in experimental cells. (B) Western blots and quantification analysis showed the expressions of cleaved-CASP3 and BCL2. (C) Culture supernatant were assayed for IL1B, IL2, IL6 and INFG by ELISA (n = 5 independent wells for each treatment). (D) Western blots and quantification analysis showed the expressions of CASP1 and NLRP3.Values are expressed as the mean±SD, n = 5; **p < 0.01, ***p ≤ 0.001 vs. the Ad-LacZ groups; #<0.05, ##p < 0.01, ###p ≤ 0.001 vs. the Ad-LacZ+Ox-LDL groups
ATG14 overexpression promotes lipid degradation in Ox-LDL treated macrophage
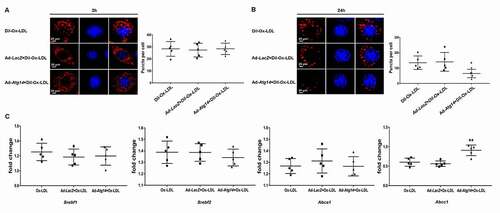
Next, we infected Raw264.7 cells with Ad-Atg14 or Ad-LacZ for 48 hours, followed by Dil-Ox-LDL (10 ng/ml) for 2 h, and incubated in normal cell culture medium for 24 h. At 2 h, red puncta were detected by fluorescence in all experimental cells with similar intensity (), suggesting that Ox-LDL uptake in macrophages was not affected. At 24 h, intracellular Dil-Ox-LDL content was significantly degraded in the Ad-Atg14 group, compared with Dil-Ox-LDL treated alone or Ad-LacZ treated with Dil-Ox-LDL group (). As shown in (), ATG14 promoted the genes expression of ABCC1 in Ox-LDL-treated cells, with no difference in the levels of SREBP1c, SREBP2 and ABCA1. These results implied that ATG14 overexpression promote lipid degradation.
Figure 5. ATG14 overexpression promotes lipid degradation in Ox-LDL treated macrophage. Representative confocal images show Dil-Ox-LDL (red) puncta in experimental RAW264.7 cells treated with Dil-Ox-LDL (10 ng/ml) for 2 h (A) or 24 h (B). Values are expressed as the mean±SD, n = 5; *p < 0.05 vs. the Dil-Ox-LDL groups. (C) RAW264.7 cells were exposed to 10 ng/ml Ox-LDL for 24 h. Gene expression of Srebf1/Srebp1c, Srebf2/Srebp2, Abca1 and Abcc1 were normalized to GAPDH and assessed. Values are expressed as the mean±SD, n = 5; **p < 0.01 vs. the Ox-LDL groups
ATG14 overexpression reduces atherosclerosis in apoe−/-mice
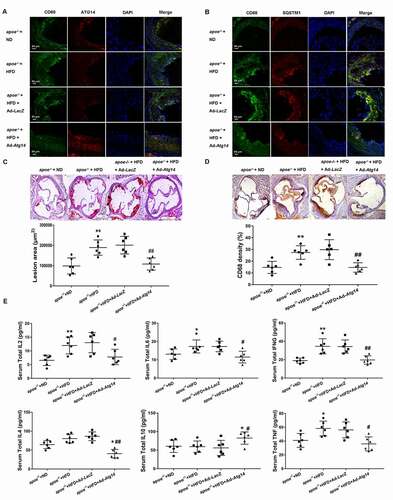
To investigate the effect of ATG14 overexpression in macrophage on the development of atherosclerosis, 6-week-old male apoe−/- mice were fed with normal chow diet or the atherogenic diet daily, and treated with Ad-Atg14 or Ad-LacZ by tail vein injection once a week. At the ages of 16 weeks, all the experimented mice were euthanized. Serum was examined in fasted mice before sacrifice. The areas of atherosclerotic lesions in the aortic roots were measured. During the experiments, no statistical differences in body weight were detected between the two groups. As shown in (), high-fat diet decreased the expression of ATG14, and elevated the level of CD68 in atherosclerotic plaques, compared with normal diet mice. The decreased expression of CD68 and elevated ATG14 were detected in atherosclerotic plaques in Ad-Atg14 treated mice. Meanwhile, high-fat diet increased the higher level of SQSTM1 (red) and CD68 (green) in atherosclerotic lesion in apoe−/- mice treated or not with Ad-LacZ, compared with normal diet mice. However, both CD68 and SQSTM1 were decreased in atherosclerotic lesion in apoe−/- mice treated with Ad-Atg14, compared with Ad-LacZ-treated mice (). Furthermore, we found that Ad-Atg14 significantly decreased atherosclerotic lesion area and CD68 density compared with high-fat diet fed mice treated or not with Ad-LacZ (), suggesting that overexpression of ATG14 in macrophage contributes to the alleviation of atherosclerosis. As shown in (), compared with high fat diet mice, treatment with Ad-LacZ did not affect the levels of IL2, IL6, TNF/TNF-α, IL4, IL10 and IFNG/IFN-γ. However, IL2, IL6, IL4, IFNG and TNF were significantly reduced in Ad-Atg14 treated mice, comparable with controls and Ad-LacZ-treated mice. Interestingly IL10 was higher in in Ad-Atg14 treated mice compared with high fat diet mice.
Figure 6. ATG14 overexpression reverses macrophage autophagy dysfunction and reduces atherosclerosis in apoe−/- mice. 6-week-old male apoe−/- mice were fed the normal diet (ND) or atherogenic diet (HFD) daily and treated with ATG14 adenoviruses (Ad-Atg14) or adenovirus vector (Ad- LacZ) by tail vein injection, once a week. At the ages of 16 weeks, all the experimented mice were euthanized. Representative immunofluorescence images of atherosclerotic aortic roots (10 weeks’ western diet) from all experimental mice stained with antibodies against CD68 and ATG14 (A), against CD68 and SQSTM1 (B). (C) Atherosclerotic plaque burden was quantified by computer image analysis of Oil Red O-stained aortic root sections with representative Oil Red O-stained aortic roots. (D) Macrophage content in aortic root sections was assessed by immunohistochemica using an antibody against CD68, and analyzed by CD68-positive area (scale bar: 200 µm). (E) Serum IL2, IL6, INFG, IL4, IL10 and TNF concentration were measured by ELISA from all experimental mice. Values are expressed as the mean±SD, n = 6; *p < 0.05, **p < 0.01 vs. the apoe−/- +ND groups; #p < 0.05, ##p < 0.01vs. the apoe−/- +HFD groups
ATG14 overexpression upregulate the population of Treg cells in apoe−/-mice
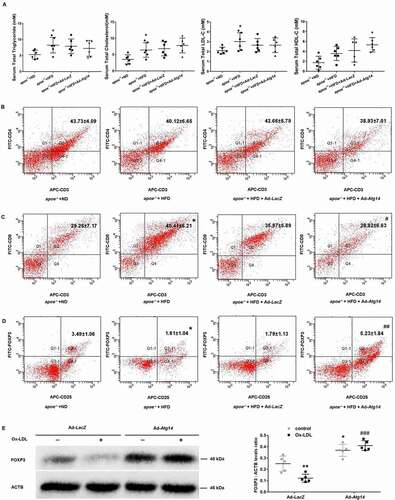
In order to observe whether the improvement of atherosclerosis is related to blood lipids, plasma lipids were measured in apoe−/- mice. Results showed that high fat diet increased the levels of TG, TC, LDL-C and HDL-C, compared to controls. However, Ad-Atg14-treated groups did not show any difference in serum levels of TG, TC, LDL-C and HDL-C, compared to high fat diet groups (), suggesting that the ATG14 was not involved in lipid metabolism. Next, we found there was no change in the presence of CD4+ cells in PBMC of all experimented mice (). Increasing in population of CD8+ cells was detected in high fat diet mice, compared with normal diet groups. The amount of CD8+ cells were decreased in Ad-Atg14-treated mice compared with high fat diet mice (). As shown in (), high fat diet decreased the population of CD25+ FOXP3+ regulatory T cells (Treg), compared with normal diet groups. However, an increase in population of CD25+ FOXP3+ Treg cells was detected in Ad-Atg14-treated mice. In (Figure S5A), apoptosis was decreased in the ATG14 overexpression atherosclerotic lesion. We further found that overexpression of ATG14 decreased CD8+ cells in the treated mice lesion with higher levels of FOXP3 (Figure S5B). Next, as shown in (), in Ad-LacZ groups, lower levels of FOXP3 were detected in Ox-LDL-treated Raw264.7 cells. The levels of FOXP3 were increased in both Ad-Atg14 and Ad-Atg14 exposed to Ox-LDL groups, implying that ATG14 possibly contributes Treg cells differentiation in RAW264.7 cells. Taking together, these results indicated that overexpression of ATG14 promote Treg cells differentiation, which inhibit inflammation and contribute to alleviate atherosclerosis.
Figure 7. Lipids and T lymphocyte subgroups in peripheral blood in ATG14 overexpression apoe−/- mice. Six-week-old male apoe−/- mice were fed the normal diet (ND) or atherogenic diet (HFD) daily, and treated with ATG14 adenoviruses (Ad-Atg14) or adenovirus vector (Ad-LacZ) by tail vein injection once a week. At the ages of 16 weeks, all the experimented mice were euthanized. (A) Serum levels of triglyceride (TG), total cholesterol (TC) and low-density lipoprotein cholesterol (LDL-C) were examined using automatic biochemistry analyzer. (B), (C) and (D) The proportion of T cells in peripheral blood was detected by flow cytometry. Values are expressed as the mean±SD, n = 6; *p < 0.05 vs. the apoe−/- +ND groups; #p < 0.05, ##p < 0.01vs. the apoe−/- +HFD groups. (E) RAW264.7 cells were infected with Ad-Atg14 or Ad-LacZ for 48 h, and followed with Ox-LDL (10 ng/ml) for 24 h. Western blots and quantification analysis showed the expressions of FOXP3. Values are expressed as the mean±SD, n = 5; *p < 0.05, **p < 0.01 vs. the Ad-LacZ groups; ###p ≤ 0.001 vs. the Ad-LacZ+Ox-LDL groups
Discussion
In the present study, we first provide direct evidence that augmenting ATG14 could alleviate atherosclerosis and inhibit inflammation via promotion of autophagosome- lysosome fusion in macrophage. We demonstrated that (1) impaired autophagy function with reduction of ATG14 expression existed in macrophage of human and mouse atherosclerotic plaque; (2) Ox-LDL impaired autophagosome-lysosomal fusion with reduction of ATG14 expression in macrophage; (3) overexpression of ATG14 in macrophage enhanced fusion of autophagosome with lysosomes and promoted lipid degradation, decreasing Ox-LDL-induced apoptosis and inflammatory response; (4) augmenting ATG14 expression reversed the autophagy dysfunction in macrophage of apoe−/- mice plaque, blunted SQSTM1 accumulation, inhibited inflammation, upregulated the population of Treg cells, and alleviated atherosclerosis. Thus, augmenting ATG14 could promote autophagy function in macrophage and contribute Treg cells differentiation, which is a viable approach to inhibit inflammation and reverse atherosclerotic plaque.
Data revealed that impairment of macrophage autophagy promoted atherosclerotic lipid accumulation, inflammation and plaque progression [Citation10,Citation21]. In our study, impaired autophagy with accumulation of SQSTM1 in macrophages from human and mice atherosclerotic plaque was confirmed. Ismail Sergio et al found that progressive macrophage autophagy-lysosomal dysfunction occurs in both mice and human atherosclerotic plaque [Citation11]. We further revealed that autophagy dysfunction was characteristic by the accumulation of autophagosomes and blocked autophagic flux with defected fusion of autophagosomes and lysosomes. Since plaque macrophages engulfed Ox-LDL or other modified lipoproteins leading to secrete many types of inflammatory factors such as IL1, IL6 and TNF [Citation2,Citation22]. We found increased pro-inflammatory cytokines IL2, IL6 and INFG in Ox-LDL treated macrophages, suggesting that overall inflammatory response was likely dependent on macrophage autophagic function. In addition, accumulation of autophagosomes could induce apoptosis through releasing of mitochondrial cytochrome C and activation of the caspase system, and SQSTM1 was involved in macrophage apoptosis in atherosclerotic plaque [Citation6,Citation23]. Our experiments observed that both the accumulation of autophagosomes and higher levels of SQSTM1 accompanying with apoptosis were increased in atherosclerotic macrophages in vitro.
The fusion of autophagosomes with lysosomes is precisely regulated by a set of proteins, such as ATG14, STX17, RAB7 and LAMP2 [Citation15]. Mature autophagosomes recruit STX17, forming a complex with SNAP29 and the lysosomal SNARE VAMP8 [Citation24]. RAB7 is involved in the biogenesis of the lysosome, phagosome, autophagosome, and other lysosome-related organelle [Citation25]. ATG14, co-localized with STX17 and LC3, is an indispensable part of the fusion machinery governing autophagosome fusion with lysosomes for degradation [Citation15]. In the present study, the levels of RAB7 and LAMP2 were no change in atherosclerotic macrophage, implying the healthful biological function of lysosomes in atherosclerotic macrophage. But, the reduction of ATG14 and STX17 and poor co-localization of ATG14 with STX17 in atherosclerotic macrophage revealed impaired autophagy function. Ox-LDL induced autophagy dysfunction with impaired autophagosome-lysosomal fusion in macrophage and decreased the expression of ATG14. ATG14 overexpression promoted autophagosome-lysosome fusion and lipid degradation, inhibited apoptosis and inflammatory cytokines IL2, IL6 and INFG secretion in Ox-LDL treated macrophage. Although ATG14 is one of the essential regulators of autophagosome-lysosome fusion, it plays a critical role in promoting autophagosome formation by regulating lipid kinase activity of PIK3C3/Vps34-BECN1-ATG14 complex [Citation26]. Knocking out of ATG14 caused a defect in autophagosome formation. However, in our study, although Ox-LDL downregulated the expression of ATG14, which was one third compared with the controls, the number of autophagosomes did not decrease markedly. The remaining ATG14 might contribute to autophagosome formation. In addition, BECN1 is required for the formation of the autophagic vesicle [Citation27]. Higher level of BECN1 in Ox-LDL-treated cells might compensatorily promote autophagosome formation.
In atherosclerosis, the macrophage functions as a scavenger cell, an immune mediator cell, and acts as a source of chemotactic molecules and cytokines. Induction of macrophage autophagy-lysosomal biogenesis promotes lipophagy and the delivery of cholesteryl esters, by which dampens inflammatory response and ameliorates atherosclerosis [Citation10,Citation28]. In our study, augmenting ATG14 expression reversed the autophagy dysfunction in macrophage of mice plaque by blunting SQSTM1 accumulation, inhibited the production of IL2, IL6, TNF, IL4 and INFG. Autophagy regulates CD4+ T cell proliferation, cytokine production and Treg cell differentiation, and autophagy blockade could be connected to inflammation [Citation29,Citation30]. Accordingly, we found that ATG14 increased the IL2RA/CD25+ FOXP3+ Tregs in the apoe−/- mice. Higher levels of FOXP3, the main transcription factor driving Treg cells differentiation [Citation31], were detected in ATG14 overexpression atherosclerotic macrophage, implying that ATG14 contribute to Treg cells differentiation. Tregs exert atheroprotective properties by secretion of anti-inflammatory cytokines and suppression of T-cell proliferation [Citation32]. Importantly, improvement of autophagy function during Tregs differentiation alters the inflammatory state of the lesion, resulting in regulating atherosclerosis onset and progression by limiting the activation of the innate immune system, and participates in inhibition the activity of T lymphocyte [Citation33,Citation34]. Here, we speculate that ATG14 regulate the Tregs cells differentiation and induce immunological self-tolerance and homeostasis in vivo, resulting in less macrophage in lesion. The underlying mechanisms deserve further study.
There are several limitations in this study. First, the enrolled atherosclerotic patients with aortic replacement surgery could only represent the advanced vascular lesion state. Whether our findings could extend to the various stages of the atheromatous lesions need further investigation. Second, the vitro process to dissect atherosclerotic regions (plaque) and adjacent normal tissues from the thoracic aorta of patients might influence our results. Third, systemic administration of inducible adenoviruses harboring ATG14 could also infect vascular endothelial cells or potentially have off-target effects by inducting cellular degradation in normal tissue, which may influence the process of atherogenesis. Fourth, macrophage-specific ATG14 overexpressed or knockout mice might provide more specific evidence to clarify its role in atherosclerosis.
In summary, we revealed that autophagy dysfunction existed in macrophage of human and mouse atherosclerotic plaque characterized by autophagosomes accumulation and autophagic flux blockage with defected fusion of autophagosomes and lysosomes. Overexpression of ATG14 in macrophage enhanced autophagy function by promoting fusion of autophagosome with lysosomes, which promoted lipid degradation, inhibited Ox-LDL-induced inflammatory response and upregulated Treg cells differentiation, leading to atherosclerosis alleviation. This novel mechanism to promote autophagic clearance of intracellular lipid and inhibition of inflammation response in macrophage provides an exciting new approach to reverse the progression of atherosclerosis.
Materials and methods
Materials
Recombinant adenovirus vector encoding the mouse Atg14 gene (Ad-Atg14) and control adenovirus vector (β-galactosidase, Ad-LacZ) were constructed, packaged, purified, and titrated at Genechem Co.Ltd (Shanghai, China). Oxidized low density lipoprotein and Dil-oxidized LDL were purchased from Shanghai Yeasen BioTechnologies Co. Ltd. (Ox-LDL, 20605ES05; Dil-ox-LDL, 20605ES76), Oil Red O and antibody against STX17 (B105253) were obtained from Sigma Aldrich Company. Antibodies against MAP1LC3/LC3 (microtubule-associated protein 1 light chain 3; 3868), SQSTM1/p62 (8025), RAB7 (9367), ATG14 (5504) BECN1 (3495), CASP3/caspase 3 (9664), CASP1/caspase 1 (3866), NLRP3 (15,101) and ACTB/β-actin (2118) were all from Cell Signaling Technology (CST, USA). Antibody against LAMP2/lysosomal-associated membrane protein 2 (SC-18,822), BCL2/Bcl-2 (sc-492) and FOXP3 (sc-166,212) were from Santa Cruz Biotechnology (USA). Antibody against CD8 (ab22378) was from Abcam Biotechnology (USA). Mouse IL1B/IL-1β, IL2, IL4, IL6, IL10, TNF/TNF-α and IFNG/IFN-γ levels were measured using ELISA kits (R&D System; MLB00C, M2000, M4000B, M6000B, M1000B, MTA00B, MIF00). TUNEL Apoptosis Detection Kit (A111-01) was from Vazyme Technology (China).
Human artery samples
Sixteen discarded vascular tissue of consecutive patients undergoing thoracic aorta replacement surgery for aortic pathologies were collected from our hospital between September 2017 and April 2019. Informed consent was obtained from all patients and the study was performed in accordance with the ethical guidelines of the Helsinki Declaration and approved by the first affiliated hospital with Nanjing Medical University ethics review committee (2016-SR-144). The removed arterial tissue was directly placed in cold saline and kept on ice during the transport to laboratory. Artery vascular specimens were then rapidly dissected into diseased atherosclerotic regions (plaque) and adjacent normal tissues, and placed in a tissue-freezing medium for sectioning and subsequent immunostaining.
Animal
Male 6-weeks-old homozygous apoe−/- mice were purchased from Model Animal Research Center of Nanjing University and kept in well-controlled animal housing facilities. Experimental mice were fed a normal chow diet or high-fat diet (Jiangsu Xietong BioTechnologies Co. Ltd. XT108C) adding libitum with 0.15% cholesterol and 21% lipid in the form of lard. Animal experiments were approved by the Institutional Animal Care and Use Committee (IACUC) of Nanjing Medical University for the use of experimental animals. Adenovirus vector carrying the mouse Atg14 gene (GENE ID:100,504,663, Ad-Atg14) or β-galactosidase (Ad-LacZ) was delivered to apoe−/- mice by tail vein injection at 5 × 10⁹ viral genome per mouse, one time/week. At the 16th weekend after adenovirus infection, all mice were sacrificed under anesthesia. Mice were fasted 12 h overnight prior to the collection of blood samples by retro-orbital venous plexus bleeding at baseline before sacrifice. After being allowed to clot at 4°C overnight, blood samples were centrifuged at 1,500 × g for 5 min and the serum stored at −20°C until required.
Cell culture and treatment
Raw264.7 cells were purchased from American Type Culture Collection (TIB-71TM). Cells were counted and cultured (RPMI 1640 supplemented with 10% fetal bovine serum (FBS) (ScienCell, Group Ltd, 0500) at a density of 2 × 10⁵ in 6-well plates at 37°C in 5% CO2. Cultured cells were used for experiments between passages 3 and 6 when the cells reached 80–90% confluence. To upregulate ATG14, adenovirus vector carrying the mouse Atg14 gene (Ad-Atg14) or β-galactosidase (Ad-LacZ) was delivered to Raw264.7 cells according to manufacturer’s protocol. Experimental cells were treated with 10 ng/ml Ox-LDL or 10 ng/ml Dil-Ox-LDL supplement with 5% FBS for 2 h, 24 h, and the same volume PBS (Gibco, C10010500BT) as control. Expression of autophagy proteins was assessed by western blotting and immunofluorescence.
Cell viability assays
The effect of different concentrations (from 10 ng/ml to 50 µg/ml) of ox-LDL on Raw264.7 cells viability was assessed by cell counting kit-8 (CCK8; Beyotime Biotechnology Co. Ltd. C0041) according to the protocol. The 2 × 10³ cells were seeded in 96-well plates for 24 h, and cells were treated ox-LDL as indicated (from 0.5 h to 24 h). 10 μL CCK-8 solution was added to 100 μL medium per well and incubated in the dark for 2 h. Densities of the wells were read on a microplate reader. The percentage of living cells was calculated by the ratio of optical density of the experimental wells to that of the normal wells. The experiment was repeated three times.
Tandem mRFP-GFP-LC3 assay
RAW264.7 cells were transfected with mRFP-GFP-LC3 or co transfected with the indicated material for 24 h. Next, cells were fixed with 4% PFA (dissolved in PBS) at 37°C for 15 min, sealed with nail polish and observed under an LSM-510 (Zeiss) confocal fluorescence microscope. Cells were randomly selected, and the numbers of GFP puncta and mRFP puncta were counted manually in a two-blinded manner. The percentage of GFP+ mRFP+ puncta, number of GFP+ mRFP+ puncta were calculated based on the numbers of mRFP puncta.
Immunostaining
Human vascular tissue or mice aortic root cross-section were fixed, embedded, and sectioned into 5 µm thick slices and stained with Oil Red O (Sigma-Aldrich, O1391). For immunohistochemistry, vascular section form mice were incubated with antibody against CD68 at 4°C overnight, incubated with appropriated secondary antibodies for 1 h at room temperature, detected with 3,3,-diaminobenzidine, and were counterstained with hematoxylin. For immunofluorescence, vascular tissue sections from human, mice or cells were labeled with primary antibodies at 4°C overnight, incubated with appropriated secondary antibodies conjugated with Alexa Fluor 594 or 488 (Invitrogen, A11072, A11006) for 1 h at room temperature. The colocalization of CD68 (green) and ATG14 (red) in apoe−/- atherosclerotic lesion were analyzed by immunostaining. Dil-Ox-LDL was used according to the manufacture’s protocol. Slides were examined using laser scanning confocal microscope (Carl Zeiss). The datasets generated were merged and displayed with the LSM510 software (Carl Zeiss, Inc.). In the experiments of human vascular tissue or mice, the immunofluorescence staining was quantified per field averaged for each condition. Fields were chosen randomly from various sections to ensure objectivity of sampling. In the experiments of cells, the fluorescence intensity was quantified in 20 cells and averaged for each condition. To control for batch-to-batch variability, fluorescence intensity was normalized to the intensity of cells, which were stained simultaneously and an objective magnification of 40 × . Final intensity was calculated by dividing the average fluorescence intensity for the subject sample by the average fluorescence intensity of the sample and multiplying by 100. The intensity is expressed in arbitrary units (AU).
Western blotting
Treated RAW264.7 cells were lysed on ice in RIPA buffer for 20 min in the presence of protease inhibitor (Sigma-Aldrich, R0278). The protein concentration was assayed by the BCA method using the BCA assay kit (Bio Rad, 5,000,002). Protein, 40 μg per lane, was separated on 8–15% SDS-PAGE and transferred to polyvinylidene difluoride (PVDF) membrane (Millipore, HATF09025), then blotted with antibodies. Membrane was incubated with a 1:1000 dilution of primary antibody, followed by a 1:5000 dilution of horseradish peroxidase-conjugated secondary antibody (Bio-Rad, 10,022,145). Detection of the bands was done using Chemi Doc XRS System (Bio-Rad). Immunoblots were visualized by ECL (GE Healthcare, RPN2109) and analyzed using ImageJ software version 1.37 (http://imagej.nih.gov/ij/). Samples were normalized to ACTB/β-actin. At least five samples per group were analyzed.
Analysis of apoptosis by flow cytometry
Early apoptotic cells were determined using ANXA5/annexin V-propidium iodide (PI) detection kit (BD, 556,547). After removing the supernatant, adherent RAW264.7 cells were collected, then digested with trypsin and incubated with FITC-conjugated ANXA5 and PI according to the manufacturer’s protocol. The fluorescence of cells was analyzed with a flow cytometer and Kaluza1.3 (Beckman Gallious). ANXA5-positive and PI-negative cells were considered as early apoptotic cells, and were quantified using FACScan (Beckman Gallious). Data were analyzed with Kaluza1.3 (Beckman Gallious) and FlowJo software (Tree Star Inc.).
Electron microscopy
Treated macrophage were prefixed in 2% glutaraldehyde in PBS at 4°C overnight, treated with 1% OsO4 for 3 h at 4°C, dehydrated in a graded series of ethanol and flat embedded in epon (Ted Pella, 18,012). Ultra-thin sections were doubly stained with uranyl acetate and examined using an electron microscopy (JEM-1010) at 80Kv.
Cytokines measurement
Cell culture supernatants and the serum were analyzed for mouse IL1B, IL2, IL4, IL6, IL10, TNF and IFNG levels by ELISA kits (R&D System, MLB00C, M2000, M4000B, M6000B, M1000B, MTA00B, MIF00), according to the manufacture’s protocol.
Blood lipids determination
Serum total cholesterol (TC), triglyceride (TG) and low density lipoprotrein cholesterol (LDL-C) concentrations were measured by use of an automatic biochemistry analyzer (Hitachi, Tokyo, Japan).
T cell subsets assay
The proportion of T cells in peripheral blood was detected using the Mouse T Cell Staining Kit (BD, 551,163, 553,046, 553,042). Peripheral blood mononuclear cells (PBMCs) were isolated and erythrocytes were lysed using erythrocyte lysis buffer. The PBMCs were surface-stained with mouse anti-CD3-APC mAbs (BD, 551,163), anti-CD4-FITC mAbs (BD, 553,046), anti-CD8-FITC mAbs (BD, 553,032), anti-FOXP3-FITC mAbs (R&D System, CDK007) and anti-CD25-APC mAbs (R&D System, CDK007) followed by fixation and permeabilization with Cytofix/Cytoperm and intracellular staining with anti-FOXP3-FITC mAbs, according to the manufacturer’s protocol. Cells were gated on the FOXP3+ CD25+ population for analysis of Treg cells. All data were obtained on a FACSCalibur and analyzed with CELLQuest Pro software (BD Bioscience).
RT qPCR assay
Total RNA was extracted using the Nucleospin RNA Kit (Macherey Nagel, 740,955.250). RNA (2 μg) was reverse transcribed into cDNA, and 2 μl of cDNA, 0.4 μl of each primer(10 μmol/μl), and 10 µl of PowerUp SYBY Green qPCR Master Mix (Thermo Fisher, A25742) and analyzed with the QuanStudio software (Applied Biosystems). The cycle threshold values were used to calculate the expression of SREBP1c, SREBP2, Abca1 and Abcc1 against Gapdh. The sequences of primer pairs are listed in ().
Table 1. The sequences of primer pairs
Statistical analysis
All statistical analyses were performed with SPSS 23.0 software. The data were presented as means ± SD. Differences between groups (for more than two groups) were analyzed by one-way ANOVA; unpaired two-tailed Student’s t-tests were used after data fulfilled the criteria of normal distribution and equal variance; otherwise, Mann–Whitney U-tests were used. P < 0.05 was considered to indicate statistical significance. The number of experimental samples used in each group was presented in the figure legends.
Supplemental Material
Download Zip (11 MB)Disclosure statement
No potential conflict of interest was reported by the author(s).
Supplementary material
Supplemental data for this article can be accessed here
Additional information
Funding
Related Research Data
References
- Peter L, Hansson GRK. Inflammation and immunity in diseases of the arterial tree: players and layers. Circ Res. 2015;116(2):307.
- Hansson GK, Berne GP. Atherosclerosis and the immune system. Acta Paediatrica. 2004;93:63–69.
- Florent G, Steffen J. Monocytes and macrophages: developmental pathways and tissue homeostasis. Nat Rev Immunol. 2014;14(6):392–404.
- Mizushima N, Komatsu M. Autophagy: renovation cells tissues. Cell. 2011;147(4):728–741.
- Mukhopadhyay S, Panda PK, Sinha N, et al. Autophagy and apoptosis: where do they meet?. Apoptosis: Int J programmed cell death. 2014;19(4):555–566.
- Sergin I, Bhattacharya S, Emanuel R, et al. Inclusion bodies enriched for p62 and polyubiquitinated proteins in macrophages protect against atherosclerosis. Sci Signaling. 2016;9(409):ra2.
- Liu K, Zhao E, Ilyas G, et al. Impaired macrophage autophagy increases the immune response in obese mice by promoting proinflammatory macrophage polarization. Autophagy. 2015;11(2):271–284.
- Razani B, Feng C, Coleman T, et al. Autophagy links inflammasomes to atherosclerotic progression. Cell Metab. 2012;15(4):534–544.
- Franco LH, Fleuri AKA, Pellison NC, et al. Autophagy downstream of endosomal toll-like receptor signaling in macrophages is a key mechanism for resistance to leishmania major infection. J Biol Chem. 2017;292(32):13087–13096.
- Ouimet M, Franklin V, Mak E, et al. Autophagy regulates cholesterol efflux from macrophage foam cells via lysosomal acid lipase. Cell Metab. 2011;13(6):655–667.
- Sergin I, Evans TD, Zhang X, et al. Exploiting macrophage autophagy-lysosomal biogenesis as a therapy for atherosclerosis. Nat Commun. 2017;8(1):15750.
- Mijaljica D, Prescott M, Devenish RJ. Autophagy in disease. Methods Mol Biol. 2010;648:79–92.
- Zhang H, Ge S, He K, et al. FoxO1 inhibits autophagosome-lysosome fusion leading to endothelial autophagic-apoptosis in diabetes. Cardiovasc Res. 2019;115(14):2008–2020.
- Mizushima N, Levine B, Cuervo AM, et al. Autophagy fights disease through cellular self-digestion. Nature. 2008;451(7182):1069.
- Diao J, Liu R, Rong Y, et al. ATG14 promotes membrane tethering and fusion of autophagosomes to endolysosomes. Nature. 2015;520(7548):563–566.
- Liu R, Zhi X, Zhong Q. ATG14 controls SNARE-mediated autophagosome fusion with a lysosome. Autophagy. 2015;11(5):847–849.
- Hubert V, Peschel A, Langer B, et al. LAMP-2 is required for incorporating syntaxin-17 into autophagosomes and for their fusion with lysosomes. Biol Open. 2016;5(10):1516–1529.
- Mizushima N, Yoshimori T, Levine B. Methods in mammalian autophagy research. Cell. 2010;140(3):313–326.
- Kimura S, Noda T, Yoshimori T. Dissection of the autophagosome maturation process by a novel reporter protein, tandem fluorescent-tagged LC3. Autophagy. 2007;3(5):452–460.
- Kun L, Enpeng Z, Ghulam I, et al. Impaired macrophage autophagy increases the immune response in obese mice by promoting proinflammatory macrophage polarization. Autophagy. 2015;11(2):271–284.
- Liao X, Sluimer JC, Wang Y, et al. Macrophage autophagy plays a protective role in advanced atherosclerosis. Cell Metab. 2012;15(4):545–553.
- Ge S, Zhou G, Cheng S, et al. Anti-atherogenic effects of montelukast associated with reduced MCP-1 expression in a rabbit carotid balloon injury mode. Atherosclerosis. 2009;205(1):74–79.
- Maiuri MC, Zalckvar E, Kimchi A, et al. Self-eating and self-killing: crosstalk between autophagy and apoptosis. Nat Rev Mol Cell Biol. 2007;8(9):741–752.
- Itakura E, Mizushima N. Syntaxin 17: the autophagosomal SNARE. Autophagy. 2013;9(6):917–919.
- Wang T, Ming Z, Wu X, et al. Rab7: role of its protein interaction cascades in endo-lysosomal traffic. Cell signalling. 2011;23(3):516–521.
- Matsunaga K, Saitoh T, Tabata K, et al. Two Beclin 1-binding proteins, Atg14L and Rubicon, reciprocally regulate autophagy at different stages. Nat Cell Biol. 2009;11(4):385–396.
- Zeng X, Overmeyer JH, Maltese WA. Functional specificity of the mammalian Beclin-Vps34 PI 3-kinase complex in macroautophagy versus endocytosis and lysosomal enzyme trafficking. J Cell Sci. 2006;119(2):259–270.
- He J, Zhang G, Pang Q, et al. SIRT6 reduces macrophage foam cell formation by inducing autophagy and cholesterol efflux under ox-LDL condition. Febs J. 2017;284(9):1324–1337.
- Deretic V, Saitoh T, Akira S. Autophagy in infection, inflammation and immunity. Nat Rev Immunol. 2013;13(10):722–737.
- Wei J, Long L, Yang K, et al. Autophagy enforces functional integrity of regulatory T cells by coupling environmental cues and metabolic homeostasis. Nat Immunol. 2016;17(3):277–285.
- Saigusa R, Winkels H, Ley K. T cell subsets and functions in atherosclerosis. Nat Rev Cardiol. 2020;17(7):387–401.
- Spitz C, Winkels H, Burger C, et al. Regulatory T cells in atherosclerosis: critical immune regulatory function and therapeutic potential. Cell mol life sci: CMLS. 2016;73(5):901–922.
- Zhang J, Chen L, Xiong F, et al. Autophagy in regulatory T cells: a double-edged sword in disease settings. Mol Immunol. 2019;109:43–50.
- Mandatori S, Pacella I, Marzolla V, et al. Altered Tregs Differentiation and Impaired Autophagy Correlate to Atherosclerotic Disease. Front Immunol. 2020;11:11.