
ABSTRACT
Presbycusis is the cumulative effect of aging on hearing. Recent studies have shown that common mitochondrial gene deletions are closely related to deafness caused by degenerative changes in the auditory system, and some of these nuclear factors are proposed to participate in the regulation of mitochondrial function. However, the detailed mechanisms involved in age-related degeneration of the auditory systems have not yet been fully elucidated. In this study, we found that FOXG1 plays an important role in the auditory degeneration process through regulation of macroautophagy/autophagy. Inhibition of FOXG1 decreased the autophagy activity and led to the accumulation of reactive oxygen species and subsequent apoptosis of cochlear hair cells. Recent clinical studies have found that aspirin plays important roles in the prevention and treatment of various diseases by regulating autophagy and mitochondria function. In this study, we found that aspirin increased the expression of FOXG1, which further activated autophagy and reduced the production of reactive oxygen species and inhibited apoptosis, and thus promoted the survival of mimetic aging HCs and HC-like OC-1 cells. This study demonstrates the regulatory function of the FOXG1 transcription factor through the autophagy pathway during hair cell degeneration in presbycusis, and it provides a new molecular approach for the treatment of age-related hearing loss.
Abbreviations: AHL: age-related hearing loss; baf: bafilomycin A1; CD: common deletion; D-gal: D-galactose; GO: glucose oxidase; HC: hair cells; mtDNA: mitochondrial DNA; RAP: rapamycin; ROS: reactive oxygen species; TMRE: tetramethylrhodamine, ethyl ester
Introduction
Presbycusis, also known as age-related hearing loss (AHL) [Citation1], is a common ailment among elderly populations, and its incidence is increasing as populations continue to age. AHL has negative psychological, physical, and cognitive influences in the elderly and is associated with a lack of self-confidence, anxiety, and depression [Citation2]. Unfortunately, the causes of AHL are not fully understood, but its etiology is likely to be a combination of genetic factors, noise exposure, ototoxic drugs, and other factors [Citation3]. Many studies have shown that reactive oxygen species (ROS) and mitochondrial structural and functional abnormalities are also important causes of AHL in the elderly [Citation4–7]. The production of ROS occurs mainly in the mitochondrial oxidative respiratory chain, thus mitochondrial structural and functional disorders can lead to mitochondrial ROS accumulation [Citation5]. These active oxygen radicals cause damage to macromolecules such as proteins and DNA, which in turn trigger the degradation of tissues and organs [Citation8].
The mitochondrial DNA (mtDNA) is vulnerable to attack by various oxygen radicals [Citation9], and mtDNA deletions and mutations are directly related to degenerative changes in the auditory system [Citation10]. Aging has been associated with the mtDNA common deletion (CD) mutation, and somatic mutations in mtDNA have been found to accumulate progressively in a variety of tissues during aging in humans, monkeys, and rodents [Citation11]. In a previous study, we found that the 4834-base pair (bp) deletion in mtDNA was significantly increased in the rat mimetic aging model induced by D-galactose (D-gal) [Citation12], and it has been reported that the 4834-bp deletion in the mtDNA of the auditory cortex, inferior colliculus, and cochlear nucleus is associated with aging [Citation13]. In animal and clinical studies, it has been found that the rate of mtDNA CD is high in individuals with degenerative hearing loss [Citation14–18]. Previous research has suggested that the mtDNA 4834-bp deletion might not induce hearing loss directly but might act instead as a predisposing factor that greatly enhances the sensitivity of cochlear hair cells (HCs) to aminoglycoside antibiotics [Citation19]. However, the detailed mechanism through which mtDNA CD mutations lead to degeneration of the hearing system remains unclear.
Nuclear transcription factors play an important role in the regulation of mitochondrial function [Citation20], and the FOX family of nuclear transcription factor genes regulates the transcription of various anti-oxidation genes and development-related genes [Citation21]. FOXGl is an important member of the Fox gene family and is expressed in auditory HCs and plays important roles in the development of the auditory system through multiple signaling pathways [Citation22]. FOXG1 regulates the process of ATP synthesis and metabolism in cell mitochondria [Citation23], and it influences HC survival in the postnatal cochlea through multiple signaling pathways [Citation24]. However, there are very few reports on the function or mechanism of FOXG1 in HC degeneration in AHL. FOXG1 is also known to regulate mitochondrial energy metabolism and biosynthesis [Citation25–27], but it is unknown whether aspirin affects degenerative processes in HCs by affecting the expression of Foxg1.
Autophagy is a dynamic mechanism of cell defense and self-protection and is an effective way for cells to eliminate toxic and harmful substances [Citation28]. As an organism ages, the degeneration of cell membrane lipoproteins and organelle damage caused by oxidative stress are important factors leading the functional degradation of organs and cells [Citation29,Citation30], and autophagy can promote cell survival by removing the impaired proteins and nonfunctional organelles [Citation31]. The increasingly damaged mitochondria caused by mtDNA deletions and ROS during the aging process can be removed by autophagy [Citation32], and during nutrient stress autophagy sustains continuous synthesis and maintenance of mtDNA and prevents mtDNA degradation caused by mitochondrial ROS production [Citation33,Citation34]. In erythroid cells, defects in autophagy lead to an accelerated decline in mitochondrial respiration and to the development of macrocytic anemia in aged mtDNA-mutator mice [Citation35]. However, the relationship between FOXG1 and autophagy in HC degeneration in AHL have not been reported. Because FOXG1 is also known to regulate mitochondrial energy metabolism and biosynthesis [Citation25–27], and because autophagy removes the damaged mitochondria caused by mtDNA deletions and ROS accumulation during the aging process [Citation32], we hypothesized that FOXG1 might play an important role in regulating the autophagy pathway in order to promote HC survival.
Aspirin has been widely used in clinical practice for its analgesic, anti-inflammatory, antipyretic, antithrombotic, and anti-rheumatic effects, and it has been used for platelet aggregation inhibition and for the prevention of gastrointestinal tumors [Citation36–39]. With increasing research on the pharmacological effects of aspirin, aspirin has been shown to also play important roles in the prevention and treatment of dementia diseases such as Alzheimer disease and Huntington syndrome [Citation40–42]. In studies with mice and nematodes, it has been shown that the long-term use of aspirin can prolong life span and can have anti-aging effects [Citation43]. Aspirin, as a free radical scavenger, is able to effectively inhibit the accumulation of ROS [Citation44] and specifically promotes mitophagy to eliminate malfunction mitochondria in cardiomyocytes [Citation45]. Previous research has reported that aspirin can induce autophagy by activating AMPK and inhibiting MTORC1 signaling in cancer cells [Citation46,Citation47]. However, in this process, whether nuclear transcription factors are also involved in the regulation of autophagy after aspirin treatment has not been reported.
In order to reveal the relationship between FOXG1 and autophagy, and to elaborate on the role and mechanism of FOXG1 in the process of HC degeneration in AHL, we took advantage of the D-gal–induced mimetic aging rat model and cell model as previously reported [Citation10,Citation48,Citation49]. We found that inhibition of FOXG1 significantly decreased autophagy activity and led to the accumulation of ROS and to increased apoptosis of cochlear HCs in the mimetic aging models. In addition, we demonstrated that aspirin treatment activated the FOXG1 expression and autophagy pathway, which reduced the ROS level and inhibited apoptosis and ultimately promoted the survival of mimetic aging HCs and HC-like OC-1 cell. Thus, regulation of FOXG1 might be a new therapeutic target for the prevention of HC degeneration in AHL.
Results
FOXG1 is expressed in the central and peripheral auditory organs and HC-like OC-1 cells, and the expression of FOXG1 is affected by age
Previous reports showed that the 4834-bp deletion ratio in mtDNA and related aging indicators are significantly increased in the D-gal–induced rat aging model [Citation12], and FOXG1 has been reported to regulate mitochondrial functions and structure in cortex organs [Citation23]. Here we hypothesized that mtDNA CD mutations together with nuclear factors are involved in the process of auditory degeneration. We first investigated the expression of FOXG1 in the central and peripheral auditory organs. The 4-week-old rats in the mimetic aging group were treated with 500 mg/kg/day D-gal via subcutaneous injection for 8 weeks. The rats in the control group were injected with normal saline on the same schedule. After the 8 weeks of injections, the rats in the two groups were further divided into the 0-month post injection, 12-month post injection, and 24-month post injection subgroups ()). The western blot data showed that the FOXG1 expression levels in the central auditory system (the auditory cortex and the hippocampus) and in the peripheral auditory organs (the cochlea) did not change significantly in the 0-month post-injection subgroup ()-(K)). In the 12-month post-injection subgroup, FOXG1 expression levels in the auditory cortex decreased significantly compared to controls ()-(E), p< 0.05, n = 3), while the expression of FOXG1 increased significantly in the cochlea compared to controls () and (M), p< 0.01, n = 3). In the 24-month post-injection subgroup, the cochlear FOXG1 expression levels were decreased significantly compared to the controls () and (O), p< 0.01, n = 3). These results suggest that FOXG1 might play different roles in the cochlea than in the central auditory system and might be part of the reason for why the different organs have different rates of aging. In addition, we compared the expression levels of FOXG1 in the cochlea at different times (0, 12, and 24 months) after D-gal treatment. We found that the expression levels of FOXG1 in the cochlea increased significantly at 12 months and decreased at 24 months () and (Q), p< 0.05, n = 3). These results indicate that the expression levels of FOXG1 may be related to the different stages of the cochlear aging process.
Figure 1. Changes in FOXG1 in the central auditory, peripheral auditory organs and OC-1 cells after D-gal treatment. (A) Rats were injected with D-gal or saline. (B) Western blot showing the changes in FOXG1 expression in the cortex at 0 months after the last D-gal injection, n = 3. (C) Quantification of the western blot in B. (D) Western blot showing the changes in FOXG1 expression in the cortex at 12 months after the last D-gal injection, n = 3. (C) Quantification of the western blot in D. (F) Western blot showing the changes in FOXG1 expression in the hippocampus at 0 months after the last D-gal injection, n = 3. (G) Quantification of the western blot in F. (H) Western blot showing the changes in FOXG1 expression in the hippocampus at 12 months after the last D-gal injection, n = 3. (I) Quantification of the western blot in H. (J) Western blot showing the changes in FOXG1 expression in the cochlea at 0 month after the last D-gal injection, n = 3. (K) Quantification of the western blot in J. (L) Western blot showing the changes in FOXG1 expression in the cochlea at 12 months after the last D-gal injection, n = 3. (M) Quantification of the western blot in L. (N) Western blot showing the changes in FOXG1 expression in the cochlea at 24 months after the last D-gal injection, n = 3. (O) Quantification of the western blot in N. (P) Western blot showing the changes in FOXG1 expression in the cochlea at 0 months, 12 months, and 24 months after the last D-gal injection, n = 3. (Q) Quantification of the western blot in P. (R) OC-1 cells were treated with D-gal. (S) Western blot showing the changes in FOXG1 expression in the OC1 cells after D-gal treatment, n = 5. (T) Quantification of the western blot in S. For all experiments, *p< 0.05, **p< 0.01, ***p< 0.001. NS = not significant
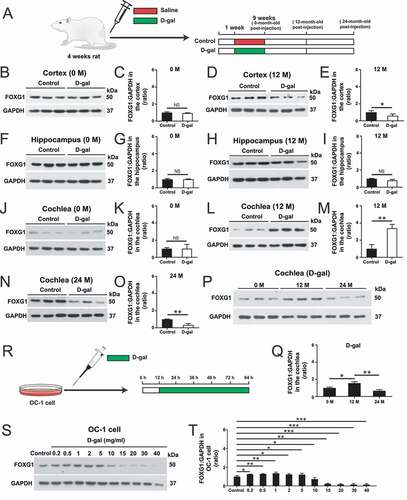
To further explore the role of FOXG1 in auditory HCs, we used the OC-1 cell line – which expresses several molecular markers of cochlear HCs – as a model of D-gal–induced cell degeneration [Citation50,Citation51]. The OC-1 cells were treated with different D-gal concentrations (0.2 mg/mL, 0.5 mg/mL, 1 mg/mL, 2 mg/mL, 5 mg/mL, 10 mg/mL, 15 mg/mL, 20 mg/mL, 30 mg/mL, and 40 mg/mL) for 72 h. The CCK8 results showed that the cell density began to decrease when the concentration of D-gal was higher than 2 mg/ml, and the cell density was significantly decreased when the D-gal concentration was 5 mg/ml or higher (Figure S1A, p< 0.05, n = 5). We used propidium iodide to label the dead cells and ANXA5/annexin V to label the cells undergoing apoptosis. After different concentrations D-gal treatment, the proportions of both dead and apoptotic cells were significantly increased compared to the controls (Figure S1B-D, p< 0.001, n = 5). The immunofluorescence staining with cleaved-CASP3 and TUNEL showed that the proportions of cleaved-CASP3-positive cells and TUNEL-positive cells in the 2 mg/mL and 15 mg/mL D-gal–treated groups were both significantly greater than the controls (Figure S1E-H, p< 0.05, n = 5). The mtDNA CD test of D-gal–induced aging cells showed that the mtDNA loss became significant compared to controls when the concentration of D-gal reached 2 mg/ml and became more severe with increasing D-gal concentration (Figure S1I, p< 0.05, n = 5). Intracellular accumulation of ROS is an indicator of aging and plays important roles in AHL [Citation52]. Mito-SOX Red was used to detect the mitochondrial ROS levels in D-gal–induced aging OC-1 cells, and immunofluorescence staining and flow cytometry results showed that the ROS level was significantly increased compared to controls when the D-gal concentration was 0.5 mg/mL and continued to increase with increasing D-gal concentrations (Figure S2A-C, p< 0.05, n = 5). The levels of ROS in OC-1 cells also increased with the extension of D-gal treatment time. We found that ROS levels increased significantly when cells were treated with 15 mg/mL D-gal for more than 24 h (Figure S2D-E, p < 0.05, n = 5). Then we detected the expression of FOXG1 in D-gal–induced aging OC-1 cells after treated with different concentrations of D-gal for 72 h ()). The western blot results showed that the expression of FOXG1 had a tendency to increase at lower concentrations of D-gal but decreased with increasing D-gal concentration () and (T), p < 0.05, n = 5). The FOXG1 expression levels increased at 0.2–5 mg/mL D-gal, indicating that low concentrations of D-gal might activate the pro-survival effect of FOXG1 as a self-protection mechanism. When the D-gal concentration was higher than 10 mg/mL, the expression of FOXG1 was significantly decreased, which is consistent with the invivo data in the cochlea. These results indicated that FOXG1 might play an important protective role in the survival of D-gal–induced aging HCs and OC-1 cells, but when the cell damage exceeds the cell’s capacity to repair it FOXG1 expression is significantly reduced, the cell aging process is accelerated, and apoptosis increases.
The level of autophagy changes in D-gal–induced aging central and peripheral auditory organs and OC-1 cells
To determine the autophagy level in the D-gal–induced aging animal model, we dissected the central auditory system and peripheral auditory organs (the cochlea) from rats and extracted proteins for western blot of LC3B as an indicator of autophagy ()). The autophagy level did not change at 0 months after D-gal treatment in either set of organs ()-(K)). At 12 months after D-gal treatment, the autophagy level in the central auditory system (the acoustic cortex and the hippocampus) was significantly decreased, while the autophagy level in the cochlea was significantly increased ()-(M), p < 0.05, n = 3). In addition, at 24 months after D-gal treatment we found that the autophagy level was also significantly decreased in the cochlea () and (O), p < 0.01, n = 3). These results indicated that there are different spatial and temporal regulatory mechanisms of autophagy pathways between the central auditory system and the peripheral auditory organs. We also compared the autophagy levels in the cochlea at different times (0, 12, and 24 months) after D-gal treatment. We found that the autophagy level was significantly increased at 12 months and decreased at 24 months () and (Q), p < 0.05, n = 3). To confirm changes in autophagy levels in the cochlea, we used anti-SQSTM1/p62, which is an autophagosome cargo protein and can be degraded by the autophagosome [Citation53–55], to analyze the changes in the degradation level of autophagy substrates in the cochlea at different times after D-gal treatment. We found that the protein level of SQSTM1/p62 was significantly decreased in the cochlea at 12 months compared with 0 months and increased at 24 months () and (R), P < 0.05, n = 3).
Figure 2. Changes in LC3B in the central auditory and peripheral auditory organs at different times after D-gal treatment. (A) Rats were injected with D-gal or saline. (B) Western blot showing the changes in LC3B expression in the cortex at 0 months after the last D-gal injection, n = 3. (C) Quantification of the western blot in B. (D) Western blot showing the changes in LC3B expression in the cortex at 12 months after the last D-gal injection, n = 3. (E) Quantification of the western blot in D. (F) Western blot showing the changes in LC3B expression in the hippocampus at 0 months after the last D-gal injection, n = 3. (G) Quantification of the western blot in F. (H) Western blot showing the changes in LC3B expression in the hippocampus at 12 months after the last D-gal injection, n = 3. (I) Quantification of the western blot in H. (J) Western blot showing the changes in LC3B expression in the cochlea at 0 month after the last D-gal injection, n = 3. (K) Quantification of the western blot in J. (L) Western blot showing the changes in LC3B expression in the cochlea at 12 months after the last D-gal injection, n = 3. (M) Quantification of the western blot in L. (N) Western blot showing the changes in LC3B expression in the cochlea at 24 months after the last D-gal injection, n = 3. (O) Quantification of the western blot in N. (P) Western blot showing the changes in LC3B and SQSTM1/p62 expression in the cochlea at 0 months, 12 months, and 24 months after the last D-gal injection, n = 5. (Q) Quantification of the LC3B expression level in P. (R) Quantification of the SQSTM1/p62 expression level in P. For all experiments, *p < 0.05, **p < 0.01, ***p < 0.001. NS = not significant
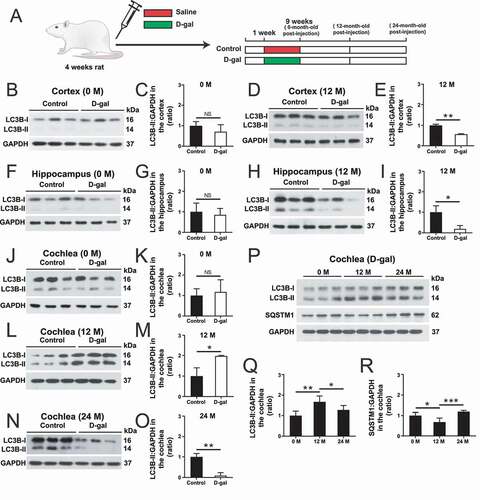
We also measured the expression of the autophagosome marker MAP1LC3/LC3 (LC3B) in OC-1 cells after treatment with different concentrations of D-gal for 72 h (0.2 mg/mL, 0.5 mg/mL, 1 mg/mL, 2 mg/mL, 5 mg/mL, 10 mg/mL, 15 mg/mL, 20 mg/mL, 30 mg/mL, and 40 mg/mL). Western blots showed that the expression of LC3B was increased with 0.2–5 mg/mL D-gal treatment, suggesting that low dose of D-gal might trigger cytoprotective effects and activate autophagic signaling () and (B), p < 0.05, n = 5). When the D-gal concentration was higher than 10 mg/mL, the autophagy level decreased again, which was consistent with the increased number of apoptotic cells after high-dose D-gal treatment in the previous experiments. The transmission electron microscope imaging showed that the D-gal–treated cells had significantly more autophagic vacuoles (double membrane-bound autophagosomes) and autolysosomes (containing lysosomal membrane proteins and enzymes) compared with the controls ()–(E), p < 0.01, n = 5). We next transfected OC-1 cells with the mRFP-GFP-LC3 plasmid, which is a reporter of autophagic flux [Citation56] and can be used to quantify the numbers of autophagosomes and autolysosomes. The yellow spots represent the overlap of red and green spots, indicating the autophagosomes that have not fused with the lysosomes, while the red spots correspond to autolysosomes [Citation56,Citation57]. The numbers of autophagic vacuoles and autolysosomes were significantly increased in OC-1 cells after D-gal treatment compared to controls, indicating that D-gal treatment might trigger cytoprotective effects and activate autophagy in OC-1 cells ()-(H), p < 0.001, n = 5). In addition, the number of autophagic vacuoles and autolysosomes was decreased in 15 mg/mL D-gal–treated cells compared to 2 mg/mL D-gal–treated cells.
Figure 3. FOXG1 affects autophagosome formation in OC-1 cells after treatment with D-gal. (A) Western blot showing the changes in LC3B expression in OC-1 cells treated with different concentrations of D-gal for 72 h, n = 5. (B) Quantification of the western blot in A. (C) Transmission electron microscope analysis for evaluating autophagy in OC-1 cells. (D) Quantification of the autophagic vacuoles in C. (E) Quantification of the autolysosomes in C. (F) Cells were transfected with mRFP-GFP-LC3 plasmids and treated with different concentrations of D-gal. Yellow dots indicate autophagosomes and red dots indicate autolysosomes, n = 5. (G) Quantification of autophagosomes in F. (H) Quantification of autolysosomes in F. (I) Western blot showing the changes in LC3B expression in the OC-1 cells after inhibition or activation of autophagy and downregulation of Foxg1 expression following 15 mg/mL D-gal treatment, n = 5. (J) Quantification of the western blot in I. (K) Western blot showing the changes in LC3B expression in the OC-1 cells after inhibition or activation of autophagy and downregulation of Foxg1 expression following 2 mg/mL D-gal treatment, n = 5. (L) Quantification of the western blot in K. For all experiments, *p< 0.05, **p< 0.01, ***p< 0.001. NS = not significant
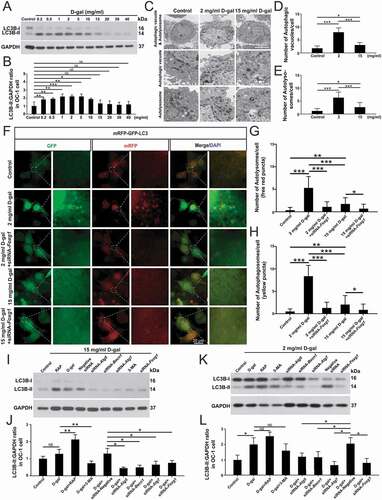
To further explore the relationship between FOXG1 and autophagy in aging OC-1 cells, we determined the expression of LC3 after downregulation of FOXG1 via siRNA transfection. We found that after inhibition of FOXG1, the numbers of both autophagosomes and autolysosomes were decreased in both the 2 mg/mL group and the 15 mg/mL group, indicating that FOXG1 plays an important role in regulating the autophagy process and might be required for the activation of autophagy in aging OC-1 cells ()–(H), p< 0.001, n = 5). The western blot data showed that the expression of LC3B was increased after treatment with the autophagy activator (rapamycin) compared with the D-gal–only group ()-(L), p< 0.05, n = 5). In contrast, when the cells were treated with siRNA-Foxg1 or autophagy inhibitor (3-MA), the expression of LC3B was significantly reduced. These results indicated that FOXG1 may be involved in regulating the level of autophagy in the process of cell aging induced by D-gal.
FOXG1 regulates apoptosis and oxidative stress in aging OC-1 cells via autophagy
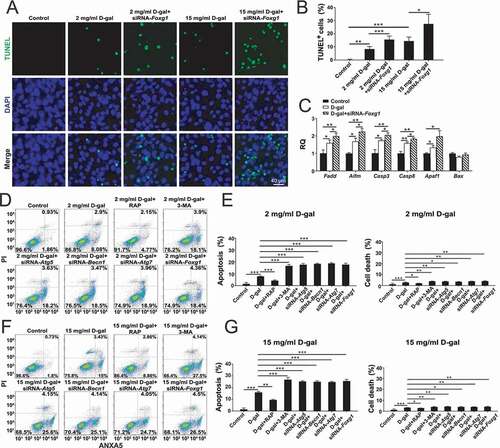
Previous research reported that FOXG1 can regulate the processes of ATP synthesis and metabolism in the mitochondria [Citation23] and that FOXG1 promotes HC survival in the postnatal cochlea through the regulation of multiple signaling pathways [Citation24]. Therefore, we hypothesized that FOXG1 might regulate apoptosis in D-gal–induced aging OC-1 cells. We downregulated FOXG1 expression in OC-1 cells to determine the role of FOXG1 in D-gal–induced apoptosis and cell death. Immunofluorescence staining with TUNEL showed that the number of TUNEL-positive cells in the FOXG1 downregulation groups were significantly greater than the D-gal–only group () and (B), p < 0.05, n = 5). The flow cytometry results showed that after downregulation of FOXG1 the proportions of both dead and apoptotic cells were significantly increased in both the 2 mg/mL D-gal group and the 15 mg/mL D-gal group compared to the D-gal groups with wild-type levels of FOXG1 ()-(G), p < 0.05, n = 5). These results indicated that FOXG1 plays an important role in delaying cell aging and that the lack of FOXG1 accelerates cell apoptosis and cell death. Moreover, the qPCR results showed that the expression of pro-apoptotic marker genes, including Fadd, Aifm, Casp8, Casp3, and Apaf1, was significantly higher in the D-gal–treated groups (), P < 0.05, n = 5). The expression of pro-apoptotic marker genes (Fadd, Aifm, Casp8, and Casp3) was significantly increased when the expression of Foxg1 was reduced compared to the D-gal–only group (), P < 0.05, n = 5). We also investigated whether FOXG1 affects the levels of apoptosis in D-gal–induced mimetic aging OC-1 cells through regulating autophagy pathways. The flow cytometry results showed that without the siRNA-Foxg1 treatment, the proportions of both dead and apoptotic cells were significantly reduced in the autophagy activation groups compared to the D-gal–only controls ()-(G), p < 0.05, n = 5), while the proportions of apoptotic and dead cells in the autophagy-inhibition groups were significantly increased compared to the D-gal–only controls ()-(G), p < 0.05, n = 5). With the siRNA-Foxg1 treatment, the proportions of both dead and apoptotic in aging OC-1 cells were similar to the autophagy inhibition groups ()-(G)).
Figure 4. The expression of FOXG1 affects apoptosis in OC1 cells after D-gal treatment. (A) TUNEL and DAPI double staining showing the apoptotic OC-1 cells after different treatments, n = 5. (B) Quantification of the numbers of TUNEL/DAPI double-positive cells in A. (C) qPCR analysis of apoptosis-related gene expression in OC-1 cells, n = 5. (D) Apoptosis analysis by flow cytometry after different treatments, n = 5. (E) The proportions of early apoptotic and dead cells in D. (F) Apoptosis analysis by flow cytometry after different treatments, n = 5. (G) The proportions of early apoptotic and dead cells in F. For the qPCR experiments, the values for the untreated controls were set to 1. For all experiments, *p < 0.05, **p < 0.01, ***p < 0.001
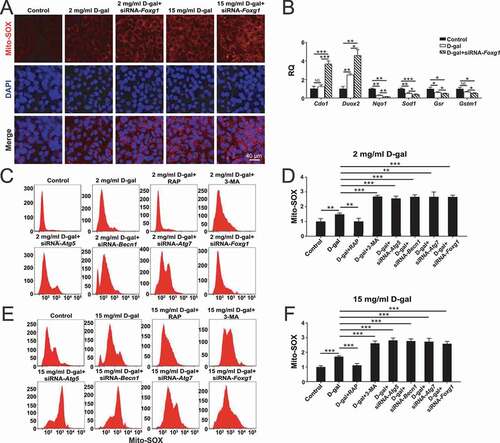
Because FOXG1 is related to the maintenance of normal mitochondrial function, we hypothesized that FOXG1 might reduce oxidative stress in D-gal–induced aging OC-1 cells through the activation of autophagy. We used Mito-SOX Red to evaluate the mitochondrial ROS levels in D-gal–treated cells after downregulation of FOXG1 expression. Immunohistochemistry and flow cytometry results showed that after downregulation of FOXG1, the ROS levels were significantly increased in both the 2 mg/mL D-gal group and 15 mg/mL D-gal group compared to the D-gal groups with wild-type levels of FOXG1 (), (F), p < 0.05, n = 5). qPCR was performed to analyze the mRNA expression of redox-related genes, and we found that the expression of three antioxidant genes (Sod, Nqo1, and Gsr) was significantly decreased and one pro-oxidant gene (Duox2) was significantly increased in OC-1 cells after D-gal treatment compared to control cells and that downregulation of Foxg1 expression significantly decreased the expression of these antioxidant genes and upregulated the expression of pro-oxidant genes compared to the D-gal–only group (), P < 0.05, n = 5). Furthermore, we found that without the siRNA-Foxg1 pretreatment the ROS levels were significantly reduced in aging OC-1 cells when autophagy was activated by rapamycin compared to the D-gal–only controls ()-(F), p < 0.01, n = 5), and ROS levels were significantly increased when the autophagy pathway was inhibited by 3-MA, siRNA-Atg5, siRNA-Becn1, or siRNA-Atg7 ()-(F)). With the siRNA-Foxg1 pretreatment, the ROS levels in aging OC-1 cells were similar to the autophagy inhibition groups ()-(F), p < 0.01, n = 5). Together, these results showed that the increase in ROS and apoptosis levels caused by down-regulation of Foxg1 in aging OC-1 cells might be related to the inhibition of autophagy pathway.
Figure 5. The expression of FOXG1 affects oxidative stress in OC1 cells after D-gal treatment. (A) Immunofluorescence staining with Mito-SOX Red in OC-1 cells. (B) qPCR analysis of redox reaction-related gene expression in OC1 cells, n = 5. (C) Analysis of ROS levels by flow cytometry after different treatments, n = 5. (D) Quantification of the data in C. (E) Analysis of ROS levels by flow cytometry after different treatments, n = 5. (F) Quantification of the data in E. For the qPCR experiments, the values for the untreated controls were set to 1. for all experiments, *p < 0.05, **p < 0.01, ***p < 0.001
Aspirin treatment activates FOXG1 expression and autophagy pathways and promotes cochlear HC survival in D-gal–induced mimetic aging mice both in vivo and in explant culture in vitro
Previous reports showed that aspirin promotes tumor cells survival by activating the autophagy pathway in breast cancer, hepatocarcinoma, and sarcoma [Citation58–60]. Therefore, we hoped to confirm whether the protective effect of aspirin in the inner ear is related to the regulation of the autophagy pathway by FOXG1. We dissected the cochleae from GFP-LC3 mice after different treatments (Control group: mice were injected with normal saline; D-gal group: P42 mice were injected with 150 mg/kg D-gal daily for 42 days; aspirin group: P70 mice were injected with 100 mg/kg aspirin daily for 14 days; D-gal + aspirin co-treatment group: P42 mice were injected with 150 mg/kg D-gal daily for 28 days and then co-injected with 150 mg/kg D-gal and 100 mg/kg aspirin for 14 days) and measured the HC number and autophagy level at P90 ()). The western blot data showed that the expression of FOXG1 was significantly reduced after D-gal treatment compared with the control group, while aspirin treatment significantly increased the expression of FOXG1 compared to both the D-gal–only group and the control group () and (C), p < 0.05, n = 5). In addition, we also determined the effect of aspirin on the autophagy in cochlear HCs. Immunofluorescence staining showed that LC3B expression was significantly activated in cochlear HCs after aspirin treatment ()). The western blot data showed that autophagy was reduced after D-gal treatment compared with the control group. After aspirin treatment the autophagy level was significantly increased compared to the D-gal–only group () and (F), p < 0.05, n = 5). The Myosin7a and phalloidin staining showed that the HC loss was increased after D-gal treatment, and aspirin treatment could prevent the D-gal-induced HC loss () and (G)). The immunofluorescence staining with phalloidin showed that the surviving HCs also had normal stereocilia bundles and that cochlear HC cilia polarity was not affected by either D-gal or aspirin treatment ()). In addition, we measured the expression of pro-apoptotic marker genes (Aif, Casp8, Bax, and Casp3) and an anti-apoptotic marker gene (Bcl2) in the cochleae of the different groups. The qPCR results showed that the expression of pro-apoptotic marker genes was significantly increased in the D-gal–treated groups, and the expression of the anti-apoptotic marker gene was significantly decreased, while aspirin treatment could prevent the D-gal–induced increase in the expression of pro-apoptotic marker genes (except for Casp8) (), P < 0.05, n = 5).
Figure 6. Increased FOXG1 expression and autophagy in cochlear HCs and in vitro-cultured cochleae after aspirin treatment. (A) The mice were injected with D-gal and aspirin. (B) Western blot showing the changes in FOXG1 expression in the HCs after different treatments, n = 5. (C) Quantification of FOXG1 expression in B. (D) Immunofluorescence staining with anti-MYO7A and phalloidin in the cochleae from GFP-LC3 mice. n = 11. (E) Western blot showing the changes in LC3B expression in the HCs after different treatments, n = 5. (F) Quantification of LC3B expression in E. (G) Quantification of the lost HCs in D. (H) qPCR analysis of the apoptosis-related gene expression after D-gal and aspirin treatment, n = 5. (I) The in vitro-cultured cochleae were treated with D-gal and aspirin. (J) Immunofluorescence staining with MYO7A antibody in the cochleae from GFP-LC3 mice, n = 5. (K) Quantification of the MYO7A-positive HCs in J. (L) Quantification of the GFP-LC3 spot number in J. For qPCR experiments, the values for the normal controls were set to 1. for all experiments, *p < 0.05, **p < 0.01, ***p < 0.001. NS = not significant
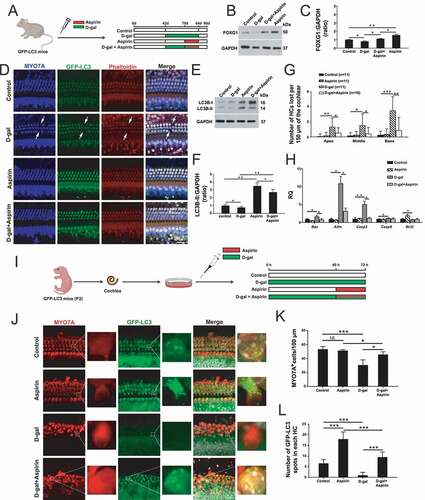
In order to confirm the protective effect of aspirin on HCs after D-gal treatment, we dissected the cochleae from P3 GFP-LC3 mice and cultured them with different drugs (Control group: cochleae were cultured in medium only for 72 h; D-gal group: cochleae were cultured with 10 mg/mL D-gal for 72 h; aspirin group: cochleae were cultured with medium for 60 h and then cultured with 0.2 mmol/L aspirin for 12 h; D-gal + aspirin co-treatment group: cochleae were cultured with 10 mg/mL D-gal for 60 h and then cultured with 0.2 mmol/L aspirin and 10 mg/mL D-gal for 12 h) ()). Immunofluorescence staining indicated that MYO7A-positive HC loss was increased in the cochlea after treatment with D-gal and that treatment with aspirin significantly attenuated the D-gal–induced HC loss () and (K), p < 0.05, n = 5). Immunofluorescence staining also showed that the numbers of LC3 spots in each HC were significantly increased after aspirin treatment compared to the controls () and (L)). The results also showed that treatment with D-gal resulted in a reduction in the number of LC3 spots in HCs, while treatment with aspirin markedly increased the number of LC3 spots in HCs compared to the D-gal–only group () and (L), p < 0.001, n = 5).
Aspirin treatment activates FOXG1 expression and autophagy pathways in D-gal–induced mimetic aging OC-1 cells
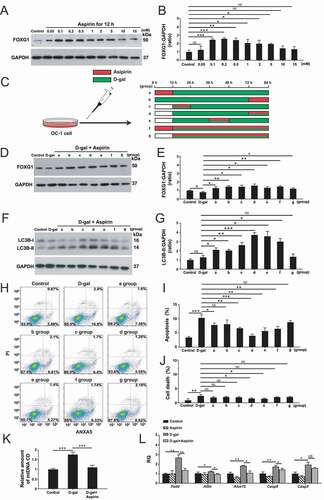
In order to determine whether aspirin treatment regulates the expression of FOXG1 in OC-1 cells, we exposed the cells to different aspirin concentrations (0.05 mM, 0.1 mM, 0.2 mM, 0.5 mM, 1 mM, 2 mM, 5 mM, 10 mM, and 15 mM) for 12 h and then measured the FOXG1 protein levels. The expression of FOXG1 was significantly increased when the cells were treated with 0.1–5 mM aspirin for 12 h, and the level of FOXG1 was decreased when the aspirin concentration was greater than 10 mM () and (B), p < 0.05, n = 5). In addition, we measured the changes of FOXG1 expression levels in D-gal–induced mimetic aging cells with or without aspirin treatment using the seven treatment groups: a) aspirin for 12 h and then D-gal for 72 h, b) D-gal for 72 h and then aspirin for 12 h, c) aspirin and D-gal together for 12 h and then D-gal for 60 h, d) D-gal for 60 h and then D-gal and aspirin together for 12 h, e) D-gal for 24 h and then D-gal and aspirin together for 12 h, and then D-gal again for 36 h, f) aspirin for 12 h and then aspirin and D-gal together for 72 h, and g) aspirin and D-gal together for 72 h ()). We found that the expression of FOXG1 was significantly decreased in D-gal–induced mimetic aging OC-1 cells compared to controls, while aspirin treatment resulted in significantly increased expression of FOXG1 in D-gal–induced mimetic aging cells, especially in groups c, d, e, and f () and (E), p < 0.05, n = 5).
Figure 7. Aspirin treatment promotes the survival of D-gal–induced mimetic aging OC-1 cells through activating FOXG1 expression and autophagy pathway. (A) Western blot showing the changes in FOXG1 expression in the OC-1 cells after treatment with different concentrations of aspirin, n = 5. (B) Quantification of the western blot in A. (C) Seven different aspirin treatment groups in mimetic aging cells induced by D-gal – a) aspirin for 12 h and then D-gal for 72 h, b) D-gal for 72 h and then aspirin for 12 h, c) aspirin and D-gal together for 12 h and then D-gal for 60 h, d) D-gal for 60 h and then D-gal and aspirin together for 12 h, e) D-gal for 24 h and then D-gal and aspirin together for 12 h, and then D-gal again for 36 h, f) aspirin for 12 h and then aspirin and D-gal together for 72 h, and g) aspirin and D-gal together for 72 h. (D) Western blot showing the changes in FOXG1 expression in the OC-1 cells after different treatments, n = 5. (E) Quantification of FOXG1 expression in D. (F) Western blot showing the changes in LC3B expression in the OC-1 cells after different treatments, n = 5. (G) Quantification of LC3B expression in F. (H) Apoptosis analysis by flow cytometry after different treatments, n = 5. (I) The proportions of early apoptotic cells in H. (J) The proportions of dead cells in H. (K) Measurement of the mitochondrial DNA (mtDNA) common deletion (CD) after D-gal and aspirin treatment, n = 5. (L) qPCR analysis of the apoptosis-related gene expression after D-gal and aspirin treatment, n = 5. for qPCR experiments, the values for the normal controls were set to 1. for all experiments, *p < 0.05, **p < 0.01, ***p < 0.001. NS = not significant
Then we detected the effect of aspirin on the level of autophagy in OC-1 cells. After treating the OC-1 cells with different aspirin concentrations (0.05 mM, 0.1 mM, 0.2 mM, 0.5 mM, 1 mM, 2 mM, 5 mM, 10 mM, and 15 mM) for different treatment times (12 h, 48 h, and 72 h), the western blot results showed that the level of autophagy significantly increased when treated with 0.05–1 mM aspirin, suggesting that aspirin activates the autophagic signaling pathway at this dosage (Figure S3A-F, p < 0.05, n = 5).
In addition, the autophagy levels were decreased when the aspirin concentration was higher than 5 mM. To validate that the autophagy flux is affected by aspirin treatment, we measured the levels of three autophagy markers (ATG5, BECN1, and ATG7) in OC-1 cells after 0.2 mM aspirin treatment for 12 h. The western blot and qPCR results showed that these autophagy markers were all significantly increased in OC-1 cells after aspirin treatment (Figure S4A-G, p < 0.05, n = 5). We then monitored autophagosome synthesis in OC-1 cells treated with bafilomycin A1 (baf), which is a V-ATPase inhibitor that inhibits autophagosome degradation by blocking the fusion of autophagosomes with lysosomes [Citation61,Citation62]. The western blot results showed that the LC3B protein expression level was increased in OC-1 cells co-treated with aspirin and baf compared with control cells treated with baf alone (Figure S4H and J, p < 0.05, n = 5), indicating that aspirin could still enhance autophagosome synthesis even when autophagosome–lysosome fusion was inhibited by baf. To confirm our finding, we measured the degradation of the autophagic substrate SQSTM1/p62 protein. We found that the protein level of SQSTM1/p62 was significantly decreased in the OC-1 cells after aspirin treatment compared to control cells (Figure S4H and I, p < 0.05, n = 5). We further examined the SQSTM1/p62 level when autophagosome–lysosome fusion was blocked by baf. We found the SQSTM1/p62 level was significantly decreased in OC-1 cells co-treated with aspirin and baf compared with control cells treated with baf alone (Figure S4H and I, p < 0.05, n = 5). We then measured the LC3B levels in OC-1 cells when pretreated with an autophagy activator (rapamycin) or inhibitor (3-MA, siRNA-Atg5, siRNA-Becn1, and siRNA-Atg7) and then treated with 0.2 mM aspirin for 12 h. We found that the levels of LC3B were significantly decreased in OC-1 cells when pretreated with the autophagy inhibitors compared with the aspirin-only group, but the autophagy level in OC-1 cells co-treated with rapamycin and aspirin was not significantly increased compared to the aspirin-only group (Figure S4K and L, p < 0.05, n = 5). To double confirm that aspirin treatment can regulate the autophagy flux, we also transfected OC-1 cells with the mRFP-GFP-LC3 plasmid. The numbers of both autophagosomes and autolysosomes were significantly increased after aspirin treatment compared to controls (Figure S4M-O, p < 0.05, n = 5). Moreover, we found that the addition of autophagy inhibitors resulted in significant inhibition of autophagy, while the numbers of autophagosomes and autolysosomes were not significantly increased in the rapamycin pre-treated group compared to the aspirin-only group, indicating that autophagic flux is activated by aspirin treatment in OC-1 cells.
We found that the inhibition of FOXG1 expression directly leads to the reduction of autophagy levels in OC-1 cells, indicating that FOXG1 is an upstream regulator of autophagy signal (Figure S5A-C, p < 0.05, n = 3). In order to determine whether aspirin affects autophagy levels by activating FOXG1 expression, we monitored the autophagy levels in OC-1 cells when pretreated with siRNA-Foxg1 and then treated with 0.2 mM aspirin for 12 h. The western blot results showed that the levels of LC3B were significantly decreased in OC-1 cells when pretreated with siRNA-Foxg1 compared with the aspirin-only group, while the SQSTM1/p62 level was significantly increased in OC-1 cells co-treated with siRNA-Foxg1 and aspirin (Figure S5D-G, p < 0.05, n = 5). We also detected the autophagic flux in OC-1 cells after transfection with the mRFP-GFP-LC3 plasmid. We found that the numbers of both autophagosomes and autolysosomes were significantly decreased in OC-1 cells co-treated with siRNA-Foxg1 and aspirin compared with the aspirin-only group (Figure S5H-J, p < 0.001, n = 5). In addition, we measured the changes in autophagy levels in D-gal–induced mimetic aging cells with or without aspirin treatment using the seven treatment groups described above ()). We found that 0.2 mM aspirin treatment significantly increased autophagy activity in D-gal–induced mimetic aging cells, especially in groups c, d, e, and f () and (G), p < 0.05, n = 5).
Aspirin treatment promotes the survival of D-gal–induced mimetic aging OC-1 cells by activating FOXG1 expression and the autophagy pathway
Because the mtDNA CD mutation has been shown to play an important role in age-related hearing loss [Citation6,Citation16], we measured the amount of mtDNA CD in the mimetic aging cells using the probe method and found that the D-gal–induced aging process significantly increased the amount of mtDNA CD, while aspirin treatment maintained the amount of mtDNA at a similar level as controls (), P < 0.001, n = 5).
To further explore whether aspirin treatment can effectively reduce the OC-1 cells’ aging process, we used 0.2 mM aspirin to treat the cells at different stages of 15 mg/mL D-gal–induced aging and measured the rates of apoptosis and cell death. First, we measured the cells undergoing apoptosis after aspirin treatment only. After treatment with different aspirin concentrations (0.05 mM, 0.1 mM, 0.2 mM, 0.5 mM, 1 mM, 2 mM, 5 mM, 10 mM, and 15 mM) for 12 h, the proportions of both dead and apoptotic cells did not significantly change compared to the controls when the aspirin concentration was lower than 10 mM, and the proportions of dead and apoptotic cells were significantly increased when the aspirin concentration was higher than 15 mM (Figure S6A-C, p < 0.05, n = 5). The immunofluorescence staining with TUNEL showed that the proportions of TUNEL-positive apoptotic cells in the group treated with 15 mM aspirin for 12 h was significantly greater than the controls (Figure S6D-E, p < 0.05, n = 5). The CCK8 results showed that the cell density did not change significantly after treatment with any concentration of aspirin for 12 h (Figure S6F, n = 5). These results indicated that treatment with low concentrations of aspirin for short times does not increase apoptosis or cell death in OC-1 cells. We next detected the changes in the level of apoptosis in seven different aspirin treatment groups in mimetic aging cells induced by D-gal ()). The flow cytometry results showed that the proportions of both dead and apoptotic cells were significantly increased in the D-gal–only group compared to the control group and that aspirin could significantly promote cell survival and reduce the proportions of both dead and apoptotic cells induced by D-gal. The pro-survival effects of aspirin were the most obvious in group d and group e ()-(J), p < 0.05, n = 5). Moreover, the qPCR results showed that the expression of pro-apoptotic marker genes, including Fadd, Alox15, Casp8, Aifm, and Casp3, was significantly higher in the D-gal–treated groups (), P < 0.05, n = 5). The expression of pro-apoptotic marker genes (Fadd, Aifm, Alox15, Casp8, and Casp3) was significantly decreased when the cells were co-treated with aspirin (), P < 0.05, n = 5).
In order to determine if aspirin treatment inhibited apoptosis in D-gal–induced mimetic aging OC-1 cells by activating FOXG1 expression and the autophagy pathway, we pre-treated the cells with an autophagy activator, an autophagy inhibitor, or siRNA-Foxg1. OC-1 cells were pretreated with an autophagy activator or autophagy inhibitor or siRNA-Foxg1 for 6 h, D-gal for 60 h, and then co-treated with D-gal and aspirin for 12 h. In the autophagy inhibition groups, the proportions of both dead and apoptotic cells were significantly increased compared to the D-gal + aspirin group ()-(C), p < 0.05, n = 5). In contrast, the proportion of apoptotic and dead cells in the autophagy activator rapamycin + D-gal + aspirin group and the D-gal + aspirin group were significantly reduced compared to the D-gal–only group, while the proportion of dead cells in the rapamycin + D-gal + aspirin group was lower than in the D-gal + aspirin group. Next, we performed TUNEL staining to detect the apoptotic OC-1 cells after autophagy activator and autophagy inhibitor treatment. Immunofluorescence staining showed that the proportions of TUNEL-positive cells in the D-gal and aspirin co-treated groups were significantly reduced compared to the D-gal–only group ()-(E), p < 0.001, n = 5). The autophagy inhibitor groups had significantly more TUNEL-positive cells compared to the D-gal and aspirin co-treatment group. In contrast, when autophagy was activated by rapamycin, the proportions of TUNEL-positive cells were significantly reduced, and the number of TUNEL-positive cells showed no significant difference between the rapamycin + D-gal + aspirin group and the D-gal + aspirin group.
Figure 8. The effect of FOXG1 and autophagy in the protection of aspirin in D-gal–induced mimetic aging OC-1 cells. (A) Apoptosis analysis by flow cytometry after different treatments, n = 5. (B) The proportions of early apoptotic cells in A. (C) The proportions of dead cells in A. (D) TUNEL and DAPI double staining showing the apoptotic OC1 cells after different treatments, n = 5. (E) Quantification of the numbers of TUNEL/DAPI double-positive cells in D. For all experiments, *p < 0.05, **p < 0.01, ***p < 0.001
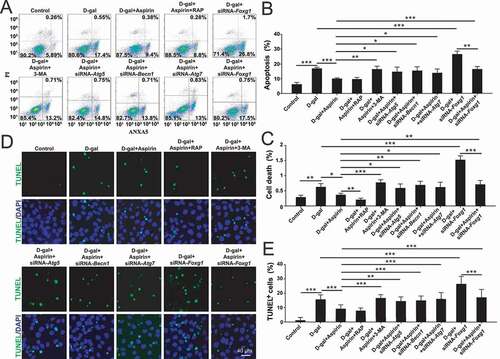
Both flow cytometry and TUNEL staining results showed that with the siRNA-Foxg1 treatment, the proportions of both dead and apoptotic in aging OC-1 cells were similar to the autophagy inhibition groups ()-(E)), suggesting that the protective effect of aspirin is achieved by activating FOXG1 expression and the autophagy pathway.
Aspirin treatment attenuates oxidative stress in D-gal–induced mimetic aging mouse cochlear HCs and OC-1 cells through activation of FOXG1 expression and autophagy
The preceding experiments showed that aspirin treatment activated FOXG1 expression and autophagy and promoted HC survival, and here we hypothesized that aspirin protects cochlear HCs through autophagy-mediated inhibition of ROS levels in vivo. To test our hypothesis, WT mice were injected with 150 mg/kg D-gal and/or 100 mg/kg aspirin consistent with the four groups in ) ()). At P90, we dissected the cochleae and evaluated the catalase level, which is an important enzyme that protects HCs against oxidative damage [Citation63]. The immunofluorescence staining showed that catalase expression was significantly reduced in D-gal–induced mimetic aging mouse cochlear HCs compared with controls and that aspirin treatment significantly increased catalase expression in HCs compared to the D-gal–only group ()). The western blot data also showed that the expression of catalase was decreased after D-gal treatment compared with controls and that aspirin treatment significantly increased the expression of catalase compared to the D-gal–only group ()-(D), p < 0.05, n = 5). According to our previous research, it was found that aspirin can activate the expression of FOXG1, so in order to explore whether the expression of catalase in OC-1 cells treated by aspirin is regulated by FOXG1, we detected the catalase expression levels in OC-1 cells when pretreated with siRNA-Foxg1 and then treated with 0.2 mM aspirin for 12 h. Both the western blot and qPCR results showed that the levels of catalase were significantly decreased in OC-1 cells when pretreated with siRNA-Foxg1 compared with the aspirin-only group ()-(H)), suggesting that FOXG1 is involved in regulating the expression level of catalase in OC-1 cells.
Figure 9. Aspirin attenuates oxidative stress in cochlea HCs and OC-1 cells after D-gal treatment through activating FOXG1 expression and autophagy pathway. (A) The mice were injected with D-gal and aspirin. (B) Immunofluorescence staining with anti-catalase and anti-MYO7A antibodies in the middle turn of the cochlea after different treatments, n = 5. (C) Western blot analysis with anti-CAT (catalase) antibody after D-gal and aspirin treatment, n = 5. (D) Quantification of the western blot in C. (E) Western blot analysis with anti-catalase antibody and anti-FOXG1 after siRNA-Foxg1 and aspirin treatment, n = 5. (F) Quantification of FOXG1 expression levels in E. (F) Quantification of catalase expression levels in E. (H) qPCR analysis of the catalase gene expression after siRNA-Foxg1 and aspirin treatment, n = 5. (I) OC-1 cells were treated with D-gal and aspirin. (J) Immunofluorescence staining with mito-SOX red in OC-1 cells, n = 5. (K) The results of ROS analysis by flow cytometry after different treatments. (L) Quantification of the data in K. (M) qPCR analysis of redox reaction-related gene expression, n = 5. For qPCR experiments, the values for the normal controls were set to 1. for all experiments, *p < 0.05, **p < 0.01. NS = not significant
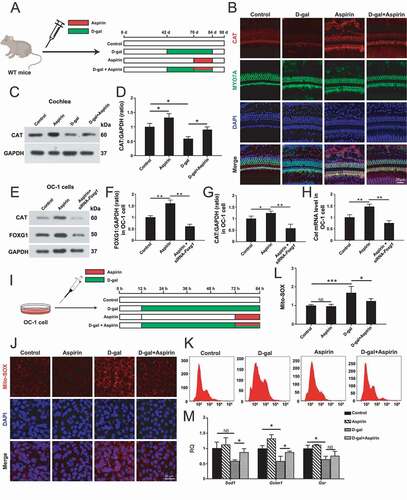
We also used Mito-SOX Red to evaluate mitochondrial ROS levels in OC-1 cells after different treatments ()). Immunohistochemistry and flow cytometry showed that the ROS levels were increased after D-gal treatment compared to the undamaged controls and that treatment with aspirin markedly reduced the ROS levels in the mimetic aging cells ()-(L), p < 0.05, n = 5). qPCR was performed to analyze the mRNA expression of redox-related genes, and we found that the expression of three antioxidant genes – Sod, Gstm1, and Gsr – was significantly decreased in OC-1 cells after D-gal treatment compared to control cells and that treatment with aspirin significantly upregulated the expression of these antioxidant genes compared to the D-gal–only group (, P < 0.05, n = 5). To confirm that aspirin prevents apoptosis by reducing ROS accumulation, we also used glucose oxidase (GO), which is a steady H2O2 generator, to induce oxidative stress in OC-1 cells. We found that both D-gal and GO resulted in increased ROS levels in OC-1 cells and that aspirin could significantly reduce the increased ROS levels in both D-gal and GO-treated OC-1 cells (Figure S7A and B, p < 0.05, n = 5).
FOXG1 regulates mitochondrial function in aging OC-1 cell via mitophagy
Because mitochondria play an important role in energy metabolism, it is generally believed that mitochondrial dysfunction is an inducing factor of aging [Citation64,Citation65]. Mitophagy, which is a special form of autophagy, can maintain the health of mitochondrial populations through the turnover of damaged and dysfunctional mitochondria [Citation66,Citation67]. Because FOXG1 plays an important role in regulating the expression of mitochondria-related proteins and energy synthesis and metabolism [Citation23], we speculated that the increase in ROS caused by the inhibition of FOXG1 expression may be related to abnormal mitochondrial autophagy. We used a mitophagy detection kit to detect the effect of FOXG1 on mitophagy in D-gal-induced aging OC-1 cells [Citation68]. Mitophagy and lysosomes can be stained with Mtphagy dye (red) and Lyso dye (green), respectively, to show the progression of mitophagy [Citation69,Citation70]. We found that the numbers of mitophagic puncta were significantly increased in OC-1 cells after 2 mg/mL D-gal treatment compared to controls, indicating that 2 mg/mL D-gal treatment might activate mitophagy in OC-1 cells () and (B), p < 0.01, n = 5). However, after 15 mg/mL D-gal treatment, the number of mitophagic puncta in OC-1 cells did not change significantly. In addition, we found that after inhibition of FOXG1 the numbers of mitophagic puncta were decreased after 2 mg/mL D-gal treatment, indicating that OC-1 cells can activate mitophagy via FOXG1 to initiate their self-protection mechanism when treated with low concentrations of D-gal. However, when high concentrations of D-gal were used to induce cell aging, this protective mechanism was inhibited.
Figure 10. The effect of FOXG1 on mitophagy and mitochondrial function in D-gal–induced mimetic aging OC-1 cells. (A) Cells were stained with the mitophagy detection kit and treated with siRNA-Foxg1 and different concentrations of D-gal. mitophagy and lysosomes were stained with mtphagy dye (red) and Lyso dye (green), respectively, n = 5. (B) Quantification of mitophagy in A. (C) Western blot analysis with anti- PPARGC1A antibody after different treatments, n = 5. (D) Quantification of PPARGC1A expression levels in C. (E) qPCR analysis of mtDNA copy number representative gene expression, n = 5. (F) The results of mitochondrial membrane potential analysis by flow cytometry after different treatments. (G) Quantification of the data in F. For qPCR experiments, the values for the normal controls were set to 1. for all experiments, *p < 0.05, **p < 0.01, ***p < 0.001. NS = not significant
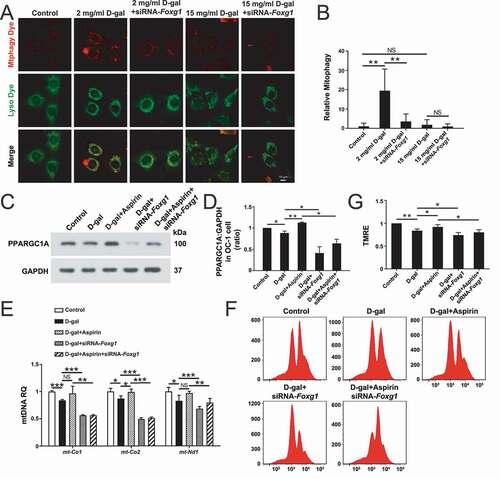
To further explore the relationship between FOXG1, aspirin, and mitochondria in aging OC-1 cells, we determined several markers of mitochondrial function after downregulation of FOXG1 and aspirin treatment. We treated OC-1 cells with aspirin and siRNA-Foxg1 and then evaluated the PPARGC1A level, which is an important regulator for the maintenance of mitochondrial function and many metabolic processes such as mitochondrial biogenesis and respiration [Citation71–73]. The western blot data showed that the expression of PPARGC1A was decreased after D-gal treatment compared with controls and that aspirin treatment significantly increased the expression of PPARGC1A compared to the D-gal–only group () and (D), p < 0.05, n = 3). After inhibition of FOXG1, the expression of PPARGC1A was decreased in the D-gal group and the D-gal + aspirin groups, indicating that FOXG1 plays an important role in regulating mitochondrial function in aging OC-1 cells () and (D), p < 0.05, n = 3). Because many ribosomes, proteins, and transfer RNAs in the mitochondria are encoded by mtDNA, abnormal mitochondrial DNA copy number will directly lead to cell dysfunction and apoptosis [Citation74,Citation75]. We detected changes in mitochondrial DNA copy number after FOXG1 downregulation and aspirin treatment in aging OC-1 cells by analyzing the expression of mt-Nd1, mt-Co1, and mt-Co2, which are the three mtDNA marker genes. The qPCR data showed that the expression of these three genes was significantly decreased in OC-1 cells after 15 mg/mL D-gal treatment compared to control cells and that downregulation of Foxg1 expression significantly decreased the expression of these genes compared to the D-gal–only group (), p < 0.05, n = 3). After aspirin treatment, the level of mt-Co2 was significantly increased compared to the D-gal–only group (), p < 0.05, n = 5). The expression levels of mt-Nd1 and mt-Co1 in the aspirin treatment group also increased, but the changes were not significant. We also found that the levels of these genes were significantly decreased in OC-1 cells when pretreated with siRNA-Foxg1 compared with the D-gal and aspirin co-treated groups (), p < 0.01, n = 5). In addition, we took advantage of the TMRE (tetramethylrhodamine ethyl ester) kit to explore changes in the mitochondrial membrane potential after FOXG1 downregulation and aspirin treatment in aging OC-1 cells [Citation76,Citation77]. The flow cytometry data showed that TMRE intensity was significantly decreased after 15 mg/mL D-gal treatment compared with the control group, and TMRE intensity was significantly decreased in the Foxg1-siRNA–transfected groups compared with the D-gal–only group () and (G), p < 0.05, n = 5). After aspirin treatment, the TMRE intensity was significantly increased compared to the D-gal–only group () and (G), p < 0.05, n = 5). However, when the expression of FOXG1 was inhibited, the protective effect of aspirin was no longer significant. Together, these findings suggested that aspirin may affect mitochondrial function by regulating FOXG1 expression.
Discussion
AHL is currently unable to be cured due to the complexity of its etiology. The oxidative damage caused by ROS in the pathogenesis of age-related hearing loss in mammals has been shown in several studies [Citation78]. Physiological concentrations of D-gal can be metabolized to glucose by phosphotransferase or galactose kinase, but at high concentrations galactitol is concentrated due to the inability of D-gal to be metabolized. This causes an increase in osmotic pressure and excessive ROS production [Citation79,Citation80], and thus D-gal is widely used in the preparation of various mimetic aging models [Citation79,Citation81].
FOXGl is an important member of the Fox family. FOXGl plays important roles in the growth, development, and maturation of many tissues and cells and is involved in aging processes through its interactions with multiple signaling pathways [Citation82–84], and in our previous study we found that FOXG1 plays important roles in the postnatal development and survival of mouse cochlear HCs [Citation24]. Because nuclear transcription factors are closely related to the regulation of metabolism and to the function of mitochondria, mutations in nuclear transcription factors often lead to mitochondrial dysfunction [Citation20]. Many studies have shown that oxidative stress-induced damage and related structural and functional mitochondrial abnormalities in cells are one of the important causes of AHL [Citation4]. ROS levels play an important role in the aging process, and in our previous study we found that the accumulation of mitochondrial ROS led to mtDNA damage, which resulted in 4834 bp deletion mutations in the mtDNA and subsequent auditory organ degeneration [Citation12]. We found no significant difference in that study in the auditory brainstem response threshold between D-gal–induced mimetic aging rats and control rats, and senile peripheral aging was not obvious; however, the various aging indicators of the auditory center showed significant changes [Citation12]. Thus, we speculated that there might be some factors or signaling pathways that regulate this different phenotype in the aging process between the auditory center and the auditory periphery. In this study, we examined FOXG1 expression levels in the central auditory system and peripheral auditory organs of the D-gal–induced auditory system mimetic aging rat model. We found that the expression of FOXG1 in the auditory cortex of the mimetic aging rats after 12 months was significantly decreased, which was in contrast to the increased expression of FOXG1 in the cochlea over the same time period. In addition, we found that the expression level of FOXG1 in the cochlea of the mimetic aging rats after 24 months began to show a significant decrease. We hypothesized, therefore, that the aging rate of the central auditory system and the peripheral auditory system might be different due to changes in the expression level of FOXG1. To test our hypothesis, we examined the expression level of FOXG1 in the D-gal–induced cell mimetic-aging model. We found that the expression level of FOXG1 initially increased at lower concentrations of D-gal and then decreased with increasing D-gal concentrations, indicating that low concentrations of D-gal might activate the expression of FOXG1 and related signaling pathways and their pro-survival effects, while such effects were decreased when the D-gal concentration was higher than 10 mg/ml, which corresponded with increasing numbers of apoptotic cells.
During the aging process, cell membrane lipoprotein degeneration and organelle damage caused by oxidative stress are important factors that cause disruption in normal cell function [Citation85]. Oxygen free radicals that accumulate during cellular senescence can activate self-protection, such as by activating the autophagy pathway, in order to inhibit the increase in ROS levels [Citation86]. We found that the level of autophagy in the central auditory system (the auditory cortex and hippocampus) of the mimetic aging rats after successful modeling for 12 months was significantly decreased, which was in contrast to the increased level of autophagy seen in the cochlea over the same time period. In addition, the levels of autophagy in the cochlea of the mimetic aging rats after successful modeling for 24 months were significantly decreased. We believe that the difference in autophagy levels in the central auditory system and the peripheral auditory organs results in different aging processes. In the D-gal–induced cell mimetic aging model, we found that the expression level of LC3B first increased and then decreased with increasing D-gal concentration, which was consistent with the changes seen in FOXG1 expression. These results showed that the autophagy pathway and FOXG1 are involved in the regulation of apoptosis and senescence, and we speculate that there might be some relationship between them. In addition, we found that inhibition of FOXG1 expression in cells led to a decrease in autophagy levels. mtDNA damage and mitochondrial dysfunction are directly related to aging, and mitophagy is the main way to clear damaged mitochondria [Citation66,Citation67,Citation75]. We also found that inhibition of FOXG1 expression in cells led to a decrease in mitophagy levels and an increase in mitochondrial dysfunction.
To further prove that FOXG1 promotes HC survival in D-gal–induced mimetic aging through its activation of autophagy, we explored the changes and effects of FOXG1 after treating mice and OC-1cells with aspirin, which is widely used in clinical applications and plays an important role in the prevention and treatment of neurodegenerative diseases [Citation43,Citation87]. In hearing-related research, it was found that low concentrations of aspirin can effectively reduce the ototoxic damage induced by gentamicin [Citation88,Citation89]. As levels of intracellular ROS increase during the aging process, cells activate a self-protective mechanism to clear ROS and maintain redox homeostasis. Autophagy is considered to be the most direct protective pathway for cells undergoing oxidative stress [Citation28]. In recent years, researchers have found that aspirin can induce autophagy by inhibiting MTOR signaling in cancer cells [Citation59,Citation60,90]. Therefore, we sought to explore whether FOXG1 participates in and affects the regulation of autophagy by aspirin. In this work, we found that low concentrations of aspirin activated the expression of Foxg1, which might promote the normal maintenance of mitochondrial metabolism and function, while inhibition of Foxg1 reduced the protection effects of aspirin on HCs. Therefore, we conclude that in aspirin-treated HCs and OC-1 cells the upregulation of Foxg1 contributes to the protective effects of aspirin. We also found that the expression of the autophagy-associated proteins Atg5, Becn1, and Atg7 was increased in OC-1 cells after aspirin treatment. These results suggest that aspirin protects the auditory system by activating autophagy pathways to remove damaged mitochondria and ROS in order to maintain mitochondrial functional stability. In the D-gal–induced mimetic aging model of OC-1 cells, the mtDNA CD, ROS, and apoptosis levels were significantly decreased after aspirin treatment, indicating that aspirin can delay the progression of HC senescence through activation of FOXG1 expression and autophagy. In addition, the mtDNA CD and apoptosis levels of cells were significantly decreased after aspirin treatment, but could not be completely restored to normal. This might be because the process of cell senescence is affected by a variety of factors or signaling pathways and aspirin only affects some of these factors or signaling pathways.
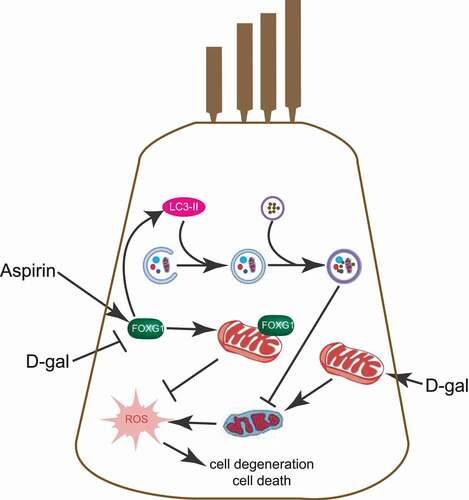
In summary, in the process of degeneration of the auditory system HCs can protect themselves from a certain level of damage by activating the expression of FOXG1 and activating autophagy. FOXG1 can regulate autophagy activity and can thus regulate ROS and apoptosis levels in HCs in mimetic aging models (). Our study thus suggests novel therapeutic targets and provides theoretical support for the application of genetic methods for the prevention and treatment of age-related hearing loss.
Figure 11. Schematic representation of FOXG1 implicated in the HC aging or survival process after aspirin and D-gal treatment. the figure is representative of some key steps involved in HC degeneration that are known to be regulated by mitochondria and autophagy. FOXG1 plays an important regulatory role in maintaining mitochondrial function and activating autophagy. D-gal induces the mtDNA CD mutation, leading to impaired mitochondrial function and increased ROS. D-gal can also accelerate HC aging by affecting the expression of FOXG1. this aging process can be inhibited by aspirin, and we found that aspirin eliminated the abnormal mitochondria caused by D-gal and inhibited the increase of ROS by activating FOXG1 expression and the autophagy pathway and ultimately inhibiting cell apoptosis and degeneration
Materials and methods
Animals and treatments
Three-week-old Sprague Dawley rats were obtained from the Experimental Animal Center of Tongji Medical College, Huazhong University of Science and Technology. Prior to treatment, the rats were allowed to acclimate for 1 week and were then randomly divided into a control group and a mimetic aging group. The rats in the mimetic aging group were treated with D-gal (500 mg/kg/day; Sigma-Aldrich, G0625) via subcutaneous injection for 8 weeks. The rats in the control group were injected with normal saline (500 mg/kg/day) on the same schedule. After the 8-week injection protocol, the rats in the two groups were further divided into the 0-month post injection, 12-month post injection, and 24-month post injection subgroups.
For the mouse model, four-week-old male LC3-GFP mice (Jackson Laboratory, 027139) and WT mice were acclimated for 2 weeks in the animal housing facility under a 12-h light/dark cycle at 23°C with 60% humidity, and food (COFCO, 200,010,337) and water were provided ad libitum. All experimental procedures were carried out in accordance with the policies of the Committee on Animal Research of Tongji Medical College, Huazhong University of Science and Technology, and all efforts were made to minimize the number of mice used and their suffering. Mice were divided into four groups: (i) control mice treated with saline, (ii) mice treated with D-gal (Sigma-Aldrich, G0625) (150 mg/kg) for 6 weeks, (iii) mice treated with D-gal (150 mg/kg) for 28 days and then co-treated with 150 mg/kg D-gal and aspirin (Sigma-Aldrich, A2093) (100 mg/kg) for 14 days, and (iv) mice treated with aspirin (100 mg/kg) alone for 2 weeks.
Cell culture
OC-1 cells were cultured in a 33°C incubator with 5% CO2 in MEM supplemented with 20 mM HEPES, pH 7.2–7.4, 2 mM l-glutamine, 10 mL/L nonessential amino acids, 0.4 µg/mL hydrocortisone (Corning, 354,203), 5 µg/mL INS (insulin; Gibco, 41,400,045) and 2.5 µg/mL TRF (transferrin; Gibco, 41,400,045), 10 ng/mL EGF (Corning, 354,001), 10% fetal bovine serum (Gibco, 10,099,141). Subcultures of cells were performed at 80%–90% confluence using 0.25% trypsin-EDTA (Gibco, 25,200,056). D-gal was applied at a concentration of 15 mg/mL to damage the OC-1 cells.
siRNA transfection in OC-1 cells
We designed siRNA-Atg5, siRNA-Becn1, siRNA -Atg7, and siRNA-Foxg1 to knock down the expression of Atg5, Becn1, Atg7, and Foxg1 in OC-1 cells. An siRNA encoding a nonsense sequence was designed as the negative control. When OC-1 cells were cultivated to 50%-60% confluence in culture medium, we started to wash the cells with PBS (HyClone, SH30256.01). The culture medium was shifted to Opti-MEM (Gibco, 31,985,062) for transfection, and OC-1 cells were transfected with siRNA following the manufacturer’s instructions. About 6–8 h later, the Opti-MEM was replaced with standard culture medium as described above. OC-1 cells were cultured with FBS-free culture medium with aspirin or D-gal plus aspirin after transfection and then collected for western blot, immunofluorescence, and flow cytometry assays.
Drug administration
Rapamycin (LC Laboratories, AY22989) was used as the autophagy inducer, and 3-MA (Sigma-Aldrich, M9281) was used as the autophagy inhibitor. The OC-1 cells were pretreated with 0.1 mM rapamycin or 5 mM 3-MA for 6 h, and then D-gal was added for the follow-up experiments.
Plasmid constructs
The recombinant lentivirus vector mRFP-GFP-LC3B was produced by Hanbio Biotechnology (HB-AP2100001). A punctum with both GFP and mRFP fluorescence indicates an autophagosome that has not fused with a lysosome. Because the GFP signal is sensitive to the acidic environment when the autophagosome fuses with a lysosome, an mRFP punctum without GFP corresponds to a formative autolysosome.
Real-time PCR
Total RNA was extracted from OC-1 cells or whole cochleae with ExTrizol Reagent (Protein Biotechnology, PR90) and reverse transcribed to cDNA by using cDNA Synthesis Kits (Thermo Fisher Scientific, K1622) according to the manufacturers’ protocols. The qRT-PCR was performed on a LightCycler 480 RT-PCR system (Roche Diagnostics Ltd, Switzerland) with the LightCycler 480 SYBR Green I Master (Roche Diagnostics, 04887352001). Validated primers were designed for each targeted mRNA. qPCR conditions consisted of an initial denaturing step of 5 min at 95°C followed by 45 cycles of 10 s denaturation at 95°C, 20 s annealing at 60°C, and 20 s extension at 72°C. The mRNA expression was normalized to the mRNA expression of GAPDH. The results were calculated using the comparative cycle threshold (ΔΔCt) method.
Flow cytometry
Mito-SOX Red (Thermo Fisher Scientific, M36008) and TMRE (MedChemExpress, HY-D0985A) were used to analyze mitochondrial ROS production and mitochondrial membrane potential. After trypsinization, OC-1 cells were collected by centrifugation and washed with cold 1× PBS. The cell mass was then resuspended in solution containing Mito-SOX Red for 15 min at room temperature in the dark, followed by washing with cold PBS and analysis by flow cytometry (FACSCalibur, BD Biosciences, Carlsbad, CA, USA).
FITC ANXA5/annexin V (BD Biosciences, 556,547) was used for the analysis of apoptosis, and propidium iodide was used to distinguish viable cells from nonviable cells. OC-1 cells were trypsinized for 5 min and collected by centrifugation at 168 g for 5 min, washed with cold 1× PBS, resuspended in 1× binding buffer, and aliquoted at 1 × 10⁵ cells (100 μL) into a 5-mL culture tube. FITC ANXA5/annexin V and propidium iodide were added to the tube, gently vortexed, incubated for 15 min at room temperature in the dark, and analyzed by flow cytometry within 1 h.
Cell number analysis
OC-1 cells were cultured in 96-well plates at 2,000 cells/well for 24 h, and different drugs were added with three replicates each. Cell numbers were counted with the CCK-8 Cell Counting Kit (Protein Biotechnology, CC201) at different time points.
Western blot
OC-1 cells and cochleae were lysed with cold RIPA Lysis Buffer (Thermo Scientific, 89,900) plus PMSF (Thermo Scientific, 36,978). A BCA Protein Quantification Kit (Beyotime Biotechnology, P0010) was used to measure the protein concentration with GAPDH as the reference protein in line with the manufacturer’s instructions. LC3B-II was measured using an anti-LC3B rabbit polyclonal antibody (Sigma-Aldrich, L7543), CAT (catalase) was measured using an anti-CAT mouse monoclonal antibody (Sigma-Aldrich, C0979), FOXG1 was measured using an anti-FOXG1 rabbit polyclonal antibody (Abcam, ab18259), PPARGC1A was measured using an anti-PPARGC1A rabbit polyclonal antibody (Proteintech, 10,015,978), and GAPDH was measured using an anti-GAPDH rabbit polyclonal antibody (Abcam, ab8245). Peroxidase-conjugated goat anti-rabbit immunoglobulin G (Abcam, ab6721) was used as the secondary antibody. The proteins were bound to polyvinylidene fluoride membranes, and a SuperSignal West Dura chemiluminescent substrate kit (Thermo Scientific, 37,071) was used to detect the complexes according to the manufacturer’s instructions. The western blots were semi-quantified using ImageJ to measure the intensities of the bands.
Immunofluorescence
The immunohistochemistry was performed using the Fast ImmunoCytoChemistry® Staining Kit (Protein Biotechnologies, BPICC30–1KT). Anti-FOXG1 antibody (Abcam, ab18259), anti-LC3B antibody (Sigma-Aldrich, L7543), anti-MYO7A antibody (Proteus Bioscience, 25–6790), anti-CAT/catalase antibody (Sigma-Aldrich, C0979), anti-SOX2 antibody (Sigma-Aldrich, SAB2701974), phalloidin (Sigma-Aldrich, P1951), and DAPI were used for analyzing the expression of FOXG1, detecting autophagy, measuring ROS levels, and staining of HCs, supporting cells, microfilament structures, and nuclei, respectively.
A TUNEL Kit (Roche, 11,684,817,910) was used to detect apoptotic cells following the manufacturer’s instructions. Mito-SOX Red was used to measure ROS levels in live cells according to the manufacturer’s instructions. A Mitophagy Detection Kit (Dojindo Molecular Technologies, MD01; includes Mtphagy dye [red] and Lyso dye [green]) was used to detect mitophagy following the manufacturer’s instructions. For other antibody staining, the samples were incubated with 4% polyoxymethylene (Sigma-Aldrich, 158,127) for 1 h and washed completely three times with PBST (1× PBS with 0.1% Triton X-100 [Sigma-Aldrich, X100]) and permeabilized with 0.5% Triton X-100 (blocking medium) for 1 h. The primary antibodies were then added and incubated for 10 h at 4°C at a dilution of 1:400–1:1,000. The samples were washed three times with PBST and incubated for 1 h at 37°C with secondary antibody (Abcam, ab150073, ab150075, ab150074, ab150105, ab150107), phalloidin (Sigma-Aldrich, 49,409), or DAPI. The samples were imaged with a confocal microscope.
Electron microscopy
OC-1 cells and cochleae were fixed in 2.5% glutaraldehyde (Sigma-Aldrich, G5882) for 24 h, immobilized in 1% osmic acid (Sigma-Aldrich, O5500) for 1–2 h, dehydrated with acetone (Sinopharm Chemical Reagent, u1006801), and embedded in araldite CY 212 (TAAB, E009). Ultrathin sections were stained with alcoholic uranyl acetate (Polysciences, 6159–44-0) and alkaline lead citrate (Sigma-Aldrich, 15,326). The sections were washed gently with distilled water and observed with a JEM 1230 transmission electron microscope (JEOL Ltd, Tokyo, Japan).
Statistical analysis
All data are shown as the mean ± S.D, and all experiments were repeated at least three times. Statistical analysis was conducted using Microsoft Excel and GraphPad Prism 6. Two-tailed, unpaired Student’s t-tests were used to determine statistical significance when comparing two groups, and one-way ANOVA followed by a Dunnett multiple comparisons test was used when comparing more than two groups. A value of p < 0.05 was considered statistically significant.
Supplemental Material
Download Zip (118.2 MB)Acknowledgments
This work was supported by grants from the National Basic Research Program of China (2017YFA0105201), the Strategic Priority Research Program of the Chinese Academy of Science (XDA16010303), the National Natural Science Foundation of China (Nos. 81873700, 82030029, 81800915, 81230021, 81670929, 81400465, 81500795, 81970882), the National Key R&D Program of China (Nos. 2017YFA0103903), Natural Science Foundation from Jiangsu Province (BE2019711), Shenzhen Fundamental Research Program (JCYJ20190814093401920), and the Open Research Fund of the State Key Laboratory of Genetic Engineering, Fudan University (No. SKLGE1809).
Disclosure statement
The authors declare no competing financial interests.
Supplemental material
Supplemental data for this article can be accessed here.
Related Research Data
References
- Huang Q, Tang J. Age-related hearing loss or presbycusis. Eur Arch Oto-Rhino L: official journal of the European Federation of Oto-Rhino-Laryngological Societies (EUFOS): affiliated with the German Society for Oto-Rhino-Laryngology - Head and Neck Surgery. 2010;267(8):1179. .
- Č MH, Pegan K, Spes A, et al. Lysosomal pathways to cell death and their therapeutic applications. Exp Cell Res. 2012;318(11):1245–1251.
- Zerbes RM, Klei IJVD, Veenhuis M, et al. Mitofilin complexes: conserved organizers of mitochondrial membrane architecture. Biol Chem. 2012;393(11):1247–1261.
- Someya S, Prolla TA. Mitochondrial oxidative damage and apoptosis in age-related hearing loss. Mech Ageing Dev. 2010;131(7–8):480–486.
- Liu XZ, Yan D. Ageing and hearing loss. J Pathol. 2007;211(2):188–197.
- Tavanai E, Mohammadkhani G. Role of antioxidants in prevention of age-related hearing loss: a review of literature. Eur Arch Oto-Rhino-L. 2017;274(4):1–14.
- Böttger EC, Schacht J. The mitochondrion: a perpetrator of acquired hearing loss. Hear Res. 2013;303:12–19.
- Harman D. Aging: a theory based on free radical and radiation chemistry. J Gerontol. 1956;393(3):298.
- Hartford CM, Ratain MJ. Rapamycin: something old, something new, sometimes borrowed and now renewed. Clin Pharmacol Ther. 2007;82(4):381–388.
- Yu J, Wang Y, Liu P, et al. Mitochondrial DNA common deletion increases susceptibility to noise-induced hearing loss in a mimetic aging rat model. Biochem Biophys Res Commun. 2014;453(3):515–520.
- Kasahara T, Kubota M, Miyauchi T, et al. Mice with neuron-specific accumulation of mitochondrial DNA mutations show mood disorder-like phenotypes. Mol Psychiatry. 2006;11(6):577–593. .
- Yi Z, Hu Y, Wei P, et al. Age-related decline of the cytochrome c oxidase subunit expression in the auditory cortex of the mimetic aging rat model associated with the common deletion. Hear Res. 2012;294(1–2):40–48. .
- Chen B, Zhong Y, Peng W, et al. Age-related changes in the central auditory system: comparison of D-galactose-induced aging rats and naturally aging rats. Brain Res. 2010;1344:43–53.
- Bai U, Seidman MD, Hinojosa R, et al. Mitochondrial DNA deletions associated with aging and possibly presbycusis: a human archival temporal bone study. Am J Otolaryngol. 1997;18:449.
- Adam M, Nelson EG, Raul H. Quantification of the mitochondrial DNA common deletion in presbycusis. Laryngoscope. 2010;119:1184–1189.
- Kong WJ, Hu YJ, Wang Q, et al. The effect of the mtDNA4834 deletion on hearing. Biochem Biophys Res Commun. 2006;344(1):425–430. .
- Zhong Y, Hu YJ, Yang Y, et al. Contribution of common deletion to total deletion burden in mitochondrial DNA from inner ear of d-galactose-induced aging rats. Mutat Res. 2011;712(1–2):11–19. .
- Chen B, Zhong Y, Peng W, et al. Age-related changes in the central auditory system: comparison of D-galactose-induced aging rats and naturally aging rats. Brain Res. 2014;1344:43–53.
- Kong W-J, Hu Y-J, Wang Q, et al. The effect of the mtDNA4834 deletion on hearing. Biochem Biophys Res Commun. 2006;344(1):425–430.
- Scheffler IE. Biogenesis of mitochondria. John Wiley & Sons, Inc; 1968.
- Gilels F, Paquette ST, Zhang J, et al. Mutation of Foxo3 causes adult onset auditory neuropathy and alters cochlear synapse architecture in mice. J Neurosci. 2013;33(47):18409–18424.
- Seoane J, Le HV, Shen L, et al. Integration of smad and forkhead pathways in the control of neuroepithelial and glioblastoma cell proliferation. Cell. 2004;117(2):211–223.
- Pancrazi L, Di BG, Colombaioni L, et al. Foxg1 localizes to mitochondria and coordinates cell differentiation and bioenergetics. PNAS. 2015;112:13910–13915.
- He Z, Fang Q, Li H, et al. The role of FOXG1 in the postnatal development and survival of mouse cochlear hair cells. Neuropharmacology. 2019;144:43–57.
- Brancaccio M, Pivetta C, Granzotto M, et al. Emx2 and Foxg1 inhibit gliogenesis and promote neuronogenesis. Stem Cells. 2010;28(7):1206.
- Dastidar SG, Landrieu PM, D’Mello SR. FoxG1 promotes the survival of postmitotic neurons. J Neurosci. 2011;31(2):402.
- Tracy K, Dibling BC, Spike BT, et al. BNIP3 is an RB/E2F target gene required for hypoxia-induced autophagy. Mol Cell Biol. 2007;27(17):6229–6242.
- Mizushima N, Yamamoto A, Hatano M, et al. Dissection of autophagosome formation using apg5-deficient mouse embryonic stem cells. J Cell Biol. 2001;152(4):657–668. .
- Fujimoto C, Yamasoba T. Oxidative stresses and mitochondrial dysfunction in age-related hearing loss. Oxid Med Cell Longev. 2014;2014:582849.
- Bellot G, Garciamedina R, Gounon P, et al. Hypoxia-induced autophagy is mediated through hypoxia-inducible factor induction of BNIP3 and BNIP3L via their BH3 domains. Eur J Cancer. 2009;6:2570–2581.
- Shen HM, Codogno P. Autophagy is a survival force via suppression of necrotic cell death. Exp Cell Res. 2012;318(11):1304.
- Medeiros TC, Graef M. Autophagy determines mtDNA copy number dynamics during starvation. Autophagy. . p. 1–22019;15:178-9.
- Medeiros TC, Thomas RL, Ghillebert R, et al. Autophagy balances mtDNA synthesis and degradation by DNA polymerase POLG during starvation. J Cell Biol. 2018;217(5):217.
- Liharms X, Milasta S, Lynch J, et al. Mito-protective autophagy is impaired in erythroid cells of aged mtDNA-mutator mice. Blood. 2015;125(1):162. .
- Pardutz A, Schoenen J. NSAIDs in the acute treatment of migraine: a review of clinical and experimental data. Pharmaceuticals. 2010;3(6):1966.
- Chan AT. 282 aspirin use and survival after diagnosis of colorectal cancer. Jama. 2009;136(6):649–658.
- Pathi SS, Jutooru I, Chadalapaka G, et al. GT-094, a NO-NSAID, inhibits colon cancer cell growth by activation of a Reactive Oxygen Species (ROS)-MicroRNA-27a: ZBTB10-Specificityprotein (Sp) pathway. Mol Cancer Res. 2011;9(2):195. .
- Pathi S, Jutooru I, Chadalapaka G, et al. Aspirin inhibits colon cancer cell and tumor growth and downregulates specificity protein (Sp) transcription factors. Plos One. 2012;7(10):e48208.
- Berk M, Dean O, Drexhage H, et al. Aspirin: a review of its neurobiological properties and therapeutic potential for mental illness. BMC Med. 2013;11(1):1–17. 2013-03-18.
- Chang CW, Horng JT, Hsu CC, et al. Mean daily dosage of aspirin and the risk of incident alzheimer’s dementia in patients with type 2 diabetes mellitus: a nationwide retrospective cohort study in taiwan. J Diabetes Res. 2016;2016;2016:9027484.
- Pomponi M, Di GA, Bria P, et al. Fatty aspirin: a new perspective in the prevention of dementia of Alzheimer’s type? Curr Alzheimer Res. 2008;5(5):422–431.
- Ayyadevara S, Bharill P, Dandapat A, et al. Aspirin inhibits oxidant stress, reduces age-associated functional declines, and extends lifespan of caenorhabditis elegans. Antioxid Redox Signal. 2013;18(5):481–490. .
- Song BB, Anderson DJ, Schacht J. Protection from gentamicin ototoxicity by iron chelators in guinea pig in vivo. J Pharmacol Exp Ther. 1997;282:369.
- Pietrocola F, Castoldi F, Markaki M, et al. Aspirin recapitulates features of caloric restriction. Cell Rep. 2018;22(9):2395–2407. .
- Din FV, Valanciute A, Houde VP, et al. Aspirin inhibits mTOR signaling, activates AMP-activated protein kinase, and induces autophagy in colorectal cancer cells. Gastroenterology. 2012;142(7):e3. .
- Henry WS, Laszewski T, Tsang T, et al. Aspirin suppresses growth in PI3K-mutant breast cancer by activating AMPK and inhibiting mTORC1 signaling. Cancer Res. 2017;77(3):790–801. .
- Zeng L, Yang Y, Hu Y, et al. Age-related decrease in the mitochondrial sirtuin deacetylase sirt3 expression associated with ROS accumulation in the auditory cortex of the mimetic aging rat model. Plos One. 2014;9(2):e88019. .
- Du Z, Yang Y, Hu Y, et al. A long-term high-fat diet increases oxidative stress, mitochondrial damage and apoptosis in the inner ear of D-galactose-induced aging rats. Hear Res. 2012;287(1–2):15–24. .
- Kalinec GM, Webster P, Lim DJ, et al. A cochlear cell line as an in vitro system for drug ototoxicity screening. Audiology & Neurotology. 2003;8(4):177–189.
- Jeong HJ, Hong SH, Park RK, et al. Hypoxia-induced IL-6 production is associated with activation of MAP kinase, HIF-1, and NF-kappaB on HEI-OC1 cells. Hear Res. 2005;207(1–2):59–67.
- John GB, Shang Y, Li L, et al. The mitochondrial inner membrane protein mitofilin controls cristae morphology. Mol Biol Cell. 2005;16(3):1543. .
- Bjørkøy G, Lamark T, Johansen T. p62/SQSTM1: a missing link between protein aggregates and the autophagy machinery. Autophagy. 2006;2(2):138–139.
- Bjørkøy G, Lamark T, Brech A, et al. p62/SQSTM1 forms protein aggregates degraded by autophagy and has a protective effect on huntingtin-induced cell death. J Cell Biol. 2005;171(4):603–614. .
- Komatsu M, Waguri S, Koike M, et al. Homeostatic levels of p62 control cytoplasmic inclusion body formation in autophagy-deficient mice. Cell. 2007;131(6):1149–1163. .
- Kimura S, Noda T, Yoshimori T. Dissection of the autophagosome maturation process by a novel reporter protein, tandem fluorescent-tagged LC3. Autophagy. 2007;3(5):452–460.
- Klionsky DJ, Abdalla FC, Abeliovich H, et al. Guidelines for the use and interpretation of assays for monitoring autophagy. Autophagy. 2012;8:445–544.
- Wang L, Mai Z, Zhao M, et al. Aspirin induces oncosis in tumor cells. apoptosis. An International Journal on Programmed Cell Death. 2019.
- Henry WS, Laszewski T, Tsang T, et al. Aspirin Suppresses Growth in PI3K-Mutant Breast Cancer by Activating AMPK and Inhibiting mTORC1 Signaling. Cancer Res. 2017;77(3):790–801.
- Zhao Q, Wang Z, Wang Z, et al. Aspirin may inhibit angiogenesis and induce autophagy by inhibiting mTOR signaling pathway in murine hepatocarcinoma and sarcoma models. Oncol Lett. 2016;12(4):2804–2810.
- Shacka JJ, Klocke BJ, Shibata M, et al. Bafilomycin A1 inhibits chloroquine-induced death of cerebellar granule neurons. Mol Pharmacol. 2006;69(4):1125–1136. .
- Schalkwyk DAV, Chan XWA, Misiano P, et al. Inhibition of plasmodium falciparum pH regulation by small molecule indole derivatives results in rapid parasite death. Biochem Pharmacol. 2010;79(9):1291–1299.
- Chelikani P, Fita I, Loewen PC. Diversity of structures and properties among catalases. Cell Mol Life Sci. 2004;61(2):192–208.
- Ernster L, Schatz G. Mitochondria: a historical review. J Cell Biol. 1981;91(3):227s–55s.
- López-Otín C, Blasco MA, Partridge L, et al. The hallmarks of aging. Cell. 2013;153:1194–1217.
- Lemasters JJ. Selective mitochondrial autophagy, or mitophagy, as a targeted defense against oxidative stress, mitochondrial dysfunction, and aging. Rejuvenation Res. 2005;8(1):3–5.
- Sun N, Youle RJ, Finkel T. The mitochondrial basis of aging. Mol Cell. 2016;61(5):654–666.
- Iwashita H, Torii S, Nagahora N, et al. Live cell imaging of mitochondrial autophagy with a novel fluorescent small molecule. ACS Chem Biol. 2017;12(10):2546–2551. .
- Namba T. BAP31 regulates mitochondrial function via interaction with tom40 within ER-mitochondria contact sites. Sci Adv. 2019;5(6):eaaw1386–eaaw.
- Furuya N, Kakuta S, Sumiyoshi K, et al. NDP 52 interacts with mitochondrial RNA poly(A) polymerase to promote mitophagy. EMBO Rep. 2018;344(12):e46363. .
- Handschin C, Spiegelman BM. Peroxisome proliferator-activated receptor gamma coactivator 1 coactivators, energy homeostasis, and metabolism. Endocr Rev. 2006;27(7):728–735.
- St-Pierre J, Drori S, Uldry M, et al. Suppression of reactive oxygen species and neurodegeneration by the PGC-1 transcriptional coactivators. Cell. 2006;127(2):397–408. .
- St-Pierre J, Lin J, Krauss S, et al. Bioenergetic analysis of peroxisome proliferator-activated receptor gamma coactivators 1alpha and 1beta (PGC-1alpha and PGC-1beta) in muscle cells. J Biol Chem. 2003;278(29):26597–26603. .
- Mei H, Sun S, Bai Y, et al. Reduced mtDNA copy number increases the sensitivity of tumor cells to chemotherapeutic drugs. Cell Death Dis. 2015;6(4):e1710.
- Szklarczyk R, Nooteboom M, Osiewacz HD. Control of mitochondrial integrity in ageing and disease. Philos Trans R Soc London, Ser B. 2014;369(1646):20130439.
- Mitra K, Wunder C, Roysam B, et al. A hyperfused mitochondrial state achieved at G1-S regulates cyclin E buildup and entry into S phase. PNAS. 2009; 106:11960–11965.
- He Z, Sun S, Waqas M, et al. Reduced TRMU expression increases the sensitivity of hair-cell-like HEI-OC-1 cells to neomycin damage in vitro. Sci Rep. 2016;27(1):29621. .
- Loeb LA, Wallace DC, Martin GM The mitochondrial theory of aging and its relationship to reactive oxygen species damage and somatic mtDNA mutations. PNAS. 2005; 102:18769–18770.
- Du Z, Yang Y, Hu Y, et al. A long-term high-fat diet increases oxidative stress, mitochondrial damage and apoptosis in the inner ear of D-galactose-induced aging rats. Hear Res. 2012;287(1–2):15–24.
- Ho SC, Liu JH, Wu RY. Establishment of the mimetic aging effect in mice caused by D-galactose. Biogerontology. 2003;4(1):15–18.
- Woo JY, Gu W, Kim KA, et al. Lactobacillus pentosus var. plantarum C29 ameliorates memory impairment and inflammaging in a D-galactose-induced accelerated aging mouse model. Anaerobe. 2014;27:22–26.
- Xuan S, Baptista CA, Balas G, et al. Winged helix transcription factor BF-1 is essential for the development of the cerebral hemispheres. Neuron. 1995;14(6):1141–1152. .
- Regad T, Roth M, Bredenkamp N, et al. The neural progenitor-specifying activity of FoxG1 is antagonistically regulated by CKI and FGF. Nat Cell Biol. 2007;9(5):531–540.
- Hanashima C. Foxg1 suppresses early cortical cell fate. Science. 2004;303(5654):56.
- Noboru M, Akitsugu Y, Masahiko H, et al. Dissection of autophagosome formation using apg5-deficient mouse embryonic stem cells. J Cell Biol. 2001;152(4):657–668.
- Vernon PJ, Tang D. Eat-me: autophagy, phagocytosis, and reactive oxygen species signaling. Antioxid Redox Signal. 2013;18(6):677–691.
- Berk M, Dean O, Drexhage H, et al. Aspirin: a review of its neurobiological properties and therapeutic potential for mental illness. BMC Med. 2013;11(1):74. .
- Sha SH, Qiu JH, Schacht J. Aspirin to prevent gentamicin-induced hearing loss. N Engl J Med. 2006;354(17):1856–1857.
- Chen Y, Huang WG, Zha DJ, et al. Aspirin attenuates gentamicin ototoxicity: from the laboratory to the clinic. Hear Res. 2007;226(1–2):178–182. .
- Din FV, Valanciute A, Houde VP, et al. Aspirin inhibits mTOR signaling, activates AMP-activated protein kinase, and induces autophagy in colorectal cancer cells. Gastroenterology. 2012;142(7):1504–1515.e3.