
ABSTRACT
Parkinson disease (PD)-affected brains show consistent endoplasmic reticulum (ER) stress and mitophagic dysfunctions. The mechanisms underlying these perturbations and how they are directly linked remain a matter of questions. XBP1 is a transcription factor activated upon ER stress after unconventional splicing by the nuclease ERN1/IREα thereby yielding XBP1s, whereas PINK1 is a kinase considered as the sensor of mitochondrial physiology and a master gatekeeper of mitophagy process. We showed that XBP1s transactivates PINK1 in human cells, primary cultured neurons and mice brain, and triggered a pro-mitophagic phenotype that was fully dependent of endogenous PINK1. We also unraveled a PINK1-dependent phosphorylation of XBP1s that conditioned its nuclear localization and thereby, governed its transcriptional activity. PINK1-induced XBP1s phosphorylation occurred at residues reminiscent of, and correlated to, those phosphorylated in substantia nigra of sporadic PD-affected brains. Overall, our study delineated a functional loop between XBP1s and PINK1 governing mitophagy that was disrupted in PD condition.
Abbreviations: 6OHDA: 6-hydroxydopamine; baf: bafilomycin A1; BECN1: beclin 1; CALCOCO2/NDP52: calcium binding and coiled-coil domain 2; CASP3: caspase 3; CCCP: carbonyl cyanide chlorophenylhydrazone; COX8A: cytochrome c oxidase subunit 8A; DDIT3/CHOP: DNA damage inducible transcript 3; EGFP: enhanced green fluorescent protein; ER: endoplasmic reticulum; ERN1/IRE1α: endoplasmic reticulum to nucleus signaling 1; FACS: fluorescence-activated cell sorting; HSPD1/HSP60: heat shock protein family D (Hsp60) member 1; MAP1LC3/LC3: microtubule associated protein 1 light chain 3; MFN2: mitofusin 2; OPTN: optineurin; PD: Parkinson disease; PINK1: PTEN-induced kinase 1; PCR: polymerase chain reaction:; PRKN: parkin RBR E3 ubiquitin protein ligase; XBP1s [p-S61A]: XBP1s phosphorylated at serine 61; XBP1s [p-T48A]: XBP1s phosphorylated at threonine 48; shRNA: short hairpin RNA, SQSTM1/p62: sequestosome 1; TIMM23: translocase of inner mitochondrial membrane 23; TM: tunicamycin; TMRM: tetramethyl rhodamine methylester; TOMM20: translocase of outer mitochondrial membrane 20; Toy: toyocamycin; TP: thapsigargin; UB: ubiquitin; UB (S65): ubiquitin phosphorylated at serine 65; UPR: unfolded protein response, XBP1: X-box binding protein 1; XBP1s: spliced X-box binding protein 1
Introduction
Parkinson disease (PD) is a movement disorder characterized by the degeneration of dopaminergic neurons. Various cellular dysfunctions including altered dopamine metabolism, increased oxidative stress, mitochondrial failure, altered calcium homeostasis, neuroinflammation, impaired autophagy and proteasome dysfunctions appear tightly linked to PD-associated neuronal loss [Citation1]. Furthermore, numerous evidence indicate that the intracellular accumulation of misfolded proteins notably SNCA/alpha-synuclein [Citation2,Citation3] and endoplasmic reticulum (ER) overload could contribute to this pathology [Citation1,Citation4,Citation5]. The ER overload-associated stress leads to the activation of the unfolded protein response (UPR). The UPR consists of a coordinated signaling response tailored to the stress severity that will either restore ER homeostasis and preserve the cell or trigger its elimination by apoptosis in case of exacerbated stress. The UPR response is elicited by three stress sensors located at the ER membrane, namely, EIF2AK3/PERK (eukaryotic translation initiation factor 2 alpha kinase 3), ATF6 (activating transcription factor 6) and ERN1/IRE1α (endoplasmic reticulum to nucleus signaling 1) [Citation6,Citation7]. Importantly, postmortem studies of PD-affected human brains [Citation8–11] as well as toxin-induced [Citation12–14] and genetically designed cellular and animal models of PD converge to point to the key role of the UPR in PD [Citation4,Citation15].
ERN1 is the most evolutionary conserved ER stress transducer of the UPR that harbors a kinase and RNAse activity [Citation16]. ERN1-mediated signaling is a positive regulator of cell survival that stops upon beyond repair ER stress resulting in apoptosis. It is responsible for the unconventional splicing of XBP1 (X box binding protein 1) [Citation15–17] yielding its transcriptionally active form XBP1s (XBP1 spliced). XBP1s regulates genes involved in protein folding and ER-associated degradation (ERAD) and is frequently associated with a pro-survival phenotype in dopaminergic neurons [Citation18–20]. Interestingly, XBP1s was shown to participate in the macroautophagy/autophagy-mediated degradation process [Citation21,Citation22]. The molecular mechanisms underlying this control remain poorly understood. It should be noted that specialized elimination of dysfunctional mitochondria by mitophagy requires the recruitment of PRKN/parkin by PINK1 (PTEN induced kinase 1), a kinase that is considered as the cellular sensor of mitochondrial health [Citation23]. Noteworthy, PRKN has been shown to control XBP1s transcription [Citation24] and to promote PSEN (presenilin)-dependent control of PINK1 [Citation25]. Thus, we questioned whether XBP1s could be directly involved in the control of mitophagy and whether such phenotype could involve a PINK1-dependent process. Our work demonstrated that XBP1s controlled mitophagy via the transcriptional regulation of PINK1 in various cellular models as well as in vivo. Interestingly, we established that XBP1s underwent PINK1-dependent phosphorylation at sites reminiscent of those hyperphosphorylated in sporadic PD-affected substantia nigra. This was the first demonstration of a direct role of XBP1s transcriptional factor function in the control of mitophagy and the occurrence of a functional XBP1s-PINK1 loop governing mitophagy that could be disrupted in pathological conditions.
Results
Stress activators and ERN1 blockers similarly affect XBP1s and PINK1 in dopaminergic and primary cultured neurons as well as in mice brain
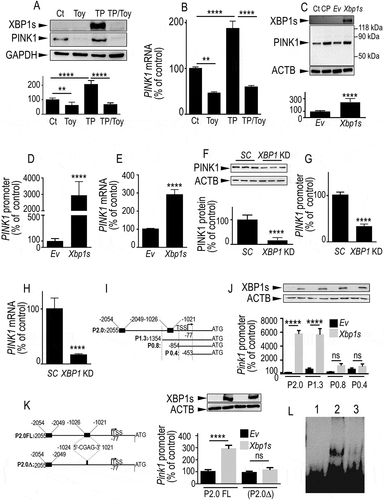
In SH-SY5Y dopaminergic neurons, the ER stress inducer thapsigargin (TP) similarly increased XBP1s and PINK1 protein expressions in a time-dependent manner (Fig. S1A and S1B). Accordingly, 8 h of TP treatment enhanced PINK1 promoter activity (Fig. S1C) and mRNA levels (Fig. S1D). We have chosen a treatment with TP for 8 h because it corresponded to the optimal time of induction for both PINK1 and XBP1s protein levels. It should be noted that in our experimental setting, after 8 h of TP treatment, SH-SY5Y cells were already committed to apoptotic program as illustrated by the increased expression of the ER stress-induced protein DDIT3/CHOP (DNA damage inducible transcript 3) (Fig. S1A). We examined whether ER stress-mediated enhancement of PINK1 transcriptional regulation could well be triggered by XBP1s. In order to address this question, we used toyocamycin (Toy), a specific blocker of ERN1 that is responsible for XBP1s functional activation after XBP1 splicing [Citation26] and that displays few nonspecific effects on several other kinases [Citation27–29]. As expected, Toy fully prevented the TP-induced increase of XBP1s expression (). Interestingly, Toy also reduced the basal protein () and mRNA () expressions of PINK1 but also fully blocked their TP-induced increases (). It should be noted that this data could indicate that even in basal non-stimulated condition, there exists a low but functional XBP1s production (poorly detectable by western blot but that can be unraveled upon long gel exposures) as we previously established by mRNA splicing analysis [Citation24] that is prevented by Toy. Importantly, in order to rule out any bias linked to cell immortalization, we examined the influence of TP and another ER stress modulator tunicamycin (TM) on XBP1s and PINK1 regulation in rat primary cultured neurons. Both TP (Fig. S2A-C) and TM (Fig. S2D-F), enhanced XBP1s (Fig. S2A and S2D) and PINK1 (Fig. S2A, S2B, S2D, and S2E) protein expressions and Pink1 mRNA levels (Fig. S2C and S2F). Of importance, TM also increased XBP1s (Fig. S2G) and PINK1 (Fig. S2G and S2H) protein expressions and Pink1 mRNA levels (Fig. S2I) in 2-month-old treated wild-type mice.
Figure 1. ER stress modulators and XBP1s regulate PINK1 transcription. (A and B) SH-SY5Y cells were treated for 8 h with vehicle (Ct, DMSO), toyocamycin (Toy, 1 µM), thapsigargin (TP, 1 µM) or thapsigargin and toyocamycin (TP/Toy). In TP/Toy condition, cells were pretreated for 16 h with Toy then TP was added for 8 h. Then, PINK1 and XBP1s protein expressions (A, N = 12, One-way ANOVA, Tukey’s multiple comparisons test) and PINK1 mRNA levels (B, N = 9, One-way ANOVA, Tukey’s multiple comparisons test) were analyzed as described in Materials and Methods. Data are expressed as percent of control DMSO-treated cells (taken as 100%) and are the means ± SEM of 3–4 independent experiments performed in triplicates. GAPDH expression (A) is provided as a control of protein load. (C-E) SH-SY5Y cells were transiently transfected with an empty pcDNA3 vector (Ev) or wild-type Xbp1s cDNA. Twenty-four hours after transfection, PINK1 protein expression (C, N = 12, analyzed by Student’s t test), promoter transactivation (D, N = 15, Student’s t test) and mRNA levels (E, N = 12, Student’s t test) were analyzed as described in Materials and Methods. SH-SY5Y cells treated with CCCP (CP, 10 µM for 6 h) were included as migration controls for PINK1. Data are expressed as percent of control Ev-transfected cells (taken as 100%) and are the means ± SEM of 4–5 independent experiments performed in triplicates. ACTB and XBP1s expressions are provided in (C) as a control of protein load and Xbp1s transfection efficiency. (F-H) SH-SY5Y stably expressing scrambled (SC) or shRNA-targeting XBP1 (XBP1 KD) were assessed for PINK1 protein expression (F, N = 9, analyzed by Student’s t test), PINK1 promoter transactivation (G, N = 15, Student’s t test) and PINK1 mRNA levels (H, N = 18, Student’s t test) as described in Methods. Data are expressed as percent of control SC cells (taken as 100%) and are the means ± SEM of 3–6 independent experiments performed in triplicates. ACTB expression is provided in (F) as a control of protein load. (I) The scheme represents the full-length (FL, P2.0) mouse Pink1 promoter region and 5ʹ end deletion constructs (P1.3, P0.8 and P0.4) in frame with luciferase. Black boxes on P2.0 construct correspond to two putative Xbp1s responsive elements. (J) Promoter constructs were then co-transfected in SH-SY5Y cells with the GLB1 (galactosidase beta 1) reporter gene (in order to normalize transfection efficiencies) and either empty vector (Ev, black bars) or Xbp1s (gray bars) cDNAs. Twenty-four hours after transfection, luciferase activity was measured (N = 12, analyzed by One-way ANOVA, Tukey’s multiple comparisons test) then expressions of XBP1s and ACTB were analyzed as described in Methods. Data are expressed as percent of control Ev/GLB1-transfected cells (taken as 100%) and are the means ± SEM of 4 independent experiments performed in triplicates. (K) The scheme (left panel) represents the PINK1 promoter construct (P2.0∆) lacking the −1024/-1021 Xbp1s-responsive element. P2.0 and P2.0∆ promoter constructs were co-transfected with the GLB1 reporter gene and either empty vector (Ev, black bars) or Xbp1s (gray bars) cDNAs in SH-SY5Y cells. Twenty-four hours after transfection, luciferase activity was measured (N = 9, analyzed by One-way ANOVA, Tukey’s multiple comparisons test) then expression of XBP1s and ACTB were analyzed as described in Methods (right panel). Data are expressed as percent of control Ev/GLB1-transfected cells (taken as 100%) and are the means ± SEM of 3 independent experiments performed in triplicates. Statistical significances are: **, P < 0.01, ****, P < 0.0001 and ns for non-significant. (L) EMSA analysis of the physical interaction of purified recombinant XBP1s and Pink1 biotinylated probes encompassing the −1024/-1021 sequence of the mouse promoter (see panel K) in absence (lane 2) or in the presence (lane 3) of an excess of unlabeled probe. Lane 1 corresponds to biotinylated probe alone
XBP1s modulates PINK1 expression at a transcriptional level
Next, we examined the impact of XBP1s on PINK1 regulation by a genetic approach. We demonstrated that Xbp1s transient overexpression (see expression of XBP1s in , upper panel) increased PINK1 protein expression () mRNA levels () and promoter transactivation (). It should be noted that in agreement with its pro-mitophagic role, XBP1s overexpression (Fig. S3A and S3C) led to an accumulation of PINK1 in the TIMM23 (translocase of inner mitochondrial membrane 23)-positive mitochondria-enriched compartment (Fig. S3A and S3B) similarly to control carbonyl cyanide m-chlorophenylhydrazone (CCCP) treatment known to stabilize PINK1 protein at the outer mitochondrial membrane. In order to confirm these data at an endogenous level, we examined the regulation of endogenous PINK1 in SH-SY5Y stably infected with lentiviral construct harboring a short hairpin RNA (shRNA) targeting XBP1. Fig. S4 showed infection efficacy by means of GFP imaging (Fig. S4A) that was correlated with a drastic reduction of XBP1s protein expression (Fig. S4B) and a 54% reduction in XBP1s mRNA levels (Fig. S4C). Genetic downregulation of XBP1 led to drastic reductions of PINK1 protein expression (), mRNA levels () and promoter transactivation (). Interestingly, in primary cultured neurons, XBP1s overexpression (Fig. S5A-C) increased PINK1 protein expression (Fig. S5A), mRNA levels (Fig. S5C) and promoter activity (Fig. S5B) while conversely, Xbp1 knockdown (Xbp1 KD) (Fig. S5D-F) lowered PINK1 protein (Fig. S5D) and mRNA (Fig. S5F) expressions. XBP1s protein overexpression and mRNA depletion levels are illustrated in Fig. S5A and S5E, respectively. Moreover, we examined the influence of XBP1 depletion on PINK1 expression in differentiated dopaminergic SH-SY5Y cells (Fig. S5G). The efficacy of dopaminergic differentiation by retinoic acid and phorbol ester subsequent treatment was illustrated by the increased level of the canonical dopaminergic marker, tyrosine hydroxylase (TH). We showed that, as we observed in non-differentiated SH-SY5Y cells, the depletion of endogenous XBP1 led to decreased PINK1 protein levels in SH-SY5Y differentiated cells. The above set of data confirmed the ability of endogenous and overexpressed XBP1s to upregulate PINK1 in both dopaminergic, primary cultured neurons as well as in differentiated dopaminergic SH-SY5Y cells.
The fact that XBP1s is a transcription factor and that PINK1 mRNA levels were modulated led us to examine whether XBP1s could act as a direct activator of Pink1 transcription. Interestingly, in silico analysis of Pink1 promoter region identified two putative XBP1s responsive elements (, black boxes in P2.0 construct). We carried out 5ʹ end deletion experiments of the full-length Pink1 promoter in frame with a luciferase gene reporter. First, we confirmed that Xbp1s expression (, upper panel) dramatically enhanced the transactivation of full-length Pink1 promoter (, P2.0). Truncation of the region harboring the most 5ʹ end responsive element (−2054/-2049, see , construct P1.3) did not affect the XBP1s-mediated transactivation of the Pink1 promoter construct (). Conversely, the deletion of the −1354/-854 region harboring the second responsive element (−1026/-1021, see construct P0.8) abolished the XBP1s-mediated Pink1 transactivation (). This was supported by the examination of the P0.4 construct (). We confirmed the functionality of this responsive element by site-directed deletion. We showed that partial removal of this responsive element (−1024/-1021) yielded a construct (P2.0∆, left panel) that remained unresponsive to XBP1s (, right panel).
The direct interaction of XBP1s with PINK1 promoter was further demonstrated by gel shift analysis. In this experiment, recombinant XBP1s was incubated with biotinylated Pink1 probes encompassing the delineated functional 1025–1021 domain of Pink1 promoter. This bimolecular in vitro interaction allowed unraveling a direct physical interaction without the participation of any additional transcriptional cofactor. showed that, indeed, XBP1s interacted with Pink1 probe ( compare lane 1 and 2), a label abolished by an excess of unlabeled probe (, compare lanes 2 and 3). Overall, this set of data indicated that XBP1s acted as a direct transcriptional activator of Pink1 gene and identified the responsive element mediating XBP1s-Pink1 promoter functional interaction.
XBP1s modulates mitophagy and mitochondrial health
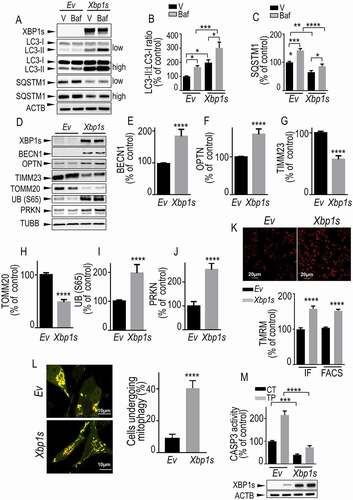
We assessed the functional influence of XBP1s expression on mitochondrial physiology and mitophagy, two processes tightly controlled by PINK1. This was assessed by monitoring a panel of autophagy/mitophagy protein reporters, some of which were previously shown to be linked to PINK1 [Citation30,Citation31]. We measured: 1) the expression of BECN1 (beclin 1) that is a pro-autophagy protein implicated in autophagosome formation and maturation [Citation32]; 2) the ratio of MAP1LC3-II/LC3-II (lipidated microtubule associated protein 1 light chain 3) vs. LC3-I expression, the modulation of which reflects autophagosome formation [Citation33]; 3) SQSTM1/p62 (sequestosome 1), OPTN (optineurin) and CALCOCO2/NDP52 levels that are autophagic receptors that have been linked to PRKN-PINK1 mitophagy process [Citation34]; 4) the expressions of TOMM20, TIMM23 and HSPD1/HSP60 (heat shock protein mitochondrial chaperone located at the mitochondrial matrix) that are biochemical markers of mitochondrial mass classically used to follow early and late mitophagic processes; 5) the levels of ubiquitin phosphorylated at serine 65 (UB [S65]) and PRKN, two substrates of PINK1 involved in the control of mitophagy [Citation33].
First, we assessed the impact of XBP1s on autophagic flux. Xbp1s cDNA transfection led to an increased LC3-II:LC3-I ratio () and reduced SQSTM1 () expression. Importantly, bafilomycin A1 (baf), which is classically used to trigger autolysosome acidification and to disrupt autophagosome-lysosome fusion [Citation33], increased XBP1s-mediated modulations of LC3-II:LC3-I and SQSTM1 () thereby confirming that XBP1s increased autophagic/mitophagic flux. Next, we showed that Xbp1s transient overexpression in dopaminergic neurons increased the protein levels of BECN1 (), OPTN (), UB (S65) (,) and PRKN (). Conversely, Xbp1s overexpression reduced TIMM23 () and TOMM20 () protein expressions. Furthermore, we measured the mitochondrial membrane potential in living cells using Tetramethyl rhodamine methylester (TMRM) probe and quantified fluorescence signal by confocal imaging (, upper panel and IF in histogram) and fluorescence-activated cell sorting (FACS) (, FACS in histogram). We showed that Xbp1s overexpression prevented the disruption of mitochondrial membrane potential () indicating that XBP1s controlled PINK1-mediated basal mitophagy. In order to analyze the impact of XBP1s on mitophagic flux in living cells, we used COX8A (cytochrome c oxidase subunit 8A)-EGFP (enhanced green fluorescent protein)-mCherry mitophagy reporter [Citation35]. The degree of mitophagy was calculated by the increase of the number of cells harboring red fragmented mitochondria (engulfed in the lysosomal acidic compartment) (). Importantly, this data clearly indicated that Xbp1s transfection increased mitophagic flux corroborating the LC3-II:LC3-I and SQSTM1 biochemical data. Thus, XBP1s expression exacerbated a punctate COX8A-linked red fluorescence corresponding to fragmented mitochondria, clearance in the lysosomal compartment (). Of importance, transient overexpression of Xbp1s in primary cultured neurons fully reproduced the phenotypes observed above for Xbp1s overexpression in dopaminergic cells (Fig. S6A and S6L). Finally, Xbp1s overexpression (, lower panel) allowed us delineating a protective phenotype illustrated by a reduction of basal and TP-mediated activation of the pro-apoptotic protein CASP3 (caspase 3; , histogram).
Figure 2. Xbp1s overexpression leads to increased mitophagy in SH-SY5Y cells. (A-C) SH-SY5Y cells were transiently transfected with an empty vector (Ev) or Xbp1s cDNA treated or not with bafilomycin A1 (Baf, 100 nM) then analyzed by western blot for XBP1s (A, N = 15), LC3-II:LC3-I ratio (A and B, N = 12) and SQSTM1/p62 (A and C, N = 15) protein levels. Statistical significances were analyzed by ordinary one-way ANOVA followed by Sidak’s multiple comparison test, * P < 0.05, ** P < 0.01, *** P < 0.001, ****, P < 0.0001. (D-J) SH-SY5Y cells were transiently transfected with an empty vector (Ev) or Xbp1s cDNA then analyzed for BECN1 (D and E, N = 9), OPTN (D and F, N = 15), TIMM23 (D and G, N = 12), TOMM20 (D and H, N = 9), UB (S65) (D and I, N = 12), PRKN (D and J, N = 12) and TUBB protein levels as described in Methods. (K) SH-SY5Y cells were transiently transfected with an empty vector (Ev) or Xbp1s cDNA then mitochondrial membrane potential was measured by cell imaging (upper panel, N = 100 cells, two independent experiments, IF in histogram) or flow cytometry (, N = 15, 5 independent experiments, FACS in histogram) by means of TMRM probe as detailed in the Methods. Values are expressed as percent of control Ev-transfected cells (taken as 100%) and correspond to the means ± SEM of 2–5 independent experiments. Statistical significances were analyzed by Mann-Whitney test, ****, P < 0.0001. (L) SH-SY5Y cells were transiently transfected with COX8A-EGFP-mCherry cDNA together with an empty vector (Ev) or Xbp1s cDNAs. Fragmented mitochondria visualized by red fluorescence punctate (left panel) were counted as described in Methods. The degree of mitophagy (right panel) was calculated by the increase of number of cells harboring red punctae. (M,) CASP3 activity fluorimetric assay was performed as described in Methods. Values are expressed as percent of control Ev-transfected cells (taken as 100%) and correspond to the means ± SEM of 4 independent experiments performed in triplicates. Statistical significances were analyzed by ordinary one-way ANOVA followed by Sidak’s multiple comparison test, ***, P < 0.001, ****, P < 0.0001
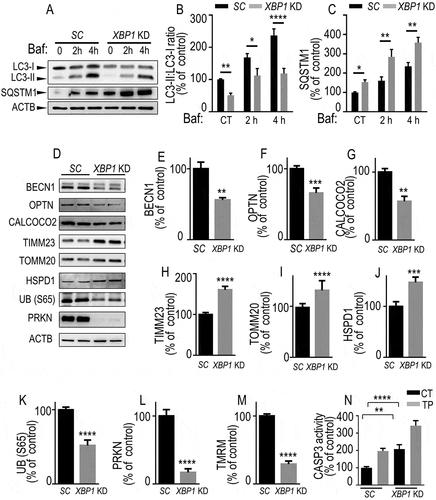
We performed similar extensive analysis of autophagic/mitophagic reporters in XBP1 KD dopaminergic cells (). First, in basal conditions, we observed decreased LC3-II:LC3-I ratios () and augmented SQSTM1 expression () associated with XBP1 knockdown. Of note, baf treatment time-dependently increased both basal and XBP1 KD -linked LC3-II:LC3-I ratios () and SQSTM1 expressions (), confirming our previous conclusion (see ) that XBP1s controlled mitophagy flux at endogenous levels. Furthermore, we observed decreased expressions of BECN1 (), OPTN (), CALCOCO2 (), UB (S65) () and PRKN () while TIMM23 (), TOMM20 () and HSPD1 () levels were augmented. Of note, all above-described protein markers varied in a perfect opposite manner in Xbp1s-overexpressing dopaminergic cells () and primary cultured neurons (Fig. S6A-K) compared to XBP1 KD () cells. Further, opposite to overexpression of Xbp1s, reduction of endogenous levels of XBP1s also drastically reduced mitochondrial membrane potential () and increased basal and TP-stimulated CASP3 activity (). The latter observation was corroborated by our observation of an activation of the apoptotic UPR illustrated by the increase of DDIT3 protein and mRNA levels (data not shown). Overall, the above data concurred to conclude that XBP1s modulated mitochondrial function and mitophagy.
Figure 3. Endogenous XBP1s lowers mitophagic response. (A-C) SH-SY5Y cells stably expressing either control (scrambled, SC, black bars) or Xbp1 shRNA (Xbp1KD, gray bars) were either treated or not with bafilomycin A1 (Baf 100 nM for the indicated times) then examined by western blot (see Methods) for LC3-II:LC3-I ratio (A and B, N = 9, one-way ANOVA, Tukey’s multiple comparison test), SQSTM1 (A and C, N = 6, Kruskal Wallis multiple comparison). (D-L) BECN1 (D and E, N = 6, Mann-Whitney test), OPTN (D and F, N = 9, Student’s t test), CALCOCO2 (D and G, N = 6, Mann-Whitney test), TIMM23 (D and H, N = 9, Student’s t test), TOMM20 (D and I, N = 12, Mann-Whitney test), HSPD1 (D and J, N = 9, Student’s t test), UB (S65) (D and K, N = 9, Student’s t test) and PRKN (D and L, N = 9, Student’s t test) protein expressions in SC or XBP1 KD cells. ACTB expressions are provided in (A and D) as controls of protein load. (M) Mitochondrial potentials of SC and XBP1 KD cells were analyzed by flow cytometry as described in Methods (N = 15, analyzed by Student’s t test). (N) CASP3 activity expression was measured in basal and TP-stimulated conditions as described in Methods (N = 12, analyzed by One-way ANOVA followed by Sidak’s multiple comparison test). (B-N) Data are expressed as percent of SC (CT) cells (taken as 100%) and are the means ± SEM of 2–5 experiments performed in triplicates. Statistical significances are * P < 0.05, ** P < 0.01, *** P < 0.001, ****, P < 0.0001
XBP1s-induced modulation of mitophagy and mitochondrial health is dependent on PINK1
Our data indicated that XBP1s-associated effects on mitochondrial and mitophagic processes strictly resembled those described for PINK1-associated phenotypes. Although we showed that XBP1s was a transcriptional activator of PINK1, it remained to definitely establish whether XBP1s-induced phenotype was fully or partly dependent on endogenous PINK1. To address this question, we have overexpressed Xbp1s in PINK1 knockdown (PINK1 KD) dopaminergic cells and assessed the influence of PINK1 reduction on the expression of the above-described panel of mitophagy/autophagy protein reporters as well as on the mitochondrial membrane potential (). First and importantly, comparative analyses of PINK1 control (PINK1 CT) and PINK1 KD cells (compare lanes [-] of black and gray bars in ) indicated that the PINK1 KD-associated mitophagy response perfectly mimicked XBP1 KD-induced phenotype (see ). Thus, PINK1 KD cells showed decreased levels of BECN1 (), LC3-II:LC3-I ratio (), OPTN (), CALCOCO2 (), UB (S65) () and PRKN () while SQSTM1 (), TIMM23 (), TOMM20 (), HSPD1 () and MFN2 (mitofusin 2) levels () were increased. Membrane mitochondria potential analysis () also corroborated the protective role of endogenous PINK1 in the preservation of mitochondria function.
Figure 4. XBP1s-mediated control of mitophagy is fully PINK1-dependent. (A-L) Control (PINK1 CT) or PINK1 knocked-down (PINK1 KD) SH-SY5Y cells were transiently transfected with an empty vector (Ev) or with Xbp1s (Xbp1s) cDNA. Twenty-four hours after transfection, BECN1 (A and B, N = 8) LC3-II:LC3-I ratio (A and C, N = 8), SQSTM1 (A and D, N = 8), OPTN (A and E, N = 8), CALCOCO2 (A and F, N = 8), TIMM23 (A and G, N = 12), TOMM20 (A and H, N = 12), HSPD1 (A and I, N = 12), UB (S65) (A and J, N = 8), PRKN (A and K, N = 8) and MFN2 (A and L, N = 12) protein expressions were analyzed by western blot as described in Methods. ACTB expression is provided in (A) as a control of protein load. (M) PINK1 CT and PINK1 KD cells either empty vector (-) or Xbp1s (+) cDNA-transfected were analyzed by flow cytometry to measure mitochondrial membrane potential as described in Methods. (B-M) Data are expressed as percent of PINK1 CT non-transfected cells (taken as 100%) and are the means ± SEM. of 4–6 independent experiments performed in duplicates. Statistical analyses were performed by Kruskal Wallis multiple comparison test (B) and Sidak’s multiple comparisons test (C-M). Statistical significances: ns, not significant, * P < 0.05, ** P < 0.01, *** P < 0.001, **** P < 0.0001
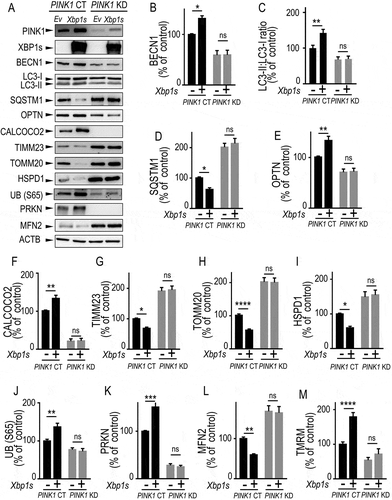
Second, in this set of independent experiments, we fully reproduced the effects described in and S6 concerning the impact of Xbp1s on the control of mitophagy in PINK1 CT cells. Thus, Xbp1s overexpression (compare black bars, lanes [-] and [+]) triggered an upregulation of BECN1 (), LC3-II:LC3-I ratio (), OPTN (), CALCOCO2 (), UB (S65) () and PKKN () while SQSTM1 (), TIMM23 (), TOMM20 (), HSPD1 () and MFN2 () levels were decreased. Membrane mitochondria potential analysis () also emphasized the protective function of XBP1S in the preservation of mitochondria function.
Finally, of utmost importance, all Xbp1s-linked effects on expressions of protein reporters and TMRM were fully abolished by PINK1 depletion (, compare [-] and [+] gray bars in PINK1 KD cells). Overall, our data clearly demonstrated that XBP1s-mediated control of mitochondrial physiology and mitophagy was fully PINK1-dependent.
Pharmacological blockade of ERN1 reduces endogenous PINK1 expression and mimics PINK1-knockdown-associated phenotype in mice
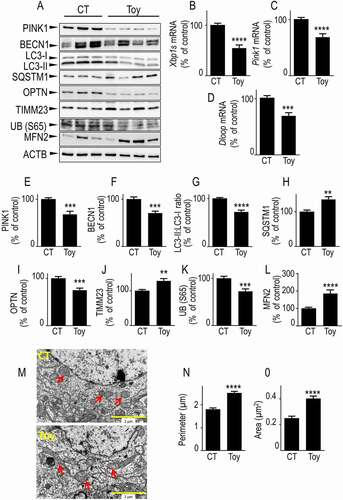
Our study showed that XBP1s was a transcriptional activator of PINK1 and that this accounted for all PINK1-dependent XBP1s-mediated control of mitochondrial physiology. Since Toy blocks ERN1 and thereby drastically downregulated both XBP1s and PINK1 protein and mRNA levels (see ), we postulated that Toy treatment should decrease the mitophagy response linked to an XBP1s-mediated PINK1 downregulation in mouse brain. showed that the pharmacological blockade of ERN1 indeed significantly reduced PINK1 protein expression () as well as Xbp1s and Pink1 mRNA levels (). Moreover, we showed that Toy reduced the levels of the mitochondrial DNA content marker, D-loop, indicating that XBP1s affected mitochondrial function in vivo corroborating our in cellulo TMRM data (). Further, Toy reduced BECN1 (), LC3-II:LC3-I ratio (), OPTN () and UB (S65) () expressions. Conversely, Toy increased SQSTM1 () and TIMM23 (). Of interest, electronic microscopy analysis showed that Toy triggered abnormal mitochondrial morphology, with elongated mitochondria (see arrows in ) characterized by increased perimeters () and surface (). These results were corroborated by the Toy-induced increase in MFN2 () and agreed well with the reduction of MFN2 expression observed after Xbp1s overexpression (see ). This data indicated that impairing the upstream modulation of the XBP1s-PINK1 signaling by Toy-mediated inhibition of the nuclease yielding functional XBP1s, triggered mitochondrial defects in vivo similar to those observed in both XBP1 KD and PINK1 KD cells. Thus, the XBP1s-PINK1 axis also functionally modulated mitochondrial physiology and mitophagy, in vivo.
Figure 5. Pharmacological blockade of XBP1s impacts mitophagy, mitochondrial morphology and mtDNA in mice brain. (A) Two-month-old mice were intraperitoneally injected with toyocamycin (Toy) or vehicle (CT) as described in Methods. Seventy-two hours after injection, Xbp1s (B), Pink1 (C) and Dloop (D) mRNA were analyzed by RT-PCR as described in Methods. PINK1 (A and E), BECN1 (A and F), LC3-II:LC3-I ratio (A and G), SQSTM1 (A and H), OPTN (A and I), TIMM23 (A and J), UB (S65) (A and K), MFN2 (A and L) protein expressions were analyzed by western blot as described in Methods. ACTB expression is provided in (A) as a control of protein load. (B-L) Data are expressed as percent of CT vehicle-injected mice brain (taken as 100%) and are the means ± SEM of 9–14 mice for each group. Statistical significances were analyzed by Student’s t test and Mann-Whitney test, ** P < 0.01, *** P < 0.001, **** P < 0.0001. (M) Electron microphotographs illustrating mitochondrial morphology in brains (cortical region) from CT (upper) and Toy (lower)-injected mice. Red arrows point to mitochondria in two representative images of neuronal cell body (N, nucleus). (N and O) Quantification of mitochondria perimeter and area on brain slices from CT and Toy-injected mice. Bars correspond to the average mitochondria perimeter (N, µm) and area (O, µm2) counted from 20–30 images of neuronal cell bodies (2 mice for each condition). Data are expressed as means ± SEM and statistical significances were analyzed by Mann-Whitney test, **** P < 0.0001
XBP1s is phosphorylated by PINK1 in cells and in mice brain
XBP1s, as is the case for all transcription factors, must shuttle to the nucleus to exert its function. It has been demonstrated that phosphorylation processes directly impact XBP1s nuclear translocation and consequently, its transcriptional function [Citation36,Citation37]. Since PINK1 is a well-characterized kinase, we questioned whether PINK1 could phosphorylate XBP1s, thereby unraveling a functional forward loop between XBP1s and PINK1. We first compared the ability of wild-type (WT) PINK1 and its kinase-dead homolog (MT, PINK1K219M) [Citation38] to modulate expressions of phosphorylated forms of XBP1s. We examined the status of XBP1s phosphorylation at its threonine 48 (XBP1s [p-T48A]) and serine 61 XBP1s [p-S61A] that have been proposed as key XBP1s residues undergoing phosphorylation [Citation36,Citation37]. In basal (CT) conditions, WT PINK1 enhanced both XBP1s [p-T48A] and XBP1s [p-S61A] expressions while the PINK1 mutation abolished this effect (, compare black bars). As expected, in TP-treated Ev condition, XBP1s [p-T48A] and XBP1s [p-S61A] expressions were increased and further enhanced by WT PINK1 but not by PINK1 MT (). In agreement, PINK1 KD cells mimicked the phenotype of PINK1 MT-expressing cells. Thus, a drastic reduction of XBP1s [p-T48A] and XBP1s [p-S61A] expressions was observed in PINK1 KD cells in both basal and TP-linked stress conditions (). This conclusion was supported by the time-dependent reduction of TP-induced phosphorylation of XBP1s in MEF cells invalidated for Pink1 (pink1−/-) (Fig. S7A). Indeed, nearly all TP-induced phosphorylations observed after 8 h of treatment were abolished by Pink1 depletion (Fig. S7A-C). Importantly, brain samples from 6–10-month-old pink1−/- mice displayed reduced expressions of p-XBP1s (T48) () and p-XBP1s (S61) () indicating that XBP1s phosphorylation by PINK1 also occurred in vivo. Interestingly, the phosphorylation of XBP1s by PINK1 appeared to be age-dependent since brain samples from younger pink1−/- mice (2–4 months) displayed lower XBP1s [p-T48A]-expression (Fig. S7D) while XBP1s [p-S61A] was not detectable at this age (not shown).
Figure 6. PINK1 phosphorylates XBP1s on threonine 48 and serine 61 residues in cells and in mice brain. (A-C) SH-SY5Y cells were transiently transfected with an empty vector (Ev), V5-tagged WT Pink1 (WT) or kinase-dead Pink1 mutant (Pink1K219M, MT) cDNAs. Twenty-four hours after transfection, cells were treated for 8 h with either vehicle (CT, black bars) or thapsigargin (TP, 1 µM, gray bars). (D-F) PINK1 CT and PINK1 KD cells were treated as in A-C with either vehicle (CT, black bars) or thapsigargin (TP, 1 µM, gray bars). V5-tagged PINK1 (A), total XBP1s (A and D) and phosphorylated XBP1s (A and D, pXBP1s [p-S61A], pXBP1s [p-T48A]) expressions were measured by western blot as described in Methods. (B,C,E,F) Data corresponding to indicated XBP1s phosphorylated species are expressed as percent of untreated Ev (B and C, N = 15) or PINK1 CT cells (E and F, N = 12 and 6 respectively) (taken as 100%) and are the means ± SEM of 2–5 independent experiments performed in triplicate. Statistical significances were performed by two-way ANOVA, Tukey’s multiple comparisons test, ns, non-significant, * P < 0.05, ** P < 0.01, **** P < 0.0001. (G-I) western blot analysis of pXBP1s [p-S61A] and pXBP1s [p-T48A] in Pink1+/+ and pink1−/- mice brain. Bars are the means ± SEM of 8 mice per group. Statistical significances were analyzed by Mann-Whitney’s test (H) and Student’s t test (I), ***, p < 0.001; ****, p < 0.0001
![Figure 6. PINK1 phosphorylates XBP1s on threonine 48 and serine 61 residues in cells and in mice brain. (A-C) SH-SY5Y cells were transiently transfected with an empty vector (Ev), V5-tagged WT Pink1 (WT) or kinase-dead Pink1 mutant (Pink1K219M, MT) cDNAs. Twenty-four hours after transfection, cells were treated for 8 h with either vehicle (CT, black bars) or thapsigargin (TP, 1 µM, gray bars). (D-F) PINK1 CT and PINK1 KD cells were treated as in A-C with either vehicle (CT, black bars) or thapsigargin (TP, 1 µM, gray bars). V5-tagged PINK1 (A), total XBP1s (A and D) and phosphorylated XBP1s (A and D, pXBP1s [p-S61A], pXBP1s [p-T48A]) expressions were measured by western blot as described in Methods. (B,C,E,F) Data corresponding to indicated XBP1s phosphorylated species are expressed as percent of untreated Ev (B and C, N = 15) or PINK1 CT cells (E and F, N = 12 and 6 respectively) (taken as 100%) and are the means ± SEM of 2–5 independent experiments performed in triplicate. Statistical significances were performed by two-way ANOVA, Tukey’s multiple comparisons test, ns, non-significant, * P < 0.05, ** P < 0.01, **** P < 0.0001. (G-I) western blot analysis of pXBP1s [p-S61A] and pXBP1s [p-T48A] in Pink1+/+ and pink1−/- mice brain. Bars are the means ± SEM of 8 mice per group. Statistical significances were analyzed by Mann-Whitney’s test (H) and Student’s t test (I), ***, p < 0.001; ****, p < 0.0001](/cms/asset/cb4276a3-7291-4073-9876-c14bd450b1b0/kaup_a_1917129_f0006_b.gif)
PINK1 phosphorylates XBP1s in vitro and governs its cellular localization
In order to demonstrate direct phosphorylation of XBP1s by PINK1, we carried out in vitro phosphorylation assays. We first validated this in vitro assay by showing that, indeed, ubiquitin (UB), a canonical substrate of PINK1 [Citation39], underwent phosphorylation by WT PINK1 but not by PINK1 MT at its expected serine 65 residue (see UB [S65] in ). This set of data also showed that WT PINK1 but not kinase-dead PINK1 phosphorylated XBP1s at the threonine 48. Of note, WT PINK1 did not phosphorylate XBP1s at serine 61 in vitro, indicating that the modulation of phospho-serine 61 levels observed in cells, aged mice brain ( and S7) and PD-affected brains (see below ) could be time-dependent or would likely require co-factors occurring at late stage of the disease. Overall, our data demonstrated that XBP1s was a direct substrate of PINK1 and that its phosphorylation occurred in cells and mouse brains.
Figure 7. PINK1-mediated phosphorylation of XBP1s enhances its nuclear translocation, controls its own transcription and mitophagy, a phenotype abolished by non-phosphorylable XBP1s mutants. (A) XBP1s and UB (S65) (used as positive control substrate) phosphorylations by recombinant wild-type PINK1 (WT PINK1) or kinase-dead mutant PINK1 (PINK1D395A) were performed as described in Methods. XBP1s, XBP1s [p-T48A], XBP1s [p-S61A], total UBB (UB-t), UB (S65) and PINK1 protein levels were analyzed by western blot. (B) SH-SY5Y cells were transfected with empty vector (Ev), WT PINK1 or PINK1D395A (MT) cDNA. Twenty-four hours after transfection, cells were treated for 8 h without (-) or with (+) thapsigargin (TP, 1 µM). XBP1s, V5-tagged PINK1 and ACTB protein expressions were monitored in whole cell lysate (Lys. Tot.) while XBP1s, histone (H2AZ1) and ACTB protein expressions were monitored by western blot in either cytoplasmic (Cyt.) or nuclear (Nuc.) cellular fractions prepared as described in Methods. (C) Data corresponding to nuclear XBP1s are expressed as percent of Ev-untreated cells (taken as 100%) and are the means ± SEM of 2 independent experiments performed in triplicate. Statistical significances were analyzed by one-way ANOVA, Tukey’s multiple comparisons test * P < 0.05, ** P < 0.01, **** P < 0.0001. (D-G) SH-SY5Y were transiently transfected with an empty vector (Ev), wild-type Xbp1s (WT) or Xbp1s mutants (Xbp1s [p-S61A] (S), Xbp1s [p-T48A] [T] or Xbp1s [p-S61A]/Xbp1s [p-T48A] [S/T]) cDNAs. Twenty-four hours after transfection, PINK1 protein expressions (D and E, N = 12), promoter activity (F, N = 12), and mRNA levels (G) were analyzed as described in Methods. Data are expressed as percent of control Ev-transfected cells (taken as 100%) and are the means ± SEM of 4 independent experiments performed in triplicates. Statistical significances were analyzed by one-way ANOVA, Turkey’s multiple comparisons test, ns, non-significant, ** P < 0.01, *** P < 0.01. (H) EDEM1 mRNA was measured in basal (CT) or thapsigargin (TP)-stimulated conditions in wild-type (PINK1 CT, black bars) or PINK1 KD SH-SY5Y cells (note that EDEM1 mRNA are totally undetectable in PINK1 KD cells). Data are expressed as percent of control (CT)-untreated cells (taken as 100%) and are the mean ± SEM of 4 independent experiments performed in triplicates. Statistical analysis was performed by two-way ANOVA, Sidak’s multiple comparison test, * P < 0.05, **** P < 0.0001. (D, I-N) Expressions of BECN1 (D and I), OPTN (D and J), TIMM23 (D and K), TOMM20 (D and L) UB (S65) (D and M) and PRKN (D and N) were analyzed by western blotting after Ev-, WT Xbp1s or S, T and S/T Xbp1s-mutants cDNAs transfection as described in Methods. Data are expressed as percent of Ev cells (taken as 100%) and are the mean ± SEM of 3 independent experiments performed in triplicates. Statistical analysis were analyzed by one-way ANOVA followed by either Kruskal-Wallis multiple comparison test (E,L,M) or Tukey’s multiple comparison (F,G,I-K,N), * P < 0.05, ** P < 0.01, *** P < 0.001, **** P < 0.0001 and ns = non-significant
![Figure 7. PINK1-mediated phosphorylation of XBP1s enhances its nuclear translocation, controls its own transcription and mitophagy, a phenotype abolished by non-phosphorylable XBP1s mutants. (A) XBP1s and UB (S65) (used as positive control substrate) phosphorylations by recombinant wild-type PINK1 (WT PINK1) or kinase-dead mutant PINK1 (PINK1D395A) were performed as described in Methods. XBP1s, XBP1s [p-T48A], XBP1s [p-S61A], total UBB (UB-t), UB (S65) and PINK1 protein levels were analyzed by western blot. (B) SH-SY5Y cells were transfected with empty vector (Ev), WT PINK1 or PINK1D395A (MT) cDNA. Twenty-four hours after transfection, cells were treated for 8 h without (-) or with (+) thapsigargin (TP, 1 µM). XBP1s, V5-tagged PINK1 and ACTB protein expressions were monitored in whole cell lysate (Lys. Tot.) while XBP1s, histone (H2AZ1) and ACTB protein expressions were monitored by western blot in either cytoplasmic (Cyt.) or nuclear (Nuc.) cellular fractions prepared as described in Methods. (C) Data corresponding to nuclear XBP1s are expressed as percent of Ev-untreated cells (taken as 100%) and are the means ± SEM of 2 independent experiments performed in triplicate. Statistical significances were analyzed by one-way ANOVA, Tukey’s multiple comparisons test * P < 0.05, ** P < 0.01, **** P < 0.0001. (D-G) SH-SY5Y were transiently transfected with an empty vector (Ev), wild-type Xbp1s (WT) or Xbp1s mutants (Xbp1s [p-S61A] (S), Xbp1s [p-T48A] [T] or Xbp1s [p-S61A]/Xbp1s [p-T48A] [S/T]) cDNAs. Twenty-four hours after transfection, PINK1 protein expressions (D and E, N = 12), promoter activity (F, N = 12), and mRNA levels (G) were analyzed as described in Methods. Data are expressed as percent of control Ev-transfected cells (taken as 100%) and are the means ± SEM of 4 independent experiments performed in triplicates. Statistical significances were analyzed by one-way ANOVA, Turkey’s multiple comparisons test, ns, non-significant, ** P < 0.01, *** P < 0.01. (H) EDEM1 mRNA was measured in basal (CT) or thapsigargin (TP)-stimulated conditions in wild-type (PINK1 CT, black bars) or PINK1 KD SH-SY5Y cells (note that EDEM1 mRNA are totally undetectable in PINK1 KD cells). Data are expressed as percent of control (CT)-untreated cells (taken as 100%) and are the mean ± SEM of 4 independent experiments performed in triplicates. Statistical analysis was performed by two-way ANOVA, Sidak’s multiple comparison test, * P < 0.05, **** P < 0.0001. (D, I-N) Expressions of BECN1 (D and I), OPTN (D and J), TIMM23 (D and K), TOMM20 (D and L) UB (S65) (D and M) and PRKN (D and N) were analyzed by western blotting after Ev-, WT Xbp1s or S, T and S/T Xbp1s-mutants cDNAs transfection as described in Methods. Data are expressed as percent of Ev cells (taken as 100%) and are the mean ± SEM of 3 independent experiments performed in triplicates. Statistical analysis were analyzed by one-way ANOVA followed by either Kruskal-Wallis multiple comparison test (E,L,M) or Tukey’s multiple comparison (F,G,I-K,N), * P < 0.05, ** P < 0.01, *** P < 0.001, **** P < 0.0001 and ns = non-significant](/cms/asset/05a1f7f6-e9a8-4e09-baa3-eec8518eae35/kaup_a_1917129_f0007_b.gif)
Figure 8. PINK1, XBP1s phosphorylation and mitophagic markers expressions are altered in sporadic Parkinson disease (PD)-affected brains. (A-J) PINK1 (A and B), XBP1s [p-S61A] (A and C), XBP1s [p-T48A] (A and D), TIMM23 (A and E), TOMM20 (A and F), UB (S65) (A and G), OPTN (A and H) and CASP3 (A and I) protein expressions in control (CT, N = 10) and PD, (N = 8) brains were analyzed by western blot as described in the Methods. Data are expressed as percent of CT brains (taken as 100%). Statistical significances were analyzed by Student’s t test: ns, non-significant, ** P < 0.01, *** P < 0.001. Correlations analyses of PINK1 and XBP1s [p-S61A] (J) and XBP1s [p-T48A] (K) protein expressions are illustrated in (J and K). PINK1 full gel illustrating the migration profile of full-length PINK1 in control (PINK1 CT) and shRNA-depleted PINK1 (PINK1 KD) samples is provided in (A). A representative ACTB gel is provided to illustrate equal protein load
![Figure 8. PINK1, XBP1s phosphorylation and mitophagic markers expressions are altered in sporadic Parkinson disease (PD)-affected brains. (A-J) PINK1 (A and B), XBP1s [p-S61A] (A and C), XBP1s [p-T48A] (A and D), TIMM23 (A and E), TOMM20 (A and F), UB (S65) (A and G), OPTN (A and H) and CASP3 (A and I) protein expressions in control (CT, N = 10) and PD, (N = 8) brains were analyzed by western blot as described in the Methods. Data are expressed as percent of CT brains (taken as 100%). Statistical significances were analyzed by Student’s t test: ns, non-significant, ** P < 0.01, *** P < 0.001. Correlations analyses of PINK1 and XBP1s [p-S61A] (J) and XBP1s [p-T48A] (K) protein expressions are illustrated in (J and K). PINK1 full gel illustrating the migration profile of full-length PINK1 in control (PINK1 CT) and shRNA-depleted PINK1 (PINK1 KD) samples is provided in (A). A representative ACTB gel is provided to illustrate equal protein load](/cms/asset/2d313f86-eb26-498d-a870-461a3eee9f52/kaup_a_1917129_f0008_b.gif)
As stated above, we assumed that XBP1s phosphorylation should modify its cellular localization and likely enhance its nuclear load. Thus, we examined the influence of wild-type and mutated PINK1 overexpression on XBP1s expression in total cell lysates as well as in nuclear and cytosolic compartments. In TP conditions, WT PINK1 but not PINK1 MT cDNA transfection enhanced XBP1s expression in total lysate (). In TP-treated empty vector-transfected cells, (TP, Ev), as expected, XBP1s was essentially in the nucleus with little if any expression in the cytosol (). WT PINK1 expression drastically enhanced XBP1s nuclear levels, a phenotype totally prevented by PINK1 mutation (). Conversely, PINK1 MT allowed unraveling a cytosolic XBP1s component that was totally lacking in WT PINK1 expressing cells ().
XBP1s mutations on threonine 48 and serine 61 abolish XBP1s-mediated control of PINK1 and prevent XBP1s-linked modulation of autophagic/mitophagic protein reporters
We aimed at assessing whether XBP1s phosphorylation by PINK1 reflects a functional forward loop by which PINK1 could control its own expression. We assumed that if PINK1 controlled XBP1s phosphorylation and thereby, its own expression via its kinase activity, mutations of the above-identified XBP1s phosphorylated residues should abolish XBP1s-mediated control of PINK1 expression. It was indeed the case since, while as expected, wild-type XBP1s enhanced PINK1 protein and mRNA expressions as well as promoter transactivation (see above and ), non-phosphorylable XBP1s mutants failed to modulate PINK1 (). The fact that PINK1 could indeed control XBP1s transcriptional function was further supported by the fact that PINK1 depletion fully prevented the basal and TP-induced mRNA levels of EDEM1, a canonical XBP1s transcriptional target ( [Citation40]). Of interest, mutations abolishing PINK1-mediated phosphorylation of XBP1s impaired the effect of wild-type XBP1s (WT) on BECN1, OPTN, TIMM23, TOMM20, UB (S65) and PRKN protein expressions (). Overall, we concluded that XBP1s was a transcriptional activator of PINK1, which in turn, phosphorylated XBP1s, enhanced its nuclear localization and thereby PINK1 own expression and consequently, PINK1-mediated control of mitophagic process.
PINK1 and XBP1s [p-T48A] and XBP1s [p-S61A] expressions are increased and positively correlated in PD-affected brains
Finally, we examined the status of PINK1, XBP1s [p-T48A] and XBP1s [p-S61A] and autophagic/mitophagic protein reporters in sporadic PD-affected brains. First, pathological brains showed increased expression of PINK1 (), XBP1s [p-S61A] () and XBP1s [p-T48A] () expressions. Of utmost importance, the expression of PINK1 positively correlated with both XBP1s [p-S61A] () and XBP1s [p-T48A] () expressions. This could be directly related to the mitochondrial accumulation of PINK1 in the mitochondria (see Fig. S3), which corresponds to its localization and functional site. Interestingly, PD-affected brains that have enhanced expressions of XBP1s and PINK1 displayed alterations in TIMM23, TOMM20, UB (S65) and OPTN () reminiscent of those observed after overexpression of XBP1s. Moreover, PD-affected brains in which exacerbated cell death has been described [Citation41] also exhibited enhanced active CASP3 expression () indicating induction of the apoptotic phase of the UPR.
Importantly, corroborating these postmortem studies in PD brains, we aimed at assessing whether such regulation also occurred in PD-linked cellular models. Thus, we examined the impact of two well-recognized ER stressors linked to PD physiopathology, namely 6-hydroxydopamine (6OHDA) (Fig. S8A-D) and oligomeric SNCA [Citation13,Citation42–44] (Fig. S8E-I) in differentiated SH-SY5Y neuroblastoma cells. We demonstrate that 6OHDA triggered an increase of PINK1 (Fig. S8A and S8B) and XBP1s (Fig. S8A and S8C) in a dose-dependent manner and that the levels of these two proteins were strongly and significantly correlated (Fig. S8D, Spearman, test r = 0.74, P < 0.0001). Similarly, oligomeric but not monomeric α-synuclein increased both PINK1 and XBP1s expressions (Fig. S8E-H), in a strongly correlated manner (Fig. S8I). Overall, our study showed that our observations are relevant of PD pathological process taking place similarly in cells and animal models as well as in PD-affected brains.
Discussion
PD is an age-related neurodegenerative disease whose etiology is likely multifactorial and whose anatomical stigmata indicate an exacerbated ER stress and severe mitochondrial failure [Citation1,Citation4]. The molecular mechanisms underlying these dysfunctions, whether they are directly linked and how they occur are poorly understood. In this study, we demonstrated for the first time a functional molecular interplay between the transcription factor XBP1s and the kinase PINK1, two proteins involved in ER-stress response and mitochondrial homeostasis that could be disrupted in PD.
PINK1 is a key serine-threonine kinase [Citation45] that, in conjunction with the E3-ligase [Citation46] and transcription factor protein PRKN [Citation47,Citation48], behaves as an important modulator of mitophagy [Citation49]. Our work clearly established that XBP1s upregulates PINK1 transcription in a dopaminergic cell line as well as in primary cultured cortical neurons. Interestingly, PINK1 transcription could be modulated by EIF2AK3, a protein participating in another branch of the UPR [Citation50]. Very few studies aimed at understanding PINK1 transcriptional regulation have been reported. Thus, it has been shown that PINK1 gene transcription is regulated by FOXO3 (forkhead box O3), TP53, NFKB1, PRKN and GABPA/NRF2 (GA binding protein transcription factor subunit alpha) [Citation25,Citation51–54]. Interestingly, it has been shown that PINK1 transcription is also repressed by ATF3 (activating transcription factor 3) in lung cells [Citation55] suggesting that PINK1 transcriptional regulation may be cell type-dependent. Interestingly, Li et al have shown that a prolonged treatment (24 h) of cortical neurons with TP leads to a reduction of PINK1 protein [Citation56]. These apparently discrepant data could likely be explained by the fact that the modulation of PINK1 protein levels is time-dependent and that prolonged treatment with TP triggers a decrease of PINK1 expression. In agreement, our TP kinetic studies performed in SH-SY5H cells indicated that TP induced a bell-shaped regulation of PINK1 that peaked at 8 h and returned to control values at 16 h (data not shown). Of note, our in vitro and in vivo data showing the upregulation of PINK1 by XBP1s agreed well with the increased levels of PINK1 observed in PD human brains ( and [Citation57,Citation58]).
The fact that PINK1 promoter is regulated by several transcription factors linked to distinct ER stress pathways led us to speculate that XBP1s could directly impact mitochondrial health and fate (mitophagy) and that PINK1 could well account for the molecular effector bridging these two cellular paradigms. Our hypothesis was corroborated by four independent lines of evidence. First Toy, that blocks ERN1-mediated unconventional splicing of XBP1 and thereby, prevents the occurrence of functional XBP1s, similarly impacted endogenous XBP1s and PINK1 expressions and influenced mitophagy markers and effectors in vivo. Second, overexpressed and endogenous XBP1s indeed modulated autophagy (LC3-II:LC3-I, SQSTM1, BECN1) and mitophagy (PRKN, UB [Citation59], TIMM23, TOMM20) markers and effectors. Third, the depletion of endogenous PINK1 fully mimicked phenotypic modulations triggered by XBP1s depletion. Fourth, importantly, the XBP1s-mediated alteration of mitophagy was fully prevented by PINK1 depletion. Overall, this set of data is the first demonstration of direct XBP1s-mediated control of mitophagy directly and fully linked to transcriptional activation of PINK1.
We also demonstrated for the first time an XBP1s-mediated and PINK1-dependent regulation of the autophagic receptors OPTN and CALCOCO2. This indicated that PINK1 was implicated not only in the recruitment of these receptor proteins to mitochondria [Citation34,Citation60], but also in the regulation of autophagic receptors that have been linked to PRKN-PINK1 mitophagy process [Citation34]. This agreed well with a decrease of LC3 recruitment by OPTN and CALCOCO2 and by consequence, with a reduction of mitophagy response associated with PINK1 depletion. Importantly, we showed that Xbp1s cDNA transfection led to an accumulation of the mitochondrial pools of PINK1 (Fig. S3) compatible with its downstream mitophagic effect in absence of a disruption of membrane mitochondrial potential (). These results corroborated several studies showing that PINK1 can control basal mitophagy. Thus, Jin et al. [Citation61] have demonstrated that the accumulation of PINK1 may be independent of disruption of mitochondrial membrane potential and occurs in response to the ER stress mediated by the accumulation of misfolded proteins in the mitochondrial matrix. Wang et al showed that PINK1-mediated mitophagy may be independent of mitochondrial depolarization and instead may be a trigger of mitochondrial hyperpolarization, thereby again corroborating our data () [Citation62]. This work shows that primary cultured dopaminergic neurons prepared from pink1 knockout mice display a depolarized ∆ψm and that overexpression of wild-type PINK1 restores the hyperpolarized ∆ψm observed in PINK1-null dopaminergic cells. This indicates that PINK1 promotes neuroprotection by contributing to maintaining the mitochondrial potential corroborating our data showing a correlation between XBP1s-mediated PINK1 accumulation and increase of ∆ψm.
The few studies concerning the implication of XBP1s in the control of autophagy response have yielded contrasting conclusions. Thus, XBP1s has been shown to upregulate autophagy via the modulation of BECN1 transcription and consequently autophagosome formation in endothelial cells [Citation21]. Moreover, Xbp1 knockdown by siRNA approaches leads to a decrease of LC3-II levels in auditory cells [Citation22]. By contrast, XBP1s was also shown to repress autophagy. Thus, XBP1s downregulates FOXO1 [Citation63,Citation64], a protein that enhances autophagy in human cancer cell lines [Citation59,Citation65]. Further, Hetz et al. show that Xbp1 depletion leads to an aggravation of experimental amyotrophic lateral sclerosis (ALS) due to an enhancement of autophagy in motor neurons [Citation66]. Although a few studies have linked XBP1s to autophagy, our study gathered, to the best of our knowledge, the first evidence that XBP1s could control selective elimination of defective mitochondria by mitophagy. It also indicated that XBP1s-mediated PINK1 regulation was associated with a protective response in cells as illustrated by the lowering of CASP3 activity.
The second important and fully original aspect of our study was the demonstration that PINK1, which harbors a kinase activity, could control XBP1s transcriptional activity via its phosphorylation at serine 61 and threonine 48. Thus, PINK1-mediated phosphorylation of XBP1s promoted its translocation to the nucleus, favored its transcriptional activity and thereby, enhanced PINK1 own transcription. This molecular dialog that could be seen as a forward loop was supported by in vitro phosphorylation assay, fractionation studies and functional readout. Furthermore, this functional interplay was strengthened by the fact that the expression of mutated XBP1s proteins that resisted PINK1-mediated phosphorylation abolished XBP1s-linked enhancement of PINK1 protein and mRNA expressions.
Of note, analysis of XBP1s phosphorylation by PINK1 indicated that it directly phosphorylates XBP1s only at threonine 48 in vitro as well as in young PINK1 transgenic mice. However, PINK1-mediated phosphorylation of XBP1s at both threonine 48 and serine 61 was abolished in aged pink1 knockout mice. Whether these observations related to ontogenic modulation of PINK1 or distinct affinities of PINK1 for the two residues remained unclear. It is of note that XBP1s activation by phosphorylation by kinases unrelated to PINK1 has been unraveled in various pathological contexts. Thus, Lee et al. have demonstrated that the MAPK14 (p38 mitogen-activated protein kinase 14) directly phosphorylates XBP1s at serine 61 and threonine 48 [Citation36] and that the resulting activation of XBP1s can contribute to the maintenance of glucose homeostasis in obesity. Interestingly, corroborating our data and further supporting the impact of XBP1s phosphorylation for PD pathology, Jiao et al. have demonstrated that 1-methyl-4-phenyl pyridinium (MPP+), a neurotoxin used to mimic PD in vivo, leads to increased phosphorylation of XBP1s at serine 61 by CDK5 (cyclin dependent kinase 5) [Citation37]. Most PINK1 substrates identified to date are either mitochondrial (TRAP1 [TNF receptor associated protein 1], HTRA2 [HtrA serine peptidase 2]) or recruited to mitochondria (PRKN, UBB) [Citation39,Citation67–69]. Interestingly, XBP1s was the first PINK1 substrate directly linked to the ER and the UPR response.
Three independent lines of data indicated that the functional interplay governing XBP1s-PINK1 cellular homeostasis could well be disrupted in Parkinson disease. First, both PINK1 and phosphorylated XBP1s protein levels are upregulated in human PD brains (see ). Second, importantly, we established that PD-affected brains displayed enhanced XBP1s phosphorylated species at residues reminiscent of those (threonine 48 and serine 61) modulated by PINK1 (). Third, two widely used inducers of PD-like pathology, namely 6-hydroxydopamine and oligomeric but not monomeric SNCA increased both PINK1 and XBP1s expressions in differentiated dopaminergic cells and that their expressions were highly correlated (Fig. S8)
Of utmost importance, our data also indicated a strong positive correlation between PINK1 and these two XBP1s phosphorylated species present in control and PD-affected brains (see ). Previous works have shown that the protein levels of PINK1 are increased in sporadic PD [Citation57,Citation58] but our study was the first to document an increased expression of XBP1s in PD-affected brains, and more particularly of its phosphorylated forms. This had to be considered in light of previous studies showing an enhancement of phosphorylated ERN1 levels in several neurodegenerative disorders [Citation70]. Thus, our study showed that, indeed, the ERN1-XBP1 branch was upregulated in PD. Considering that MAPK14 and CDK5 kinases are affected in PD [Citation71,Citation72], it remains to be established if they independently or coordinately interact functionally with PINK1 to modulate XBP1s in PD. It should be noted that we have previously shown that nuclear TP53, a tumor suppressor that also controls autophagy [Citation73], acts as a transcriptional repressor of PINK1 [Citation52]. Further, we have established that TP53 also downregulates XBP1s expression [Citation24]. Thus, these data fully agree with the present study and indicate that TP53 can repress autophagy by direct transcriptional repression of PINK1 or indirectly, via the downregulation of XBP1s.
XBP1s elicited a pro-mitophagic response. This positive regulation agreed with the beneficial role of autophagy/mitophagy in physiological conditions or non-chronic stress conditions [Citation74]. The protective role of autophagy was supported by the fact that the depletion of the key autophagy proteins ATG5 or ATG7 in vivo resulted in increased neurodegeneration and the presence of cytoplasmic inclusion bodies mainly composed of protein aggregates [Citation75,Citation76]. That said, the observation of an activation of an XBP1s-PINK1 axis and the delineated forward loop questioned whether this corresponded to a protective mechanism or if it accounted for ER-stress and mitochondrial defects observed in PD. Since XBP1s phosphorylation enhanced its nuclear localization and thus, its function, it could be envisioned that PINK1-induced phosphorylation of XBP1s is beneficial. This could be a transient adaptive response that does not last enough to circumvent chronic disease establishment. The transient expression and protective effect of XBP1s has been documented in another neurodegenerative disease, namely Alzheimer disease. Thus, we have shown that in AD-affected brains and AD animal models, XBP1s expression is transiently enhanced at early stages of the pathology and that this protects against Aβ oligomers-mediated EPHB2 (EPH receptor B2)-linked toxicity [Citation77]. In the same line of reasoning, we have shown that Aβ oligomers enhance XBP1s levels leading to a decrease of BACE1 (beta secretase 1) activity, the enzyme responsible for Aβ production [Citation78] as a protective response [Citation79]. Thus, the protective response elicited by XBP1s is probably sufficient to delay the onset and even the progression of several neurodegenerative disorders including Alzheimer and Parkinson diseases at initial stages, but may become inefficient considering their chronic, long-lasting nature. According to this statement, it is worth noting that both the UPR and autophagy processes are characterized by an adaptation and an apoptotic phase [Citation74,Citation80]. Thus, one can envision that, even if the beneficial transient activation of the XBP1s-PINK1 axis occurs, the chronic activation of both UPR and autophagy responses may lead to the firing of apoptotic stigmata that characterize neurodegenerative diseases. Interestingly, we documented in this study a correlation between the XBP1s-PINK1 interplay and activation of apoptotic response (illustrated by CASP3 activation) in sporadic PD-affected brains suggesting that the protective effects are mediated by the interplay PINK1-XBP1s had been overcome by the sustained PINK1-mediated mitophagy response at late stage of the disease.
Overall, our work is the first demonstration of a link between the UPR and mitophagy responses via a functional crosstalk between XBP1s and PINK1 and that this physiological signaling cascade may be disrupted in PD conditions.
Materials and methods
Constructs description and transfection approaches
The mouse Xbp1s-Flag pcDNA3 has been designed by one of us and described in [Citation81]. The XBP1 shRNA and scramble (SC) shRNA sequences have been cloned in the FUGW lentiviral vector (Addgene, 14883 [Citation82]). The human PINK1 and mouse Pink1 promoters have been described in [Citation51]. The pGL3 vector (Promega, U47295) containing the mouse Pink1 promoter served as a template to generate the promoter deleted of the 5′-CGAG-3′ nucleotides. This deleted motif constitutes part of the XBP1s putative binding site. This sequence is located from nucleotides −1026 to −1021 upstream of Pink1 ATG start codon. The primers used were forward: 5ʹ-GTGGATTTCTGAGTTGCCAGCCTGGTCTAC-3ʹ and reverse 5ʹ-GTAGACCAGGCTGGCAA CTCAGAAATCCAC-3ʹ. The generation of wild-type (WT PINK1) and mutant PINK1K219 V5-tagged of human PINK1 coding sequence in the mammalian expression vector pcDNA6 (Invitrogen, V220-20) has been described [Citation38] and graciously provided by Dr. St Georges Hyslop (Tanz Center for Research in Neurodegenerative Diseases, Toronto, Canada). Wild-type and mutated Xbp1s coding sequences in pcDNA3.1 vector (mutants: Xbp1s [p-T48A], Xbp1s [p-S61A] and Xbp1s [p-T48A/S61A]) have been described [Citation36]. Oligonucleotides containing an shRNA targeting human PINK1 (primer forward: 5ʹ- GATCCCCCCAAGCTGGTCTAGTAGATTTCAAGAGAATCTACTAGACCAGCTTGGTTTTTA-3ʹ and reverse: 5ʹ-AGCTTAAAAACCAAGCTGGTCTAGTAGATTCTCTTGAAATCTACTAG ACCAGCTTGGGGG-3ʹ) or a scrambled RNA (primer forward: 5ʹ-GATCCCCGAGTTACCCGC TAGATGTATTCAAGAGATACATCTAGCGGGTAACTCTTTTTA-3ʹ and reverse: 5ʹ- AGCTTAAAAAGAGTTACCCGCTAGATGTATCTCTTGAATACATCTAGCGGGTAACTCGGG-3ʹ) have been inserted in the pSUPER.neo+GFP (green fluorescent protein) vector according to the manufacturer’s instructions (Oligoengine, VEC-PBS-0006). All the constructs were verified by sequencing. Transient and stable transfections of SH-SY5Y (ATCC®, CRL-2266™) were carried by means of Lipofectamine 2000 (Invitrogen, 11668019) according to the manufacturer’s instructions.
Lentivirus production and SH-SY5Y cells infection
shRNA lentivirus production was performed as described in [Citation77]. In brief, XBP1 depletion was performed by means of validated shRNA sequences targeting human and mouse XBP1 under the RNU6 promoter. Target sequence was 5′-GGTCTGCTGAGTCCGCAGCA-3ʹ [Citation24,Citation83]. The RNU6-shRNA expression cassette (pSilencer 2.1-U6 Neo; Ambion, Thermo Fisher Scientific, AM5764) was inserted in the PacI site of a modified FUGW lentiviral backbone, placing the shRNA cassette upstream of a UBC (ubiquitin C) promoter directing expression of enhanced GFP. A similar construct expressing a scrambled scRNA (5′-GCCCGTCTGCGTGGAGCTAA-3′) was used as a control. Viral titers were determined by p24 ELISA (Cell Biolabs, VPK-107). Concentrated lentiviruses (scramble RNA XBP1 = 3.39 x 10¹⁰ Lentiviral Particles [LPS]/ml, shRNA XBP1 = 3.08 x 10¹⁰ LPS/ml) were directly added to SH-SY5Y cells. Four days after infection, cells were re-plated in 100 mm diameter dishes in order to generate enough cells for either conservation at −150°C or analysis of the percentage of protein and mRNA XBP1s depletion in basal and TP conditions by western blot and real-time quantitative PCR analysis, respectively (see below).
Electrophoretic mobility gel shift assay (EMSA)
We performed EMSA by means of a commercial gel shift chemiluminescent EMSA assay kit (Promega, E3050). In brief, purified wild-type XBP1s recombinant protein (300 ng) or control nuclear extracts were pre-incubated in 1X Gel Shift Binding buffer (Promega, E3050) at 20°C for 10 min. When indicated, an excess (4 pmol) of unlabeled competitor oligonucleotides was added. Positive control of the experiment corresponds to a non-related labeled control DNA (20 fmol) added to the nuclear extract (data not shown). After this pre-incubation step, we added when indicated 20 fmol of double-stranded 5ʹ biotin end-labeled PINK1-derived oligonucleotides (forward: 5ʹ-GGATTTCTGAGTTCGAGGCCAGCCTGGTCT-3ʹ; reverse: 5ʹ-AGACCAGGCTGGCCTCGAACTCAGAAATCC-3ʹ) containing the delineated -1025-1021 XBP1s responsive element and incubated all the reactions at 20°C for 20 min. The samples were resolved by electrophoresis on a nondenaturing acrylamide gel (5%) at 4°C, transferred to a positively charged nylon membrane (Thermo Fisher Scientific, 77016), and after cross-linking with an UV-light cross-linker (equipped with a 254-nm bulb), revealed by means of streptavidin conjugated to horseradish peroxidase (HRP; Active Motif, 37341) and a chemiluminescent substrate.
Cell models and pharmacological ER-stress modulation
Most of the experiments were performed in non-differentiated SH-SY5Y human neuroblastoma cells cultured at 37°C and 5% (vol:vol) CO2, in Dulbecco’s Modified Eagle’s Medium (DMEM; Gibco-Invitrogen, 41965–039) supplemented with 10% fetal calf serum (Dutscher, S1900-500) containing penicillin and streptomycin (100 U/ml; Gibco, 15140–122). These cells were routinely profiled and validated by Short Tandem Repeat profiling according to the manufacturer’s instructions (GenePrint® 10 System, Promega) and tested for mycoplasma contamination PCR according to a previously published paper [Citation84]. When indicated, these cells were treated with 1 µM of thapsigargin (Sigma-Aldrich, T9033) or 10 µg/ml of tunicamycin (Sigma-Aldrich, T7765) for 8 and 6 h respectively. A pre-treatment with 1 µM toyocamycin (Sigma-Aldrich, T3580) for 16 h was performed in a subset of experiments in which cells were co-treated with thapsigargin and toyocamycin. For cell fractionation procedures, these cells were treated with 5 µM of CCCP (Sigma Aldrich, C2759) for 6 h. In a subset of experiments, cells were treated for 2 or 4 h with baf (100 nM, Enzo Life Sciences, BML-CM110-0100).
SH-SY5Y cells stably overexpressing the shRNA targeting XBP1 or a control scrambled sequence were obtained by transduction approaches. SH-SY5Y cells overexpressing the shRNA targeting PINK1 or a control scrambled sequence were obtained by transfection approaches.
Mouse embryonic fibroblasts (MEFs) control or invalidated for PINK1 were provided by Dr. B. De Strooper (VIB-KU Leuven center for brain and disease research, Belgium) [Citation85].
SH-SY5Y differentiation and treatments
In the experiments described in Fig. S5G and S8 , we have differentiated stable naïve and XBP1-depleted SH-SY5Y neuroblastoma cells by means of a subsequent treatment with retinoic acid (Sigma-Aldrich, R2625) and 12-O-tetradecanoyl-phorbol-13-acetate (TPA, Sigma-Aldrich, P8139) according to an established protocol [Citation86]. In brief, SH-SY5Y (2 x 10⁵ cells) were plated on 6-well culture plates (Corning Costar, 3516) in normal medium containing DMEM/F12, 10% fetal bovine serum, penicillin-streptomycin and sodium pyruvate. Twenty-four hours after plating, SH-SY5Y cells were differentiated for 3 d by addition of retinoic acid (10 µM) in neurobasal media containing B-27 (2%) and L-glutamine (1%, Sigma-Aldrich, Milan, Italy), then the media were removed and replaced with neurobasal media containing TPA (80 nM), B-27 (2%) and L-glutamine (1%) for another 3 d. Differentiation state was confirmed by analyzing the protein levels of the dopaminergic marker TH (tyrosine-hydroxylase) by western blot (antibody referenced in ). In a subset of experiments, differentiated SH-SY5Y cells were treated for 24 h with either 6-hydroxydopamine (6OHDA; Sigma-Aldrich, H4381) at 10, 25 and 50 µM or with SNCA monomers or oligomers (2 µM for 8 h). As described previously [Citation87], SNCA oligomers were produced by incubating recombinant human SNCA (Anaspec, AS-55555) at 1 mg/ml (70 µM) with a 30:1 excess of 4-hydroxy-2-nonenal (HNE; Sigma-Aldrich, H9538) overnight at 37°C. After incubation, the reaction was centrifuged by using an Amicon 3-kDa cutoff ultra-centrifugal unit (Millipore, UFC500324) for 10 min at 14 000 x g to remove unbound aldehyde.
Table 1. List of antibodies used in western blot analysis
Mouse and human brains description and processing for analysis
Brains from pink1 knockout (pink1−/-) male mice have been kindly provided by Dr. J. Shen and have been extensively described [Citation88]. Control or pink1−/- brains of 2–4 or 6–10-month-old were transferred to green bead tubes (MagNA Lyser Green beads; Roche, 03358941001) containing 1 ml of lysis buffer (10 mM, Tris-HCl, pH 7.5 supplemented with a protease inhibitors cocktail [Sigma-Aldrich, P2714], and phosphatase inhibitors [1 mM sodium orthovanadate, 5 µM sodium fluoride]). Mouse brains were subsequently bead-beaten for 45 s at 4,700 x g in a MagNA Lyser instrument (Roche). Homogenates were then sonicated on ice before western blot analysis.
Human substantia nigra samples were obtained from brains collected in a Brain Donation Program of the Brain Bank “Neuro-CEB” run by a consortium of patients Associations: CSC (cerebellar ataxias), Fondation ARSEP (research on multiple sclerosis), France Parkinson, “Vaincre Alzheimer Fondation”. The consents were signed by the patients themselves or their next of kin in their name, in accordance with the French Bioethical Laws. The Brain Bank Neuro-CEB (BB-0033-00011) has been declared at the Ministry of Higher Education and Research and has received approval to distribute samples (agreement AC-2013-1887). These samples include 10 controls and 8 PD patients. Controls include four amyotrophic lateral sclerosis (ALS) patients (control non-PD-associated pathology): 1811 (male, 55 years-old), 1821 (female, 68 years-old), 1822 (male, 64 years-old), 1823 (female, 62 years-old), one sample from an aged-matched healthy patient 3659 (male, 61 years-old), five samples from healthy patients with Alzheimer like lesions: 8730 (male, 82 years-old), 6283 (female, 83 years-old), 6658 (female, 93 years-old), 7024 (female, 76 years-old), 7197 (male, 85 years old). Samples from PD patients include: 3605 (male, 64 years-old), 4489 (male, 75 years-old), 4513 (female, 77 years-old), 5193 (male, 75 years-old), and 8460 (male, 66 years-old), 4291 (female, 72 years-old), 8418 (male, 82 years-old) and 7743 (male, 72 years-old). The last three cases of PD patients have Alzheimer-like lesions. The mean postmortem delay was 28.2 ± 15.3 h. The samples were homogenized and lysed as done for mice brain samples.
Primary cultured neurons (pharmacology, transfection and transduction)
Primary cultures of rat cortical neurons were performed as extensively described in [Citation77]. In brief, cortical neurons from rat pups (P0) (http://www.criver.com/products-services/basic-research/find-a-model/spraguedawley-rat) were obtained after trypsin dissociation. Cells were plated in polylysine-coated wells and maintained in serum-free neurobasal medium (Gibco, 12348–017) supplemented with B27 (Gibco, 17504044) and antibiotics (Thermo Fisher Scientific, 15070–063). Half of the medium was changed after 1 d in culture. Cells were used after 9 d in culture. Neuronal cultures were either submitted to ER stress by pharmacological treatments (see above) or transiently transfected with empty or Xbp1s cDNA or with scramble or Xbp1s shRNA expressing plasmids with lipofectamine according to manufacturer conditions. After treatment and transfection, cells were harvested and frozen at −80°C for subsequent determination of either proteins or mRNA levels and analysis of promoter activity.
Western blot (cells and mouse brains)
Mouse brains and cells were resuspended in lysis buffer (10 mM Tris-HCl, pH 7.5, containing a protease inhibitors cocktail and phosphatase inhibitors (1 mM sodium orthovanadate, 5 µM sodium fluoride) and then sonicated before western blot analysis. Expressions of proteins were analyzed with 50 µg of cell lines or mouse brain homogenates loaded on 10–12% sodium dodecyl sulfate polyacrylamide gel electrophoresis (SDS-PAGE) and semi-dry transferred for 10 min by means of the ready to use transfer kit nitrocellulose (Bio-Rad, 1704271) and the Trans-Blot® Turbo™ Transfer System (pre-programmed Bio-Rad protocol for 2 mini gels of 1.5 mm). Transferred proteins were then immunoblotted using the antibodies listed in . The full gels of PINK1 containing migration controls were provided for each cell and tissue type (first time appearance) to illustrate antibody specificity. Immunological complexes were revealed with adequate anti-rabbit or anti-mouse IgG-coupled peroxidase antibodies (Jackson ImmunoResearch, 111–036-045) by the electrochemiluminescence detection method (Roche Diagnostics S.A.S). Chemiluminescence was recorded using a luminescence image analyzer LAS-4000 (Raytest, Fuji) and quantifications of non-saturated images were performed with the FUJI Film Multi Gauge image analyzer software.
mRNA analysis (cells and mouse brains)
RNA from cells and mouse brains (one hemisphere per mouse was stabilized in RNAlater [RNA stabilization reagent] Qiagen, 76104) were extracted and treated with DNAse using RNeasy or RNeasy Plus Universal mini kits respectively following manufacturer’s instructions (Qiagen, 74106 and 73404, respectively). Two µg of total RNA were reverse transcribed (GoScript Reverse Transcriptase; Promega, A5002) using oligo-dT priming then samples were subjected to real-time PCR by means of a Rotor-Gene 6000 apparatus (Qiagen), using the SYBR Green detection protocol (Roche Life Science). Specific primers (Eurogentec) for human, mouse and rat PINK1/Pink1, XBP1s/Xbp1s and housekeeping genes were designed with the Universal Probe Library Assay Design Center software (Roche Applied Science) and are listed in Table S1.
Promoter activity
Mouse/human full-length and 5′ end-truncated Pink1/PINK1 promoter-luciferase constructs have been previously described [Citation51]. The transcriptional regulation of Pink1/PINK1 promoters was measured after co-transfection of 1 µg of the above cDNA and 1 µg of GLB1 (galactosidase beta) cDNA (in order to normalize for transfection efficiencies) by means of luciferase reporter gene and GLB1 kits according to the manufacturer’s instructions (Promega). In a subset of experiments, 1 µg of empty pcDNA3.1 or wild-type Xbp1s cDNA were co-transfected with 0.5 µg of GLB1 and 0.5 µg of Pink1 promoter cDNAs.
CASP3 activity measurement
SH-SY5Y cells overexpressing or not XBP1s were plated and grown in 6-well plates for 24 h and treated for 8 h without or with thapsigargin (1 µM). CASP3-like enzymatic activity was fluorimetrically recorded on a spectral scanning multimode reader (Varioscan, Thermo Fisher Scientific) as described in [Citation89].
Mitophagy flux analysis
pCLBW COX8-EGFP-mCherry plasmid was a kind gift from David Chan (Addgene, 78520 [Citation35]). Mitophagic flux was performed as described in [Citation35]. This probe allows the detection of mitophagy flux thanks to differences in pKa of enhanced green fluorescent protein (EGFP), and mCherry protein expressed in tandem with the mitochondrial localization signal of COX8. In neutral compartment (pH7) the probe fluoresces yellow (merge of green and red signals). During mitophagy, fragmented mitochondria are delivered to lysosomes where the low pH quenches the EGFP signal. The result is that a portion of mitochondria forms punctae structures and fluorescence is red only. Images of live cells were acquired 48 h post-transfection with Zeiss LSM 780 and 63X objective. The quantification was performed on different fields of view obtained in three independent experiments. Data show the percentage of cells undergoing mitophagy. A threshold of a single or more red-alone punctae per cell was applied to all cells expressing human COX8-EGFP-mCherry probe.
Mitochondrial potential disruption analysis
Mitochondrial membrane potential (Δψm) was accessed using live imaging analysis of TMRM probe, a fluorescent cation that distributes into the mitochondrial matrix of active mitochondria following the electrochemical gradient as detailed in [Citation25]. Cells spotted on 25 mm cover slips were loaded with 10 nM TMRM in cell culture medium at 37°C for 30 min. Images were acquired (excitation: 559 nm, emission: 575–675 nm) on a LEICA TCS SP5 confocal microscope (Leica Microsystems) at 37°C. To obtain normalized TMRM fluorescence signal, Z-stack images were acquired before and after application of the mitochondrial uncoupler carbonyl cyanide 4-(trifluoromethoxy) phenylhydrazone (FCCP, 5 mM, Sigma- Aldrich, C2920). To demonstrate specific TMRM binding, measurements were corrected for residual TMRM fluorescence after full Δψm collapse with FCCP [Citation90]. TMRM intensity was quantified on Z-stack maximal projection images after thresholding, using ImageJ software (NIH) [Citation91]. The TMRM signal was also analyzed using the NovocyteTM flow cytometer (ACEA Biosciences Inc.). TMRM was excited with the 543 nm laser line, and emission was performed at 600 ± 10 nm. SH-SY5Y neuroblastoma cells and primary cultured neurons were loaded for 30 min at 37°C with TMRM (5 nM). TMRM fluorescence from 10,000 cells was acquired and the median value was obtained using the NovoExpressTM software (ACEA Biosciences Inc.). Cellular gating was set the same way in all measurements. Unstained- and FCCP-treated cells were used as controls.
Phosphorylation in vitro
XBP1s phosphorylation by PINK1 was analyzed as described [Citation92]. In brief, recombinant XBP1s (1 µg) and ubiquitin (positive control, Boston Biochem, U100H, 1 µg) were incubated with recombinant WT PINK1 or PINK1D359A (Ubiquigent, 66–0043-050 and 66–0044-050 respectively, 1 µg) in a final volume of 20 µL of kinase assay buffer (20 mM HEPES [Sigma-Aldrich, H3375], pH 7.4, 10 mM dithiothreitol [DTT, Sigma Aldrich, 20–265], 0.1 mM EGTA [Sigma-Aldrich, E4378], 10 mM MgCl2, 1 mM ATP) for 2 h at 37°C. The reactions were terminated by addition of 5X SDS (Sigma-Aldrich, L3771) loading buffer (375 mM Tris, pH 6.8, 9% [w:v] SDS, 50% [v:v] glycerol [Prolabo VWR,24388.295] 9% [v:v] beta-mercaptoethanol [Sigma-Aldrich, M3148], 0.03% (w:v) bromophenol blue [SERVA, 15375]), incubated for 15 min at 56°C to prevent spontaneous ubiquitin dimers formation, then 200 ng of proteins were analyzed by western blot using phospho-specific XBP1s and ubiquitin antibodies as described in .
Cell fractionation
Cells were harvested, pelleted by centrifugation at 1,000 x g for 3 min at 4°C, lysed in 300 µl of homogenization buffer (20 mM HEPES pH 7.4, 1.5 mM MgCl2, 1 mM EDTA, 1 mM EGTA, 1 mM DTT, protease inhibitors cocktail) and homogenized with a syringe (Agani Terumo 26 G needles). Homogenates were left in ice during 15 min then centrifuged at 850 x g for 5 min at 4°C in order to recover the nuclear fraction (pellet). Pellets were homogenized in RIPA buffer (50 mM Tris pH 7.4 containing 150 mM NaCl, 1 mM EDTA, 1% Triton X-100 [Sigma-Aldrich, X100], 0.5% deoxycholate [Sigma-Aldrich, D6750], 0.1% SDS complemented with a cocktail of protease inhibitors) then sonicated twice for 15 s on ice. Supernatant was centrifuged at 20,000 x g for 1 h 30 min at 4°C to obtain the cytosolic fraction. Both nuclear and cytosolic fractions were submitted to western blot analysis. To isolate a crude mitochondrial fraction from cultured cells (one 6-well plate per condition), we removed the media, washed cells once with PBS, added 1 mL per well of 1X PBS (Euromedex, ET330-A), 5 mM EDTA. Detached cells were pelleted by centrifugation at 1,000 x g for 3 min at 4°C. After rinsing in PBS, another centrifugation was performed then pellets were resuspended and incubated for 15 min in isotonic buffer (250 mM mannitol [Sigma-Aldrich, M9647], 5 mM HEPES, 500 µM EGTA, 0.01 g BSA [Sigma-Aldrich, A9647]) supplemented with a protease inhibitors cocktail in ice. Swollen cells were manually disrupted with a Dounce homogenizer (hundred up and downs). Lysates were centrifuged at 1,000 x g for 5 min at 4°C. Supernatants were collected and centrifugated again at 1,000 x g for 5 min at 4°C. Supernatants were carefully collected and submitted to centrifugation for 10 min at 8000 x g at 4°C. The supernatants (containing the cytosolic fraction, plasma membrane, lysosomes and microsomes) and the mitochondrial pellets resuspended in 35 µL of isotonic buffer were both kept for further western blots analyses.
Electron microscopy
Electronic microscopy was performed as previously described [Citation93]. In brief, mice treated with toyocamycin or its vehicle received a lethal dose of a combination of ketamine (120 mg/kg) and xylasine (24 mg/kg) and transcardially perfused with ice-cold physiological saline followed by 2.5% glutaraldehyde, 0.1 M cacodylate buffer, pH 7.4. Brains were sliced (200 μm) on a vibratome and 2 mm cubes from the cortices were microdissected under binoculars and post-fixed in osmium tetroxide (1% in 0.1 M cacodylate buffer). The tissues were embedded in EPON resin (EMS, 14120) and 70 nm ultrathin sections were contrasted with uranyl acetate and lead citrate and visualized using a JEM 1400 electron microscope operating at 100 kV equipped with a Morada SIS camera. We analyzed mitochondrial area and perimeter by the software Image J (rsb.info.nih.gov/ij/).
In vivo studies
Wild-type mice purchased from Charles River were housed with a 12:12 h light/dark cycle and were given free access to food and water. All experimental procedures were in accordance with the European Communities Council Directive of 24 November 1986 (86/609/EEC) and local French legislation. Adult wild-type males (C57BL6) aged 2 months were used. Mice were intraperitoneally injected with either vehicle (0.03% DMSO, 0.02 M Na2HPO4, pH 7.4 buffer containing 150 mM dextrose [Sigma-Aldrich, D9434]) or tunicamycin (1 mg/kg; Merck, 504570) dissolved in the same vehicle [Citation94]. Mice were intraperitoneally injected with either vehicle (0.0125% DMSO, 0.02 M Na2HPO4 buffer containing 150 mM dextrose) or toyocamycin (1 mg/kg) dissolved in the same vehicle [Citation26]. Animals were sacrificed 72 h after injection. Mice brains were recovered and one hemisphere was immediately frozen for ulterior proteins analysis while the other was stabilized with RNAlater for mRNA analysis by real-time PCR.
Statistical analysis
Statistical analyses were performed with GraphPad Prism software (San Diego, California USA). The choice of parametric versus non-parametric test was established after assessment of the normality test (D’Agostino-Pearse omnibus Normality test) to assure Gaussian distribution of values. Two groups of variables that have passed the normality test were analyzed by unpaired Student’s t-test while two groups of variables that have not passed the normality test were analyzed by the Mann-Whitney test. Analysis of more than two groups of variables that have passed the normality test was performed by ordinary One-way ANOVA while analysis of more than two groups of variables that have not passed the normality test were analyzed by Kruskal-Wallis test. Grouped analysis of one or more groups was performed by two-way ANOVA followed by a Tukey’s multiple comparisons test. Data correlation analyses were performed by either Pearson or Sperman tests after the evaluation of the Gaussian distribution of values. All tests are two-sided; the mean was defined as the center value and error bars correspond to SEM. The number of samples, replication of experiments and the p values (stars) are provided in figure legends. Significant differences are: *p < 0.05, **p < 0.01, ***p < 0.001, ****p < 0.0001 and ns = non-significant.
Supplemental Material
Download Zip (15.4 MB)Acknowledgments
We wish to thank Drs. T. Kawarai and P. St-Georges Hyslop for providing PINK1 constructs. We sincerely thank Dr. B. de Strooper for providing us with PINK1-depleted cells and Dr. J.Shen for providing us control and PINK1 knockout mice brains. We thank the Neuro-CEB (Pitié-Salpêtrière Hospital) for providing us with human brain samples.
Supplemental material
Supplemental data for this article can be accessed here.
Disclosure statement
No potential conflict of interest was reported by the author(s).
Supplementary material
Supplemental data for this article can be accessed here
Additional information
Funding
Related Research Data
References
- Zeng XS, Geng WS, Jia JJ, et al. Cellular and molecular basis of neurodegeneration in Parkinson disease. Front Aging Neurosci. 2018;10:109.
- Cooper AA, Gitler AD, Cashikar A, et al. Alpha-synuclein blocks ER-Golgi traffic and Rab1 rescues neuron loss in Parkinson’s models. Science. 2006;313:324–328.
- Sugeno N, Takeda A, Hasegawa T, et al. Serine 129 phosphorylation of alpha-synuclein induces unfolded protein response-mediated cell death. J Biol Chem. 2008;283:23179–23188.
- Hetz C, Saxena S. ER stress and the unfolded protein response in neurodegeneration. Nat Rev Neurol. 2017;13:477.
- Alves da Costa C, Manaa WE, Duplan E, et al. The endoplasmic reticulum stress/unfolded protein response and their contributions to Parkinson’s disease physiopathology. Cells. 2020;9.
- Schroder M, Kaufman RJ. The mammalian unfolded protein response. Annu Rev Biochem. 2005;74:739–789.
- Kaufman RJ. Orchestrating the unfolded protein response in health and disease. J Clin Invest. 2002;110:1389–1398.
- Hoozemans JJ, Van Haastert ES, Eikelenboom P, et al. Activation of the unfolded protein response in Parkinson’s disease. Biochem Biophys Res Commun. 2007;354:707–711.
- Baek JH, Mamula D, Tingstam B, et al. GRP78 level is altered in the brain, but not in plasma or cerebrospinal fluid in Parkinson’s disease patients. Front Neurosci. 2019;13. DOI:https://doi.org/10.3389/fnins.2019.00697
- Esteves AR, Cardoso SM. Differential protein expression in diverse brain areas of Parkinson’s and Alzheimer’s disease patients. Sci Rep. 2020;10. DOI:https://doi.org/10.1038/s41598-020-70174-z
- Conn KJ, Gao W, McKee A, et al. Identification of the protein disulfide isomerase family member PDIp in experimental Parkinson’s disease and Lewy body pathology. Brain Res. 2004;1022:164–172.
- Ryu EJ, Harding HP, Angelastro JM, et al. Endoplasmic reticulum stress and the unfolded protein response in cellular models of Parkinson’s disease. J Neurosci. 2002;22:10690–10698.
- Holtz WA, O’Malley KL. Parkinsonian mimetics induce aspects of unfolded protein response in death of dopaminergic neurons. J Biol Chem. 2003;278:19367–19377.
- Hu LW, Yen JH, Shen YT, et al. Luteolin modulates 6-hydroxydopamine-induced transcriptional changes of stress response pathways in PC12 cells. Plos One. 2014;9. DOI:https://doi.org/10.1371/journal.pone.0097880
- Xiang C, Wang Y, Zhang H, et al. The role of endoplasmic reticulum stress in neurodegenerative disease. Apoptosis. 2017;22:1–26.
- Urano F, Bertolotti A, Ron D. IRE1 and efferent signaling from the endoplasmic reticulum. J Cell Sci. 2000;113(Pt 21):3697–3702.
- Yoshida H, Matsui T, Yamamoto A, et al. XBP1 mRNA is induced by ATF6 and spliced by IRE1 in response to ER stress to produce a highly active transcription factor. Cell. 2001;107:881–891.
- Dunys J, Duplan E, Checler F. The transcription factor X-box binding protein-1 in neurodegenerative diseases. Mol Neurodegener. 2014;9:35.
- Valdes P, Mercado G, Vidal RL, et al. Control of dopaminergic neuron survival by the unfolded protein response transcription factor XBP1. Proc Natl Acad Sci U S A. 2014;111:6804–6809.
- Sado M, Yamasaki Y, Iwanaga T, et al. Protective effect against Parkinson’s disease-related insults through the activation of XBP1. Brain Res. 2009;1257:16–24.
- Margariti A, Li H, Chen T, et al. XBP1 mRNA splicing triggers an autophagic response in endothelial cells through BECLIN-1 transcriptional activation. J Biol Chem. 2013;288:859–872.
- Kishino A, Hayashi K, Hidai C, et al. XBP1-FoxO1 interaction regulates ER stress-induced autophagy in auditory cells. Sci Rep. 2017;7:4442.
- Narendra DP, Jin SM, Tanaka A, et al. PINK1 is selectively stabilized on impaired mitochondria to activate Parkin. PLoS Biol. 2010;8:e1000298.
- Duplan E, Giaime E, Viotti J, et al. ER-stress-associated functional link between Parkin and DJ-1 via a transcriptional cascade involving the tumor suppressor p53 and the spliced X-box binding protein XBP-1. J Cell Sci. 2013;126:2124–2133.
- Goiran T, Duplan E, Chami M, et al. Beta-amyloid precursor protein intracellular domain controls mitochondrial function by modulating phosphatase and tensin homolog-induced kinase 1 transcription in cells and in Alzheimer mice models. Biol Psychiatry. 2018;83:416–427.
- Ri M, Tashiro E, Oikawa D, et al. Identification of Toyocamycin, an agent cytotoxic for multiple myeloma cells, as a potent inhibitor of ER stress-induced XBP1 mRNA splicing. Blood Cancer J. 2012;2:e79.
- Osada H, Sonoda T, Tsunoda K, et al. A new biological role of sangivamycin; inhibition of protein kinases. J Antibiot (Tokyo). 1989;42:102–106.
- Nishioka H, Sawa T, Hamada M, et al. Inhibition of phosphatidylinositol kinase by toyocamycin. J Antibiot (Tokyo). 1990;43:1586–1589.
- Osada H, Cui CB, Onose R, et al. Screening of cell cycle inhibitors from microbial metabolites by a bioassay using a mouse cdc2 mutant cell line, tsFT210. Bioorg Med Chem. 1997;5:193–203.
- Jin SM, Youle RJ. PINK1- and Parkin-mediated mitophagy at a glance. J Cell Sci. 2012;125:795–799.
- Nguyen TN, Padman BS, Lazarou M. Deciphering the molecular signals of PINK1/Parkin mitophagy. Trends Cell Biol. 2016;26:733–744.
- Cao Y, Klionsky DJ. Physiological functions of Atg6/Beclin 1: a unique autophagy-related protein. Cell Res. 2007;17:839–849.
- Klionsky D, Abdalla F, Abeliovich H, et al. Guidelines for the use and interpretation of assays for monitoring autophagy. Autophagy. 2012;8:445–544.
- Lazarou M, Sliter DA, Kane LA, et al. The ubiquitin kinase PINK1 recruits autophagy receptors to induce mitophagy. Nature. 2015;524:309–314.
- Rojansky R, Cha MY, Chan DC. Elimination of paternal mitochondria in mouse embryos occurs through autophagic degradation dependent on PARKIN and MUL1. Elife. 2016;5. DOI:https://doi.org/10.7554/eLife.17896
- Lee J, Sun C, Zhou Y, et al. p38 MAPK-mediated regulation of Xbp1s is crucial for glucose homeostasis. Nat Med. 2011;17:1251–1260.
- Jiao F-J, Wang Q-Z, Zhang P, et al. CDK5-mediated phosphorylation of XBP1s contributes to its nuclear translocation and activation in MPP+-induced Parkinson’s disease model. Sci Rep. 2017;7. DOI:https://doi.org/10.1038/s41598-017-06012-6.
- Petit A, Kawarai T, Paitel E, et al. Wild-type PINK1 prevents basal and induced neuronal apoptosis, a protective effect abrogated by Parkinson disease-related mutations. J Biol Chem. 2005;280:34025–34032.
- Kane LA, Lazarou M, Fogel AI, et al. PINK1 phosphorylates ubiquitin to activate Parkin E3 ubiquitin ligase activity. J Cell Biol. 2014;205:143–153.
- Lee AH, Iwakoshi NN, Glimcher LH. XBP-1 regulates a subset of endoplasmic reticulum resident chaperone genes in the unfolded protein response. Mol Cell Biol. 2003;23:7448–7459.
- Giaime E, Sunyach C, Druon C, et al. Loss of function of DJ-1 triggered by Parkinson’s disease-associated mutation is due to proteolytic resistance to caspase-6. Cell Death Differ. 2010;17:158–169.
- Ryo A, Togo T, Nakai T, et al. Prolyl-isomerase Pin1 accumulates in lewy bodies of parkinson disease and facilitates formation of alpha-synuclein inclusions. J Biol Chem. 2006;281:4117–4125.
- Roberts HL, Brown DR. Seeking a mechanism for the toxicity of oligomeric alpha-synuclein. Biomolecules. 2015;5:282–305.
- Alam P, Bousset L, Melki R, et al. alpha-synuclein oligomers and fibrils: a spectrum of species, a spectrum of toxicities. J Neurochem. 2019;150:522–534.
- Valente EM, Abou-Sleiman PM, Caputo V, et al. Hereditary early-onset Parkinson’s disease caused by mutations in PINK1. Science. 2004;304:1158–1160.
- Shimura H, Hattori N, Kubo S, et al. Familial Parkinson disease gene product, parkin, is a ubiquitin-protein ligase. Nat Genet. 2000;25:302–305.
- da Costa C, Sunyach C, Giaime E, et al. Transcriptional repression of p53 by parkin and impairment by mutations associated with autosomal recessive juvenile Parkinson’s disease. Nat Cell Biol. 2009;11:1370–1375.
- Alves da Costa C. The transcription factor function of parkin: breaking the dogma. Front Neurosci. 2018;12:965.
- Narendra D, Tanaka A, Suen DF, et al. Parkin is recruited selectively to impaired mitochondria and promotes their autophagy. J Cell Biol. 2008;183:795–803.
- Jiang HY, Wek SA, McGrath BC, et al. Activating transcription factor 3 is integral to the eukaryotic initiation factor 2 kinase stress response. Mol Cell Biol. 2004;24:1365–1377.
- Mei Y, Zhang Y, Yamamoto K, et al. FOXO3a-dependent regulation of Pink1 (Park6) mediates survival signaling in response to cytokine deprivation. Proc Natl Acad Sci U S A. 2009;106:5153–5158.
- Goiran T, Duplan E, Rouland L, et al. Nuclear p53-mediated repression of autophagy involves PINK1 transcriptional down-regulation. Cell Death Differ. 2018;25:873–884.
- Duan X, Tong J, Xu Q, et al. Upregulation of human PINK1 gene expression by NFkappaB signalling. Mol Brain. 2014;7:57.
- Murata H, Takamatsu H, Liu S, et al. NRF2 regulates PINK1 expression under oxidative stress conditions. PLoS One. 2015;10:e0142438.
- Bueno M, Brands J, Voltz L, et al. ATF3 represses PINK1 gene transcription in lung epithelial cells to control mitochondrial homeostasis. Aging Cell. 2018;17. DOI:https://doi.org/10.1111/acel.12720.
- Li L, Hu GK. Pink1 protects cortical neurons from thapsigargin-induced oxidative stress and neuronal apoptosis. Biosci Rep. 2015;35. DOI:https://doi.org/10.1042/BSR20140104
- Muqit MM, Abou-Sleiman PM, Saurin AT, et al. Altered cleavage and localization of PINK1 to aggresomes in the presence of proteasomal stress. J Neurochem. 2006;98:156–169.
- Gandhi S, Muqit MM, Stanyer L, et al. PINK1 protein in normal human brain and Parkinson’s disease. Brain. 2006;129:1720–1731.
- Xu P, Das M, Reilly J, et al. JNK regulates FoxO-dependent autophagy in neurons. Genes Dev. 2011;25:310–322.
- Heo JM, Ordureau A, Paulo JA, et al. The PINK1-PARKIN mitochondrial ubiquitylation pathway drives a program of OPTN/NDP52 recruitment and TBK1 activation to promote mitophagy. Mol Cell. 2015;60:7–20.
- Jin SM, Youle RJ. The accumulation of misfolded proteins in the mitochondrial matrix is sensed by PINK1 to induce PARK2/Parkin-mediated mitophagy of polarized mitochondria. Autophagy. 2013;9:1750–1757.
- Wang HL, Chou AH, Wu AS, et al. PARK6 PINK1 mutants are defective in maintaining mitochondrial membrane potential and inhibiting ROS formation of substantia nigra dopaminergic neurons. Biochim Biophys Acta. 2011;1812:674–684.
- Zhao Y, Li X, Cai MY, et al. XBP-1u suppresses autophagy by promoting the degradation of FoxO1 in cancer cells. Cell Res. 2013;23:491–507.
- Zhou Y, Lee J, Reno C, et al. Regulation of glucose homeostasis through a XBP-1-FoxO1 interaction. Nat Med. 2011;17:356–365.
- Zhao Y, Yang J, Liao W, et al. Cytosolic FoxO1 is essential for the induction of autophagy and tumour suppressor activity. Nat Cell Biol. 2010;12:665–675.
- Hetz C, Thielen P, Matus S, et al. XBP-1 deficiency in the nervous system protects against amyotrophic lateral sclerosis by increasing autophagy. Genes Dev. 2009;23:2294–2306.
- Pridgeon JW, Olzmann JA, Chin LS, et al. PINK1 protects against oxidative stress by phosphorylating mitochondrial chaperone TRAP1. PLoS Biol. 2007;5:e172.
- Plun-Favreau H, Klupsch K, Moisoi N, et al. The mitochondrial protease HtrA2 is regulated by Parkinson’s disease-associated kinase PINK1. Nat Cell Biol. 2007;9:1243–1252.
- Kim Y, Park J, Kim S, et al. PINK1 controls mitochondrial localization of Parkin through direct phosphorylation. Biochem Biophys Res Commun. 2008;377:975–980.
- Hughes D, Mallucci GR. The unfolded protein response in neurodegenerative disorders - therapeutic modulation of the PERK pathway. Febs J. 2019;286:342–355.
- He J, Zhong W, Zhang M, et al. P38 mitogen-activated protein kinase and Parkinson’s disease. Transl Neurosci. 2018;9:147–153.
- Cheung ZH, Ip NY. Cdk5: a multifaceted kinase in neurodegenerative diseases. Trends Cell Biol. 2012;22:169–175.
- Levine B, Abrams J. p53: the Janus of autophagy? Nat Cell Biol. 2008;10:637–639.
- Maiuri MC, Zalckvar E, Kimchi A, et al. Self-eating and self-killing: crosstalk between autophagy and apoptosis. Nat Rev Mol Cell Biol. 2007;8:741–752.
- Hara T, Nakamura K, Matsui M, et al. Suppression of basal autophagy in neural cells causes neurodegenerative disease in mice. Nature. 2006;441(7095):885–889. .
- Komatsu M, Waguri S, Chiba T, et al. Loss of autophagy in the central nervous system causes neurodegeneration in mice. Nature. 2006;441(7095):880–884. .
- Cisse M, Duplan E, Lorivel T, et al. The transcription factor XBP1s restores hippocampal synaptic plasticity and memory by control of the Kalirin-7 pathway in Alzheimer model. Mol Psychiatry. 2017;22:1562–1575.
- Checler F. Processing of the β-amyloid precursor protein and its regulation in Alzheimer’s disease. J Neurochem. 1995;65(4):1431–1444.
- Gerakis Y, Dunys J, Bauer C, et al. Abeta42 oligomers modulate beta-secretase through an XBP-1s-dependent pathway involving HRD1. Sci Rep. 2016;6:37436.
- Adams CJ, Kopp MC, Larburu N, et al. Structure and molecular mechanism of ER stress signaling by the unfolded protein response signal activator IRE1. Front Mol Biosci. 2019;6:11.
- Sha H, He Y, Chen H, et al. The IRE1alpha-XBP1 pathway of the unfolded protein response is required for adipogenesis. Cell Metab. 2009;9:556–564.
- Lois C, Hong EJ, Pease S, et al. Germline transmission and tissue-specific expression of transgenes delivered by lentiviral vectors. Science. 2002;295:868–872.
- Lee A-H, Iwakoshi NN, Anderson KC, et al. Proteasome inhibitors disrupt the unfolded protein response in myeloma cells. Proc Natl Acad Sci USA. 2003;100:9946–9951.
- Uphoff CC, Drexler HG. Detecting mycoplasma contamination in cell cultures by polymerase chain reaction. Methods Mol Med. 2004;88:319–326.
- Morais VA, Haddad D, Craessaerts K, et al. PINK1 loss-of-function mutations affect mitochondrial complex I activity via NdufA10 ubiquinone uncoupling. Science. 2014;344:203–207.
- Presgraves SP, Borwege S, Millan MJ, et al. Involvement of dopamine D(2)/D(3) receptors and BDNF in the neuroprotective effects of S32504 and pramipexole against 1-methyl-4-phenylpyridinium in terminally differentiated SH-SY5Y cells. Exp Neurol. 2004;190:157–170.
- Roberts RF, Wade-Martins R, Alegre-Abarrategui J. Direct visualization of alpha-synuclein oligomers reveals previously undetected pathology in Parkinson’s disease brain. Brain. 2015;138:1642–1657.
- Kitada T, Pisani A, Porter DR, et al. From the Cover: impaired dopamine release and synaptic plasticity in the striatum of PINK1-deficient mice. Proc Natl Acad Sci U S A. 2007;104:11441–11446.
- Da Costa C, Ancolio K, Checler F. Wild-type but not Parkinson’s disease-related ala-53 –> Thr mutant alpha -synuclein protects neuronal cells from apoptotic stimuli. J Biol Chem. 2000;275:24065–24069.
- Duchen MR, Surin A, Jacobson J. Imaging mitochondrial function in intact cells. Methods Enzymol. 2003;361:353–389.
- Chami M, Prandini A, Campanella M, et al. Bcl-2 and Bax exert opposing effects on Ca2+ signaling, which do not depend on their putative pore-forming region. J Biol Chem. 2004;279:54581–54589.
- Fiesel FC, Hudec R, Springer W. Non-radioactive in vitro PINK1 kinase assays using ubiquitin or Parkin as substrate. Biol Protoc. 2016;6. DOI:https://doi.org/10.21769/BioProtoc.1946
- Lauritzen I, Pardossi-Piquard R, Bourgeois A, et al. Intraneuronal aggregation of the beta-CTF fragment of APP (C99) induces Abeta-independent lysosomal-autophagic pathology. Acta Neuropathol. 2016;132:257–276.
- Lee JS, Zheng Z, Mendez R, et al. Pharmacologic ER stress induces non-alcoholic steatohepatitis in an animal model. Toxicol Lett. 2012;211:29–38.