
ABSTRACT
Aberrant chaperone-mediated autophagy (CMA) activation has been suggested as a tumorigenesis-promoting event in various cancers, although its roles in prostate cancer (PCa) remain elusive. Emerging evidence indicates that TPD52 isoform 1, a prostate-specific and androgen-responsive gene, contributes to the malignant progression of PCa. Here, we demonstrate that TPD52 enhances CMA activation by interacting with HSPA8/HSC70 and enhancing substrate degradation in PCa. Elevation of TPD52 is essential for CMA-induced PCa cell proliferation and stress resistance in vitro and in vivo. Furthermore, TPD52 is acetylated by KAT2B at K163, which is a process that can be antagonized by HDAC2. Inactivation of HDAC2 results in elevated TPD52 acetylation, which compromises the interaction between TPD52 and HSPA8, leading to impaired CMA function and tumor growth in vivo. Taken together, our findings reveal that acetylation-dependent regulation of TPD52 modulates CMA oncogenic function in PCa, thereby suggesting the possibility of targeting the TPD52-mediated CMA pathway to control the progression of PCa.
Abbreviations: CMA: chaperone-mediated autophagy; HDAC2: histone deacetylase 2; HSPA8/HSC70: heat shock protein family A (Hsp70) member 8; KAT2B: lysine acetyltransferase 2B; LAMP2A: lysosomal associated membrane protein 2A; PCa: prostate cancer; TPD52: tumor protein D52
Introduction
Chaperone-mediated autophagy (CMA) acts as a conserved physiological phenomenon in the process of self-digesting intracellular soluble proteins in lysosomes. This process includes the specific interaction of HSPA8/HSC70 (heat shock protein family A (Hsp70) member 8) with substrate proteins that contain a KFERQ-like motif and the subsequent targeting to a multimeric protein complex mainly composed of LAMP2A (lysosomal associated membrane protein 2A) on lysosomes, which leads to substrate degradation [Citation1,Citation2]. The lysosomal expression level of LAMP2A, which is a rate-limiting step in CMA, is predominantly regulated by its protein stability [Citation3]. Recently, accumulating evidence has revealed the connection between CMA and cancer biology. Studies have confirmed that LAMP2A is elevated in a variety of human cancers, and genetically knocking down LAMP2A in cancer cells leads to the inhibition of cell proliferation and tumor growth [Citation4–8]. Multiple cancer cell-regulating signaling pathways, such as RARA (retinoic acid receptor alpha) signaling and MTORC2-PHLPP1-AKT signaling pathways, have been shown to regulate CMA [Citation9,Citation10]. These findings suggest a tumorigenesis-promoting role of CMA in cancer cells; however, whether activation of CMA contributes to prostate cancer (PCa) and the in-depth mechanism by which CMA is molecularly controlled have remained largely unaddressed.
TPD52 isoform 1, a member of the TPD52 (tumor protein D52) family, is frequently amplified in PCa tumors and is associated with unfavorable outcomes [Citation11]. Evidence from our studies and those of others has demonstrated that TPD52 is a prostate-specific and androgen-responsive gene that promotes PCa progression through multiple mechanisms [Citation12–14]. TPD52 protects PCa cells from androgen deprivation-induced apoptosis and plays a vital role in promoting PCa cell proliferation at the castration-resistant stage by mediating androgen receptor transactivation [Citation15]. Recently, we found that TPD52 induced docetaxel resistance in PCa cells by inhibiting STK11/LKB1-AMPK-mediated macroautophagy, suggesting a connection between TPD52 and the autophagic signaling pathway [Citation16]. However, little is known about the link between TPD52 and CMA.
Acetylation, a broadly prevalent posttranscriptional modification, plays key roles in regulating protein functions, including altering the localization, stability, activity, and physical interactions of the target proteins [Citation17,Citation18]. In the current study, we demonstrated that TPD52 facilitated the augmentation of CMA, which was regulated by TPD52 lysine acetylation. In addition, elevated expression of LAMP2A is required for TPD52-enhanced CMA activation and PCa cell proliferation in vitro and in vivo. Mechanistically, TPD52 physically interacts with HSPA8 and facilitates the binding between HSPA8 and CMA substrates, which is negatively regulated by TPD52 acetylation at lysine 163. Thus, our findings revealed the acetylation-dependent TPD52/HSPA8 interaction-mediated activation of CMA, suggesting that this pathway may be targeted as a novel anti-tumor therapy for PCa.
Results
TPD52 participates in the activation of CMA in PCa
To identify the proteins that potentially interact with and molecular functions of TPD52, a co-immunoprecipitation mass spectrometry (Co-IP-MS) assay was performed in our study (). A total of 808 proteins were found to interact with TPD52. Enrichment analysis led to the identification of proteins that were enriched in 10 biological pathways, among which the maximum number of enriched proteins were in the “protein targeting” category (). Further GO enrichment analysis demonstrated that TPD52 was associated with the CMA pathway (Figure S1A), and key CMA components HSPA8 and LAMP2 were among CMA-related proteins (). These data suggest that TPD52 might be involved in the CMA process in PCa.
Figure 1. TPD52 participates in the activation of CMA. (A) Anti-FLAG immunoprecipitates (IPs) coupled with mass spectrometry analysis (MS) to identify TPD52-interacting proteins in C4-2 cells. (B) IP-MS results were subjected to enrichment analysis. (C) The proteins were enriched in the “protein targeting” and “CMA” categories. (D-F) Endogenous TPD52 was increased after CMA activation. Immunoblot (IB) analysis of whole-cell lysates (WCLs) derived from C4-2 cells or TPD52-overexpressing PC3 cells treated with AR7 at the indicated concentration for 12 h (D), serum starved (S.S.) for 36 h and 48 h (E) or 6-AN at the indicated concentration for 24 h (F). (G) Endogenous TPD52 was increased after CMA activation in prostate tissues from BALB/c mice. IB analysis of WCLs derived from prostate tissues in the mice subjected to starvation or treated with a vehicle for 48 h. (H) Endogenous TPD52 was increased after CMA activation in the C4-2 xenograft tumors in the BALB/c nude mice. IB analysis of the WCLs derived from the C4-2 cell-implanted tumors in the BALB/c nude mice subjected to starvation or treated with a vehicle for 48 h
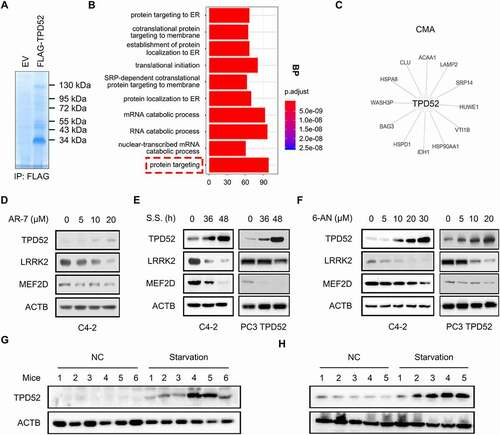
To determine the role of TPD52 in CMA in PCa, three classic CMA activation treatments, 7-chloro-3-(4-methylphenyl)-2 H-1,4-benzoxazine (AR-7) [Citation9], serum starvation (S.S.) [Citation19] and 6-aminonicotinamide (6-AN) [Citation20] were used as the model systems in PCa cells. Changes in CMA activity may be determined by measuring the abundance of CMA substrates, such as MEF2D [Citation21], LRRK2 [Citation22] and GAPDH [Citation23]. Interestingly, CMA activation increased the expression of TPD52, and decreased protein levels of MEF2D and LRRK2 ( and Figure S1B-G). Consistent with this finding, the in vivo experimental data showed that starvation for 48 h resulted in elevated TPD52 protein levels in both prostate tissues from BALB/c mice () and C4-2 PCa xenografts from nude mice (). Collectively, these results demonstrate that TPD52 participates in the activation of CMA in vitro and in vivo.
We then aimed to explore the possible mechanism leading to the upregulation of TPD52 when CMA was activated. As shown in Figure S1H–J, either serum starvation or 6-AN-induced CMA activation had little effects on the degradation and ubiquitination of TPD52 in C4-2 cells. However, the mRNA level of TPD52 was increased after serum starvation for 36 h and 48 h or 6-AN treatment as determined by qRT-PCR (Figure S1K and L). These observations indicated that TPD52 might be transcriptionally regulated in CMA activation.
Identification of TPD52 as an activator of CMA
We next aimed to investigate the regulatory role of TPD52 in CMA. Knocking down or knocking out of TPD52 increased the protein expression of CMA substrates, while overexpressing exogenous TPD52 decreased the levels of the CMA substrates ( and ). More importantly, an increase in fluorescent PAmCherry-KFERQ puncta was observed in TPD52-overexpressing PC3 cells compared with vector control cells (Figure S2A and B). However, no significant change in the protein level of HSPA8 or LAMP1 was observed (Figure S3A). Meanwhile, no change in the mRNA level of LAMP2A or LAMP1 was detected (Figure S3B).
Figure 2. Identification of TPD52 as an activator of CMA. (A) IB analysis of the whole-cell lysates (WCLs) derived from TPD52-knockdown C4-2 cells generated using shRNA and TPD52-knockout C4-2 cells generated using sgRNA. (B) IB analysis of the WCLs derived from TPD52-overexpressing PC3 and LNCaP cells. (C) Native continuous gel electrophoresis and IB analysis of the lysosomes purified from PC3 cells transfected with vector (Vec) or TPD52. (D) IB analysis of the WCLs and lysosomal LAMP2A purified from TPD52-overexpressing PC3 cells and TPD52-knockdown C4-2 cells. (E–F) Binding, association and uptake of proteins by the lysosomes were calculated from the quantification of the CMA substrates RNASE A and GAPDH, based on the IB analysis of the lysosomes from TPD52-overexpressing PC3 cells that were either untreated or pretreated with protease inhibitors (PI). Representative immunoblots (E) and the densitometric quantification of two or three immunoblots from different experiments (F) are shown. Error bars represent SE. *P < 0.05 and **P < 0.01. (G) IB analysis of the WCLs derived from wild-type (WT) or tpd52-knockout (KO) mouse prostate tissues. (H) IB analysis of the WCLs derived from TPD52-overexpressing PC3 cells transfected with or without LAMP2A shRNA (shLAMP2A). (I) IB analysis of the WCLs derived from TPD52-knockdown C4-2 cells transfected with or without the LAMP2A plasmid
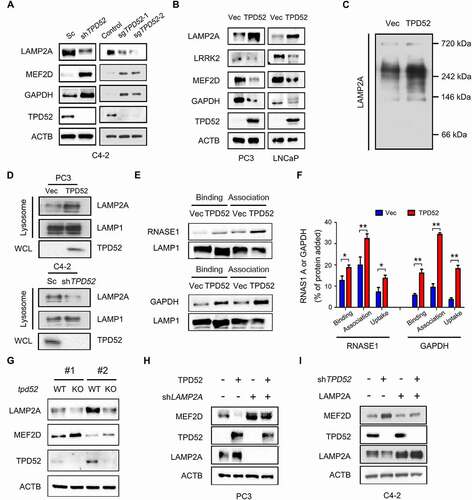
Early studies showed that CMA substrates bind with the cytosolic tail of the LAMP2A monomer and drive its multimerization to form complexes at the lysosomal membrane [Citation24,Citation24]. Our results demonstrated that TPD52 promotes the multimerization of LAMP2A in PCa cells, as determined by native gel electrophoresis assay (). The amount of LAMP2A at the lysosomal membrane is considered to be a rate-limiting step in CMA process [Citation3,Citation25]. Therefore, we also determined the effects of TPD52 on the expression of lysosomal LAMP2A using subcellular fraction analyses. Compared to those of the control, the results showed an elevated expression of LAMP2A in the lysosome fraction after TPD52 was overexpressed, while knocking down TPD52 led to the downregulation of lysosomal LAMP2A ( and Figure S3C). We then examined the change in CMA activity in TPD52-overexpressing PC3 cells using lysosomal binding and uptake assays. The results revealed that TPD52 promoted the binding and uptake of RNASE1 and GAPDH by lysosomes, which suggested that TPD52 directly activated CMA ( and ).
Next we intended to explore the regulatory mechanism of TPD52 on LAMP2A and CMA substrates. As shown in Figure S3D–F, knocking down of TPD52 increased the degradation of LAMP2A and decreased the degradation of MEF2D in C4-2 cells. Moreover, no significant changes in the mRNA levels of MEF2D, LRRK2 and GAPDH were observed after knocking down TPD52 (Figure S3G). It has been reported that CTSA/PPCA could regulate CMA through cleavage of LAMP2A [Citation26]. Furthermore, TFEB, FOXO1 and FOXO3 were key transcriptional regulators of autophagy and lysosomal biogenesis [Citation27]. However, no changes of CTSA/PPCA, TFEB, FOXO1 and FOXO3 protein levels were observed after overexpressing or knocking down TPD52 (Figure S3H). Further studies are needed to identify the specific molecular mechanisms.
To confirm the roles of TPD52 in CMA in vivo, we generated a mouse model in which Tpd52 was genetically knocked out (KO). The results showed downregulation of LAMP2A and upregulation of MEF2D in the prostate tissues from mice with tpd52 KO (). However, we failed to observe the change of Lamp2a mRNA levels in tpd52 KO mice (Figure S3I). Moreover, TPD52-dependent regulation of MEF2D was largely blocked by knocking down or overexpressing exogenous LAMP2A in cells ( and I). Similarly, TPD52-dependent regulation of MEF2D was also blocked in the presence of CQ (Figure S3J and K). Furthermore, exogenous overexpression of TPD52 potentiated the 6-AN-induced decrease in MEF2D (Figure S3L), while genetically knocking down TPD52 partially reversed the decrease in the CMA substrate that had been induced by 6-AN (Figure S3M).
Furthermore, TPD52 was confirmed to promote the proliferation of PCa PC3 xenograft tumors (Figure S4A–C), as determined by measuring tumor volume (Figure S4A) and tumor weight (Figure S4C). Importantly, the protein levels of MEF2D and LRRK2 were decreased, while the level of LAMP2A was increased in these TPD52-overexpressed xenograft tumors (Figure S4D and E). Taken together, these results indicate that TPD52 is a vital enhancer of CMA activity in PCa.
TPD52-mediated CMA promotes PCa tumorigenesis through LAMP2A
Since LAMP2A is the key component of the CMA pathway and its role in PCa had been unexplored, we first evaluated the expression of LAMP2A in a PCa tissue microarray (). Compared with that of adjacent tissues, LAMP2A expression was upregulated in the PCa tissues (, P < 0.05). We then found elevated expression of LAMP2A in the prostate tissues in TRAMP mice (), indicating that LAMP2A may be a pro-oncogenic factor in PCa. More importantly, knocking down LAMP2A in PCa cells resulted in the inhibition of both C4-2 xenograft tumor volume and weight (Figure S5A–C). Interestingly, we failed to find a change in cell proliferation in vitro when LAMP2A levels were manipulated (Figure S5D and E), except for the cells subjected to serum starvation (Figure S5F). Moreover, the overexpression of exogenous LAMP2A partially rescued PC3 cells from serum starvation-mediated inhibition of colony formation (Figure S5G).
Figure 3. TPD52-mediated CMA promotes PCa tumorigenesis through LAMP2A. (A–B) Representative images (A) and histogram of the quantified (B) LAMP2A cells stained for immunohistochemical analysis of PCa tissues paired with adjacent normal tissues (n = 45 per group). Scale bars: 200 μm (black); 50 μm (red). *P˂0.05. (C) IB analysis of the whole-cell lysates (WCLs) derived from the prostate tissues of the TRAMP and wild-type (WT) mice. (D–F) PC3 cells stably expressing scramble (Sc) or shLAMP2A in cells overexpressing vector (Vec) or TPD52 were subcutaneously injected into nude mice. (D) Statistical analysis of the tumor volume, which was measured every three days and plotted individually. (E) Subcutaneous xenograft tumors formed from different groups of PC3 cells were dissected. (F) Statistical analysis of the weight of the dissected xenograft tumors; n = 10 mice per experimental group, and the results are presented as the means ± S.D. *P˂0.05, **P˂0.01. (G) IB analysis of the WCLs derived from the subcutaneous xenograft tumors. (H) Representative images of immunohistochemical photomicrographs (left) and quantitative results (right) of MEF2D protein expression in the PCa tissues. Scale bars: 10 μm (red). The results indicate the mean ± S.D. **P˂0.01
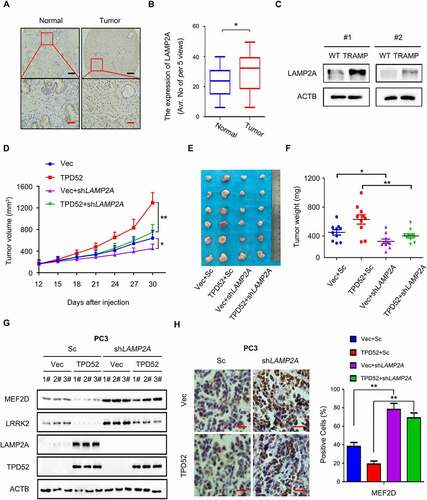
We next sought to determine whether the role of LAMP2A in PCa was manipulated by TPD52 in vivo. Notably, TPD52-mediated stimulation of PC3 xenograft tumor proliferation was partially abolished by knocking down LAMP2A (–F). Further data from western blotting and immunohistochemical staining of the tumor tissues confirmed the downregulation of the CMA substrates MEF2D and LRRK2 in TPD52-overexpressing xenograft tumors, while LAMP2A knockdown partially reversed these effects ( and H). Overall, the findings reveal that TPD52-enhanced CMA and cell proliferation in PCa depend on LAMP2A mediation.
The interaction of TPD52 with HSPA8 facilitates the activation of CMA
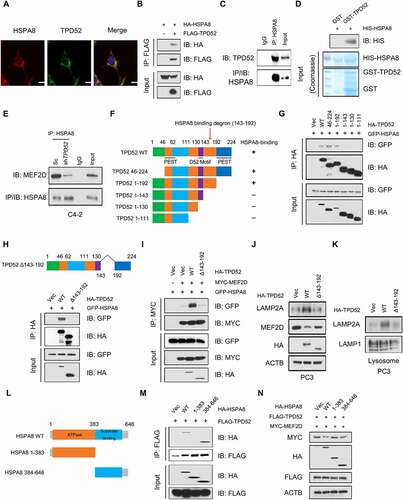
We next dissected the molecular mechanisms by which TPD52 modulates CMA activation. The IP-MS data showed the potential interaction between TPD52 and HSPA8, and we observed cellular colocalization of TPD52 and HSPA8 in C4-2 cells, as determined by immunofluorescence staining (). Coimmunoprecipitation (Co-IP) assays also confirmed that both endogenous and exogenous TPD52 and HSPA8 mutually interact with each other ( and C, Figure S6A–C). Furthermore, a direct interaction between HSPA8 and TPD52 was demonstrated by a GST affinity-isolation assay (). As TPD52 isoform 1 belongs to tumor protein D52 (TPD52) family, sharing different N-terminal domain with TPD52 isoform 3, we further found that TPD52 isoform 3 and HSPA8 also interact with each other (Figure S6D). However, knocking down TPD52 isoform 3 had no effect on LAMP2A, MEF2D and LRRK2 proteins level, suggesting that TPD52 isoform 1 and TPD52 isoform 3 might function differently in PCa (Figure S6E). It has been demonstrated that assembly and disassembly of CMA translocation complex is respectively mediated by HSP90 and HSPA8 chaperones [Citation28]. We then confirmed that TPD52 could indirectly interacted with HSP90 by Co-IP and GST affinity-isolation assay (Figure S6F–H). Further studies are needed to identify the exact role of HSP90 in regulating TPD52-mediated modulation of CMA pathway.
Figure 4. Interaction of TPD52 with HSPA8 facilitates the activation of CMA. (A) Representative image and fluorescence photomicrographs of TPD52 and HSPA8 in C4-2 cells obtained via confocal microscopy. Scale bars represent 10 μm. (B) IB analysis of the whole-cell lysates (WCLs) and anti-FLAG IPs derived from the 293 T cells transfected with FLAG-TPD52 and HA-HSPA8. (C) IB analysis of the WCLs and anti-HSPA8 IPs derived from C4-2 cells. Immunoglobulin G (IgG) served as a negative control. (D) GST affinity-isolation assay revealed the direct interaction between TPD52 and HSPA8. The upper panel presents the IB results using the antibody against HIS, and the lower Coomassie blue stained gels show the purified proteins. (E) IB analysis of the WCLs and anti-HSPA8 IPs derived from TPD52-knockdown (shTPD52) and scramble (Sc) C4-2 cells. Immunoglobulin G (IgG) served as a negative control. (F) A schematic of the TPD52 structural domains used for mapping the sites of HSPA8 interaction. (G) IB analysis of the WCLs and anti-HA IPs derived from the 293 T cells transfected with GFP-HSPA8 and the indicated constructs of HA-TPD52. (H) IB analysis of the WCLs and anti-HA IPs derived from the 293 T cells transfected with GFP-HSPA8 and the indicated constructs of HA-TPD52. (I) IB analysis of the WCLs and anti-MYC IPs derived from 293 T cells transfected with GFP-HSPA8, MYC-MEF2D and the indicated constructs of HA-TPD52. (J) IB analysis of the WCLs derived from the PC3 cells transfected with the indicated constructs of HA-TPD52. (K) IB analysis of lysosomal LAMP2A purified from the PC3 cells transfected with the indicated constructs of HA-TPD52. (L) A schematic for the HSPA8 structural domains used for mapping the sites of interaction with TPD52. (M) IB analysis of the WCLs and anti-FLAG IPs derived from the 293 T cells transfected with FLAG-TPD52 and the indicated constructs of HA-HSPA8. (N) IB analysis of the WCLs derived from the 293 T cells transfected with MYC-MEF2D, FLAG-TPD52 and the indicated constructs of HA-HSPA8
Previous studies showed that the key step for selective protein cargo delivery to lysosomes in the CMA pathway is the interaction between the substrate and HSPA8, which depends on the recognition of the KFERQ or KFERQ-like motif [Citation29]. However, we failed to observe the presence of TPD52 at the lysosomes (Figure S6I). Our results also revealed that there was no change in TPD52 expression after treatment with the lysosome inhibitor chloroquine (CQ) (Figure S7A). Consistently, the manipulation of either HSPA8 or LAMP2A (Figure S7B–D) had no mediating effect on the protein level of TPD52.
HSPA8 recognizes and binds to a CMA protein substrate and traffics it to LAMP2A on lysosomes during CMA [Citation30,Citation31]. We found that TPD52 facilitated the binding of CMA substrates and HSPA8 (, Figure S6E and F), suggesting that the binding of TPD52 to HSPA8 may enhance the binding of HSPA8 to CMA substrates. To gain further insights into how TPD52 regulates HSPA8 activity, we thoroughly investigated the specific regions of TPD52 that interact with HSPA8. The Co-IP results showed that HSPA8 specifically interacted with the region between amino acids 143 and 192 in TPD52 ( and G). As expected, the deletion of the identified region (143–192 amino acids) led to the disruption of the interaction between HSPA8 and TPD52 (). Additionally, compared with full-length TPD52, the Δ143-192 truncated TPD52 mutant was largely deficient in activating CMA in vitro (–K). Taken together, these results indicate that TPD52 facilitates CMA by directly interacting with HSPA8 and this interaction requires the TPD52 143–192 amino acid domain.
HSPA8 contains a C-terminal protein substrate-binding domain (SBD) and a conserved N-terminal ATP-binding domain called the nucleotide-binding domain (NBD) [Citation32]. We next examined the specific domain of HSPA8 that interacts with TPD52. We found that HSPA8 interacted with TPD52 via the SBD, as determined by a Co-IP assay ( and ). Additionally, cotransfection of TPD52 and full-length HSPA8 resulted in a decrease in MEF2D compared with that resulting from the transfection of only TPD52. Interestingly, neither NBD nor SBD had effects on the expression of MEF2D, suggesting that both the NBD and the SBD of HSPA8 are required for the TPD52-mediated activation of CMA ().
TPD52 is acetylated by KAT2B and deacetylated by HDAC2
To determine the physiological upstream regulation of TPD52-mediated CMA in PCa, we assayed the interaction of TPD52 and HSPA8 by utilizing several posttranslational modification (PTM) inhibitors. The results revealed that the deacetylation inhibitor nicotinamide (NAM) plus trichostatin A (TSA), but not the other treatments, compromised the interaction between HSPA8 and TPD52 ( and ). Further studies showed that TPD52 was indeed acetylated in PCa C4-2 cells (). In addition, lysine acetylation is a reversible PTM typically controlled by lysine acetylases and lysine deacetylases [Citation33]. To identify the acetyltransferases critical for TPD52 acetylation, constructs of FLAG-TPD52 and three acetyltransferases, KAT5, KAT2B and KAT2A, were cotransfected into 293 T cells. As shown in , all three acetyltransferases could bind to TPD52, whereas only KAT2B increased the acetylation of TPD52 in cells. Consistently, knocking down KAT2B with shRNA inhibited TPD52 acetylation (). To determine the deacetylases that are involved in regulating the deacetylation of TPD52, we transfected 293 T cells with HDAC1-7 and TPD52-expressing plasmids. We found that only HDAC2, but not other HDACs, could bind with TPD52 (). As expected, TPD52 could be efficiently deacetylated in vitro by HDAC2 ( and ). In addition, HDAC2 facilitated the interaction between TPD52 and HSPA8 (), suggesting that the interaction between TPD52 and HSPA8 is deacetylation-dependent.
Figure 5. TPD52 is acetylated by KAT2B and deacetylated by HDAC2. (A) IB analysis of the whole-cell lysates (WCLs) and anti-FLAG IPs derived from the 293 T cells transfected with FLAG-TPD52 and GFP-HSPA8 treated with nicotinamide (NAM, 5 mM, 6 h), trichostatin A (TSA, 1 μM, 18 h), tunicamycin (Tu, 5 μM, 12 h), 2-bromopalmitate (2-BP, 100 μM, 12 h), D-NMAPPD (B13, 30 μM, 12 h) or IL6 (interleukin 6; 50 ng/ml, 24 h). (B) IB analysis of the WCLs and anti-HSPA8 IPs derived from C4-2 cells treated with NAM (5 mM, 6 h) and TSA (1 μM, 18 h). Immunoglobulin G (IgG) served as a negative control. (C) Endogenous TPD52 was acetylated. IB analysis of the WCLs and anti-TPD52 IPs derived from C4-2 cells in the presence of NAM (5 mM, 6 h) and TSA (1 μM, 18 h). Immunoglobulin G (IgG) served as a negative control. (D) TPD52 was acetylated by KAT2B. IB analysis of the WCLs and anti-FLAG IPs derived from the 293 T cells transfected with FLAG-TPD52, HA-KAT2A, HA-KAT5 and HA-KAT2B. (E) KAT2B knockdown decreased the acetylation of TPD52. IB analysis of the WCLs and anti-FLAG IPs derived from C4-2 scramble (Sc) or KAT2B-knockdown (shKAT2B) cells transfected with FLAG-TPD52. (F) TPD52 bound to the deacetylase HDAC2. IB analysis of the WCLs and anti-FLAG IPs derived from 293 T cells transfected with HA-TPD52 and the indicated FLAG-tagged HDACs. (G) HDAC2 overexpression decreased the acetylation of TPD52. IB analysis of the WCLs and anti-FLAG IPs derived from the 293 T cells transfected with FLAG-TPD52, HA-KAT2B, and Myc-HDAC2. (H) HDAC2 knockdown increased the acetylation of TPD52. IB analysis of the WCLs and anti-FLAG IPs derived from the C4-2 scramble (Sc) or HDAC2 knockdown cells (shHDAC2) transfected with FLAG-TPD52. (I) IB analysis of the WCLs and anti-HA IPs derived from the 293 T cells transfected with FLAG-TPD52, HA-HSPA8 and MYC-HDAC2
Acetylation of TPD52 at lysine 163 impairs its binding with HSPA8 and inhibits CMA activation
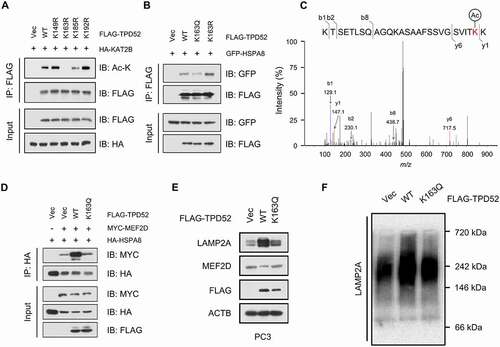
To identify the acetylation sites of TPD52, the online acetylation site prediction tool GPS-PAIL (http://pail.biocuckoo.org/) was used. Four potential acetylation sites were predicted in TPD52, K149, K163, K185 and K192 (Figure S8A), which were all in the domain of TPD52 that interacts with HSPA8. We validated the acetylation residues by creating lysine (K) to arginine (R) mutations and generated four potential acetylation-deficient mutant constructs (K149R, K163R, K185R and K192R). As shown in and Figure S8B, the K163 and K185 mutants showed reduced TPD52 acetylation. We next generated acetylation-mimetic mutants K163 (K163Q) and K185 (K185Q). As expected, the K163Q mutant led to decreased binding between TPD52 and HSPA8, whereas K163R led to the opposite results ( and S8C). However, the K185R and K185Q mutations had no notable effect on the interaction between TPD52 and HSPA8 (Figure S8D). Interestingly, K163 was found to be conserved in mammals (Figure S8E), suggesting its functional importance. LC-MS/MS-based proteomic analysis has been widely used to identify acetylated proteins sites. To do this, we purified TPD52 from C4-2 cells and then we confirmed the acetylation of lysine 163 using MS analysis (). Compared with wild-type TPD52, the K163Q-mutant TPD52 failed to enhance the binding between HSPA8 and CMA substrates (), leading to the attenuated activation of CMA ( and ). According to these results, we conclude that acetylation of TPD52 at lysine 163 impairs the activation of CMA by affecting its binding with HSPA8.
Figure 6. Acetylation of TPD52 at lysine 163 impairs its binding to HSPA8 and inhibits the activation of CMA. (A) IB analysis of the whole-cell lysates (WCLs) and anti-FLAG IPs derived from the 293 T cells transfected with HA-KAT2B and the indicated mutation constructs of FLAG-TPD52. (B) IB analysis of the WCLs and anti-FLAG IPs derived from the 293 T cells transfected with GFP-HSPA8, FLAG-TPD52 wild type (WT), FLAG-TPD52K163R and FLAG-TPD52K163Q. (C) Identification of TPD52 acetylation sites (K163) using mass spectrometry (MS) analysis. The MS/MS spectrum of modified “KTSETLSQAGQKASAAFSSVGSVITK(Acetylation)K” was shown. (D) IB analysis of the WCLs and anti-HA IPs derived from the 293 T cells transfected with HA-HSPA8, MYC-MEF2D, FLAG-TPD52 wild type (WT) and FLAG-TPD52K163Q. (E) IB analysis of the WCLs derived from the PC3 cells transfected with FLAG-TPD52 wild type (WT) and FLAG-TPD52K163Q. (F) Native continuous gel electrophoresis and IB analysis of lysosomes purified from the PC3 cells transfected with vector (Vec), FLAG-TPD52 wild type (WT) and FLAG-TPD52K163Q
The HDAC inhibitor romidepsin suppresses TPD52-mediated CMA activation and tumor growth in PCa
Because of the finding that HDAC2 regulates TPD52-dependent activation of CMA, we hypothesized that manipulating the activity of HDAC2 might be a potential therapeutic strategy for TPD52-overexpressing PCa. As shown in , the HDAC1/2 inhibitor romidepsin (ROM) increased the acetylation level of TPD52 in cells. Consequently, ROM treatment decreased the interaction between TPD52 WT (wild type) and HSPA8 but had relatively weak inhibition of the TPD52K163Q mutant ( and S8F). In addition, ROM also weakened the substrate binding ability of HSPA8 in TPD52-overexpressing cells ().
Figure 7. HDAC inhibitor romidepsin suppresses TPD52-mediated CMA activation and tumor growth in PCa. (A) Romidepsin increased the acetylation of TPD52. IB analysis of the whole-cell lysates (WCLs) and anti-FLAG IPs derived from the 293 T cells transfected with FLAG-TPD52 treated with romidepsin (ROM, 20 nM, 24 h). (B) IB analysis of the WCLs and anti-FLAG IPs derived from the 293 T cells transfected with GFP-HSPA8, FLAG-TPD52 WT and FLAG-TPD52K163Q treated with ROM (20 nM, 24 h). (C) IB analysis of the WCLs and anti-HA IPs derived from the 293 T cells transfected with HA-HSPA8, MYC-MEF2D and FLAG-TPD52 treated with ROM (20 nM, 24 h). (D-F) PC3 cells stably expressing TPD52 wild type (WT) and K163R were subcutaneously injected into nude mice. ROM (0.5 mg/kg) and DMSO were administered by intraperitoneal injection every 3 days when the xenograft tumors reached approximately 100 mm3. (D) Statistical analysis of the tumor volume, which was measured every three days and plotted individually. (E) Subcutaneous xenograft tumors formed from different groups of PC3 cells were dissected. (F) Statistical analysis of the weight of the dissected xenograft tumors; n = 5 mice per experimental group, the results are presented as the means ± S.D. *P < 0.05
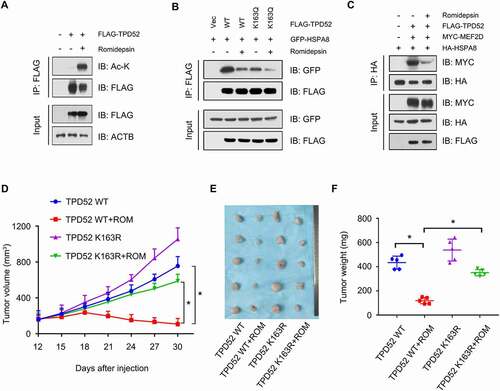
To verify the therapeutic role of ROM on TPD52 in vivo, we generated TPD52 wild-type (WT) and TPD52K163R-overexpressing PC3 cells and injected them into the xenograft mouse models. ROM dramatically inhibited the proliferation of PC3 WT xenograft tumors but not those of the TPD52K163R mutant in vivo (). Similarly, broad-spectrum inhibitor of histone deacetylases TSA also attenuated the tumor-promoting effects of TPD52 in PC3 TPD52 xenograft tumors (Figure S8G–I). Overall, these results indicate that the HDAC inhibitor attenuates TPD52-enhanced CMA-dependent tumor growth in vivo.
Discussion
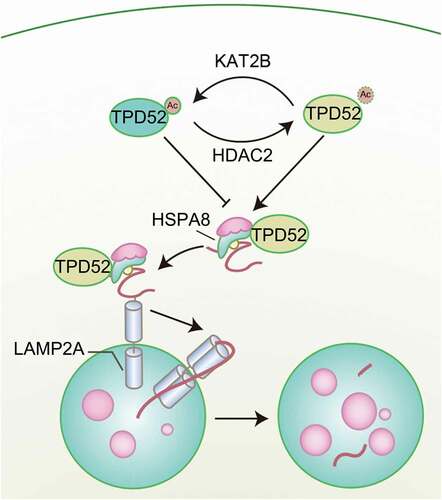
Previously, we and others reported that TPD52 overexpression endows PCa cells with resistance to different stressors, such as ionizing radiation [Citation6], docetaxel therapy [Citation16] and rapamycin treatment [Citation34], by attenuating autophagy, indicating a pivotal role of TPD52 in the maintenance of cell homeostasis under different circumstances. Interestingly, CMA, a type of autophagy that mediates the specific degradation of soluble cytosolic proteins, is vulnerable to external stimulation. In the present study, we report an underlying molecular link between TPD52 and the CMA pathway. Our research demonstrated that LAMP2A, an important component of CMA, was overexpressed in PCa. As shown in , TPD52 physiologically activated CMA by forming a complex with HSPA8 and enhancing CMA protein substrate transfer in PCa cells. Additionally, acetylation of TPD52 at lysine 163 by KAT2B and deacetylation by HDAC2 modulate the TPD52 interaction with HSPA8 and consequent activation of CMA.
Figure 8. Graphical summary of the proposed mechanism. A schematic diagram showing the working model for acetylation-regulated TPD52 in modulating CMA in PCa
Accumulating evidence has indicated the vital role of CMA in cancer development and progression. LAMP2A, a key component of the CMA pathway, was correlated with the survival and proliferation of cancer cells. Recent studies have shown that LAMP2A is upregulated in breast cancer, gastric cancer and lung cancer [Citation4–7]. In this study, we first identified that LAMP2A was overexpressed in PCa tissues. Furthermore, although manipulation of LAMP2A had no effect on the proliferation of PCa cells in vitro, the inhibition of xenograft tumor growth was observed in vivo. Interestingly, in our study, under serum starvation, overexpression of LAMP2A conferred resistance to stress-induced cell death, while knocking down LAMP2A facilitated cell death. It was reported that LAMP2A-knockout cells were considerably more susceptible to different damaging stimuli, including oxidative stresses (H2O2, paraquat, and cadmium) [Citation5] and UV light [Citation35]. One possible reason for these results is the activation of protective macroautophagy when CMA activity is blocked [Citation36]. Compensatory activation of macroautophagy in cells with CMA blockage may be enough to maintain cell viability under normal conditions, but cannot compensate for CMA dysfunction under particular stress conditions in which CMA plays an essential role as part of the stress response.
Another intriguing finding of our study was that TPD52 interacted with HSPA8 and resulted in the enhancement of substrate binding with HSPA8, indicating that physical interaction variation may exert positive regulatory effects on the process of CMA. Previous research suggested that the protein level of LAMP2A may be transcriptionally regulated by several transcription factors. Transcriptional factors AP-1 and SP1 might bind to the LAMP2 promoter, and NFE2L2/NRF2 may modulate CMA through the transcriptional regulation of LAMP2A [Citation37,Citation38]. However, we failed to observe a change in the mRNA level of LAMP2A after TPD52 overexpression. We discovered that the EIKRK (KFERQ-like motif upon acetylation) sequence in TPD52 or TPD52 was conserved in human (106-EIKRK-110), rat (105-EIKRK-109) and rabbit (66-EIKRK-70) except for mouse (105-ELKRK-109). Although we have confirmed that the lysine 163 (K163) can be acetylated, whether lysine 110 (K110) can be acetylated or not remains to be validated. Interestingly, TPD52 does not seem to be an CMA protein substrate upon our results (Figure S7), although TPD52 interacted with HSPA8 via the substrate-binding domain. In our study, the interaction between TPD52 and HSPA8 led to the enhancement of CMA activity and TPD52 was not delivered to lysosomes for degradation. We propose that TPD52 binds to HSPA8 in the cytoplasm, enhances the binding between HSPA8 and CMA substrates and consequently facilitates the activation of CMA.
Lysine acetylation is an important posttranslational mechanism that regulates various biological processes [Citation17,Citation18]. In our study, TPD52 acetylation was proven, and TPD52 acetylation at lysine 163 was found to play a critical role in modulating CMA activity by regulating the interaction between TPD52 and HSPA8. Importantly, we identified KAT2B as the acetyltransferase and HDAC2 as the deacetylase in this CMA modulating process. Notably, all four potential acetylation sites were located in the region between amino acids 143 and 192 in TPD52, which was proven to be the domain that interacted with HSPA8. Indeed, the interaction between TPD52 and HSPA8 was disrupted after lysine 163 in TPD52 was mutated. We propose that deacetylation of K163 may induce conformational changes in TPD52, resulting in HSPA8 recognizing previously inaccessible TPD52 binding sites.
Our previous study also demonstrated that TPD52 inhibited macroautophagy in PCa cells both in vitro and in vivo [Citation16]. TPD52-mediated inhibition of macroautophagy conferred resistance to docetaxel-induced cell death and apoptosis. The activation of CMA and inhibition of macroautophagy were observed simultaneously in our model system. Since autophagy is regarded as a double-edged sword, in that it may act as both a tumor suppressor and a protector of cancer cell survival, two possible hypotheses may explain the reasons for the discrepancy in CMA action [Citation39,Citation40]. The activation of CMA compensates for the inhibition of macroautophagy in PCa cells with high levels of TPD52. The other possibility is that TPD52 enhances the parallel activation of CMA and inhibition of macroautophagy. However, further studies are warranted to determine the underlying mechanisms of the differences in TPD52-mediated activation of CMA and inhibition of macroautophagy.
In summary, we conclude that deacetylated TPD52 promotes CMA activation by interacting with HSPA8 in PCa cells. Considering the tissue-specific expression of TPD52 in PCa, our study provides a novel antitumor therapeutic scheme for targeting TPD52-overexpressing PCa by HDAC inhibitors.
Materials and methods
Antibodies, reagents, and plasmids
Antibodies against LAMP2A (18528), LAMP1 (24170), RNASE1 (94417), KAT2B (96510), green fluorescent protein (GFP; 290), MEF2D (32845), LRRK2 (133474), HSP90 (203126), mCherry (ab125096), CTSA/PPCA (184553) and HSPA8 (51052 and 223356) were purchased from Abcam. Antibodies against HSPA5 (3177), COX4I1 (4850), FLAG-tag (14793), HA-tag (3724), MYC-tag (2276), LAMP1 (15665), acetylated-lysine (9441), HDAC2 (57156), histone H1 (41328), TFEB (4240), FOXO1 (14952), FOXO3 (12829) and GAPDH (8884) were purchased from Cell Signaling Technology. TPD52 (isoform 3) (A10254) was purchased from ABclonal. Mouse monoclonal FLAG antibody (F1804), a Nuclei EZ Prep nuclei isolation kit (NUC101) chloroquine diphosphate salt (CQ, C6628), 6-aminonicotinamide (6-AN, A68203), 7-chloro-3-(4-methylphenyl)-2 H-1,4-benzoxazine (AR-7, SML0921), EZBlue™ Gel Staining Reagent (G1041), DAPI (D9542), lysosome isolation kit (LYSISO1), trichostatin A (TSA, T8552), nicotinamide (NAM, N0636), tunicamycin (Tu, 654380), 2-bromopalmitate (2-BP, 238422) and D-NMAPPD (B13, SML2358) were purchased from Sigma-Aldrich. Mouse monoclonal ACTB/β-actin antibody (cw0096A) was purchased from CWBIO. Protein G Dynabeads (10004D) and TRIzol reagent were purchased from Invitrogen. MG-132 (S2619) and romidepsin (S3020) were purchased from Selleckchem. Rabbit polyclonal TPD52 (isoform 1) antibody was obtained from Professor Ruoxiang Wang (Department of Medicine, Cedars-Sinai Medical Center, Los Angeles, CA, USA). pcDNA3-myc-MEF2D, pcDNA3-myc-HDAC2, pwpi-GFP-LAMP2A, pwpi-GFP-TPD52, pwpi-GFP-HSPA8, and plko-GFP-sh-TPD52 plasmids were constructed according to standard protocols in our laboratory. TPD52, HSPA8, KAT2A, KAT2B and KAT5 were amplified and cloned into a pcDNA3.1-HA vector (Addgene, 128034; deposited by Oskar Laur Lab). TPD52, TPD52 (isoform 3), MEF2D, HDAC1, HDAC2, HDAC3, HDAC4, HDAC5, HDAC6 and HDAC7 cDNA were amplified and cloned into a cFLAG-pcDNA3 vector (Addgene, 20011; deposited by Stephen Smale Lab). Different TPD52 and HSPA8 mutants were generated by site-directed mutagenesis PCR using PfuTurbo DNA Polymerase (Agilent, 600254) according to the manufacturer’s instructions. Lentiviral shRNAs against KAT2B was purchased from Sigma-Aldrich. Lentiviral shRNAs against HDAC2 was purchased from Dharmacon. TPD52 sgRNAs were subcloned into the pLenti-CRISPRV2 GFP vector (Addgene, 86153; deposited by Roland Friedel Lab). The sgRNA sequences for human TPD52 KO were 5′-TCCTGCATCAAAATCAAACG-3 and 5ʹ-TAGAGAGATGGACTTATATG-3ʹ.
Cell culture, plasmid transfection and establishment of stable clone cells
Human PCa LNCaP, PC3, and C4-2 cell lines were purchased from the American Type Culture Collection (ATCC; CRL-1740, CRL-1435 and CRL-3314) and cultured in RPMI 1640 medium supplemented with 10% fetal bovine serum (FBS). The HEK293T cell line was obtained from Professor Chawnshang Chang (Department of Urology, University of Rochester, Rochester, NY 14642, USA) and maintained in Dulbecco’s modified Eagle’s medium (DMEM) supplemented with 10% FBS. Lipofectamine 2000 transfection reagent (Life Technologies, 11668–027) was applied for plasmid transfection in accordance with the manufacturer’s protocol. Various cell lines were infected with lentiviral cDNA expressing viruses, which were packaged with delta-8.9 and VSVG in HEK293T cells. Afterward, infected cells were selected using puromycin (1 μg/mL). All established cell lines were cultivated for less than 6 months and tested for mycoplasma every month. TPD52 siRNA (sc-45341) and LAMP2 siRNA (sc-29390) were obtained from Santa Cruz Biotechnology. Lipofectamine RNAi MAX (Thermo Fisher Scientific, 13778030) was applied for siRNA transfection in accordance with the manufacturer’s protocol.
Construction of tpd52-knockout mice and tissue extraction
C57BL/6 mouse experiments were performed using protocols approved by the Institutional Animal Care and Use Committee of Xi’an Jiaotong University [Citation16]. C57BL/6 TRAMP mice were purchased from Model Animal Research Center of Nanjing University. All operations were performed according to the NIH Guidelines on the Use of Laboratory Animals. C57BL/6 wild type (WT) and tpd52-knockout (KO) mice were generated as previously described. The prostate tissue was isolated and used for protein extraction or immunohistochemistry (IHC).
Western blot analysis
Cells were lysed with radioimmunoprecipitation assay (RIPA) buffer (10 mM Tris-HCl, pH 7.4, 150 mM NaCl, 0.1% SDS, 1 mM EDTA, 1 mM EGTA, 0.3 mM PMSF, 0.2 mM sodium orthovanadate, 1% NP-40 [Sigma-Aldrich, NP40], 10 mg/ml leupeptin [Sigma-Aldrich, 62070], 10 mg/ml aprotinin [Sigma-Aldrich, A3886]). Proteins were quantified and separated in sodium dodecyl sulfate-polyacrylamide gel electrophoresis (SDS-PAGE) gels. Then, they were transferred to polyvinylidene fluoride (PVDF) membranes and blocked with 5% skim milk in TBS (50 mM Tris-HCl, pH 7.4, 150 mM NaCl) for 1 h at room temperature. The membranes were incubated overnight with specific primary antibodies at 4°C, followed by goat anti-mouse/rabbit horseradish peroxidase-conjugated secondary antibody (Merck Millipore, 401215/401315) incubation for 1 h at room temperature. The immunoreactive protein signals were measured with an ECL detection system (Thermo Fisher Scientific, 34075).
Total RNA extraction and real-time RT-PCR analysis
Total RNA was extracted from cells using a total RNA extraction kit obtained from Fastagen (220010). cDNA was synthesized using a reverse transcription reaction kit (MBI Fermentas, K1622) and then amplified using specific primers. The following primer sequences were used: HsLAMP2A (human, forward primer, 5ʹ-GTCTCAAGCGCCATCATACT-3ʹ; reverse primer, 5ʹ-TCCAAGGAGTCTGTCTTAAGTAGC-3ʹ), MmLamp2a (mouse, forward primer, 5ʹ-GCAGTGCAGATGAAGACAAC-3ʹ; reverse primer, 5ʹ-AGTATGATGGCGCTTGAGAC-3ʹ), LAMP1 (forward primer, 5ʹ-GTTTCTTCATTCTTTACTG-3ʹ; reverse primer, 5ʹ-TCTCTACTGTTGTAATGT-3ʹ), MEF2D (forward primer, 5ʹ-CCAGCGAATCACCGACGAG-3ʹ; reverse primer, 5ʹ-GCAGTCACATAGCACGCTC-3ʹ), LRRK2 (forward primer, 5ʹ-GAGCACGCCTCCAAGTTATTT-3ʹ; reverse primer, 5ʹ-ACTGGCATTATGAACTGTTAGCA-3ʹ), GAPDH (forward primer, 5ʹ-GGAGCGAGATCCCTCCAAAAT-3ʹ; reverse primer, 5ʹ-GGCTGTTGTCATACTTCTCATGG-3ʹ), TPD52 (forward primer, 5ʹ-GAGATGGACTTATATGAGGACTAC-3ʹ; reverse primer, 5ʹ-TTGCTGCTAACACTTGAGAC-3ʹ), HsACTB (human, forward primer, 5ʹ-TAATCTTCGCCTTAATACTT-3ʹ; reverse primer, 5ʹ-TAATCTTCGCCTTAATACTT-3ʹ) and MmActb (mouse, forward primer, 5ʹ-7AAGGACTCCTATAGTGGGTGACGA-3ʹ; reverse primer, 5ʹ-ATCTTCTCCATGTCGTCCCAGTTG-3ʹ). Relative changes in gene expression were normalized against ACTB, the internal control gene.
Confocal fluorescence microscopy and immunofluorescence staining
Cells were plated onto slides. After being washed with ice-cold phosphate-buffered saline (PBS; Solarbio, P1020) 3 times, the cells were fixed with 4% paraformaldehyde for 15 min. Then, the cells were permeated with 0.1% Triton X-100 (Sigma-Aldrich, T8787) and incubated overnight with specific primary antibodies (HSPA8, 1:100; LAMP1, 1:100; mCherry, 1:100; TPD52, 1:100) at 4°C. The cells were stained with fluorescein isothiocyanate (FITC)/Cy3 secondary antibodies (Abcam, ab6785 and ab6717; Beyotime, P0193) for 1 h at room temperature. Subsequently, the cells were stained with DAPI and blocked with glycerol. Fluorescence microscopy (Nikon Ti inverted or Zeiss LSM880) was used to detect the fluorescence in the cells.
Measurement of CMA activity in intact cells
PCa PC3 WT or TPD52 overexpressing cells were stably transduced with lentivirus carrying the CMA reporter pSIN-PAmCherry-KFERQ-NE. Cells were photoactivated by a 405-nm light-emitting diode (LED: Norlux) for 5 min (3.5 mA current constant). After 16 h, cells were fixed with 4% paraformaldehyde (PFA) for 15 mins and images were acquired with fluorescence microscope (Nikon Ti inverted or Zeiss LSM880). The number of red fluorescent puncta per cell was quantified using ImageJ software (NIH).
Colony formation assay
Cells were inoculated into a 6-well plate at a density of 1000 cells per well and incubated for 1 week at 37°C in an atmosphere of 5% CO2. After the culture was terminated, the cells were fixed with 4% paraformaldehyde for 15 min. The plates were then stained with a crystal violet solution for 20–30 min. The staining solution was slowly washed away with running water, and then, the cells were photographed with an inverted microscope.
Coimmunoprecipitation
After transfection with a particular plasmid, the cells were lysed with IP buffer (50 mM Tris HCl, pH 7.5, 150 mM NaCl, 1 mM ethylenediaminetetraacetic acid [EDTA], 1% Triton X-100) containing protease inhibitors (Roche, 4693132001) and phosphatase inhibitors (Roche, 4906837001). The proteins were incubated either with primary antibody and protein G Dynabeads (Invitrogen, 10004D) or monoclonal anti-FLAG or anti-HA antibody-conjugated M2 agarose beads (Sigma-Aldrich, A2095 and A2220) with gentle rocking at 4°C. Later, the cell lysates were washed twice with IP buffer, and the proteins were extracted from the Dynabeads by boiling at 95°C for 5 min. Finally, the proteins were separated by western blotting as described.
GST affinity isolation
Briefly, pGEX-4 T-1 vector (Addgene, 129567) and pGEX-4 T-1-GST-TPD52 were expressed in BL21 Escherichia coli and purified from transfected bacterial using Glutathione Sepharose 4B (GE Healthcare, 17075605). For GST affinity-isolation assays, recombinant HIS-tagged HSPA8 (Abcam, ab78431) or HSP90 alpha (Abcam, 85242) was incubated with 1 μg of purified proteins with gentle rocking at 4°C for 3 h. Later, the cell lysates were washed twice with RIPA buffer and boiled at 95°C for 5 min. Finally, the proteins were separated by western blotting as described.
Mass spectrometry analysis
C4-2 cells were transfected with the pcDNA3-FLAG vector FLAG-tagged TPD52. After 48 h, the cells were lysed with IP buffer and immunoprecipitated with FLAG-agarose beads (Sigma-Aldrich, A2220). Then, the bound proteins were eluted with 2% (vol:vol) sodium deoxycholate (SDC; Sigma-Aldrich, D6750) solution and digested overnight with sequencing grade-modified trypsin (Promega, PRV5111). The peptides were purified and resuspended in 0.1% formic acid for LC-MS analysis. The obtained peptides were analyzed using a nanoLC-Ultra 2D coupled with a TripleTOF 5600 mass spectrometer (AB SCIEX). The data acquired by LC-MS were analyzed and quantified by using 2D-ICAL v.1.3.23 software. Gene ontology (GO) enrichment analysis was performed using R Studio.
Protein half-life assays
Briefly, cells were treated with cycloheximide (100 μg/ml; Sigma-Aldrich, 01810) for the indicated time and lysed with RIPA buffer. Then the proteins were subjected to immunoblot assay described above.
Vivo ubiquitination assays
Cells were transfected with HIS-ubiquitin and indicated constructs for 42 h and then treated with 20 mM MG132 (Sigma-Aldrich, M7449) for 6 h. Subsequently, cells were lysed with buffer A (6 M guanidine-HCl, 0.1 M Na2HPO4/NaH2PO4, 10 mM imidazole, pH 8.0) and sonicated for 15 s. After incubating with nickel-nitrilotriacetic acid (Ni-NTA) beads (QIAGEN, 30230) for 3 h at room temperature, the proteins were washed twice with buffer A, twice with buffer A/TI (1 volume buffer A and 3 volumes buffer TI), and one time with buffer TI (25 mM Tris-HCl, 20 mM imidazole, pH 6.8). The affinity-isolated proteins were denatured by boiling at 95°C for 5 min and separated by SDS-PAGE for immunoblotting.
Isolation of lysosomes
A lysosome isolation kit from Sigma-Aldrich (LYSISO1) was used to purify lysosomes from PCa cells. The cells were lysed with extraction buffer containing a protease inhibitor cocktail. A crude lysosome fraction (CLF) was added to 19% OptiPrep Solution (Sigma-Aldrich, D1556) and ultracentrifuged at 150,000 × g for 4 h. Then we evaluated the intactness of the lysosomes by using Neutral Red reagent (Sigma-Aldrich, N2537) according to the manufacturer’s instruction. Fractions of 0.5–0.7 ml of this mixture were withdrawn using extralong tips starting from the top of the gradient, and the lysosome fractions were assayed for purity and used in further experiments.
Lysosome binding and uptake assays
To evaluate CMA activity, we measured the amount of CMA substrate RNASE1 (Sigma-Aldrich, R-5500) and GAPDH (Sigma-Aldrich, G5262) that were transported into isolated lysosomes. The freshly extracted lysosomes treated with or without chymostatin (Sigma-Aldrich, C7268; 100 μM, 10 min on ice) were co-incubated with RNASE1 or GAPDH in modified MOPS buffer containing 10 mM ATP (Sigma-Aldrich, A2383) and 5 μg/ml HSPA8 peptide (Abcam, ab78431) for 20 min at 37°C. The lysosome pellets were washed three times with ice-cold PBS and centrifuged at 21,000 × g for 15 min at 4°C. Western blotting was used to measure the proteins in the lysosome pellets.
Native gel electrophoresis
Lysosomal complexes were separated by native-PAGE gels purchased from (Sigma-Aldrich, BN1002BOX) without boiling. Then the proteins were transferred to polyvinylidene fluoride (PVDF) membranes at 25 V for 1 h. The membranes were then incubated with 8% acetic acid for 15 min to fix the proteins. The LAMP2A complexes were visualized with an ECL detection system using anti-LAMP2A antibody.
Immunohistochemistry analysis
Briefly, specimens were fixed with 4% formalin-phosphate-buffered solution (Sigma-Aldrich, 1004969010), embedded with paraffin and cut into 5-μm sections. Sections were then deparaffinized, followed by antigen retrieval for 10 min and incubation with 3% H2O2 for 30 min. The sections were then incubated with primary antibody against LAMP2A or MEF2D, followed by horseradish peroxidase-conjugated secondary antibody (Gene Tech, GK600505) incubation for 1 h at room temperature. Chromogenic detection was achieved using diaminobenzidine (DAB; Gene Tech, GK600505). The sections were finally dehydrated and mounted with neutral resin (Solarbio, G8590), and each slide was observed under a microscope (Olympus Optical Co, Tokyo, Japan).
PCa xenograft animal model
Male BALB/c nude mice were purchased from the Laboratory Animal Center of Xi’an Jiaotong University. The use of the animals was approved by the Institutional Animal Care and Use Committee of Xi’an Jiaotong University. In summary, cells (5 × 10⁶) were mixed with Matrigel (4:1, v:v; Corning, 354234) and subcutaneously injected into the right hind flanks of the male BALB/c nude mice. Tumor size was measured every three days until the volume of the xenograft tumors reached 150 mm3. The tumor volume was calculated with the following formula: volume (mm3) = 1/2 × (length) × (width)2. Thirty days after receiving the injection, the mice were sacrificed to obtain the tumor, which were prepared for subsequent experiments.
Statistical analysis
All data are presented as the means ± standard deviation (SD). The differences between various groups were analyzed by one-way ANOVA. Student’s t-tests were used for the comparison between two groups. P<0.05 was the criterion used to represent a significant difference.
Supplemental Material
Download MS Word (3.4 MB)Disclosure statement
No potential conflict of interest was reported by the author(s).
Supplementary material
Supplemental data for this article can be accessed here.
Additional information
Funding
References
- Kaushik S, Cuervo AM. The coming of age of chaperone-mediated autophagy. Nat Rev Mol Cell Biol. 2018;19(6):365–381.
- Cuervo AM, Wong E. Chaperone-mediated autophagy: roles in disease and aging. Cell Res. 2014;24(1):92–104.
- Catarino S, Pereira P, Girão H. Molecular control of chaperone-mediated autophagy. Essays Biochem. 2017;61(6):663–674.
- Kon M, Kiffin R, Koga H, et al. Chaperone-mediated autophagy is required for tumor growth. Sci Transl Med. 2011;3(109):109r–117r.
- Saha T. LAMP2A overexpression in breast tumors promotes cancer cell survival via chaperone-mediated autophagy. Autophagy. 2012;8(11):1643–1656.
- Shang ZF, Wei Q, Yu L, et al. Suppression of PC-1/PRLZ sensitizes prostate cancer cells to ionizing radiation by attenuating DNA damage repair and inducing autophagic cell death. Oncotarget. 2016;7(38):62340–62351.
- Suzuki J, Nakajima W, Suzuki H, et al. Chaperone-mediated autophagy promotes lung cancer cell survival through selective stabilization of the pro-survival protein, MCL1. Biochem Biophys Res Commun. 2017;482(4):1334–1340.
- Ding ZB, Fu XT, Shi YH, et al. Lamp2a is required for tumor growth and promotes tumor recurrence of hepatocellular carcinoma. Int J Oncol. 2016;49(6):2367–2376.
- Anguiano J, Garner TP, Mahalingam M, et al. Chemical modulation of chaperone-mediated autophagy by retinoic acid derivatives. Nat Chem Biol. 2013;9(6):374–382.
- Arias E, Koga H, Diaz A, et al. Lysosomal mTORC2/PHLPP1/Akt regulate chaperone-mediated autophagy. Mol Cell. 2015;59(2):270–284.
- Wang R, Xu J, Saramäki O, et al. PRLZ, a novel prostate-specific and androgen-responsive gene of the TPD52 family, amplified in chromosome 8q21.1 and overexpressed in human prostate cancer. Cancer Res. 2004;64(5):1589–1594.
- Zhang H, Wang J, Pang B, et al. PC-1/PRLZ contributes to malignant progression in prostate cancer. Cancer Res. 2007;67(18):8906–8913.
- Li L, Xie H, Liang L, et al. Increased PRLZ-mediated androgen receptor transactivation promotes prostate cancer growth at castration-resistant stage. Carcinogenesis. 2013;34(2):257–267.
- Wang R, Xu J, Mabjeesh N, et al. PRLZ is expressed in normal prostate development and in human prostate cancer progression. Clin Cancer Res. 2007;13(20):6040–6048.
- Zhang D, He D, Xue Y, et al. PRLZ protects prostate cancer cells from apoptosis induced by androgen deprivation via the activation of Stat3/Bcl-2 pathway. Cancer Res. 2011;71(6):2193–2202.
- Zeng J, Liu W, Fan YZ, et al. PRLZ increases prostate cancer docetaxel resistance by inhibiting LKB1/AMPK-mediated autophagy. Theranostics. 2018;8(1):109–123.
- Gil J, Ramírez-Torres A, Encarnación-Guevara S. Lysine acetylation and cancer: a proteomics perspective. J Proteomics. 2017;150: 297-309.
- Drazic A, Myklebust LM, Ree R, et al. The world of protein acetylation. Biochim Biophys Acta. 2016;1864(10):1372–1401.
- Cuervo AM, Knecht E, Terlecky SR, et al. Activation of a selective pathway of lysosomal proteolysis in rat liver by prolonged starvation. Am J Physiol. 1995;269(5 Pt 1):C1200–C1208.
- Hao Y, Kacal M, Ouchida AT, et al. Targetome analysis of chaperone-mediated autophagy in cancer cells. Autophagy. 2019;15(9):1558–1571.
- Yang Q, She H, Gearing M, et al. Regulation of neuronal survival factor MEF2D by chaperone-mediated autophagy. Science. 2009;323(5910):124–127.
- Orenstein SJ, Kuo SH, Tasset I, et al. Interplay of LRRK2 with chaperone-mediated autophagy. Nat Neurosci. 2013;16(4):394–406.
- Ho PW, Leung CT, Liu H, et al. Age-dependent accumulation of oligomeric SNCA/α-synuclein from impaired degradation in mutant LRRK2 knockin mouse model of Parkinson disease: role for therapeutic activation of chaperone-mediated autophagy (CMA). Autophagy. 2020;16(2):347–370.
- Bandyopadhyay U, Cuervo AM. Entering the lysosome through a transient gate by chaperone-mediated autophagy. Autophagy. 2008;4(8):1101–1103.
- Cuervo AM, Dice JF. Unique properties of lamp2a compared to other lamp2 isoforms. J Cell Sci. 2000;113: Pt 244441–4450.
- Cuervo AM, Mann L, Bonten EJ, et al. Cathepsin A regulates chaperone-mediated autophagy through cleavage of the lysosomal receptor. Embo J. 2003;22(1):47–59.
- Lapierre LR, Kumsta C, Sandri M, et al. Transcriptional and epigenetic regulation of autophagy in aging. Autophagy. 2015;11(6):867–880.
- Bandyopadhyay U, Kaushik S, Varticovski L, et al. The chaperone-mediated autophagy receptor organizes in dynamic protein complexes at the lysosomal membrane. Mol Cell Biol. 2008;28(18):5747–5763.
- Bonam SR, Ruff M, Muller S. HSPA8/HSC70 in immune disorders: a molecular rheostat that adjusts chaperone-mediated autophagy substrates. Cells-Basel. 2019;8(8):849.
- Kaushik S, Cuervo AM. Chaperone-mediated autophagy: a unique way to enter the lysosome world. Trends Cell Biol. 2012;22(8):407–417.
- Hou T, Fan Y, Dan W, et al. Chaperone-mediated autophagy in cancer: advances from bench to bedside. Histol Histopathol. 2020;35(7):637–644.
- Taylor IR, Ahmad A, Wu T, et al. The disorderly conduct of Hsc70 and its interaction with the Alzheimer’s-related Tau protein. J Biol Chem. 2018;293(27):10796–10809.
- Glozak MA, Sengupta N, Zhang X, et al. Acetylation and deacetylation of non-histone proteins. Gene. 2005;363:15-23.
- Yu L, Shang ZF, Wang J, et al. PC-1/PRLZ confers resistance to rapamycin in prostate cancer cells through increased 4E-BP1 stability. Oncotarget. 2015;6(24):20356–20369.
- Massey AC, Kaushik S, Sovak G, et al. Consequences of the selective blockage of chaperone-mediated autophagy. Proc Natl Acad Sci U S A. 2006;103(15):5805–5810.
- Wu H, Chen S, Ammar AB, et al. Crosstalk between macroautophagy and chaperone-mediated autophagy: implications for the treatment of neurological diseases. Mol Neurobiol. 2015;52(3):1284–1296.
- Sawada R, Jardine KA, Fukuda M. The genes of major lysosomal membrane glycoproteins, lamp-1 and lamp-2. 5ʹ-flanking sequence of lamp-2 gene and comparison of exon organization in two genes. J Biol Chem. 1993;268(12):9014–9022.
- Pajares M, Rojo AI, Arias E, et al. Transcription factor NFE2L2/NRF2 modulates chaperone-mediated autophagy through the regulation of LAMP2A. Autophagy. 2018;14(8):1310–1322.
- Kimura T, Takabatake Y, Takahashi A, et al. Chloroquine in cancer therapy: a double-edged sword of autophagy. Cancer Res. 2013;73(1):3–7.
- Apel A, Zentgraf H, Büchler MW, et al. Autophagy-A double-edged sword in oncology. Int J Cancer. 2009;125(5):991–995.