
ABSTRACT
Olfactory dysfunction, one of the earliest non-motor symptoms of Parkinson disease (PD), is accompanied by abnormal deposition of SNCA/α-synuclein in the olfactory bulb (OB). The macroautophagy/autophagy-lysosome pathway (ALP) plays an important role in degrading pathological SNCA and modulating this pathway may be a promising treatment strategy. P2RX4 (purinergic receptor P2X, ligand-gated ion channel 4), a member of the purinergic receptor X family, is a key molecule regulating ALP. Piperine (PIP) is a Chinese medicine with anti-inflammatory and anti-oxidant effects. The present study investigated the neuroprotective effects of PIP on SNCA overexpression-induced PD cell and mouse models. We found that PIP oral administration (25, 50 and 100 mg/kg) for 6 weeks attenuated olfactory deficits and delayed motor deficits in Thy 1-SNCA transgenic mice overexpressing human SNCA. This was accompanied by a degradation of pathological SNCA in OB. In addition, PIP improved cell viability and promoted degradation of human SNCA in SK-N-SH cells. These protective effects were exerted via autophagy flux promotion by enhancing autophagosome-lysosome membrane fusion. Furthermore, tandem mass tag proteomics analyses showed that P2RX4 plays an important role in PIP treatment-induced activation of autophagy flux. These findings demonstrate that PIP exerts neuroprotective effects in PD models via promotion of autophagy flux and may be an effective agent for PD treatment.
Abbreviations: 6-OHDA, 6-hydroxydopamine; ALP, autophagy-lysosome pathway; BafA1, bafilomycin A1; CoQ10, coenzyme Q10; DMSO: dimethyl sulfoxide; HPLC, high-performance liquid chromatography; IVE, ivermectin; LDH, lactate dehydrogenase; MAP1LC3/LC3-II, lipid-conjugated microtubule-associated protein 1 light chain 3; MPTP, 1-methyl-4-phenyl-1,2,3,6-tetrahydropyridine; mRFP-GFP, tandem monomeric red fluorescent protein-green fluorescent protein; MTT, 3-(4,5-dimethylthiazol-2-yl)-2,5-diphenyltetrazolium bromide; OB, olfactory bulb; P2RX4, purinergic receptor P2X, ligand-gated ion channel 4; PD, Parkinson disease; PBS: phosphate-buffered saline; PI: propidium iodide; PIP, piperine; PLG, piperlongumine; p-SNCA, SNCA phosphorylated at Ser129; Rap, rapamycin; RT-PCR: quantitative real-time PCR; SNARE, soluble N-ethylmaleimide-sensitive factor-attachment protein receptor; SNCA/α-synuclein, synuclein, alpha; STX17, syntaxin17; TG, transgenic; TH, tyrosine hydroxylase; UPS, ubiquitin-proteasome system; WT, wild-type
Introduction
Parkinson disease (PD) is a central nervous system degenerative disease characterized by motor symptoms that are often accompanied by a series of non-motor symptoms such as olfactory dysfunction, constipation, depression, and cognitive impairment [Citation1,Citation2]. Olfactory dysfunction is an early symptom that can precede motor symptoms by 10–20 years in up to 95% of PD patients [Citation3,Citation4]. Postmortem examination of PD patient brains has shown that the olfactory bulb (OB) is one of the first regions affected by deposition of pathological SNCA/α-synuclein (synuclein, alpha) – the major component of Lewy bodies and Lewy neurites which are the two pathological hallmarks of PD [Citation5,Citation6]. Transgenic mice overexpressing human wild-type SNCA presented impaired olfactory function [Citation7,Citation8], suggesting a link between abnormal SNCA accumulation and olfactory dysfunction in PD. Therefore, therapeutic strategies aimed at decreasing the accumulation of abnormal SNCA may be effective for PD treatment.
Autophagy is involved in SNCA homeostasis by degrading unnecessary aggregation-prone proteins [Citation9,Citation10]. Initially, parts of cytoplasmic proteins and cellular organelles are engulfed within a double-membrane vesicle called the autophagosome. The autophagosome fuses with a lysosome to form an autolysosome, which results in the degradation of its contents by various lysosome hydrolytic enzymes. The contents are then either digested or recycled back to the cell [Citation11–13]. However, it has been reported that the autophagy-lysosome pathway (ALP) is impaired in postmortem PD patient tissue and PD models [Citation14,Citation15].
P2RX4 (purinergic receptor P2X, ligand-gated ion channel 4), a member of the P2X receptor family, is a cation-permeable and ligand-gated ion channel that opens in response to the binding of extracellular ATP [Citation16]. It has been shown that P2RX4 on the plasma membrane is internalized to late endosomes, lysosomes or lysosome-related organelles [Citation17]. Under normal conditions, P2RX4 is stable in the lysosome, but lysosome Ca2+ release caused by P2RX4 activation promotes the fusion of the lysosome membrane with the autophagosome [Citation18,Citation19]. These findings suggest that P2RX4 may be a target to regulate ALP.
PD has reached an irreversible stage when motor symptoms occur [Citation20]. Therefore, early intervention before non-motor symptoms appear may be an effective means to treat or delay the development of the disease. Piperine (PIP), an alkaloid isolated from the Piper longum L. that is used in traditional Chinese medicine, has demonstrated anti-inflammatory and anti-oxidant properties [Citation21,Citation22]. In previous studies, we found that PIP and piperlongumine (PLG), another alkaloid with similar properties as PIP, had neuroprotective effects and attenuated motor deficits in PD models induced by neurotoxins 1-methyl-4-phenyl-1,2,3,6-tetrahydropyridine (MPTP), rotenone, and 6-hydroxydopamine (6-OHDA) [Citation23,Citation24]. However, it is unknown whether PIP can alleviate olfactory dysfunction in SNCA-induced PD model, and the underlying mechanism remains to be clarified.
To address these issues, the present study investigated the therapeutic effects of PIP in SNCA overexpression-induced mouse and cell PD models. We found that PIP attenuated olfactory dysfunction in mice and improved cell viability. These effects were associated with SNCA autophagic degradation by enhancing autophagosome-lysosome membrane fusion. Tandem mass tag (TMT) proteomics analyses showed that P2RX4 plays an important role in the activation of autophagy flux. Our findings suggest that PIP may be a therapeutic agent for the early treatment of PD.
Results
PIP attenuates olfactory dysfunction in SNCA-induced PD mice
Olfactory dysfunction is an early symptom of PD [Citation2]. To verify whether PIP could protect against olfactory deficits in 6-months-old Thy 1-SNCA transgenic (TG) mice, TG mice were treated with PIP (25, 50 and 100 mg/kg) for 6 weeks, while the positive control group received the mitochondrial protection drug coenzyme Q10 (CoQ10, 200 mg/kg) (, Figure S1). Olfactory behavior was evaluated with a buried food pellet test, sucrose preference test and open field test.
Figure 1. PIP attenuates olfactory dysfunction in SNCA transgenic mice. (A) Male TG mice were orally treated with PIP (25, 50 and 100 mg/kg) or CoQ10 (200 mg/kg) for 6 weeks. (B–G) Buried food pellet (B), surface pellet (C), sucrose preference (D) and open field (E–G) tests were used to assess olfactory function. Data are expressed as means ± SEM (one-way analysis of variance). ##P < 0.01, ###P < 0.001, ####P < 0.0001 vs. WT; ****P < 0.0001 vs. TG (n = 10–19). (H) The buried food pellet test was used to assess olfactory function with age. Data are expressed as means ± SEM (two-way analysis of variance). *P < 0.05, **P < 0.01, ****P < 0.0001 (n = 5–10).
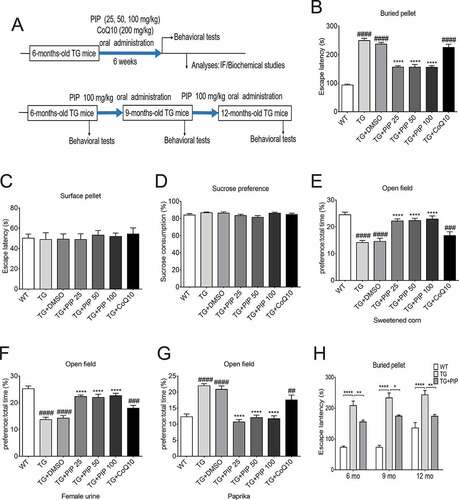
In the buried food pellet test, TG mice spent more time searching for the target foods, whereas PIP treatment shortened their searching time (). The surface pellet test and sucrose preference test excluded the effects of preference, motor disorder, visual disorder and depression of olfactory function (). In the open field test using attracting substances (sweetened corn and female urine), the ratio of time that PIP treatment mice stayed in the target odor area to total activity time increased compared with TG mice, and when using irritating substances (paprika), the ratio was reduced (). In addition, the buried food pellet test showed that continuous PIP treatment improved olfactory disorders in older TG mice (), while CoQ10 did not have the same effect. CoQ10 is a mitochondrial protective drug, and our previous research suggested that PIP has a mitochondrial protective effect [Citation24]. The present results indicate that PIP oral administration attenuated olfactory dysfunction in SNCA-induced PD mice which may have nothing to do with the protection of mitochondria.
PIP delays motor deficits and abrogates dopamine reduction in SNCA-induced PD mice
Motor dysfunction is a hallmark of PD [Citation1]. To verify whether PIP could delay the progression of PD, TG mice were treated with PIP (100 mg/ kg) until 12-months-old. Motor behavior was evaluated with the rotarod and pole tests. In the former, TG mice spent less time on the rod than wild type (WT) mice, whereas PIP treatment prolonged their duration on the rod (). Similarly, in the pole test, PIP shortened the time that TG mice spent on the pole (). These results indicate that continuous PIP administration attenuates SNCA-induced motor deficits.
Figure 2. PIP delays motor deficits and abrogates dopamine reduction in SNCA transgenic mice. Male TG mice were orally treated with PIP (100 mg/kg) until 12-months-old. (A–B) Rotarod (A) and pole (B) tests were used to assess motor function. Data are expressed as means ± SEM (two-way analysis of variance). ***P < 0.001, ****P < 0.0001 (n = 5–10). (C) TH (tyrosine hydroxylase) expression in the striatum and SN was assessed by immunohistochemistry. Scale bar: 500 µm. (D–E) Quantitative analysis of TH-positive neurons in the striatum (D) and SN (E). (F) Dopamine (DA) content in the striatum was assessed by HPLC. Data are expressed as means ± SD (one-way analysis of variance). ###P < 0.001, ####P < 0.0001 vs. WT; **P < 0.01, ***P < 0.001 vs. TG (n = 3).
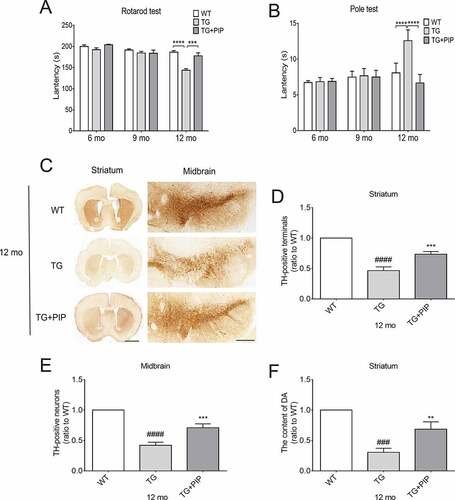
To investigate the effects of PIP on the nigrostriatal system, sections from the striatum and substantia nigra (SN) were assessed for the expression of tyrosine hydroxylase (TH) – the rate-limiting enzyme involved in dopamine production – by immunohistochemistry. We found that the number of TH-positive fibers in the striatum and SN were decreased in 12-months-old TG mice. This was alleviated by administration of 100 mg/kg PIP (). Furthermore, the dopamine level was decreased in the striatum of 12-months-old TG mice as determined by high-performance liquid chromatography (HPLC); PIP treatment alleviated this effect (). These results suggest that PIP oral administration delays motor deficits in SNCA-induced PD mice by preventing the reduction in dopamine level.
PIP promotes the degradation of pathological SNCA in OB of SNCA-induced PD mice
To investigate the mechanistic basis for the effects of PIP, we performed a few analyses to look for molecular and cellular alterations. Western blotting showed a decrease in the level of human (Hs)-SNCA in RIPA soluble and insoluble fractions of OB from PIP-treated mice when compared with TG mice (). Consistent with findings from western blotting, immunofluorescence analyses showed widely distributed cytosolic SNCA-immunoreactive granular aggregates or inclusions in OB of TG mice, and this was decreased by PIP treatment (, Figure S2).
Figure 3. PIP promotes the degradation of pathological SNCA in the OB of SNCA transgenic mice. (A) Immunoblot results of Hs-SNCA levels in the RIPA soluble and insoluble fractions from OB. (B–C) Quantitative analysis of Hs-SNCA level in the RIPA soluble (B) and insoluble fractions (C) level in OB. ACTB was used as a loading control. The normalized ratio for the TG group was taken as 1. (D) Representative immunofluorescence images from mice slices of OB treated with and without PK. Scale bar: 75 µm, zoom scale bar: 10 µm. (E) Hs-SNCA mRNA expression after PIP treatment was assessed by RT-PCR. Data are expressed as means ± SD (one-way analysis of variance). **P < 0.01, ***P < 0.001, ****P < 0.0001 vs. TG (n = 3).
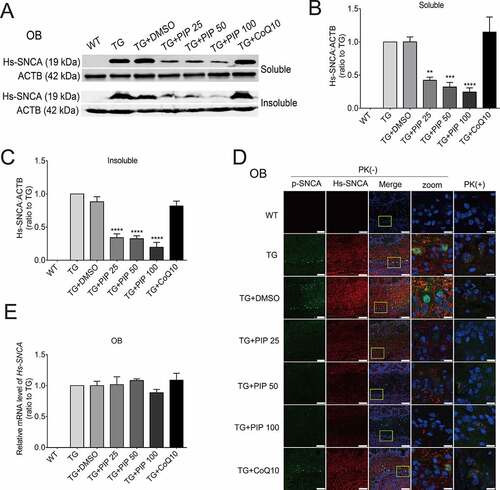
To determine whether decreased levels of SNCA and aggregation were due to transcriptional downregulation, human (Hs)-SNCA mRNA levels in each group were measured by quantitative real-time PCR (RT-PCR). No changes in Hs-SNCA mRNA level were detected, suggesting that the observed decrease in SNCA and aggregation level resulted from compromised protein degradation (). These results indicate that PIP promotes the degradation of SNCA and aggregation in TG mice. SNCA can be degraded by both ALP and the ubiquitin-proteasome system (UPS) [Citation25,Citation26]; therefore, the pathway of SNCA degradation was examined in greater detail.
PIP improves cell viability by SNCA autophagic degradation
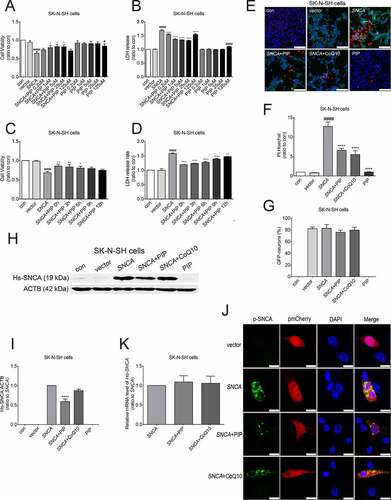
To determine the pathway by which PIP promotes SNCA degradation, we evaluated cell viability and cytotoxicity with the 3-(4,5-dimethylthiazol-2-yl)-2,5-diphenyltetrazolium bromide (MTT) and lactate dehydrogenase (LDH) assays, respectively. We found that cell viability was reduced and cytotoxicity was enhanced in SK-N-SH cells transfected with SNCA for 24 h. PIP was administered in doses of 0.2, 1, 5, 25 and 125 μM beginning 24 h after the start of SNCA transfection, for a total PIP exposure time of 12, 15, 18, 21 and 24 h, following immediate by detection 48 h after the start of transfection. Our results showed that PIP treatment reversed the effect in a dose (0.2, 1, 5 and 25 μM)- and time (0, 3, 6, 9 and 12 h)-dependent manner after SNCA transfection for 24 h (), although this was not the case for 9 and 12 h of treatment. Based on these results, in subsequent experiments cells were treated with 25 μM PIP after SNCA transfection for 24 h. In addition, the rate of cell death was markedly suppressed by PIP treatment when compared to the SNCA group, as determined by propidium iodide (PI)-Hoechst staining (). We also investigated whether PIP affects SNCA levels. PIP treatment decreased SNCA protein level in SK-N-SH cells, while CoQ10 had no effect (, Figure S3). No changes were observed in Hs-SNCA mRNA levels in any group ().
Figure 4. PIP improves cell viability and reduces cytotoxicity by SNCA degradation. (A–D) Optimal PIP treatment concentration (A and B) and time (C and D) were determined in SK-N-SH cells by evaluating cell viability and cytotoxicity with the MTT and LDH assays, respectively. The normalized ratio for the con group was taken as 1. (E) Apoptotic SK-N-SH cells were identified by PI (red) and Hoechst (blue) staining. Scale bar: 50 µm. (F-G) Cell death rates (F) and SNCA-transfected neurons (G) were quantified in SK-N-SH cells. The normalized ratio for the con group was taken as 1. (H) Immunoblot results of Hs-SNCA level in SK-N-SH cells. (I) Quantitative analysis of Hs-SNCA level in SK-N-SH cells. ACTB was used as a loading control. The normalized ratio for the SNCA group was taken as 1. (J) Representative immunofluorescence images showing SK-N-SH cells transfected with pmCherry-N1 or pmCherry-N1-SNCA stained with the anti-phospho SNCA antibody. Scale bar: 10 µm. (K) Hs-SNCA mRNA expression after PIP treatment in SK-N-SH cells was assessed by RT-PCR. Data are expressed as means ± SD (one-way analysis of variance). #P < 0.05, ####P < 0.0001 vs. con; *P < 0.05, **P < 0.01, ****P < 0.0001 vs. SNCA (n = 3).
Autophagy is a cellular mechanism for eliminating pathological proteins [Citation9]. Lipid-conjugated MAP1LC3/LC3 (microtubule-associated protein 1 light chain 3; LC3-II) is known as a marker of autophagosomes [Citation27]. Increased LC3-II could indicate either increased formation of autophagosomes or inhibition of autophagy flux. Efficient flux of autophagy should result in a decrease in the substrates, such as SQSTM1/p62, a polyubiquitin-binding protein. PIP treatment reversed the increased level of LC3-II and SQSTM1/p62 induced by SNCA overexpression alone (). Treatment with rapamycin (Rap, 40 nM for 6 h) as an autophagy agonist also increased the LC3-II and SQSTM1/p62 levels in the SNCA group relative to the control group, whereas this was reversed by PIP treatment (). To further evaluate autophagy flux, cells were treated with bafilomycin A1 (BafA1, 100 nM for 6 h), a vacuolar-type H+-translocating ATPase inhibitor which blocks autophagosome-lysosome fusion. In the presence of BafA1, no obvious changes in LC3-II and SQSTM1/p62 levels were observed in any group (), confirming the activation of autophagy flux after PIP treatment. Interestingly, we found that the PIP treatment-induced decrease in SNCA level was abolished in the present of BafA1, indicating that SNCA was degraded by ALP ().
Figure 5. PIP promotes SNCA degradation via the ALP. (A) SK-N-SH cells were transfected with SNCA, and after 24 h, PIP was added at a concentration of 25 μM for 24 h. LC3-II and SQSTM1/p62 expression were elevated by western blotting in the presence of Rap (40 nM for 6 h) and BafA1 (100 nM for 6 h). (B–C) Quantitative analysis of LC3-II (B) and SQSTM1/p62 (C) levels in SK-N-SH cells. The normalized ratio for the con group was taken as 1. #P < 0.05, ####P < 0.0001 vs. con; *P < 0.05, **P < 0.01, ***P < 0.001, ****P < 0.0001 vs. SNCA. (D) SK-N-SH cells were transfected with SNCA, and after 24 h, PIP was added at a concentration of 25 μM for 24 h. Hs-SNCA expression was elevated as shown by western blotting in the presence of BafA1 (100 nM for 6 h). (E) Quantitative analysis of Hs-SNCA level in SK-N-SH cells. The normalized ratio for the SNCA+BafA1 group was taken as 1. Data are expressed as the means ± SD (one-way analysis of variance; n = 3). (F) Autophagy flux was evaluated by counting autophagosome (RFP-GFP double positive puncta) and autolysosomes (RFP-single positive puncta) using mRFP-GFP-LC3 primary neurons. Scale bar: 10 µm. (G) The mean number of RFP and GFP dots were determined manually (n = 10 cells). Data are expressed as the means ± SD (one-way analysis of variance; n = 3).
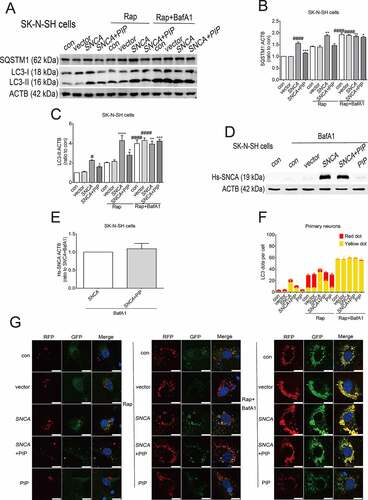
We next used tandem monomeric red fluorescent protein (mRFP)-green fluorescent protein (GFP)-LC3 primary neurons to estimate the level of autophagy flux [Citation28]. mRFP was used to label and track LC3, and the weakening of GFP indicated the fusion of lysosomes and autophagosomes to form autophagosomes. As GFP loses its fluorescence at the acidic pH level in lysosomes, GFP fluorescence is quenched after fusion of autophagosomes and lysosomes, while mRFP is relatively stable, so only red fluorescence is detected. The yellow dots indicate autophagosomes and the red dots indicate autolysosomes. We found that the number of RFP-GFP double positive puncta (yellow dot) was decreased after PIP treatment as compared with the SNCA group; after autophagy induction with Rap, the majority of LC3 puncta in SNCA group was RFP-GFP double positive, while there was mostly RFP-single positive (red dot) in the PIP treatment group. Addition of BafA1 blocked degradation, cells in each group could observe more equivalent RFP-GFP double positive puncta (). Taken together, these results suggest that PIP treatment promotes SNCA degradation via activation of autophagy flux.
PIP promotes autophagy flux via P2RX4 activation
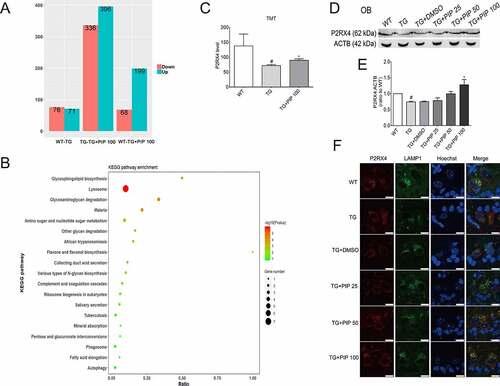
We compared the OB proteome of 6-months-old TG mice and TG mice treated with 100 mg/kg PIP with age-matched WT mice using the TMT quantitative mass spectrometric technique. A total of 147 differentially expressed proteins were identified between WT and TG mice, and the changes of 29 proteins were reversed by PIP treatment (). The analyses of biological process showed that ALP may be a potential target of PIP treatment (). Western blotting validated the change in differentially expressed protein P2RX4, which was associated with the process of autophagosome and lysosome fusion (). Consistent with western blotting, immunofluorescence analyses showed widely distributed P2RX4 in lysosome of OB from PIP-treatment mice when compared to the TG mice (, Figure S4).
Figure 6. TMT quantitative proteomic experiments show P2RX4 as an effective target for PIP-induced SNCA autophagic degradation. (A) Differential protein quantitative results of the mouse OB proteome in 6-months-old TG mice before and after 100 mg/kg PIP treatment compared to age-matched WT mice. P < 0.05. (B) Kyoto Encyclopedia of Genes and Genomes (KEGG) analysis shows that the ALP may be a potential target for PIP treatment. (C) TMT quantitative proteomic shows that P2RX4 is upregulated after PIP treatment in OB. (D) Western blotting validated the change in P2RX4. (E) Quantitative analysis of P2RX4 level in OB. The normalized ratio for the WT group was taken as 1. (F) Representative immunofluorescence images showing the colocalization of P2RX4 and LAMP1 (lysosome marker) from mice slices of OB. Scale bar: 10 µm. Data are expressed as means ± SD (one-way analysis of variance). #P < 0.05 vs. WT; *P < 0.05 vs. TG (n = 3).
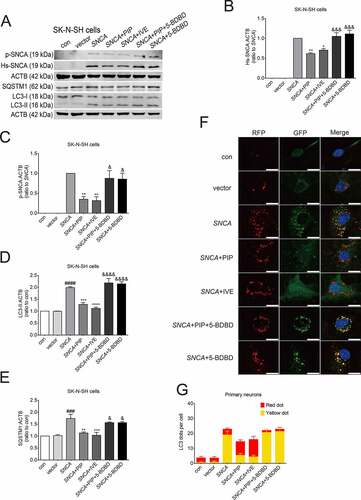
We next investigated whether the SNCA autophagic degradation caused by PIP treatment was modulated through P2RX4 activation. Ivermectin (IVE, 10 μM for 24 h), a positive allosteric effector of P2RX4 [Citation29], increased SNCA degradation in accordance with PIP treatment group. Furthermore, 5-BDBD (5 μM for 24 h), a potent P2RX4 receptor antagonist [Citation30], suppressed SNCA degradation regardless of PIP treatment (). Consistent with the PIP treatment group, the LC3-II and SQSTM1/p62 levels were still decreased in the IVE group. In addition, there was no variation in LC3-II and SQSTM1/p62 levels between the SNCA and 5-BDBD groups (). The number of RFP-GFP double positive puncta was decreased after PIP and IVE treatment compared with the SNCA alone overexpression group, and there was no difference between the SNCA and 5-BDBD groups (). These results suggest that P2RX4 activation is necessary for the therapeutic effect of PIP.
Figure 7. PIP promotes SNCA autophagic degradation via P2RX4 activation. SK-N-SH cells were transfected with SNCA, and after 24 h, PIP was added at a concentration of 25 μM for 24 h. IVE (a positive allosteric effector of P2RX4; 10 μM for 24 h) served as a positive control, while 5-BDBD (a potent P2RX4 receptor antagonist; 5 μM for 24 h) served as a negative control. (A) Hs-SNCA, p-SNCA, LC3-II and SQSTM1/p62 levels were elevated by western blotting. (B–C) Quantitative analysis of Hs-SNCA (B) and p-SNCA (C) levels in SK-N-SH cells. The normalized ratio for the SNCA group was taken as 1. (D–E) Quantitative analysis of LC3-II (D) and SQSTM1/p62 (E) levels in SK-N-SH cells. The normalized ratio for the con group was taken as 1. (F) Autophagy flux was evaluated by counting autophagosome (RFP-GFP double positive puncta) and autolysosomes (RFP-single positive puncta) in mRFP-GFP-LC3 primary neurons. Scale bar = 10 µm. (G) The mean number of RFP and GFP dots were determined manually (n = 10 cells). Data are expressed as means ± SD (one-way analysis of variance). ###P < 0.001, ####P < 0.0001 vs. con; *P < 0.05, **P < 0.01, ***P < 0.001, ****P < 0.0001 vs. SNCA; &P < 0.05, &&&P < 0.001, &&&&P < 0.0001 vs. SNCA+PIP (n = 3).
PIP promotes autophagy flux by enhancing autophagosome-lysosome membrane fusion via P2RX4 activation
Completion of autophagy is dependent on both lysosome function and autophagosome-lysosome fusion [Citation11], and P2RX4 activation promotes the fusion of the lysosome membrane with the autophagosome [Citation17]. STX17 (syntaxin17), a component of soluble N-ethylmaleimide-sensitive factor-attachment protein receptors (SNARE complex), promotes the fusion of the autophagosome and lysosome by interacting with the SNARE protein vesicle-associated membrane protein 8 on the lysosome [Citation12]. It has been reported that the inhibition of STX17 results in the accumulation of autophagosomes accompanied by unchanged autolysosomes, which indicates the blocking of autophagosome and lysosome fusion [Citation31]. We found increased STX17 after PIP and IVE treatment compared to the SNCA alone group, and 5-BDBD suppressed this increase (). These results suggest that PIP promotes autophagosome-lysosome membrane fusion, thereby activating autophagy flux. Otherwise, western blotting showed a decrease in the level of LC3-II and SQSTM1/p62 of OB from PIP-treated mice when compared with TG mice. And STX17 was increased after PIP treatment. These results confirmed that PIP treatment activated autophagy flux by enhancing autophagosome-lysosome membrane fusion in OB of SNCA-induced PD mice ().
Figure 8. PIP promotes autophagic flux by enhancing autophagosome-lysosome fusion via P2RX4 activation. (A) STX17 level was elevated as shown by western blotting in SK-N-SH cells. (B) Quantitative analysis of STX17 level in SK-N-SH cells. The normalized ratio for the con group was taken as 1. Data are expressed as means ± SD (one-way analysis of variance). #P < 0.05 vs. con; *P < 0.05 vs. SNCA; &P < 0.05 vs. SNCA+PIP (n = 3). (C) LC3-II, SQSTM1/p62 and STX17 levels were elevated as shown by western blotting of OB. (D–F) Quantitative analysis of LC3-II (D), SQSTM1/p62 (E) and STX17 (F) levels in OB. ACTB was used as a loading control. The normalized ratio for the WT group was taken as 1. Data are expressed as means ± SD (one-way analysis of variance). #P < 0.05 vs. WT; *P < 0.05 vs. TG (n = 3).
Discussion
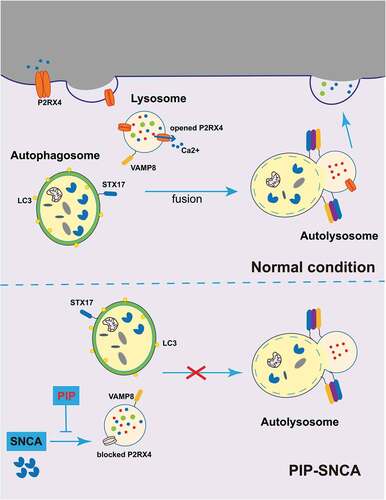
The current study found that PIP alleviated olfactory impairment and delayed the progression of motor impairment induced by SNCA overexpression in a mouse model of PD. PIP also improved cell viability and suppressed cytotoxicity caused by SNCA overexpression. These protective effects were exerted by enhancing autophagosome and lysosome membrane fusion via P2RX4 activation, which resulted in SNCA autophagic degradation ().
Figure 9. PIP exerts neuroprotective effects against SNCA-induced injury by activating P2RX4 and promoting autophagy flux. SNCA inhibits autophagy flux by inhibiting STX17, which drives autophagosome-lysosome membrane fusion via P2RX4 inactivation. PIP restores P2RX4 activity and promotes autophagy flux, which resulted in pathological SNCA autophagic degradation. PIP: piperine.
Olfactory dysfunction is one of the early symptoms of PD [Citation3]. The autopsy results of PD patients show that pathological SNCA first appears in OB and then spreads to the substantia nigra and other nuclear grays of the midbrain [Citation5,Citation6]. At this point, most patients probably cross the threshold to the symptomatic phase. The SNCA transgenic mice used in the present study showed olfactory dysfunction which was accompanied by late motor deficits as previously reported [Citation8]. At present, the therapeutic options for PD treatment are mainly aimed at its motor symptoms when the disease has already reached an irretrievable stage [Citation20]. Therefore, early intervention when non-motor symptoms appear in the disease may be an effective method to delay the progression of the disease, which makes the development of novel therapeutic strategies for PD treatment more urgent.
PIP is used in Chinese medicine for its anti-inflammatory and anti-oxidant properties [Citation21]. We previously showed that PIP has neuroprotective effects in a variety of PD models, including those induced by MPTP, rotenone, and 6-OHDA [Citation24,Citation32,Citation33]. In the present study, we investigated PIP as a potential agent for early PD treatment using cellular and mouse models of PD induced by SNCA overexpression. PIP administration alleviated olfactory deficits and delayed motor deficits in SNCA transgenic mice and mitigated the decrease of dopamine levels in the striatum, which was accompanied by SNCA autophagic degradation. It also protected SK-N-SH cells against blocked autophagy flux resulting from SNCA overexpression via activation of P2RX4.
Insufficient clearance of pathological SNCA by the ALP has been implicated in PD [Citation34]. Several studies reported that ALP impairment was associated with lysosome depletion in brain tissue from PD patients [Citation35–37]. Genetic studies have further supported the connection between PD and ALP impairment [Citation38], which indicated that lysosome impairment may play a pathogenic role in the disease process. This evidence indicates that alterations in the ALP may be preferentially involved in PD [Citation38]. Alterations in lysosome function, either in the fusion process or related to the function of lysosome enzymes, can result in the degradation of toxic cellular waste [Citation39]. In the present study, PIP reversed the reduction of STX17 induced by SNCA overexpression, which indicates that PIP activates autophagosome-lysosome fusion, thereby promoting SNCA autophagic degradation.
Tissue-based quantitative clinical proteomics has emerged as an unbiased mechanistic and discovery tool to study various neurological disorders [Citation40–42]. The construction of the TMT quantitative proteome in the OB of WT, TG and PIP treatment mice led us to explore the mechanism of PIP. Our proteomic data revealed that ALP may be potential target for PIP treatment. Furthermore, the change in the differentially expressed protein P2RX4, which is associated with the process of autophagosome and lysosome fusion, was validated by western blotting. In this study, we also found that a positive allosteric effector of P2RX4 degraded SNCA, while a P2RX4 antagonist suppressed SNCA degradation regardless of PIP treatment. Furthermore, this effect was exerted via autophagy flux promotion by enhancing autophagosome-lysosome membrane fusion.
P2RX4 locates in the plasma membrane as a trimer structure. In order to activate P2RX4, three ATP molecules bind to extracellular domains to induce the formation of nonselective cation channels composed of transmembrane regions, which enables ions (K+, Na+, Ca2+) to flow through the membrane rapidly and participate in various physiological and pathological processes. In a preliminary study, SNCA was found to decrease P2RX4. Whether SNCA binds to the ATP activator site of P2RX4 or affects the conformational change through point mutations of P2RX4, thereby inactivating P2RX4, is an urgent problem that needs to be addressed in future research. Additional insight into how PIP affects individual steps of the P2RX4 activation will require a more careful examination.
In conclusion, our results provide evidence that PIP has an early therapeutic effect in SNCA-induced PD models that is exerted via P2RX4 activation and promotion of autophagy flux. Our findings indicate that SNCA autophagic degradation may be an effective treatment for PD which could delay the progression of the disease.
Materials and methods
Animals
Thy 1-SNCA TG mice expressing Hs-SNCA (017682) and CAG-RFP-EGFP-LC3 mice (027139) were purchased from the Jackson Laboratory and maintained on a C57BL/6 N background. All mice were housed at room temperature (22–25°C) under a 12-h light/dark cycle. The Animal Care and Use Committee of the Capital Medical University approved the procedures involving animals. Animal experiments were performed in accordance with the National Institutes of Health (NIH) Guide for Laboratory Animals. TG male mice aged 6-months-old were randomly divided among the TG group, dimethyl sulfoxide (DMSO) group, PIP group and CoQ10 group, while WT littermate mice served as normal controls. The DMSO, PIP and CoQ10 groups respectively received 2% DMSO, PIP (25, 50 and 100 mg/kg) and CoQ10 (200 mg/kg) dissolved in 2% DMSO by oral administration for 6 weeks.
Reagents
Antibodies against the following proteins were used in this study: ACTB (1:5000; Sigma-Aldrich, A5060), TH (1:1000; Sigma-Aldrich, T2928), p-SNCA (Ser129, 1:1000; Abcam, ab51253), p-SNCA (Ser129, 1:1000; Wako, 015–25191), Hs-SNCA (1:2000; Abcam, ab80627), P2RX4 (1:1000; ABclonal, A6682), LAMP1 (1:1000; Abcam, ab25245), STX17 (1:250; Sigma-Aldrich, HPA001204), SQSTM1/p62 (1:2000, Sigma-Aldrich, P0067) and LC3 (1:1000; Sigma-Aldrich, L7543). Fluorophore-conjugated secondary antibodies were as follows: goat anti-rabbit IRdye680 (LI-COR Biosciences, 926–68071), goat anti-mouse IRdye680 (LI-COR Biosciences, 926–68070), goat anti-rabbit IRdye800 (LI-COR Biosciences, 926–32211) and goat anti-mouse IRdye800 (LI-COR Biosciences, 926–32210). Other reagents included PIP (Abcam, ab142933), CoQ10 (Sigma-Aldrich, C9538), BafA1 (Selleck, S1413), rapamycin (Sigma-Aldrich, V900930), ivermectin (MCE, HY-15310) and 5-BDBD (Santa Cruz Biotechnology, sc-290784).
Buried food pellet test
The buried food pellet test was used to test olfactory function and carried out as previously described [Citation7,Citation43]. Two days before the test, the mice were restricted to 2.5 g chow per day until their body weight decreased to 90% of the starting value. For the test, a clean cage was covered with 3 cm of bedding, with sweetened corn buried 0.5 cm below the surface. The location of the food was randomly placed daily. Each mouse was then placed in the cage and the time taken to dig up the food was recorded up to a maximum time of 5 min. The surface pellet test was carried out in a similar manner except that the sweetened corn was placed on the bedding [Citation7,Citation43].
Open field test
Olfactory behavior was tested as previously described, with minor modifications [Citation44,Citation45]. Experiments were performed in an open field. A vessel (3 × 3 × 3 cm) was placed in each corner of the test box (72 × 72 × 30 cm) and mice were individually acclimated for 15 min before testing. The test substance was then placed in one vessel while the other three vessels contained vehicle (water) only. Each mouse underwent three consecutive trials in which they were presented with sweetened corn, female mouse urine or paprika. The time that the mouse remained in each corner was recorded. The preference index was calculated as the ratio of time spent in the corner with the test substance to the total time spent in the test.
Sucrose preference test
The sucrose preference test was used to exclude the effect of depression on olfactory function [Citation46]. In this experiment, mice were individually housed for three days. Two bottles of 1% sucrose water were given to each mouse for the first 24 h. On the second day, one bottle of plain water and one bottle of 1% sucrose water were given to each mouse for 24 h, and in the third 24 h period, the position of the two bottles was switched. The amount of sucrose water drunk by each mouse in the third period was calculated. Sucrose consumption = sucrose water intake/(sucrose water intake + water intake) × 100.
Rotarod test
The rotarod test was used to evaluate motor function [Citation47]. Mice were trained twice a day for 2 days with rotation speed increasing from 4–40 rpm in 5 min. The time that the mouse remained on the rod when tested on the next three days was recorded and averaged.
Pole test
The pole test was used to evaluate the degree of bradykinesia and was carried out as previously described [Citation48]. Briefly, a mouse was placed at the top of a pole with a height of 50 cm and a radius of 4 mm, and the time taken for the mouse to reach the ground was recorded over five trials and averaged.
Immunohistochemistry
Immunohistochemistry was carried out as previously described [Citation23]. Mice were anesthetized with 8% chloral hydrate and perfused with physiological saline followed by 4% paraformaldehyde. Then, the brain was fixed in 4% paraformaldehyde and embedded in 30% sucrose, then cut into 20-µm thick coronal sections. Sections were rinsed three times in phosphate-buffered saline (PBS; Zhongshan Golden Bridge Biotechnology Co., PV-9002, ZLI-9062) and then incubated in 3% H2O2 for 15 min to block endogenous peroxidase activity. After washing three times in PBS, sections were incubated in 10% goat serum (Cell Signaling Technology, 5425) followed by permeabilization with 0.3% TritonX-100 (Sigma-Aldrich, T9284) for 60 min at room temperature and incubation overnight at 4°C in anti-TH antibody. A biotinylated goat anti-mouse secondary antibody (1:200; Zhongshan Golden Bridge Biotechnology Co., PV-9002) and diaminobenzidine (Zhongshan Golden Bridge Biotechnology Co., ZLI-9019) were used to detect immunoreactivity. We selected 20 successive sections from each brain for examination. The total number of TH-positive neurons was determined using the optical fractionator probe. Three mice from each group were used for this measurement.
HPLC
Striatum tissue was weighed and homogenized in 0.1 M perchloric acid and incubated on ice for 1 h, then centrifuged at 12,000 g for 20 min at 4°C. The supernatant was diluted 2:1 in the mobile phase consisting of 63.5 mM citric acid monohydrate, 60.9 mM trisodium citrate dehydrate, 0.1 M EDTA, 0.5 M Sodium 1-octadecanesulfonate (Sigma-Aldrich, 293946), pH 4.3 and injected into the HPLC column under analytical conditions. Data were expressed as pg dopamine per mg tissue.
Sample preparation and western blotting
Brain tissue and cell homogenates were lysed in radio immunoprecipitation buffer (RIPA, APPLYGEN, C1053) with added protease and phosphatase inhibitors (Roche Diagnostics, 04693132001 and 4906837001), according to previously described methods [Citation27]. Homogenates were centrifuged at 12,000 g for 30 min at 4°C, and the supernatant fraction was collected for analyses. After centrifugation, the supernatant fraction was collected and termed the RIPA soluble fraction. The pellet was resuspended in 8 M urea and termed the RIPA insoluble fraction [Citation49]. The protein concentration was determined using a bicinchoninic acid protein assay kit (BCA; Pierce Biotechnology, 23227) according to the manufacturer’s instructions. Proteins (30 µg) were separated by 12%–15% sodium dodecyl sulfate polyacrylamide gel electrophoresis and transferred onto a polyvinylidene fluoride membrane. After blocking with 5% milk for 1 h, membranes were incubated with primary antibodies overnight at 4°C. Secondary antibodies were incubated for 1 h. ACTB was used as a loading control. Immunoblots were visualized with a LI-COR IR Odyssey imaging system (Lincoln, NE, USA) and quantified using ImageJ software (NIH, Bethesda, MD, USA).
Cell culture and transfection
The human wild-type SNCA cDNA (GenBank accession no. NM_000345) was purchased from Vigene Biosciences (CH884935). The cDNA was cloned into pcDNA3.1, pmCherry-N1 and pEGFP-N1. SK-N-SH cells obtained from the American Type Culture Collection (HTB-11) were maintained in DMEM with 10% FBS and penicillin/streptomycin (100 U/ml) until reaching 70%–80% confluence, then transfected with plasmids using Lipofectamine 2000 (Invitrogen, 11668019) according to the manufacturer’s instructions. Cells were incubated at 37°C in a humidified atmosphere of 5% CO2 for the indicated times.
Primary cortical neuronal culture and infection lentivirus
Lentivirus gene transfer vector encoding human wild-type SNCA were purchased from Genechem (LV-SNCA (7181–1)). Primary cortical neuronal cultures were prepared from CAG-RFP-EGFP-LC3 mouse embryos (E14–15), as previously described [Citation23]. Dissociated neurons were cultured in 6- or 24-well plates on cover slips coated with 0.1 mg/ml poly-L-lysine (Sigma-Aldrich, P1524) in Neurobasal medium (Gibco, 21103–049) supplemented with L-glutamine (0.5 mM) and 50× B27 supplement (for a final concentration of 1×; Gibco, 17504–044). After 7 days, primary neurons were infected with lentivirus.
Cell viability and LDH assay
Cell viability was determined with the MTT assay as previously described [Citation23]. Briefly, cells were seeded in a 96-well microplate (1 × 10⁴ cells/well) and cultured for 24 h. The medium was replaced by MTT (Sigma-Aldrich, M2128) at a final concentration of 0.5 mg/ml, followed by incubation for 4 h. Cells were washed twice with PBS and formazan crystals were dissolved in 100 µl DMSO. Absorbance was read at 490 nm with a microplate reader (PerkinElmer, Waltham, MA, USA). The LDH assay was carried out using a cytotoxicity detection kit (Roche Diagnostics, 4744926001), following the manufacturer’s protocol.
PI-Hoechst staining
Apoptotic cells were identified by labeling with PI (0.1 mg/ml; Sigma-Aldrich, P4170) and Hoechst 33432 (0.5 mg/ml, Sigma-Aldrich, B2261) for 10 min at 37°C. PI-positive cells were counted under an epifluorescence microscope at excitation and emission wavelengths of 535 and 594 nm, respectively. Images were acquired by high-content analyses to evaluate changes in the PI signal.
Immunofluorescence and confocal microscopy
Cells were seeded on poly-L-lysine-coated coverslips in 24-well plates and transfected with SNCA plasmids. After 24 h, cells were treated with PIP for 24 h, then fixed with 4% paraformaldehyde for 30 min, washed 3 times with PBS, and permeabilized with 0.3% TritonX-100 in PBS for 10 min at room temperature. After blocking with 5% normal goat serum for 1 h, cells were incubated with p-SNCA (1:1000, Wako, 015–25191) overnight at 4°C followed by Alexa Fluor 488 (Invitrogen, A11034)-conjugated secondary antibody for 1 h at room temperature. Cell nuclei were visualized by counterstaining with DAPI (Sigma-Aldrich, D9542) and imaged with a confocal microscope (TCS SP8; Leica, Solms, Germany).
Mouse brains were fixed with 4% paraformaldehyde and embedded in 30% sucrose, then cut into 30-µm thick coronal sections. Proteinase-K (PK) (New England Biolabs, P8107S) treatment (20 µg/ml in PBST buffer at 37°C for 20 min) was applied to mouse brain slices to remove soluble components from tissues and was followed by immunohistochemistry. Brains were mounted on slides with 70% glycerol and imaged using a confocal microscope.
RNA isolation and RT-PCR
Total RNA was isolated from SK-N-SH cells or OB tissue with an RNAprep Pure Tissue Kit (TIANGEN biotech, DP431), according to the manufacturer’s instructions. The concentration was determined with a NanoDrop 2000 spectrophotometer (NanoDrop Technologies, Wilmington, DE, USA), and 200 ng of total RNA was reverse transcribed using the Transcriptor First Strand cDNA Synthesis Kit (TIANGEN biotech, KR116). The amount of cDNA was evaluated by RT-PCR on a 7500 Fast Real-Time PCR System (Applied Biosystems, Foster City, CA, USA) using primer sets for Hs-SNCA (forward: 5ʹ-CTGGAAGATATGCCTGTGGAT C-3ʹ; reverse: 5ʹ-AGCACTTGTACAGGATGG AAC-3ʹ) and ACTB (forward: 5ʹ-GGCTGTATTCCCCTCCATCG −3ʹ; reverse: 5ʹ-CCA GTTGGTAACAATGCCATG T-3ʹ). Transcript levels were calculated with the cycle threshold method.
TMT labeling of peptides and LC-MS/MS analyses
Tissues were mixed with an appropriate amount of lysis buffer (7 M urea [Bio-Rad, 161–0731], 2 M thiourea [Sigma-Aldrich, T7875], 0.1% CHAPS, [Bio-Rad, 161–0460]) and then ground with titanium dioxide grinding beads. The milled sample was centrifuged at 5,000 g for 5 min, and the supernatant was centrifuged at 14,000 g for 30 min. The concentration of peptides was measured with the Bradford Protein Assay Kit (Thermo Scientific, 23200). The peptides were subjected to deoxidation and digestion with trypsin after blocking using the TMT Reagent Kit (Thermo Scientific, 90064). The peptide mixture from each group was then labeled with different TMT reagents.
TMT-labeled peptides were dissolved in 100 µl mobile phase (consisting of 2% C2H3N in water), centrifuged at 14,000 g for 20 min, and the supernatant was reserved for later use. A total of 400 µg of the enzymolysis treated-BSA (Sigma-Aldrich, A3311) was used for separation (column temperature 45°C, measure wavelength 214 nm), and 100 μl of prepared sample was detected at a flow rate of 0.7 ml/min. The components obtained by reverse phase separation at high pH were reconstituted with 20 μl of 2% methanol and 0.1% formic acid and centrifuge at 8848 g for 10 min. Supernatant (10 μl) was detected at a flow rate of 350 nl/min. The LC-MS/MS analyses was performed using the Uniprot Mus musculus database.
Statistical analysis
Western blotting were analyzed as previously described [Citation23]. Relative optical density values for bands corresponding to Hs-SNCA, p-SNCA, P2RX4, LC3-II, SQSTM1/p62 and STX17 were normalized to the value for ACTB. For cell viability and LDH assays, values for the control group were taken as 1. Statistical analyses were carried out using Prism 6 software (GraphPad Inc., La Jolla, CA, USA). Results were presented as means ± SD from at least three independent experiments. Statistical analyses were performed using analysis of variance followed by a Bonferroni’s post-hoc correction for multiple comparisons. Differences were considered significant at P < 0.05.
Supplemental Material
Download Zip (3.8 MB)Disclosure statement
The authors declare that they have no competing interests.
Supplementary material
Supplemental data for this article can be accessed here.
Additional information
Funding
Related Research Data
References
- Kalia LV, Lang AE. Parkinson’s disease. Lancet. 2015;386(9996):896–912.
- Doty RL. Olfactory dysfunction in Parkinson disease. Nat Rev Neurol. 2012;8(6):329–339.
- Breen KC, Drutyte G. Non-motor symptoms of Parkinson’s disease: the patient’s perspective. J Neural Transm. 2013;120(4):531–535.
- Jellinger KA. Neuropathobiology of non-motor symptoms in Parkinson disease. J Neural Transm. 2015;122(10):1429–1440.
- Doty RL. Olfactory dysfunction in neurodegenerative diseases: is there a common pathological substrate? Lancet Neurol. 2017;16(6):478–488.
- Braak H, Del TK, Rub U, et al. Staging of brain pathology related to sporadic Parkinson’s disease. Neurobiol Aging. 2003;24(2):197–211.
- Fleming SM, Tetreault NA, Mulligan CK, et al. Olfactory deficits in mice overexpressing human wildtype -synuclein. Eur J Neurosci. 2008;28(2):247–256.
- Chesselet M, Richter F, Zhu C, et al. Model of Parkinson’s Disease: the Thy1-aSyn (“Line 61”) Mice. Neurotherapeutics. 2012;9(2):297–314.
- Levine B, Kroemer G. Biological functions of autophagy genes: a disease perspective. Cell. 2019;176(1–2):11–42.
- Ebrahimi-Fakhari D, McLean PJ, Unni VK. Alpha-synuclein’s degradation in vivo: opening a new (cranial) window on the roles of degradation pathways in Parkinson disease. Autophagy. 2012;8(2):281–283.
- Jaishy B, Abel ED. Lipids, lysosomes, and autophagy. J Lipid Res. 2016;57(9):1619–1635.
- Fu R, Deng Q, Zhang H, et al. A novel autophagy inhibitor berbamine blocks SNARE-mediated autophagosome-lysosome fusion through upregulation of BNIP3. Cell Death Dis. 2018;9(2):243.
- Mauvezin C, Nagy P, Juhász G, et al. Autophagosome–lysosome fusion is independent of V-ATPase-mediated acidification. Nat Commun. 2015;6(1):7007.
- Kim DK, Lim HS, Kawasaki I, et al. Anti-aging treatments slow propagation of synucleinopathy by restoring lysosomal function. Autophagy. 2016;12(10):1849–1863.
- Chen L, Xie Z, Turkson S, et al. 53T human α-synuclein overexpression in transgenic mice induces pervasive mitochondria macroautophagy defects preceding dopamine neuron degeneration. J Neurosci. 2015;35(3):890–905.
- Antonioli L, Blandizzi C, Fornai M, et al. P2X4 receptors, immunity, and sepsis. Curr Opin Pharmacol. 2019;47:65–74.
- Murrell-Lagnado RD, Frick M. P2X4 and lysosome fusion. Curr Opin Pharmacol. 2019;47(4):126–132.
- Huang P, Zou Y, Zhong XZ, et al. P2X4 forms functional ATP-activated cation channels on lysosomal membranes regulated by luminal pH. J Biol Chem. 2014;289(25):17658–17667.
- Zhong XZ, Yang Y, Sun X, et al. Methods for monitoring Ca2+ and ion channels in the lysosome. Cell Calcium. 2017;64:20–28.
- Savica R, Boeve BF, Mielke MM. When do α-synucleinopathies start? An epidemiological timeline. Jama Neurol. 2018;75(4):503.
- Krishna MS, Joy B, Sundaresan A. Effect on oxidative stress, glucose uptake level and lipid droplet content by Apigenin 7, 4ʹ-dimethyl ether isolated from Piper longum L. J Food Sci Technol. 2015;52(6):3561–70.
- Lu Y, Liu J, Li H, et al. Piperine ameliorates lipopolysaccharide-induced acute lung injury via modulating NF-κB signaling pathways. Inflammation. 2016;39(1):303–308.
- Liu J, Liu W, Lu Y, et al. Piperlongumine restores the balance of autophagy and apoptosis by increasing BCL2 phosphorylation in rotenone-induced Parkinson disease models. Autophagy. 2018;14(5):845–861.
- Liu J, Chen M, Wang X, et al. Piperine induces autophagy by enhancing protein phosphotase 2A activity in a rotenone-induced Parkinson’s disease model. Oncotarget. 2016;7(38):60823.
- Webb JL, Ravikumar B, Atkins J, et al. α-Synuclein is degraded by both autophagy and the proteasome. J Biol Chem. 2003;278(27):25009–25013.
- Rott R, Szargel R, Shani V, et al. SUMOylation and ubiquitination reciprocally regulate α-synuclein degradation and pathological aggregation. Proc Nat Acad Sci. 2017;114(50):13176–13181.
- Du T, Wang L, Duan C, et al. GBA deficiency promotes SNCA/α-synuclein accumulation through autophagic inhibition by inactivated PPP2A. Autophagy. 2015;11(10):1803–1820.
- Siddiqi FH, Menzies FM, Lopez A, et al. Felodipine induces autophagy in mouse brains with pharmacokinetics amenable to repurposing. Nat Commun. 2019;10:1.
- Dhuna K, Felgate M, Bidula SM, et al. Ginsenosides act as positive modulators of P2X4 receptors. Mol Pharmacol. 2019;95(2):210–221.
- Abdelrahman A, Namasivayam V, Hinz S, et al. Characterization of P2X4 receptor agonists and antagonists by calcium influx and radioligand binding studies. Biochem Pharmacol. 2017;125:41–54.
- Vats S, Manjithaya R. A reversible autophagy inhibitor blocks autophagosome-lysosome fusion by preventing Stx17 loading onto autophagosomes. Mol Biol Cell. 2019;30(17):2283–2295.
- Bi Y, Qu P, Wang Q, et al. Neuroprotective effects of alkaloids fromPiper longum in a MPTP-induced mouse model of Parkinson’s disease. Pharm Biol. 2015;53(10):1516–1524.
- Shrivastava P, Vaibhav K, Tabassum R, et al. Anti-apoptotic and anti-inflam matory effect of piperine on 6-OHDA induced Parkinson’s rat model. J Nutr Bio chem. 2013;24(4):680–68 7.
- Boland B, Yu WH, Corti O, et al. Promoting the clearance of neurotoxic proteins in neurodegenerative disorders of ageing. Nat Rev Drug Discov. 2018;17(9):660–688.
- Chu Y, Dodiya H, Aebischer P, et al. Alterations in lysosomal and proteasomal markers in Parkinson’s disease: relationship to alpha-synuclein inclusions. Neurobiol Dis. 2009;35(3):385–398.
- Dehay B, Bove J, Rodriguez-Muela N, et al. Pathogenic lysosomal depletion in Parkinson’s disease. J Neurosci. 2010;30(37):12535–12544.
- Alvarez-Erviti L, Rodriguez-Oroz MC, Cooper JM, et al. Chaperone-mediated autophagy markers in Parkinson disease brains. Arch Neurol. 2010;67(12):1464–1472.
- Bourdenx M, Bezard E, Dehay B. Lysosomes and α-synuclein form a dangerous duet leading to neuronal cell death. Front Neuroanat. 2014;8:83.
- Bonam SR, Wang F, Muller S. Lysosomes as a therapeutic target. Nat Rev Drug Discov. 2019;18(12):923–948.
- Datta A, Chai YL, Tan JM, et al. An iTRAQ-based proteomic analysis reveals dysregulation of neocortical synaptopodin in Lewy body dementias. Mol Brain. 2017;10(1):36.
- Adav SS, Park JE, Sze SK. Quantitative profiling brain proteomes revealed mitochondrial dysfunction in Alzheimer’s disease. Mol Brain. 2019;12(1):8.
- Ping L, Duong DM, Yin L, et al. Global quantitative analysis of the human brain proteome in Alzheimer’s and Parkinson’s disease. SCI Data. 2018;5(1):180036.
- Nathan BP, Yost J, Litherland MT, et al. Olfactory function in apoE knockout mice. Behav Brain Res. 2004;150(1–2):1–7.
- Lazarini F, Gabellec MM, Moigneu C, et al. Adult neurogenesis restores dopaminergic neuronal loss in the olfactory bulb. J Neurosci. 2014;34(43):14430–14442.
- Höglinger GU, Alvarez-Fischer D, Arias-Carrión O, et al. A new dopaminergic nigro-olfactory projection. Acta Neuropathol. 2015;130(3):333–348.
- Alkhlaif Y, Bagdas D, Jackson A, et al. Assessment of nicotine withdrawal-induced changes in sucrose preference in mice. Pharmacol Biochem Be. 2017;161:47–52.
- Dunham NW, Miya TS. A note on a simple apparatus for detecting neurological deficit in rats and mice. J Am Pharm Assoc Am Pharm Assoc. 1957;46(3):208–209.
- Ogawa N, Hirose Y, Ohara S, et al. A simple quantitative bradykinesia test in MPTP-treated mice. Res Commun Chem Pathol Pharmacol. 1985;50(3):435.
- Tian H, Yongquan L, Liu J, et al. Leucine carboxyl methyltransferase downregulation and protein phosphatase methylesterase upregulation contribute toward the inhibition of protein phosphatase 2A by α-synuclein. Front Aging Neurosci. 2018;10:173.