
ABSTRACT
Cardiac function is highly reliant on mitochondrial oxidative metabolism and quality control. The circadian Clock gene is critically linked to vital physiological processes including mitochondrial fission, fusion and bioenergetics; however, little is known of how the Clock gene regulates these vital processes in the heart. Herein, we identified a putative circadian CLOCK-mitochondrial interactome that gates an adaptive survival response during myocardial ischemia. We show by transcriptome and gene ontology mapping in CLOCK Δ19/Δ19 mouse that Clock transcriptionally coordinates the efficient removal of damaged mitochondria during myocardial ischemia by directly controlling transcription of genes required for mitochondrial fission, fusion and macroautophagy/autophagy. Loss of Clock gene activity impaired mitochondrial turnover resulting in the accumulation of damaged reactive oxygen species (ROS)-producing mitochondria from impaired mitophagy. This coincided with ultrastructural defects to mitochondria and impaired cardiac function. Interestingly, wild type CLOCK but not mutations of CLOCK defective for E-Box binding or interaction with its cognate partner ARNTL/BMAL-1 suppressed mitochondrial damage and cell death during acute hypoxia. Interestingly, the autophagy defect and accumulation of damaged mitochondria in CLOCK-deficient cardiac myocytes were abrogated by restoring autophagy/mitophagy. Inhibition of autophagy by ATG7 knockdown abrogated the cytoprotective effects of CLOCK. Collectively, our results demonstrate that CLOCK regulates an adaptive stress response critical for cell survival by transcriptionally coordinating mitochondrial quality control mechanisms in cardiac myocytes. Interdictions that restore CLOCK activity may prove beneficial in reducing cardiac injury in individuals with disrupted circadian CLOCK.
Abbreviations: ARNTL/BMAL1: aryl hydrocarbon receptor nuclear translocator-like; ATG14: autophagy related 14; ATG7: autophagy related 7; ATP: adenosine triphosphate; BCA: bovine serum albumin; BECN1: beclin 1, autophagy related; bHLH: basic helix- loop-helix; CLOCK: circadian locomotor output cycles kaput; CMV: cytomegalovirus; COQ5: coenzyme Q5 methyltransferase; CQ: chloroquine; CRY1: cryptochrome 1 (photolyase-like); DNM1L/DRP1: dynamin 1-like; EF: ejection fraction; EM: electron microscopy; FS: fractional shortening; GFP: green fluorescent protein; HPX: hypoxia; i.p.: intraperitoneal; I-R: ischemia-reperfusion; LAD: left anterior descending; LVIDd: left ventricular internal diameter diastolic; LVIDs: left ventricular internal diameter systolic; MAP1LC3/LC3: microtubule-associated protein 1 light chain 3; MFN2: mitofusin 2; MI: myocardial infarction; mPTP: mitochondrial permeability transition pore; NDUFA4: Ndufa4, mitochondrial complex associated; NDUFA8: NADH: ubiquinone oxidoreductase subunit A8; NMX: normoxia; OCR: oxygen consumption rate; OPA1: OPA1, mitochondrial dynamin like GTPase; OXPHOS: oxidative phosphorylation; PBS: phosphate-buffered saline; PER1: period circadian clock 1; PPARGC1A/PGC-1α: peroxisome proliferative activated receptor, gamma, coactivator 1 alpha; qPCR: quantitative real-time PCR; RAB7A: RAB7, member RAS oncogene family; ROS: reactive oxygen species; RT: room temperature; shRNA: short hairpin RNA; siRNA: small interfering RNA; TFAM: transcription factor A, mitochondrial; TFEB: transcription factor EB; TMRM: tetra-methylrhodamine methyl ester perchlorate; WT: wild -type; ZT: zeitgeber time
Introduction
The heart is among the most metabolically demanding organs in the body, requiring a constant and continual supply of ATP to sustain normal cellular processes. A mismatch between energy supply and demand invariably leads to cardiac dysfunction and heart failure. Mitochondria constitute more than a third of the total cardiac mass and provide the primary source of ATP from the oxidation (OXPHOS) of glucose and fatty acids; that varies predictably in response to cardiac workload across the 24-h day and night cycle [Citation1–4]. Abnormalities in mitochondrial metabolism, resulting from excessive reactive oxygen species (ROS) production, profoundly influence mitochondrial health in cardiometabolic disorders such as obesity, diabetes and myocardial infarction (MI) [Citation5]. Mitochondrial fitness in cardiac myocytes is achieved through coordinated actions of mitochondrial quality control, dynamics (fission/fusion) and selective macroautophagy/autophagy [Citation6]. The circadian is highly conserved throughout evolution and found in almost every cell type, including cardiac myocytes (reviewed in [Citation7]). Ostensibly, the circadian mechanism allows the cell to respond to environmental cues such as nutrient stress or reduced oxygen availability such as imposed during ischemia or hypoxic stress [Citation8]. The circadian mechanism consists of a transcriptional-translational feedback loop that oscillates with a periodicity of 24 h and coincides with the day-light and night-dark cycle. The rhythmic oscillations of Circadian-controlled output genes underlie the diurnal variation of many key physiological processes including blood pressure, heart rate, and metabolism, [reviewed in [Citation7,Citation9,Citation10]. At the molecular level, the circadian mechanism is comprised of a positive loop consisting of the basic helix-loop-helix (bHLH) transcription factors CLOCK (circadian locomotor output cycles kaput) and ARNTL/BMAL1 (aryl hydrocarbon receptor nuclear translocator-like 1). Upon activation, heterodimers of CLOCK and ARNTL are recruited to E-box elements of circadian target genes Per1 (period circadian clock 1) and Per2, and Cry1 (cryptochrome 1 (photolyase-like)) and Cry2, which comprise the negative arm of the feedback loop and inhibit transcription driven by CLOCK-ARNTL [Citation11]. A stabilizing loop that includes the nuclear orphan receptors NR1D1/REV-ERB and RORA/RORα provides an additional level of circadian control through their reciprocal regulation of ARNTL [reviewed in [Citation7,Citation11].
Molecular dissection of circadian feedback loops has revealed an extensive bi-directional connection between the circadian mechanism in tissues such as the heart and transcription factors involved in mitochondrial metabolism and mitochondrial quality control [Citation12–14]. Furthermore, loss of ARNTL is linked to cardiac developmental abnormalities and cardiac hypertrophy [Citation15]. Indeed, circadian misalignment, commonly seen with jet lag or shift work, has been associated with metabolic dysregulation [Citation8,Citation16–18] and greater incidence of cardiac injury following myocardial infarction [Citation19]. The underlying mechanisms for this phenomenon remain unknown. It also remains undetermined whether the circadian core regulatory genes such Clock impinge on vital cellular processes such as mitochondrial quality control and bioenergetics that are crucial for cardiac repair after ischemic injury. Since several genes required for mitochondrial quality control processes contain E- boxes elements for the Clock gene and exhibit diurnal regulation, we posit that the circadian core gene Clock may play a central role in regulating these critical processes during cardiac ischemic stress. Herein, we showed that several genes required for mitochondrial quality control, dynamics and bioenergetics in cardiac myocytes were transcriptionally controlled by Clock. We further showed that impaired autophagy and mitochondrial quality control mechanisms in Clock deficiency exacerbated cardiac injury during acute myocardial ischemia. Our findings highlight a novel signaling pathway that functionally links the circadian core regulator gene Clock to mitochondrial fitness during ischemic cardiac stress.
Results
Circadian Clock gene disruption impairs cardiac structure and function
Since circadian misalignment such as in shift workers, has been associated with greater incidence of cardiac impairment following myocardial injury, we reasoned that disruption of the circadian core protein, CLOCK, may influence cardiac outcomes following injury by interfering with key cellular processes such as mitochondrial metabolism, bioenergetics, and quality control mechanisms. To explore this possibility, we assessed Clock mRNA and protein expression levels in hearts of mice subjected to 45 min coronary artery ligation and 24-h reperfusion. As shown by mRNA and western blot analysis, ,, a significant reduction in Clock mRNA and protein expression level was observed in mice following ischemia-reperfusion (I-R) compared to sham-operated controls.
Figure 1. Circadian Clock gene disruption impairs cardiac structure and function. (A) Clock mRNA expression in murine hearts from sham-operated controls and following ischemia-reperfusion (I-R). (B) Left panel; western blot analysis of CLOCK protein expression in murine cardiac muscle in sham-operated controls and following I-R; ACTA1 was used as a loading control; Right panel Quantification of western blot analysis from Left panel. (C) Upper, representative electron micrographs (EM) of murine cardiac muscle from wild-type (WT) and CLOCK Δ19/Δ19 hearts from sham-operated controls and I-R, (see methods for details), Center panel, magnified regions of the images, magnification = 500 nm, 19,000X, Lower panel, Quantitative analysis for EM images were derived from n = 4 randomly selected grids examined at 5800X counting > 80 mitochondria per section, from n = 3 sections per mouse heart using n = 3 blocks. (D) Echocardiography data for cardiac function in WT and CLOCK Δ19/Δ19 mice pre- and post 24 h following I-R. The top histograms represent left ventricular diastolic (LVIDd) dimensions, left ventricular systolic (LVIDs) dimensions, % ejection fraction (% EF) and % fractional shortening (% FS); bottom, representative M mode images, data are expressed as mean ± SEM, *p < 0.05, ** p < 0.01, n = 3–5 mice for each condition tested
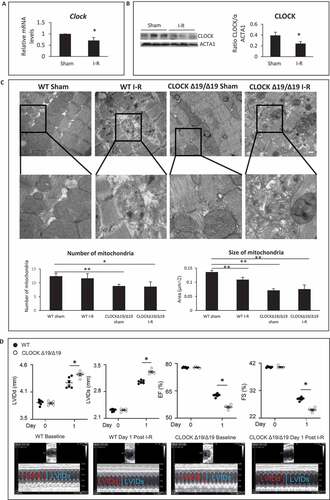
Based on these findings, we reasoned that circadian misalignment resulting from impaired CLOCK activity may underlie the reported cardiac dysfunction following I-R. To test this possibility, we assessed the impact of I-R on cardiac structure and function in wild-type (WT) mice and mice with disrupted circadian rhythm harboring a deletion mutation in the Clock gene (designated CLOCK Δ19/Δ19) [Citation20–24]. As shown by electron microscopy in , quantitative analysis revealed that mitochondria of the CLOCK Δ19/Δ19 hearts appeared smaller and less abundant than corresponding WT control hearts. Notably, CLOCK Δ19/Δ19 hearts exhibited greater morphological defects including sarcomere disorganization, fragmented mitochondria with disrupted cristae and presence of cellular debris following I-R than WT mice. These findings are consistent with impaired cellular and mitochondrial quality control mechanisms such as autophagy/mitophagy in the CLOCK Δ19/Δ19hearts.
We next assessed cardiac function in WT and CLOCK Δ19/Δ19mice following I-R by measuring the left ventricular internal diameter diastolic (LVIDd), left ventricular internal diameter systolic (LVIDs), ejection fraction (%EF) and fractional shortening (%FS) by echocardiography, 1d after I-R. As shown in , pre-ischemic cardiac functional parameters in WT and CLOCK Δ19/Δ19 mice were comparable and not significantly different. However, cardiac function was impaired in the CLOCK Δ19/Δ19 indicated by increased LVIDd and LVIDs, dimensions as well as reduced %EF (56.16 ± 0.51vs. 62.58 ± 0.37) p < 0.001; %FS (25.06 ± 0.32vs. 29.01 ± 0.51), P < 0.001), compared to WT mice following I-R (). These findings are consistent with the notion that circadian disruption leads to greater cardiac injury.
Circadian Clock gene disruption impairs cardiac gene expression
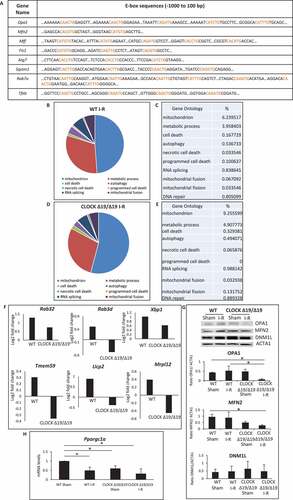
Since our in silico analysis revealed several genes required for regulating vital quality control processes, mitochondrial bioenergetics, and autophagy contained canonical and non-canonical E-box elements for Clock () [Citation25–29], we reasoned that the functional loss of Clock activity in CLOCK Δ19/Δ19 mice may have adversely affected these processes and cardiac function following I-R. To test this possibility, we analyzed the cardiac transcriptome by RNA seq analysis in WT, and CLOCK Δ19/Δ19 mice hearts pre- and post I-R in vivo. As shown in –E, gene ontology mapping indicated that processes related to mitochondrial metabolism, mitophagy and dynamics were impaired in both the WT and CLOCK Δ19/Δ19 mice hearts following I-R; however, a greater deficit in the gene transcriptome was observed in CLOCK Δ19/Δ19 hearts (). Consistent with these findings, other transcriptomic changes in the CLOCK Δ19/Δ19 hearts included altered expression of genes involved in OXPHOS metabolism, electron transport and mitochondrial biogenesis including Ndufa8, Ndufa4, Coq5 (Table S1). In view of this information, we validated the RNA seq data for mitochondrial dynamic proteins, OPA1, MFN2 and DNM1L/DRP-1 as well as the biogenesis factor PPARGC1A/PGC-1α in the WT and CLOCK Δ19/Δ19 hearts. As shown by western blot analysis in , expression of OPA1, and MFN2, were both decreased in the CLOCK Δ19/Δ19 hearts compared to WT controls. Conversely, DNM1L expression in the CLOCK Δ19/Δ19 remains unchanged from WT hearts – a finding concordant with the RNA Seq data. Interestingly, a 1.7-fold reduction p < 0.05 in the basal expression level of Ppargc1a was observed in sham CLOCK Δ19/Δ19 compared to sham WT controls. These findings are consistent with the dependency of Ppargc1a expression on Clock activity and smaller mitochondria in the CLOCK Δ19/Δ19 hearts. Interestingly, while PPARGC1A expression had declined in both the WT and CLOCK Δ19/Δ19 hearts following I-R, the reduction in PPARGC1A expression was greater in the CLOCK Δ19/Δ19 ().
Figure 2. Circadian Clock gene transcriptionally targets mitochondrial bioenergetics, dynamics and quality control. (A), E-box elements in Clock target genes. Canonical and non-canonical E-box sequences are highlighted in red; (B-E), Pie chart (B and D) represent the most common gene ontology clusters that were altered in response to I-R, tables represent the percentile change of each gene ontology from the total genes in the array (C and E); WT (B and C); CLOCK Δ19/Δ19 (D and E); (F), Histograms represent transcriptomic changes in CLOCK Δ19/Δ19 hearts, including alterations in autophagy, mitochondrial dynamics and mitochondrial energy, Rab32 p = 0.04033; Rab3d p = 0.014746; Xbp1, p = 8.25E-05; Tmem59 p = 0.014048; Ucp2 p = 0.010898; Mrpl12,p = 0.001328; (G), western blot analysis of OPA1, MFN2 and DNM1L protein expression in WT and CLOCK Δ19/Δ19 hearts following I-R, compared to ACTA1 loading control, bottom, quantification of western blot analysis; (H), PPARGC1A mRNA expression in WT and CLOCK Δ19/Δ19 hearts following I-R, labels are as described above; data are expressed as mean ± SEM, *p < 0.05, n = 3–5 mice hearts for each condition tested
CLOCK Δ19/Δ19 promotes mitochondrial dysfunction and cell death in cardiac myocytes
Given that several genes important for mitochondrial dynamics, bioenergetics and autophagy/mitophagy were markedly downregulated in CLOCK Δ19/Δ19 hearts following I-R, to better understand the functional importance of the Clock Δ19 mutation on mitochondrial function and cell viability, we next investigated the impact of Clock Δ19 mutation in cardiac myocytes in vitro. As shown in –D, in contrast to vector control cells, cardiac myocytes expressing ClockΔ19 exhibited mitochondrial perturbations including increased ROS production (), loss of mitochondrial membrane potential Δψm () and increased mitochondrial permeability transition pore (mPTP) opening (). Notably, mitochondrial injury observed in cardiac myocytes expressing the ClockΔ19 was exacerbated during hypoxia.
Figure 3. Circadian Clock Δ19 mutation impairs mitochondrial function, mitophagy and cell viability in cardiac myocytes. Epifluorescence microscopy of cardiac myocytes under normoxic (NMX) or hypoxic (HPX) conditions in the absence and presence of Clock ∆19 expression vector; (A), mitochondrial reactive oxygen species (ROS) by dihydroethidine (red fluorescence), bar: 100 μm; (B), mitochondrial membrane potential (ΔΨm) by TMRM (red fluorescence), bar: 20 μm; (C), mitochondrial permeability transition pore opening (mPTP), (green fluorescence) bar: 20 μm; see Materials and Methods for details; (D), Upper, representative images for MitoKeima staining, as an index of mitophagy in cardiac myocytes under NMX and HPX conditions in the absence and presence of Clock ∆19 expression vector, bars: 10 μm. Magnified regions are depicted by the white boxes, green fluorescent puncta demark mitochondria that are unfused with lysosomes (neutral pH), red/yellow fluorescent puncta demark mitochondria that have fused with lysosomes (acidic pH) indicative of mitophagy. Bottom histogram, quantitative analysis for conditions shown above; (E), Cell viability as assessed with vital dyes calcein-AM and ethidium-homodimer-1 to identify the number of live (green) and dead (red) cells, respectively, bar: 100 μm, see methods for details; data are expressed as mean ± SEM. *p < 0.05; **p < 0.01, n = 3–4 independent myocyte isolations, counting >200 cells for each condition tested
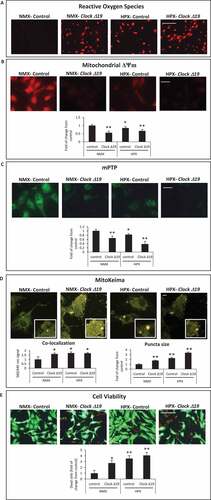
To further address whether mitochondrial clearance via mitophagy was influenced by impaired Clock activity, we monitored mitophagy in cardiac myocytes using the dual fluorescence probe MitoKeima. MitoKeima readily distinguishes unfused mitochondria – lysosomes as (green fluorescence, neutral pH) or mitochondria fused with lysosomes as (red/yellow fluorescence, acidic pH). The appearance of large red/yellow MitoKeima puncta is indicative of the accumulation of mitophagosomes from disrupted mitochondrial – lysosomal clearance, whereas the presence of smaller green puncta is an index of mitochondrial clearance [Citation30]. Concordant with the mitochondrial damage observed in cardiac myocytes expressing the ClockΔ19, mitochondrial clearance via mitophagy was severely compromised. Indeed, the co-localization signal and size of yellow staining puncta, indicative of impaired mitophagy, were both increased in cardiac myocytes expressing the ClockΔ19 mutant, compared to vector control cells (). In addition, the impaired mitophagy coincided with a marked reduction in cell viability in cells expressing the ClockΔ19 and was further increased during hypoxia (). Together, these findings substantiate our in vivo CLOCK Δ19/Δ19 data and support the notion that CLOCK plays a critical role in regulating basal mitochondrial function, mitophagy and cell viability.
CLOCK deficiency provokes mitochondrial perturbations and cell death
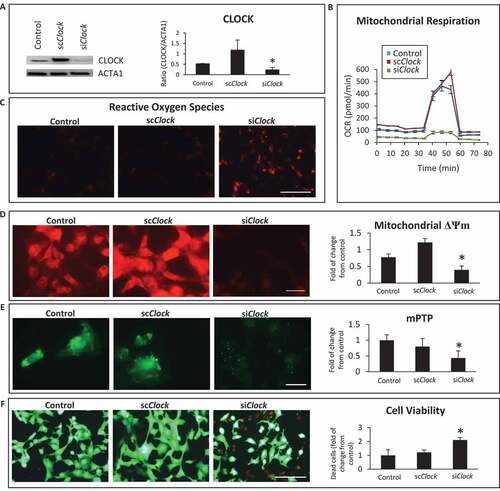
To substantiate the importance of CLOCK in the regulation of mitochondrial function and cell viability, we conducted additional experiments in which Clock activity was inhibited in cardiac myocytes. For these studies, we used small interfering RNA to knockdown Clock activity (siClock) in cardiac myocytes in vitro. Previously we showed that this approach achieves a knockdown efficiency of 80–85% in post-natal cardiac myocytes [Citation31]. To eliminate off-target effects from the siRNA, we transduced cardiac myocytes with the Clock expression vector in the presence of the siClock or scrambled interference RNA (scRNA). As shown by western blot analysis in , in contrast to vector control cells, a significant reduction in CLOCK protein expression was observed in cardiac myocytes transduced with siClock. This coincided with mitochondrial perturbations that included impaired respiration (), ROS production (), loss of mitochondrial membrane potential ΔΨm () and mPTP opening (). Further, knockdown of Clock activity resulted in widespread cell death (). Taken together these findings verify the functional importance of Clock gene activity on mitochondrial integrity and cell cardiac viability – a finding consistent with the RNA seq data.
Figure 4. Clock knockdown disrupts mitochondrial function and cell viability. (A); Top left, western blot analysis of CLOCK protein expression in post-natal cardiac myocytes. Cardiac myocytes were transfected with vector alone (control) or with the Clock expression vector along with short-hairpin RNA directed against Clock designated (siClock) or with Clock expression vector along with scrambled siRNA designated (scClock); Lower left, ACTA1 for loading control; Right, histogram represents quantitative data for the western blot analysis; (B), Oxygen consumption rate (OCR) in adenovirus-infected control cells AdCMV or cardiac myocytes infected with AdClock in the presence of siClock or scClock; (C), epifluorescence microscopy of reactive oxygen species (ROS) by dihydroethidine, bar: 100 μm; (D), epifluorescence microscopy of mitochondrial membrane potential ΔΨm by TMRM staining, bar: 20 μm; (E), Mitochondrial permeability transition pore opening (mPTP), bar: 20 μm; (F), cell viability, with vital dyes calcein-AM and ethidium-homodimer-1 to identify the number of live (green) and dead (red) cells, respectively, bar: 100 μm, see methods for details. Histogram represents quantitative data for ΔΨm, mPTP and cell viability, data are expressed as mean ± SEM from at least n = 3–4 independent myocyte isolations experiments counting >200 cells for each condition tested, *p < 0.05
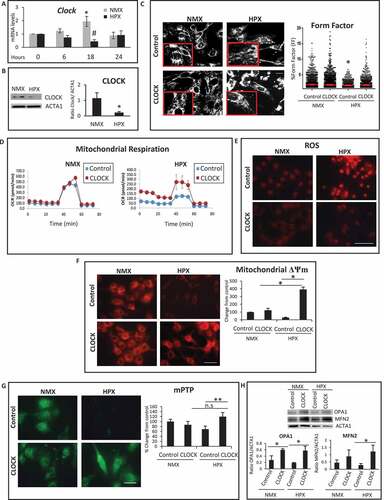
CLOCK restores mitochondrial function in cardiac myocytes during hypoxia
To test the significance of CLOCK under physiologically relevant conditions, we investigated the impact of CLOCK in cardiac myocytes under normoxic and hypoxic conditions. Interestingly, as shown in , we observed that endogenous Clock mRNA expression oscillated in a reciprocal manner throughout a 24-h period under both normoxic and hypoxic conditions. In contrast to normoxic control cells, a significant reduction in Clock mRNA expression was observed in cardiac myocytes subjected to hypoxia that was statistically different from normoxic controls at 18 h (). Based on these findings, we studied the connection between mitochondrial function and Clock gene activity during hypoxia at the 18-h time point. As shown in , in contrast to normoxic control cells, mitochondrial aspect ratio, indicative of increased mitochondrial fission was observed in cardiac myocytes subjected to hypoxia. This was accompanied by a concomitant decline in mitochondrial respiration (), increased ROS production (), loss of mitochondrial membrane potential ΔΨm () and mPTP opening (). Moreover, a significant decline in mitochondrial fusion proteins, OPA1 and MFN2 was observed in cardiac myocytes subjected to hypoxia (). Importantly, overexpression of CLOCK restored mitochondrial dynamic proteins, mitochondrial aspect ratio, and bioenergetics (). These findings substantiate that CLOCK regulates vital cellular and mitochondrial processes in cardiac myocytes during hypoxia.
Figure 5. CLOCK restores mitochondrial dynamics, mitochondrial function and mitochondrial bioenergetics during hypoxia. (A). Clock mRNA expression in cardiac myocytes is downregulated during hypoxia (HPX) (18 h) compared to normoxic controls (NMX), (B), Upper left, western blot analysis of CLOCK protein expression in cardiac myocytes during hypoxia (HPX) of 18 h compared to normoxia (NMX); Lower left, ACTA1 as a loading control; Right, histogram is quantitative data for the western blot analysis. (C), Left, Representative epifluorescence images of cardiac myocytes stained for mitochondrial HSPD1 to assess mitochondrial morphology aspect ratio, bar: 10 μm, magnified regions are depicted in red boxes, Right, quantitative data of mitochondrial morphology is displayed as mitochondrial form factor, (FF), as an index of mitochondrial fusion and fission, lower FF values are indicative of mitochondrial fission relative to control; (D), mitochondrial oxygen consumption rate (OCR) in cardiac myocytes under NMX and HPX conditions, viral control AdCMV (blue box) or AdClock (red box); (E), Epifluorescence microscopy of cardiac myocytes under normoxic (NMX) or hypoxic (HPX) conditions, assessed for mitochondrial reactive oxygen species (ROS) by dihydroethidine (red), bar: 100 μm; (F), mitochondrial membrane ΔΨm by TMRM (red), bar: 20 μm; Histogram represents quantitative data for panel F; (G), mitochondrial permeability transition pore opening (mPTP), (green fluorescence) bar: 20 μm; Histogram represents quantitative data for panel G; (H) Upper, western blot analysis for OPA1 and MFN2 protein expression in cardiac myocytes during normoxia (NMX) and hypoxia (HPX) at 18 h; Lower, Histogram represents quantitative analysis for Panel H; see Materials and Methods for details; data are expressed as mean ± SEM. *,#p < 0.05; **p < 0.01, n.s.- non significant, n = 3–4 independent myocyte isolations, counting >200 cells for each condition tested for Panels C, F-H
CLOCK restores autophagy in cardiac myocytes during hypoxia
Since RNA seq analysis revealed that several genes important for autophagy regulation are putative transcriptional targets of Clock, we next investigated whether autophagy gene expression and autophagic clearance were influenced by CLOCK in cardiac myocytes subjected to hypoxia. As shown in –D, in contrast to normoxic controls, a marked reduction in mRNA expression of autophagy genes Atg7, Tfeb, Sqstm1/p62 and Rab7a was observed in cardiac myocytes subjected to hypoxia. Further, as shown by western blot analysis (), hypoxia-induced decline in autophagy gene expression coincided with a reduction in BECN1 and ATG14 protein levels. Importantly, the hypoxia-induced decrease in autophagy gene and protein expression was restored to normoxic control levels in cardiac myocytes expressing CLOCK –E. This is further substantiated by the Clock-dependent increase in Tfeb promoter activity in hypoxic cardiac myocytes expressing Clock (Figure S1).
Figure 6. CLOCK restores autophagy gene expression and cell viability during hypoxia. (A-D), mRNA expression levels of autophagic genes in normoxic (NMX) and hypoxic (HPX) cardiac myocytes in the absence and presence of control adenovirus CMV (AdCMV) or AdClock, mRNA levels were normalized to Rpl32; (E), Top, western blot analysis of BECN1 and ATG14 protein expression in NMX and HPX cardiac myocytes in the absence and presence of AdCMV or AdClock. Lower panel, histogram represents quantitative data for the western blot, relative to ACTA1 as a loading control, (F), Upper, epifluorescence microscopy of ventricular myocytes expressing autophagy reporter GFP-LC3 (green puncta) and Hoechst 33258 nuclear staining (blue) in the presence of AdCMV (vector control) or, AdClock, or shAtg7 with or without Chloroquine (CQ) to assess autophagic flux under NMX and HPX conditions, bar: 10 μm, Magnified regions are depicted by the white boxes. Green fluorescent puncta are indicative of increased autophagic flux, Lower, analysis of conditions tested in Upper panel. (G), Left, representative images of MitoKeima staining, as an index of mitophagy in cardiac myocytes under NMX and HPX conditions 18 h in the absence and presence of AdCMV or AdClock or shAtg7, bar: 10 μm. Magnified regions are depicted by the white boxes, green fluorescent puncta demark mitochondria that are not fused with lysosomes (neutral pH), red/yellow fluorescent puncta demark mitochondria that have fused with lysosomes (acidic pH) indicative of mitophagy. Right, analysis of conditions tested on left panel; data are expressed as mean ± SEM. *p < 0.05, **p < 0.01, n = 3–4 independent myocyte isolations
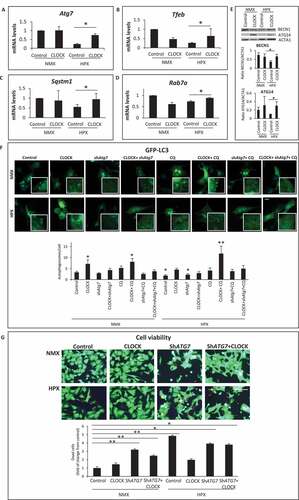
To verify that restoring autophagy gene expression with exogenous Clock rescued autophagic clearance, we monitored autophagy flux in cardiac myocytes subjected to hypoxia using the autophagy reporter GFP-LC3 in the absence and presence of chloroquine (CQ). As shown by epifluorescence microscopy (), under normoxic conditions, the number of GFP-LC3 puncta was significantly increased in cardiac myocytes expressing Clock and was increased further in cells treated with CQ. These findings confirm that autophagy was functionally operational and activated by CLOCK in cardiac myocytes. Interestingly, the number of GFP-LC3 puncta was only marginally increased in cardiac myocytes during hypoxia, indicating that autophagy was stalled. This finding is consistent with the inhibition of autophagy gene expression in cardiac myocytes during hypoxia. However, the number of GFP-LC3 staining puncta in hypoxic cardiac myocytes was significantly increased in cells expressing Clock and was increased in the presence of CQ. The ability of CLOCK to restore autophagic flux in cardiac myocytes during hypoxia corresponded with and an increase in mitochondrial clearance as demonstrated by decreased co-localization signal and size of Mitokemia puncta, indicative of increased mitophagy (Figure S2A). Concordantly, the increased mitochondrial clearance was accompanied by a corresponding decrease in mitochondrial mass as indicated by a decline in ratio between mitochondrial transcription factor Tfam and Rpl32 (Figure S2B). Moreover, Ppargc1a gene expression indicative of mitochondrial biogenesis was markedly increased in cardiac myocytes expressing Clock (Figure S2C), consistent with the increased oxidative capacity in Clock-expressing cells. These findings demonstrate that mitochondrial clearance and biogenesis are regulated by Clock gene activity.
To further investigate the impact of CLOCK on autophagic flux, we investigated whether inhibiting autophagy would interfere with the ability of CLOCK to activate autophagy. For these studies, we inhibited autophagy using an adenovirus encoding shRNA directed against Atg7 (Ad-shAtg7). As shown in , the ability of CLOCK to activate autophagy was suppressed by Atg7 knockdown – verifying that autophagy activation was CLOCK-dependent. Furthermore, the ability of CLOCK to rescue cell death during hypoxia was abrogated by Atg7 knockdown (). These findings support our contention that the survival properties conferred by CLOCK require autophagy/mitophagy activation.
Clock gene transcription regulates mitochondrial bioenergetics, mitophagy and cell survival during hypoxia
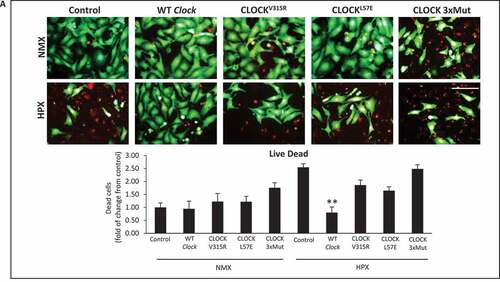
To verify whether the transcriptional properties of Clock are necessary and sufficient for rescuing mitochondrial autophagy and cell viability, we next assessed the impact of WT Clock and mutations of the Clock gene within the bHLH hydrophobic core (CLOCKL57E) that render Clock defective for E-box binding, or within the PAS domain that destabilizes its heterodimerization with ARNTL (CLOCKV315R), or Clock mutant that disrupts both E-box binding and ARNTL interactions (CLOCKL57E/L113E/W284, designated, CLOCK 3xMut) [Citation32], depicted in . As shown in by confocal fluorescence microscopy, in contrast to normoxic control cells which exhibited smaller green staining MitoKemia puncta indicating mitochondria were not fused with lysosomes, we detected a significant increase in the number of large red/yellow puncta in cardiac myocytes subjected to hypoxia, consistent with impaired mitophagy. In contrast, however, the number and size of red/yellow puncta in cardiac myocytes subjected to hypoxia was significantly decreased in cardiac myocytes expressing WT Clock. Indeed, cardiac myocytes expressing exogenous WT Clock were indistinguishable from normoxic control cells with respect to mitophagy, indicating that the mitochondrial clearance was functionally restored in these cells. Conversely, the three Clock mutants tested, which were expressed to comparable levels as the wild-type Clock (Figure S3), each failed to rescue mitophagy in hypoxic cardiac myocytes. Interestingly, the number, and size of red/yellow MitoKeima puncta was significantly increased with each of the Clock mutations tested, indicating that clearance of damaged mitochondria was significantly impaired by the absence of functional Clock. Interestingly, the CLOCK 3xMut exhibited the greatest effects on mitophagy impairment even under basal condition, likely reflecting the importance of CLOCK for regulating basal autophagy and mitochondrial clearance. Remarkably, the impaired mitophagy in cardiac myocytes defective for CLOCK activity is consistent with the presence of damaged mitochondria observed in the CLOCK Δ19/Δ19 I-R hearts in vivo and cardiac myocytes expressing the CLOCK Δ19 in vitro (). These findings support the notion that autophagy and mitophagy quality control mechanisms are functionally dependent upon Clock gene activity. Furthermore, in contrast to WT Clock, the Clock mutants impaired mitochondrial respiration (), mitochondrial morphology () and cell viability () under normoxic conditions that were exacerbated further during hypoxia. In aggregate, these findings demonstrate a novel role for CLOCK as a critical regulator of mitochondrial metabolism, quality control and cell survival of cardiac myocytes.
Figure 7. CLOCK rescues mitochondrial bioenergetics and mitophagy in cardiac myocytes. (A), Ribbon structures of wild type (WT) and CLOCK mutants, CLOCKV315R, CLOCKL57E, CLOCK L57E/L113E/W284, designated as CLOCK 3xMut; blue ribbon represents CLOCK, red ribbon represents ARNTL, as previously reported by [Citation32], Protein Data Bank (PDB) code 4 F3L; (B), Top, representative epifluorescence microscopy of MitoKeima staining in cardiac myocytes as an index of mitophagy. Cardiac myocytes expressing MitoKeima reporter under normoxic (NMX) and hypoxic (HPX) conditions 18 h in the presence of Clock WT or CLOCK mutants, bar: 10 μm. Magnified regions are depicted by insets outlined by white boxes, green fluorescence MitoKeima puncta represent mitochondria that unfused with lysosomes (neutral pH), red/yellow fluorescent puncta demark mitochondria that are fused with lysosomes (acidic pH), see methods for details. In contrast to Clock WT, each of the CLOCK mutants tested resulted in the accumulation of larger red/yellow MitoKeima puncta indicating that mitophagy and mitochondrial clearance was impaired (see text for details), Bottom, analysis of conditions tested in Upper panel; (C), mitochondrial oxygen consumption rate (OCR) in cardiac myocytes under NMX or HPX conditions in the presence Clock WT or CLOCK mutants; (D), Top Representative epifluorescence images of cardiac myocytes stained for mitochondrial HSPD1 to assess mitochondrial morphology aspect ratio, bar: 10 μm, magnified regions are depicted in red boxes, Bottom quantitative data of mitochondrial morphology is displayed as mitochondrial form factor, (FF), as an index of mitochondrial fusion and fission, lower FF values are indicative of mitochondrial fission relative to control, (E), cell viability of ventricular myocytes stained with vital dyes calcein-AM and ethidium-homodimer-1 to demark the live (green) and dead (red) cells in the absence and presence of Clock WT or CLOCK mutants, bar: 100 μm, histogram represents quantitative data for Panel E, data are expressed as mean ± SEM. *p < 0.05; **p < 0.01, n = 3 independent myocyte isolations, counting > 200 for each condition tested
![Figure 7. CLOCK rescues mitochondrial bioenergetics and mitophagy in cardiac myocytes. (A), Ribbon structures of wild type (WT) and CLOCK mutants, CLOCKV315R, CLOCKL57E, CLOCK L57E/L113E/W284, designated as CLOCK 3xMut; blue ribbon represents CLOCK, red ribbon represents ARNTL, as previously reported by [Citation32], Protein Data Bank (PDB) code 4 F3L; (B), Top, representative epifluorescence microscopy of MitoKeima staining in cardiac myocytes as an index of mitophagy. Cardiac myocytes expressing MitoKeima reporter under normoxic (NMX) and hypoxic (HPX) conditions 18 h in the presence of Clock WT or CLOCK mutants, bar: 10 μm. Magnified regions are depicted by insets outlined by white boxes, green fluorescence MitoKeima puncta represent mitochondria that unfused with lysosomes (neutral pH), red/yellow fluorescent puncta demark mitochondria that are fused with lysosomes (acidic pH), see methods for details. In contrast to Clock WT, each of the CLOCK mutants tested resulted in the accumulation of larger red/yellow MitoKeima puncta indicating that mitophagy and mitochondrial clearance was impaired (see text for details), Bottom, analysis of conditions tested in Upper panel; (C), mitochondrial oxygen consumption rate (OCR) in cardiac myocytes under NMX or HPX conditions in the presence Clock WT or CLOCK mutants; (D), Top Representative epifluorescence images of cardiac myocytes stained for mitochondrial HSPD1 to assess mitochondrial morphology aspect ratio, bar: 10 μm, magnified regions are depicted in red boxes, Bottom quantitative data of mitochondrial morphology is displayed as mitochondrial form factor, (FF), as an index of mitochondrial fusion and fission, lower FF values are indicative of mitochondrial fission relative to control, (E), cell viability of ventricular myocytes stained with vital dyes calcein-AM and ethidium-homodimer-1 to demark the live (green) and dead (red) cells in the absence and presence of Clock WT or CLOCK mutants, bar: 100 μm, histogram represents quantitative data for Panel E, data are expressed as mean ± SEM. *p < 0.05; **p < 0.01, n = 3 independent myocyte isolations, counting > 200 for each condition tested](/cms/asset/02c3748c-4083-4126-b0ff-90fc59a785df/kaup_a_1938913_f0007_c.jpg)
Figure 8. CLOCK rescues cell survival in cardiac myocytes. (A), cell viability of ventricular myocytes stained with vital dyes calcein-AM and ethidium-homodimer-1 to demark the live (green) and dead (red) cells in the absence and presence of CLOCK WT or CLOCK mutants, bar: 100 μm, histogram represents quantitative data for Panel A, data are expressed as mean ± SEM. *p < 0.05; **p < 0.01, n = 3 independent myocyte isolations, counting > 200 for each condition tested
Discussion
Epidemiologic studies have shown that circadian disruption in humans is associated with increased risk of heart disease and worsened outcomes following cardiac injury, reviewed [Citation7,Citation17,Citation33]. In this report, we provide new compelling evidence that the circadian Clock gene regulates mitochondrial fitness by transcriptionally controlling mitochondrial dynamics, bioenergetics and quality control processes in cardiac myocytes. Our results reveal a novel link between the Clock gene activity and cardiac cell survival. We show that loss of Clock gene activity in vitro and in vivo results in a greater cardiac injury and ventricular dysfunction from impaired activation of autophagy/mitophagy, mitochondrial bioenergetics and dynamics. Since defects in mitochondrial function have been associated with necrotic cell death and cardiac injury [Citation6,Citation34,Citation35], we attributed the greater cell injury and I-R dysfunction in CLOCK Δ19/Δ19 mice to impaired activation of genes important for mitochondrial dynamism and autophagy [Citation36–38].
The notion that impaired mitochondrial quality control processes accounted for the greater cardiac injury observed in the CLOCK Δ19/Δ19 mice is supported by our RNA seq data, which revealed that several genes required for autophagy/mitophagy, as well as mitochondrial dynamism including Atg7, Rab7a, Tfeb, Sqstm1, Mfn2, Opa1 and others were markedly downregulated in the CLOCK Δ19/Δ19 hearts. Indeed, disruption of mitochondrial cristae in CLOCK Δ19/Δ19 hearts is consistent with the reduction in MFN2 and OPA1 expression and impaired mitochondrial bioenergetics. Importantly, mitochondrial damage during I-R would activate autophagy/mitophagy to cull damaged mitochondria; however, since autophagic gene expression and autophagy were impaired in the CLOCK Δ19/Δ19 hearts, it is not surprising that autophagic removal of damaged mitochondria in Clock-deficient cardiac myocytes was impaired during I-R. These findings highlight the importance of CLOCK in the regulation of autophagy and mitochondrial quality control processes in cardiac myocytes. These findings are further substantiated by the fact that restoring CLOCK activity rescued autophagic gene expression and mitophagy during hypoxia. Based on these findings, we purport that loss of mitochondrial quality control mechanisms, such as seen in the Clock-deficient hearts, may underlie the decline in cardiac performance associated with circadian disruption with aging [Citation39].
Cells respond to changes in metabolic demands imposed by hypoxia or ischemic stress [Citation40]. In this study, we provide novel evidence that the circadian Clock gene synchronizes mitochondrial turnover, biogenesis and energetics to ensure a healthy pool of mitochondria are available to meet the metabolic needs of the cell. The disruption of a functional Clock gene predisposes cardiac myocytes to ischemic/hypoxic stress by preventing activation of critical adaptive mechanisms crucial for maintaining mitochondrial fitness and cell survival. This is evidenced by the mitochondrial fragmentation and increased oxidative injury and cell death. Indeed, changes in mitochondrial architecture from increased fusion have been associated with increased mitochondrial bioenergetics, while mitochondrial fission has been linked impaired oxidative metabolism and mitophagy [Citation41,Citation42]. The fact that mitochondrial dynamics and mitophagy were disrupted in CLOCK Δ19/Δ19 hearts and Clock-deficient cardiac myocytes, supports the notion that CLOCK plays a critical role in coordinating mitochondrial dynamics and clearance in the heart. Further, the increased PPARGC1A expression in cardiac myocytes expressing CLOCK is consistent with the increased oxidative capacity and replenishment of mitochondria following mitophagy.
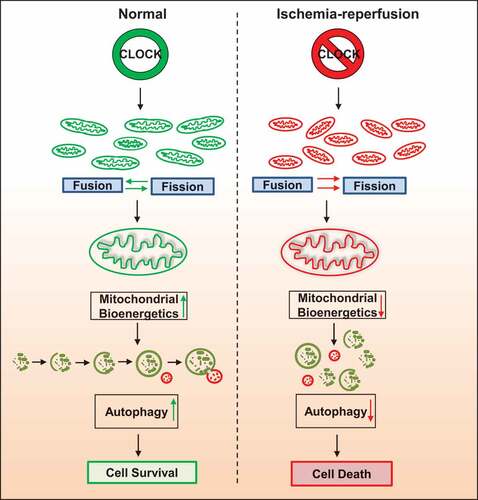
Previous Chip Seq studies have identified several metabolic and mitochondrial genes that contain E-box elements for Clock and oscillate in a circadian-dependent manner [Citation43–48]. Indeed, our RNA seq data in cardiac myocytes verify that many of the genes responsible for metabolism, mitochondrial dynamics and quality control are transcriptionally regulated by the Clock gene. This is substantiated by our findings that the Tfeb promoter activity was activated by CLOCK in cardiac myocytes coincident with an increase in autophagy and mitochondrial clearance, Figure S1. In addition, our discovery of E-box elements within several mitochondrial electron transport genes as well as several genes important for metabolism supports the notion that CLOCK is a master transcriptional regulator that coordinates these processes. Given the fact that the wild type Clock, but not mutations of Clock defective for DNA-binding to E-box elements or dimerizing with ARNTL, normalized mitochondrial respiration and autophagy gene expression in cardiac myocytes, we speculate that CLOCK may directly serve as a critical regulator mitochondrial function independent of its role in circadian regulation. Further, given that ARNTL was unable to rescue the mitochondrial perturbations and cell death in cardiac myocytes deficient for Clock gene activity, would argue that CLOCK and ARNTL have distinct non-overlapping properties with respect to autophagy and mitochondrial quality control in cardiac myocytes. Interestingly, it was recently shown that ARNTL activated DNM1L and promoted mitochondrial fission in hepatocytes [Citation49]. However, in the present study, we observed that CLOCK activated transcription of mitochondrial fusion proteins, MFN2 and OPA1, yet had no effect on DNM1L expression or DNM1L (S616) phosphorylation (I.R.N and L.A.K unpublished data) in cardiac myocytes. These findings suggest that CLOCK and ARNTL may differentially regulate mitochondrial fusion and fission genes in a cell and context-specific. Furthermore, we observed that CLOCK but not ARNTL expression was reduced in cardiac myocytes during ischemia reperfusion in vivo or hypoxia in vitro. This finding would argue that CLOCK and not ARNTL is important for regulating transcription of autophagy/mitophagy genes in cardiac myocytes. However, this does not preclude the importance or involvement of ARNTL in other forms of cardiac injury, given the recent report highlighting a role for ARNTL in dilated cardiomyopathy [Citation15,Citation50]. Taken together, our study reveals, for the first time, CLOCK as a central regulator of quality control mechanisms and metabolic processes crucial for maintaining oxidative metabolism and cardiac function following I-R. Based on our findings, we propose that the functional impairment of CLOCK activity predisposes cardiac myocytes to oxidative injury and mitochondrial dysfunction during I-R from inadequate mitophagy for culling damaged ROS-producing mitochondria as well as impaired mitochondrial biogenesis for ATP production (). Indeed, the impaired autophagy and uncoupled respiration are consistent with cardiac dysfunction seen in the CLOCK Δ19/Δ19 following I-R and CLOCKΔ19 cardiac myocytes during hypoxia. Furthermore, the fact that inhibition of autophagy by Atg7 knockdown abrogated the ability of CLOCK to rescue hypoxia-induced autophagy and cardiac cell death would substantiate the importance of autophagy for the survival properties conferred by CLOCK.
Figure 9. CLOCK Regulates Autophagy and Mitochondrial Quality Control in Cardiac Myocytes. Schematic model for CLOCK regulation of autophagy and mitochondrial quality control. Left panel, Clock gene expression promotes mitochondrial dynamics, quality control, bioenergetics and cell survival. Right panel, disruption of expression of Clock gene during ischemia-reperfusion impairs mitochondrial dynamics, quality control and bioenergetics, resulting in cell death
In a similar light, our data may explain the increased severity of cardiac injury in individuals with circadian disruption such as shift workers or individuals with sleep disorders, with disrupted CLOCK activity [Citation17,Citation18,Citation51]. Hence, interdictions that influence CLOCK activity may translate into better cardiac performance in individuals with circadian CLOCK disruption following myocardial infarction.
Materials and methods
Animals
Male homozygote CLOCK Δ19/Δ19and wild-type (WT) littermates on a C57Bl/6 J background used for this study were obtained from Dr. Tami Martino (University of Guelph) [Citation52]. The CLOCK Δ19/Δ19 mice encode a mutant CLOCK protein that disrupts dimerization with its cognate partner ARNTL1, thereby inhibiting the transcription of circadian controlled genes [Citation20–24]. All animal experiments conducted in this study were approved by animal care committee of University of Manitoba as well as by University of Guelph and are in accordance with the guidelines laid for protection of animals used for scientific purposes by Canadian Council for Animal Care, directive 2010/63/EU, and National Institutes of Health (NIH). Animals were housed at an animal facility with standard laboratory conditions, 12–12 h light-dark cycle. Rodent chow (Envigo, 2914) and water were provided ad libitum.
Ischemia-reperfusion procedure
All surgeries were performed within 1–4 h after lights on to avoid confounding circadian effects (zeitgeber time (ZT) 01–04). Male C57Bl/6 J and CLOCK Δ19/Δ19mice were anesthetized with 3.5% isoflurane, intubated, and ventilated (Harvard Apparatus, Model 687). Prior to surgical incision, animals were administered a local subcutaneous injection of a 50:50 mix of bupivacaine (1.5 mg/kg) and lidocaine (3 mg/kg). Mice were then subjected to surgical ligation of the left anterior descending (LAD) coronary artery. To do this, a left-sided incision was made in the third intercostal space to view the heart and the pericardium was gently dissected to expose the LAD coronary artery. A silk 7–0 suture was passed underneath the LAD at 1 mm below the edge of the left auricle and a piece of PE-10 tubing, approximately 5 mm in length, was placed over the LAD. The suture was tied around the tubing to ligate the LAD for a 45-min ischemic period. The chest and skin were then temporarily closed, with a sterile cloth placed over the incision site. After 45 min, the incision site was re-opened and the tubing and suture were removed allowing the LAD to reperfuse. The chest and skin were then closed with silk 6–0 suture. Sham controls underwent the same procedure without ligation of the LAD coronary artery. Mice were administered buprenorphine (0.1 mg/kg) analgesia upon awakening and again at 8 h, and were sacrificed at 24 h post-operation.
Basic RNA-seq data processing
After 24 h of reperfusion, mice were anesthetized and hearts were excised, rinsed in phosphate-buffered saline (PBS; 10x [80 g NaCl, 2 g KCl, 11.5 g Na2HPO4.7H2O, 2 g KH2PO4, pH 7.4] dilute to 1x) and stored at −80°C. For extraction of total RNA from heart tissue, 1 ml trizol (Invitrogen, 15596018) was added into each heart and crushed manually. Chloroform (200 µl) (Sigma-Aldrich, B9673-200 ml) was mixed into the crushed hearts and incubated for 3 min, at room temperature (RT). After incubation, hearts were centrifuged at 12,000 g, 15 min, supernatant was collected and 500 µl cold isopropanol (Thermo Fisher Scientific, A464-4) was added. The mixture was centrifuged again at 12,000 g, 10 min to pellet the RNA. The supernatant was discarded, and the pellet was washed in 500 µl of cold 75% ethanol, and centrifuged at 7500 g, 5 min. After repeating this step twice, the RNA pellet was air dried on ice, and then reconstituted using DNase-free water (Thermo Fisher Scientific, AM9937). RNA-seq was carried out as a paid service from the McGill University and Génome Québec Innovation Center, Canada. Briefly, paired-ends sequencing reads were clipped for adapter sequence, trimmed for minimum quality (Q30) in 3ʹ and filtered for minimum length of 32 bp using Trimmomatic version 0.36 [Citation53]. Surviving read pairs were aligned to the ENSEMBL release 83 Mus Musculus assembly using STAR version 2.5.3a [Citation54] a two-pass approach. A gene-level count-based gene quantification against gene ENSEMBL annotations was performed using HT-seq count [Citation55] in the intersection-nonempty mode. All of the above processing steps were accomplished through the GenPipes framework [Citation56].
Gene expression analysis
Exploratory analysis was conducted using various functions and packages from R and the Bioconductor project [Citation57]. Differential expression was conducted using both edgeR [Citation58]. Terms from the Gene Ontology were tested for enrichment with the GOseq [Citation59] R package.
Echocardiography
To assess cardiac function and morphometry, animals were assessed at baseline and 24 h post I-R, in a blinded manner under light anesthesia (1.5% isoflurane) using a GE Vivid 7 Dimension ultrasound machine (GE Medical Systems) with a i13 L14 MHz linear-array transducer. Measurements were taken at the mid-papillary level and used to determine left ventricular internal dimension at end-diastole (LVIDd), left ventricular internal dimension in systole (LVIDs), % ejection fraction (% EF) and % fractional shortening (% FS). A minimum of five images per mouse heart were analyzed.
Electron microscopy
Electron microscopy was performed in sham, I-R C57Bl/6 or CLOCK Δ19/Δ19 mice as previously described [Citation60]. After 24 h of reperfusion, mice were anesthetized by intraperitoneal (i.p) injection of a combination of ketamine (100 mg/kg body weight) and xylazine (10 mg/kg body weight), euthanasia was performed by cervical dislocation followed by excision of the heart. Briefly, hearts were excised and washed in phosphate buffer saline, four random areas of left ventricle between mid-region and apex were cut into small cubes and fixed in 2% w:v glutaraldehyde (Electron Microscopy Sciences, 16210). In order to study ultrastructural changes of the myocardium, tissues were osmicated, embedded in Epon (Electron Microscopy Sciences, 14960), stained with uranyl acetate (Electron Microscopy Sciences, 22409) and lead citrate (Electron Microscopy Sciences, 22410), as we previously reported [Citation60]. Quantification of number and size of mitochondria was done using Image J software (NIH). Experiments were approved by animal care committee, University of Manitoba and carried out according to guidelines provided.
Quantitative real-time PCR (qPCR)
After 24 h of reperfusion, mice were anesthetized with isofluroane, sacrificed by cervical dislocation, hearts were excised, rinsed in PBS and stored at −80°C. For RNA extraction from cardiac myocytes, we used GenElute mammalian total RNA kit (Sigma Aldrich, RTN-350-1KT), according to manufacturer’s instructons. cDNA was synthesized using iScript™ gDNA Clear cDNA Synthesis Kit (Bio-Rad, 172–5035), the quantitative Real-Time PCR reaction was amplified using iQ™ SYBR® Green Supermix (Bio-Rad, 14–222-777) with the following primers: Clock, Atg7, Sqstm1, Rab7a, Tfeb and housekeeping gene Rpl32, as explained previously [Citation61], mitochondrial mass was quantified by real-time qPCR of Tfam and Rpl32. Primer sequences are presented in Table S2.
Western blot analysis
Mice were anesthetized with isoflurane at 24 h post-reperfusion, sacrificed by administration of 5% isoflurane and cervical dislocation, hearts and cells were lysed in RIPA buffer (1% triton x [Sigma-Aldrich, X100-1 L]-0.5 ml, 0.1% SDS-250 µl of 20% SDS, 140 mM NaCl-1.4 ml 5 M NaCl, 10 mM Tris-500 µl 1 M Tris pH 8, sodium deoxycholate-0.5 g, pH of RIPA 7.7) and protein was extracted and measured by bicinchoninic acid (BCA; Thermo Fisher Scientific, 23225). Lysate containing 20–30 μg of protein was resolved on denaturing SDS PAGE gels and then transferred to nitrocellulose membranes (Bio-Rad, 1620094). Membranes were probed with primary antibodies targeted against CLOCK (NEB, 5157S), OPA1 (Abcam, ab119865), MFN2 (Abcam, ab50838), BECN1/Beclin-1 (NEB, 3495S), ATG14 (Abcam, ab139727) or ACTA1/ACTIN (Sigma-Aldrich, A2172) at a 1:1000 dilution in TBS-T (5x 1 L [36.55 g NaCl, 15.5 g Tris, pH 7.4, 5 ml Tween-20 {VWR, Ac23336-0010}], dilute to x1,) overnight at 4°C, then incubated with secondary anti-murine or rabbit antibodies (as needed) conjugated to HRP (Cederlane, 715–035-150, 715–035-152). Bands were detected by enhanced ECL (GE Healthcare, CA89168-782) and visualized using an Amersham Imager 680 (GE Healthcare).
Cell culture and treatments
Cardiomyocytes were isolated from 1- to 2-day-old Sprague-Dawley rats, which were sacrificed by cervical dislocation. Hearts were excised and processed enzymatically to extract cardiomyocytes, which were then subjected to primary culture as previously reported [Citation61]. Cultured cells were transfected with expression plasmids using Effectene reagent (Qiagen, Inc., 301427) or infected with adenovirus carrying the desired gene 24 h after plating under serum free DMEM (DMEM/F12 [Thermo Fisher Scientific, MT10092 CV]- 1 pack, NaHCO3- 0.25 g, HEPES (Sigma-Aldrich, H3375-1 Kg) – 3.57 g, Na selenite (Sigma-Aldrich, S5261-100 G) −1 ml, transferrine (Sigma-Aldrich, T1408-500 MG) −1 ml, LiCl-1 ml, ascorbic acid (Sigma-Aldrich, A4034-100 G) −1 ml, insulin (Sigma-Aldrich, I0516-5 ml)-0.25 ml, T3 [L-Thyroxine-1 ml, gentamicin-1 ml] (Thermo Fisher Scientific, 15710072) conditions, as earlier described [Citation61]). For hypoxia studies, cells were placed in an air-tight chamber continually gassed with 95% N2, 5% CO2, and po2 ≤ 5 mm Hg.
Plasmids, siRNAs and adenoviruses
The following plasmids were used: pCMV10/3xflag-Clock (Addgene, 47334; Takahashi lab), pCMV10/3xflag-Clock V315R (Addgene, 47342; Takahashi lab), pCMV10/3xflag-Clock L57E (Addgene, 47337; Takahashi lab), pCMV10/3xflag-Clock L57E/L113E/W284 (Clock 3xMut; Addgene, 47343; Takahashi lab). pcDNA4B-Flag Clock ∆19 was a gift from Carrie L Partch (University of California, Santa Cruz, California, USA) [Citation62]. pcDNA flag HA plasmid (Addgene, 10792; Sellers lab) served as vehicle control for studies with plasmids. Cells were transfected for 18 h before being subjected to hypoxia. For CLOCK adenovirus studies, cells were infected for 24 h at a multiplicity of infection of 10–20 followed by hypoxia, empty cytomegalovirus (CMV) adenovirus (provided by Lorrie Kirshenbaum, University of Manitoba, Winnipeg, Manitoba, Canada [Citation63]) served as control for our studies. The small interfering RNA (siRNA) against Clock was custom designed and synthesized by Invitrogen (see Supplementary materials, Table S2 for details). Briefly, cells were transfected with siClock (60 nM), for 18 h, followed by media change and hypoxia for 18 h. Adenoviruses harboring shRNA against Atg7 (shAtg7), were generated as previously described [Citation64] using the following hairpin-forming oligonucleotides: 5′-CGGTCAAAGGACAAAGTTAACATTCAAGAGATGTTAACTTTGTCCTTTGACCTTTTTA-3′.
Cell viability assay
Cardiomyocytes were incubated with the vital dyes calcein acetoxymethylester (Calcein-AM, 2 µM; Life Technologies, C3100MP) to visualize green cells (live) and ethidium homodimer-1 (2 µM) to visualize red cells (dead) by epifluorescence microscopy at x200 magnification, using Olympus AX-70 research fluorescence microscope.
Reactive oxygen species (ROS)
Cells were incubated with dihydroethidium (Invitrogen, D23107) (2.5 μM) for 30 min and visualized by epifluorescence microscopy using Olympus AX-70 fluorescence microscope. Increase in red fluorescence indicates increase in superoxide species production.
Mitochondrial membrane potential (ΔΨM)
Cells were incubated with tetra-methylrhodamine methyl ester perchlorate (TMRM; Thermo Fisher Scientific, T-668) (50 nM) and visualized by epifluorescence microscopy. Cell fluorescence intensity was measured by ImageJ software. In the case of TMRM, mitochondria with normal cells fluoresce bright red staining; however, red staining becomes diffuse or very light when mitochondrial membrane potential dissipates.
Mitochondrial respiration
Cardiomyocytes were cultured in 96-well plates and treated with CLOCK adenovirus or siClock followed by 18 h hypoxia. Separate plate was treated the same way and left in normoxia for control. Both plates were assessed for mitochondrial oxygen consumption rate (OCR) on the same day, using XFe96 Cell Mito Stress Analyzer (Agilent). In brief, culture medium was changed 1 h before the assay to XF Base medium (Agilent, 102353–100), (pH 7.4) supplemented with 1 mM pyruvate (Thermo Fisher Scientific, 11360–070), and 10 mM D-glucose (Thermo Fisher Scientific, D16-500). Cells were then injected sequentially through ports in the Seahorse Flux Pak cartridges with oligomycin (1 μM; Sigma-Aldrich, O4876-5 MG), FCCP (2-[2-{4-(trifluoromethoxy)phenyl}hydrazinylidene]-propanedinitrile) (1 μM; Sigma-Aldrich, C2920), and rotenone (1 μM; Sigma-Aldrich, R8875-1 G) combined with antimycin (1 μM; Sigma-Aldrich, A8674-25 MG) as reported previously [Citation65].
Mitochondrial morphology assay
Cardiomyocytes were plated on collagen from rat tails coated coverslips at a density of 4 × 10⁴, infected with CMV or CLOCK adenoviruses and subjected to hypoxia. After hypoxia, cells were washed with PBS and fixed with 4% paraformaldehyde (Electron Microscopy Science, 15710). Permeabilization was achieved with 0.5% Triton-x100 for 10 min, followed by blocking with 1% Triton X-100 + 2% bovine serum albumin (BSA; Roche, 10775835001) for 15 min. HSPD1/HSP60 antibody (Santa Cruz Biotechnology, sc-13115) was applied for mitochondrial staining in blocking solution for 1 h at RT, followed by incubation with donkey anti-mouse IgG secondary antibody, Alexa Fluor® 546 conjugate (Thermo Fisher Scientific, LSA10036) for 1 h, RT. Cells were counterstained with nuclear dye Hoechst (Thermo Fisher Scientific, 33342) and mounted with FluorSave™ Reagent (Millipore, 345789). Images were acquired by confocal microscopy (Carl Zeiss Axio Observer SD) using the magnification 630× and Zen Software. For analysis, ImageJ software was used to calculate form factor (FF: perimeter2 /4π·Area), a measure of length and branching corresponding to a circular mitochondrion; values increase with mitochondrial elongation, as previously described [Citation66].
Autophagic flux
To assess autophagy in cardiomyocytes, cells were plated on coverslips at a density of 4 × 10⁴. On the next day, cells were co-infected with adenoviruses encoding green fluorescent protein (GFP)-fused LC3 (provided by Junichi Sadoshima, Rutgers University, New Jersey, USA [Citation67]), CMV or CLOCK (constructed by Lorrie Kirshenbaum, University of Manitoba, Winnipeg, Manitoba, Canada). Chloroquine treatment was used as a positive control for autophagic flux. After 18 h of hypoxia, cells were fixed with 4% paraformaldehyde (Electron Microscopy Science, 15710), and washed with PBS. Prior to imaging, slides were mounted with FluorSave™ Reagent (Millipore, 345789). images were acquired by confocal microscopy (Carl Zeiss Axio Observer SD) using the magnification 630× and Zen Software (Carl Zeiss) [Citation68]. For analysis, the number of GFP dots was determined by manual counting of fluorescent puncta from three different myocyte preparations with a 60 × objective. The number of dots per cell was obtained by dividing the total number of dots by the number cells.
MitoKeima staining
Keima with mitochondrial localization signaling (MitoKeima) acts as a mitochondrial localized pH indicator protein, as previously described [Citation30]. Cardiomyocytes were transfected with Clock plasmids or vector control pcDNA HA flag in addition to infection with MitoKeima adenovirus (provided by Junichi Sadoshima, Rutgers University, New Jersey, USA [Citation69]). Following hypoxia, cells were washed with PBS and fixed with 4% paraformaldehyde (Electron Microscopy Science, 15710). Cells were mounted with FluorSave™ Reagent (Millipore, 345789) and images acquired by confocal microscopy (Carl Zeiss Axio Observer SD) using the magnification 63× and Zen Software (Carl Zeiss). Mitophagy was quantified using Zeiss ZEN Blue software measuring the fluorescence signal ratio 560/440 nm and size of MitoKeima puncta. The higher 560/440 signal ratio (red/yellow color) indicates mitochondria that have fused with lysosomes (acidic pH), lower 560/440 signal ratio (green color) indicative of complete mitochondrial clearance. The size of puncta was measured by delineating the five largest puncta in each image and the fold-change in area was calculated by averaging 3–5 images from each condition and normalized to control, assigned the value of one. In each experimental model, all imaging parameters remain the same for all data acquisition.
Luciferase assay
Cells were transfected with a Tfeb luciferase reporter construct designated (TFEBluc), as previously described [Citation70]. Luciferase activity was normalized to β-galactosidase activity to control for differences in transfection efficiency and data are expressed as relative light units.
Statistical analysis
Data are expressed as average ± SEM. Multiple comparisons between groups were determined by one-way ANOVA. Tukey’s post hoc test was used to determine differences among groups. The unpaired two tailed Student’s t-test was used to compare mean differences between two groups. Differences were considered to be statistically significant to a level of *p < 0.05 or **p < 0.01. In all studies, data were obtained from at least n = 3–6 independent myocyte isolations for each condition tested.
Supplemental Material
Download PDF (356.5 KB)Acknowledgments
We are grateful to Hongying Gang, Floribeth Aguilar, and Raya Margulets for technical assistance and critical comments on the manuscript. The Canadian Center for Computational Genomics (C3G) is a Genomics Technology Platform (GTP) which is supported by the Canadian Government through Genome Canada.
Disclosure statement
The authors declare no competing interests.
Supplementary material
Supplemental data for this article can be accessed here.
Additional information
Funding
References
- Ashrafian H, Frenneaux MP, Opie LH. Metabolic mechanisms in heart failure. Circulation. 2007;116:434–448.
- Balaban RS, Nemoto S, Finkel T. Mitochondria, oxidants, and aging. Cell. 2005;120:483–495.
- Reznick RM, Zong H, Li J, et al. Aging-associated reductions in AMP-activated protein kinase activity and mitochondrial biogenesis. Cell Metab. 2007;5:151–156.
- Zid BM, Rogers AN, Katewa SD, et al. 4E-BP extends lifespan upon dietary restriction by enhancing mitochondrial activity in drosophila. Cell. 2009;139:149–160.
- Petrie JR, Guzik TJ, Touyz RM. Diabetes, hypertension, and cardiovascular disease: clinical insights and vascular mechanisms. Can J Cardiol. 2018;34:575–584.
- Ikeda Y, Sciarretta S, Nagarajan N, et al. New insights into the role of mitochondrial dynamics and autophagy during oxidative stress and aging in the heart. Oxid Med Cell Longev. 2014;2014. DOI:10.1155/2014/210934
- Rabinovich-Nikitin I, Lieberman B, Martino TA, et al. Circadian-regulated cell death in cardiovascular diseases. Circulation. 2019;139:965–980.
- Adamovich Y, Ladeuix B, Golik M, et al. Rhythmic oxygen levels reset circadian clocks through HIF1α. Cell Metab. 2017;25:93–101.
- Portaluppi F, Tiseo R, Smolensky MH, et al. Circadian rhythms and cardiovascular health. Sleep Med Rev. 2012;16:151–166.
- Martino TA, Young ME. Influence of the cardiomyocyte circadian clock on cardiac physiology and pathophysiology. J Biol Rhythms. 2015;30:183–205.
- Lowrey PL, Takahashi JS. Genetics of circadian rhythms in Mammalian model organisms. Adv Genet. 2011;74:175–230
- Bray MS, Shaw CA, Moore MWS, et al. Disruption of the circadian clock within the cardiomyocyte influences myocardial contractile function, metabolism, and gene expression. Am J Physiol Circ Physiol. 2008;294:H1036–47.
- Durgan DJ, Hotze MA, Tomlin TM, et al. The intrinsic circadian clock within the cardiomyocyte. Am J Physiol Circ Physiol. 2005;289:H1530–41.
- Alibhai FJ, LaMarre J, Reitz CJ, et al. Disrupting the key circadian regulator CLOCK leads to age-dependent cardiovascular disease. J Mol Cell Cardiol. 2017;105:24–37.
- Lefta M, Campbell KS, Feng H-Z, et al. Development of dilated cardiomyopathy in Bmal1 -deficient mice. Am J Physiol Circ Physiol. 2012;303:H475–85.
- Baron KG, Reid KJ. Circadian misalignment and health. Int Rev Psychiatry. 2014;26:139–154.
- Alibhai FJ, Tsimakouridze EV, Reitz CJ, et al. Consequences of circadian and sleep disturbances for the cardiovascular system. Can J Cardiol. 2015;31:860–872.
- Reitz CJ, Martino TA. Disruption of circadian rhythms and sleep on critical illness and the impact on cardiovascular events. Curr Pharm Des. 2015;21:3505–3511.
- Durgan DJ, Young ME. The cardiomyocyte circadian clock: emerging roles in health and disease. Circ Res. 2010;106:647–658.
- Vitaterna MH, King DP, Chang AM, et al. Mutagenesis and mapping of a mouse gene, clock, essential for circadian behavior. Science. 1994;264:719–725.
- Bertolucci C, Cavallari N, Colognesi I, et al. Evidence for an overlapping role of CLOCK and NPAS2 transcription factors in liver circadian oscillators. Mol Cell Biol. 2008;28:3070–3075.
- Debruyne JP. Oscillating perceptions: the ups and downs of the CLOCK protein in the mouse circadian system. J Genet. 2008;87:437–446.
- Debruyne JP, Noton E, Lambert CM, et al. Mouse CLOCK is not required for circadian oscillator function. Neuron. 2006;50:465–477.
- Duong ATH, Reitz CJ, Louth EL, et al. The Clock mechanism influences neurobiology and adaptations to heart failure in clock ∆19/∆19 mice with implications for circadian medicine. Sci Rep. 2019;9. DOI:10.1038/s41598-019-41469-7
- Asher G, Schibler U. Crosstalk between components of circadian and metabolic cycles in mammals. Cell Metab. 2011;13:125–137.
- Bass J, Takahashi JS. Circadian integration of metabolism and energetics. Science. 2010;330:1349–1354.
- Zhang EE, Kay SA. Clocks not winding down: unravelling circadian networks. Nat Rev Mol Cell Biol. 2010;11:764–776.
- Panda S, Hogenesch JB, Kay SA. Circadian rhythms from flies to human. Nature. 2002;417:329–335.
- Muñoz E, Brewer M, Baler R. Circadian transcription: thinking outside the E-Box. J Biol Chem. 2002;277:36009–36017.
- Katayama H, Kogure T, Mizushima N, et al. A sensitive and quantitative technique for detecting autophagic events based on lysosomal delivery. Chem Biol. 2011;18:1042–1052.
- Gang H, Dhingra R, Lin J, et al. PDK2-mediated alternative splicing switches Bnip3 from cell death to cell survival. J Cell Biol. 2015;210:1101–1115.
- Huang N, Chelliah Y, Shan Y, et al. Crystal structure of the heterodimeric CLOCK:BMAL1 transcriptional activator complex. Science. 2012;337:189–194.
- Mistry P, Duong A, Kirshenbaum L, et al. Cardiac Clocks and preclinical translation. Heart Fail Clin. 2017;13:657–672.
- Kubli DA, Gustafsson ÅB. Mitochondria and mitophagy: the yin and yang of cell death control. Circ Res. 2012;111:1208–1221.
- Dorn GW, Kitsis RN. The mitochondrial dynamism-mitophagy-cell death interactome: multiple roles performed by members of a mitochondrial molecular ensemble. Circ Res. 2015;116:167–182.
- Tong M, Saito T, Zhai P, et al. Mitophagy is essential for maintaining cardiac function during high fat diet-induced diabetic cardiomyopathy. Circ Res. 2019;CIRCRESAHA.118.314607.
- Shirakabe A, Zhai P, Ikeda Y, et al. Drp1-dependent mitochondrial autophagy plays a protective role against pressure overload-induced mitochondrial dysfunction and heart failure. Circulation. 2016;133:1249–1263.
- Hamacher-Brady A, Brady NR, Logue SE, et al. Response to myocardial ischemia/reperfusion injury involves Bnip3 and autophagy. Cell Death Differ. 2007;14:146–157.
- De Lazzari F, Bisaglia M, Zordan MA, et al. Circadian rhythm abnormalities in parkinson’s disease from humans to flies and back. Int J Mol Sci. 2018;19. DOI:10.3390/ijms19123911
- Pascual F, Coleman RA. Fuel availability and fate in cardiac metabolism: a tale of two substrates. Biochim Biophys Acta - Mol Cell Biol Lipids. 2016;1861:1425–1433.
- Liesa M, Shirihai OS. Mitochondrial dynamics in the regulation of nutrient utilization and energy expenditure. Cell Metab. 2013;17:491–506.
- Youle RJ, Van Der Bliek AM. Mitochondrial fission, fusion, and stress. Science. 2012;337:1062–1065.
- Podobed P, Pyle WG, Ackloo S, et al. The day/night proteome in the murine heart. Am J Physiol Integr Comp Physiol. 2014;307:R121–37.
- Podobed PS, Alibhai FJ, Chow CW, et al. Circadian regulation of myocardial sarcomeric Titin-cap (Tcap, telethonin): identification of cardiac clock-controlled genes using open access bioinformatics data. PLoS One. 2014;9:e104907.
- Tsimakouridze EV, Straume M, Podobed PS, et al. Chronomics of pressure overloadinduced cardiac hypertrophy in mice reveals altered day night gene expression and biomarkers of heart disease. Chronobiol Int. 2012;29:810–821.
- Martino T, Arab S, Straume M, et al. Day/night rhythms in gene expression of the normal murine heart. J Mol Med. 2004;82:256–264.
- Storch KF, Lipan O, Leykin I, et al. Extensive and divergent circadian gene expression in liver and heart. Nature. 2002;417:78–83.
- Koike N, Yoo SH, Huang HC, et al. Transcriptional architecture and chromatin landscape of the core circadian clock in mammals. Science. 2012;338:349–354.
- Jacobi D, Liu S, Burkewitz K, et al. Hepatic Bmal1 regulates rhythmic mitochondrial dynamics and promotes metabolic fitness. Cell Metab. 2015;22:709–720.
- Li E, Li X, Huang J, et al. BMAL1 regulates mitochondrial fission and mitophagy through mitochondrial protein BNIP3 and is critical in the development of dilated cardiomyopathy. Protein Cell. 2020;11:661–679.
- Scheer FAJL, Hilton MF, Mantzoros CS, et al. Adverse metabolic and cardiovascular consequences of circadian misalignment. Proc Natl Acad Sci. 2009;106:4453–4458.
- Alibhai FJ, Tsimakouridze EV, Chinnappareddy N, et al. Short-term disruption of diurnal rhythms after murine myocardial infarction adversely affects long-term myocardial structure and function. Circ Res. 2014;114:1713–1722.
- Bolger AM, Lohse M, Usadel B. Trimmomatic: a flexible trimmer for Illumina sequence data. Bioinformatics. 2014;30:2114–2120.
- Dobin A, Davis CA, Schlesinger F, et al. STAR: ultrafast universal RNA-seq aligner. Bioinformatics. 2013;29:15–21.
- Anders S, Pyl PT, Huber W. HTSeq-A Python framework to work with high-throughput sequencing data. Bioinformatics. 2015;31:166–169.
- Bourgey M, Dali R, Eveleigh R, et al. GenPipes: an open-source framework for distributed and scalable genomic analyses. Gigascience. 2019;1(8(6)):pii: giz037.
- Huber W, Carey VJ, Gentleman R, et al. Orchestrating high-throughput genomic analysis with bioconductor. Nat Methods. 2015;12:115–121.
- Robinson MD, McCarthy DJ, Smyth GK. edgeR: a bioconductor package for differential expression analysis of digital gene expression data. Bioinformatics. 2009;26:139–140.
- Young MD, Wakefield MJ, Smyth GK, et al. Gene ontology analysis for RNA-seq: accounting for selection bias. Genome Biol. 2010;11:R14.
- Dhingra R, Guberman M, Rabinovich-Nikitin I, et al. Impaired NF-κB signalling underlies cyclophilin D-mediated mitochondrial permeability transition pore opening in doxorubicin cardiomyopathy. Cardiovasc Res. 2019;116:1161–1174.
- Gang H, Hai Y, Dhingra R, et al. A novel hypoxia-inducible spliced variant of mitochondrial death gene Bnip3 promotes survival of ventricular myocytes. Circ Res. 2011;108:1084–1092.
- Michael AK, Harvey SL, Sammons PJ, et al. Cancer/testis antigen PASD1 silences the circadian Clock. Mol Cell. 2014;58:743–754.
- Kirshenbaum LA, MacLellan WR, Mazur W, et al. Highly efficient gene transfer into adult ventricular myocytes by recombinant adenovirus. J Clin Invest. 1993;92:381–387.
- Saito T, Nah J, Oka SI, et al. An alternative mitophagy pathway mediated by Rab9 protects the heart against ischemia. J Clin Invest. 2019;129:802–819.
- Roy Chowdhury SK, Smith DR, Saleh A, et al. Impaired adenosine monophosphate-activated protein kinase signalling in dorsal root ganglia neurons is linked to mitochondrial dysfunction and peripheral neuropathy in diabetes. Brain. 2012;135:1751–1766.
- Sassone F, Margulets V, Maraschi A, et al. Bcl-2/adenovirus E1B 19-kDa interacting protein (BNip3) has a key role in the mitochondrial dysfunction induced by mutant huntingtin. Hum Mol Genet. 2015;24:6530–6539.
- Hariharan N, Zhai P, Sadoshima J. Oxidative stress stimulates autophagic flux during ischemia/reperfusion. Antioxid Redox Signal. 2011;14:2179–2190.
- Sciarretta S, Hariharan N, Monden Y, Zablocki D, Sadoshima J. Is autophagy in response to ischemia and reperfusion protective or detrimental for the heart?. Pediatr Cardiol. 2011;32(3):275–281.
- Shirakabe A, Fritzky L, Saito T, et al. Evaluating mitochondrial autophagy in the mouse heart. J Mol Cell Cardiol. 2016;92:134–139.
- Dhingra R, Gang H, Wang Y, et al. Bidirectional regulation of nuclear factor-κb and mammalian target of rapamycin signaling functionally links bnip3 gene repression and cell survival of ventricular myocytes. Circ Hear Fail. 2013;6:335–343.