
ABSTRACT
CD38 is a cell surface receptor capable of generating calcium-mobilizing second messengers. It has been implicated in host defense and cancer biology, but signaling mechanisms downstream of CD38 remain unclear. Mutations in LRRK2 (leucine-rich repeat kinase 2) are the most common genetic cause of Parkinson disease; it is also a risk factor for Crohn disease, leprosy, and certain types of cancers. The pathogenesis of these diseases involves inflammation and macroautophagy/autophagy, processes both CD38 and LRRK2 are implicated in. Here, we mechanistically and functionally link CD38 and LRRK2 as upstream activators of TFEB (transcription factor EB), a host defense transcription factor and the master transcriptional regulator of the autophagy/lysosome machinery. In B-lymphocytes and macrophages, we show that CD38 and LRRK2 exist in a complex on the plasma membrane. Ligation of CD38 with the monoclonal antibody clone 90 results in internalization of the CD38-LRRK2 complex and its targeting to the endolysosomal system. This generates an NAADP-dependent calcium signal, which requires LRRK2 kinase activity, and results in the downstream activation of TFEB. lrrk2 KO macrophages accordingly have TFEB activation defects following CD38 or LPS stimulation and fail to switch to glycolytic metabolism after LPS treatment. In overexpression models, the pathogenic LRRK2G2019S mutant promotes hyperactivation of TFEB even in the absence of CD38, both by stabilizing TFEB and promoting its nuclear translocation via aberrant calcium signaling. In sum, we have identified a physiological CD38-LRRK2-TFEB signaling axis in immune cells. The common pathogenic mutant, LRRK2G2019S, appears to hijack this pathway.
Abbreviations:ADPR: ADP-ribose; AMPK: AMP-activated protein kinase; BMDM: bone marrow-derived macrophage; cADPR: cyclic-ADP-ribose; COR: C-terminal of ROC; CTSD: cathepsin D; ECAR: extracellular acidification rate; EDTA: ethylenediaminetetraacetic acid; GAPDH: glyceraldehyde-3-phosphate dehydrogenase; GFP: green fluorescent protein; GPN: Gly-Phe β-naphthylamide; GSK3B/GSK3β: glycogen synthase kinase 3 beta; GTP: guanosine triphosphate; KD: knockdown; LAMP1: lysosomal-associated membrane protein 1; LRR: leucine rich repeat; LRRK2: leucine rich repeat kinase 2; mAb: monoclonal antibody; MAP1LC3B/LC3B: microtubule-associated protein 1 light chain 3 beta; MAPK/ERK: mitogen-activated protein kinase; MCOLN1: mucolipin 1; MFI: mean fluorescence intensity; mRNA: messenger RNA; MTOR: mechanistic target of rapamycin kinase; NAADP: nicotinic acid adenine dinucleotide phosphate; NAD: nicotinamide adenine dinucleotide; NADP: nicotinamide adenine dinucleotide phosphate; PD: Parkinson disease; PPP3CB: protein phosphatase 3, catalytic subunit, beta isoform; q-RT-PCR: quantitative reverse transcription polymerase chain reaction; ROC: Ras of complex; siRNA: small interfering RNA; SQSTM1/p62: sequestome 1; TFEB: transcription factor EB; TPCN: two pore channel; TRPM2: transient receptor potential cation channel, subfamily M, member 2; ZKSCAN3: zinc finger with KRAB and SCAN domains 3
Introduction
CD38 is a cell surface receptor highly expressed in lymphoid and myeloid cells [Citation1]. It exists as a 46-kDa type II and type III membrane protein and has multiple enzymatic functions enabling the production of calcium-mobilizing second messengers [Citation2]. Utilizing nicotinic adenine dinucleotide (NAD) as a substrate, CD38 has hydrolase and cyclase activity that results in the production of nicotinamide and ADP-ribose (ADPR) or cyclic ADP-ribose (cADPR) respectively [Citation3,Citation4]. In the acidic environment of endosomes/lysosomes, CD38 utilizes nicotinic adenine dinucleotide phosphate (NADP) to catalyze the formation of nicotinic acid adenine dinucleotide phosphate (NAADP) through a base-exchange reaction [Citation5–7]. Each of these second messengers mobilizes calcium from different sources; ADPR binds TRPM2 to mobilize extracellular calcium [Citation8], cADPR mobilizes ER calcium via RYR (ryanodine receptor) proteins [Citation9], whereas NAADP targets TPCN (two pore channel) proteins on the lysosome [Citation10,Citation11]. Monoclonal antibodies (mAbs) directed at CD38 are used for the treatment of multiple myeloma, including daratumumab and isatuximab [Citation1,Citation2]. In addition to antibody-dependent cell-mediated cytotoxicity, these antibodies induce direct cytotoxicity via activation of intracellular pathways [Citation12,Citation13]. Despite clinical use of these monoclonal antibodies, the molecular mechanisms mediating signaling downstream of CD38 remain unclear.
LRRK2 (leucine-rich repeat kinase 2) is a 280-kDa protein with multiple functional and protein interaction domains. It contains a Ras of complex (ROC) domain with GTPase activity, a C-terminal-of-Roc (COR) linker domain, and a kinase domain belonging to the receptor-interacting protein family [Citation14,Citation15]. Autosomal dominant mutations in LRRK2 are the most common genetic cause of Parkinson disease (PD) and result in late-onset disease that is symptomatically indistinguishable from idiopathic PD [Citation16]. LRRK2 localizes to several cellular membranes and influences cellular processes via alterations in vesicle trafficking. It has been implicated in regulating the autophagy-lysosome system, which is important in the pathogenesis of PD [Citation17]. LRRK2 has also been identified as a risk factor for Crohn disease, leprosy, and certain types of cancers [Citation18–20]. As LRRK2 is highly expressed in B-lymphocytes and myeloid cells and these diseases are linked by inflammation, focus has turned to the immune system to elucidate the physiological and pathophysiological roles of LRRK2 [Citation21].
Autophagy is a conserved lysosome-dependent degradation pathway that clears endogenous and exogenous cytosolic substrates. In addition to its role in cell homeostasis, autophagy is an essential modulator of the immune response [Citation22]. Autophagosome formation is regulated both at the protein level and transcriptionally by TFEB (transcription factor EB) [Citation23,Citation24]. Both CD38 and LRRK2 have been implicated in autophagy [Citation25–32]. CD38 and NAADP positively regulate autophagy following LPS stimulation in hepatocytes [Citation25], while in vivo studies in mouse models of coronary atherosclerosis show autophagic defects in CD38-deficient mice [Citation26,Citation27]. The effects of LRRK2 on autophagy remain more enigmatic, as discordant reports exist in different model systems [Citation29]. In macrophages, knockdown (KD) of LRRK2 was shown to impede autophagic flux [Citation30], while expression of the most common pathogenic mutant, the kinase-overactive LRRK2G2019S, increases autophagosome formation [Citation31,Citation32].
As CD38 and LRRK2 regulate autophagy through calcium-dependent pathways and TFEB is activated by calcium-dependent dephosphorylation, we investigated whether these proteins function in the same signaling pathway. In B-lymphocytes and macrophages, we find that mAb ligation of CD38 activates TFEB in an NAADP-lysosomal calcium-dependent manner. CD38-dependent calcium signaling and downstream activation of TFEB requires LRRK2, which exists constitutively in complex with CD38 on the plasma membrane. Upon mAb ligation of CD38, this complex is internalized and targeted to the endolysosomal system. The kinase-overactive LRRK2G2019S mutant aberrantly activates TFEB by phosphorylation-mediated stabilization and by enhancing TFEB nuclear translocation. Finally, we show that LRRK2G2019S-mediated TFEB activation is dependent on NAADP-TPCN2 calcium signaling. These data provide insights into the physiological and pathophysiological roles of CD38 and LRRK2.
Results
CD38 ligation drives CD38 internalization and TFEB nuclear translocation in B-lymphocytes and macrophages
Using flow cytometry, we assessed CD38 expression on C57BL/6 J splenocytes and bone marrow-derived macrophages (BMDMs). Splenic B-lymphocytes highly expressed CD38 (Fig. S1A). Approximately 60% BMDMs also expressed CD38, which was upregulated upon LPS stimulation (Fig. S1B and S1C). Given the reported role of CD38 in autophagy [Citation25–28], we investigated whether direct ligation of CD38 by the mAb clone 90 could activate TFEB. Nuclear fractionation of B-lymphocytes after CD38 ligation showed robust nuclear translocation of endogenous TFEB, with stimulated cells exhibiting a two-fold increase in nuclear TFEB compared to the control (). BMDMs similarly showed TFEB nuclear translocation, exhibiting a two-fold increase in nuclear TFEB after CD38 ligation compared to unstimulated cells (. Indicating this effect is specific to CD38, unstimulated BMDMs showed no difference in TFEB nuclear translocation versus those treated with the rat IgG2a, κ isotype control (Fig. S1D). These results indicate that CD38 activation triggers the nuclear translocation of TFEB in both B-lymphocytes and BMDMs.
Figure 1. Anti-CD38 mAb clone 90 drives CD38 internalization and TFEB nuclear translocation via NAADP-driven calcium signaling. (A) Immunoblot of endogenous TFEB after nuclear fractionation of WT B-lymphocytes treated with 10 µg/ml anti-CD38 antibody (clone 90) or an isotype control (Iso) for 1 h. (B) Quantification of nuclear TFEB normalized to histone H3 from (A) (n = 3). (C) Immunoblot of endogenous TFEB after nuclear fractionation of WT BMDMs treated with 5 µg/ml (+) or 10 µg/ml (++) anti-CD38 antibody (clone 90) for 1 h. (D) Quantification of nuclear TFEB normalized to histone H3 from (C) (n = 4). (E) Confocal imaging of WT BMDMs treated with 10 µg/ml anti-CD38 for 1 h and stained for TFEB (red) and CD38 (clone 90, green). Scale bar: 70 µm, 30 µm (zoom). (F) Confocal imaging of HEK293T cells transfected with HA-CD38 stimulated with anti-CD38 antibody (clone 90-Alexa Fluor 647, red) at either 4°C or 37°C for 30 min and subsequently stained for HA (green). Scale bar: 10 µm. (G) CD38 internalization after stimulation with anti-CD38 (clone 90) or an isotype control (10 µg/ml) (n = 2). (H) Confocal imaging of WT BMDMs following stimulation with anti-CD38 (clone 90, 10 µg/ml), an isotype control, or starvation. Quantification of nuclear:cytosolic mean fluorescence intensity (MFI) for each condition is shown (n ≥ 20 cells per condition). Scale bar: 20 µm. (I) Confocal imaging of WT BMDMs following stimulation with anti-CD38 (clone 90, 10 µg/ml) after preincubation with the indicated inhibitor. Quantification of nuclear:cytosolic mean fluorescence intensity (MFI) for each condition is shown (n ≥ 150 cells per condition). Scale bar: 30 µm. (J) Intracellular calcium response of WT B-lymphocytes stimulated with isotype control (10 µg/ml, blue) or anti-CD38 (clone 90 10 µg/ml, black) antibody with or without preincubation with Ned-19 (100 µM, green) or Gly-Phe-β-naphtylamide (GPN 200 µM, red). (K) Quantification of calcium responses (area under curve) to 5 min after stimulation with anti-CD38 (clone 90) and preincubation with Ned-19 (100 µM), 8-Br-ADPR (100 µM), 8-Br-cADPR (100 µM), GPN (200 µM), or EDTA (2 mM) (n = 3). Calcium response curve is shown to 5 min as fluorescent counts (iLm1). For western data, histone H3 and GAPDH are shown as fractionation controls. Western bands are quantified, normalized to the loading control, then presented relative to the control. (*p < 0.05; **p < 0.002, ***p < 0.0001, Student’s t-test or one-way ANOVA with post hoc Tukey’s HSD).
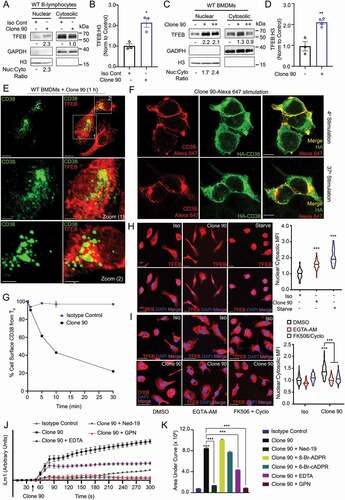
We then immunostained endogenous TFEB in BMDMs stimulated with clone 90 while concomitantly labeling active CD38 complexes for direct clone 90 visualization. Consistent with the notion that CD38 ligation drives TFEB nuclear translocation, CD38-expressing BMDMs showed significant nuclear TFEB by confocal microscopy (cells 1 and 2), while CD38-non-expressing cells showed cytoplasmic TFEB distribution (unlabeled cell) (). One hour after addition of the CD38 mAb (clone 90), the CD38 mAb-CD38 complex presumably underwent endocytosis as it no longer resided on the cell surface (), consistent with the known internalization of CD38 following activation [Citation33,Citation34]. HA-CD38-expressing HEK293T cells stimulated with clone 90-Alexa Fluor 647 to directly visualize active complexes similarly showed cell surface staining at 4°C, with internalization of active complexes after 30 min at 37°C (). Finally, a flow cytometry-based internalization assay showed nearly 10% internalization 1 min after clone 90 stimulation, with 80% of CD38 internalized by 30 min (). Taken together, these data indicate CD38 ligation with the mAb clone 90 in B-lymphocytes and BMDMs drives rapid CD38 internalization and concomitant nuclear translocation of TFEB.
CD38-mediated TFEB nuclear translocation is dependent on NAADP, lysosomal calcium, and calcium-induced calcium release
To dissect the mechanisms by which CD38 mediates TFEB nuclear translocation, we developed an assay that monitored TFEB nuclear translocation by calculating the nuclear:cytoplasmic fluorescent intensity ratio of immunostained TFEB. Expectedly, both nutrient starvation and ligation of CD38 with clone 90 induced TFEB nuclear translocation in BMDMs (). Given CD38 generates calcium-mobilizing second messengers and that TFEB’s nuclear translocation is regulated by dephosphorylation of Ser211 by calcium-dependent PPP3/calcineurin [Citation4,Citation35], we tested whether CD38-mediated translocation of TFEB is calcium-dependent. Pretreatment with either the cell-permeant calcium chelator EGTA-AM or the PPP3/calcineurin inhibitors cyclosporine and FK506 inhibited clone 90-mediated TFEB nuclear translocation (). Consistently, CD38 overexpression induced TFEB nuclear translocation in HeLa cells, which was reversed by calcium chelation and PPP3/calcineurin inhibition (Fig. S1E).
Next, we used calcium-monitoring assays to record cytoplasmic calcium levels following treatment with clone 90. Ligation of CD38 in B-lymphocytes and macrophages resulted in a prolonged calcium response, with cytosolic calcium levels increasing to at least 5 min (, S1F, and S1G). The calcium response is specific to CD38 ligation by clone 90, as the agonistic CD38 antibody NIM-R5 was unable to generate a robust calcium response (Fig. S1H and S1I). Monitoring calcium traces when adding ionomycin 5 min after CD38-ligation with clone 90 demonstrated that clone 90 mobilizes the majority of intracellular calcium stores, as ionomycin treatment at doses known to mobilize intracellular calcium (100 nM) only induced a slight blip in the calcium tracing while ionomycin treatment with doses known to mobilize extracellular calcium (1.5 μM) induced a sharp rise in intracellular calcium (Fig. S1J). To determine which second messenger is responsible for this calcium mobilization, we preincubated B-lymphocytes with the NAADP inhibitor Ned-19, the ADPR inhibitor 8-Br-ADPR, and the cADPR inhibitor 8-Br-cADPR before the addition of clone 90. Preincubation with Ned-19 abolished the CD38-induced calcium signal while no effect was observed upon preincubation with 8-Br-ADPR or 8-Br-cADPR (), indicating NAADP is responsible for the calcium response after CD38 ligation by clone 90.
NAADP directly targets the lysosomal TPCNs, thereby mobilizing lysosomal calcium. This promotes amplification of the calcium signal by mobilizing calcium from other stores, a process termed calcium-induced calcium release [Citation10,Citation36,Citation37]. To parse out the contributions of various calcium stores in clone 90-induced calcium release, we pretreated B-lymphocytes with Gly-l-Phe 2-naphthylamide (GPN), EDTA, or thapsigargin to deplete lysosomal, extracellular, and ER calcium stores respectively. Pretreatment of B-lymphocytes with GPN completely abolished calcium signaling following CD38 ligation, while EDTA-pretreated cells retained an initial calcium peak but failed to further enhance cytoplasmic calcium with prolonged monitoring (. Clone 90-treated cells depleted of ER calcium via thapsigargin paradoxically showed a reduction in cytoplasmic calcium compared to basal during the prolonged ramp phase, likely due to calcium efflux after calcium channel gating secondary to calcium-induced calcium release. Notably, the drastic reduction in cytosolic calcium was mitigated following clone 90 stimulation in thapsigargin-treated cells co-incubated with GPN or Ned-19 (Fig. S1K), suggesting that ligation of CD38 with clone 90 results in an initial NAADP-mediated lysosomal calcium response, which potentiates signaling via calcium-induced calcium release. This allows PPP3/calcineurin-dependent TFEB nuclear translocation following CD38 ligation with clone 90.
CD38-mediated TFEB activation and calcium release requires LRRK2
As LRRK2 has been implicated in autophagy via NAADP-dependent signaling [Citation31,Citation32], we tested whether signaling downstream of CD38 is LRRK2 dependent. Using B-lymphocytes and BMDMs from lrrk2 KO mice (Fig. S2A), we immunoblotted for TFEB following nuclear fractionation of clone 90-stimulated cells (–C). WT B-lymphocytes showed a two-fold increase in nuclear TFEB compared to the isotype control, while lrrk2 KO B-lymphocytes showed no TFEB nuclear translocation after CD38 ligation (. Similarly, WT BMDMs exhibited a two-and-a-half-fold increase in nuclear TFEB compared to the isotype control after CD38 stimulation, while lrrk2 KO BMDMs showed no increase (. These data indicate that lrrk2 KO cells have defects in CD38-mediated TFEB activation. CD38 expression (cell surface and total) is unchanged between WT and lrrk2 KO B-lymphocytes and macrophages (Fig. S2A-C), indicating TFEB activation defects in lrrk2 KO cells are due to events downstream of CD38. Thus, we investigated whether lrrk2 KO cells have defects in CD38-mediated calcium mobilization. Ligation of CD38 in WT B-lymphocytes produced a robust dose-dependent increase in cytosolic calcium, while lrrk2 KO B-lymphocytes exhibited attenuated calcium mobilization compared to WT controls (.
Figure 2. CD38 calcium signaling and nuclear localization of TFEB is dependent on LRRK2. Immunoblot of endogenous TFEB after nuclear fractionation of WT and lrrk2 KO (A) B-lymphocytes and (B) BMDMs treated with 5 µg/ml anti-CD38 antibody (clone 90) or an isotype control (Iso) for 1 h. (C) Quantification of western blots from A (upper, n = 4) and B (lower, n = 3). (D) Intracellular calcium response of purified WT (black) and lrrk2 KO (red) B-lymphocytes stimulated with anti-CD38 (clone 90, 5 and 10 µg/ml) antibody. (E) Quantification of calcium response (area under curve) from (D) to 5 min (n = 4). (F) Intracellular calcium response of purified WT (black) and LRRK2G2019S KI (blue) B-lymphocytes stimulated with anti-CD38 (clone 90, 5 and 10 µg/ml) antibody. (G) Quantification of calcium response from (F) to 5 min (n = 4). (H) Intracellular calcium response of purified WT (solid lines) or LRRK2G2019S KI (dashed lines) B-lymphocytes stimulated with anti-CD38 (clone 90 10 µg/ml, black) antibody with or without Ned-19 (100 µM, blue) or Gly-Phe-β-naphthylamide (200 µM, green). (I) Quantification of calcium responses (area under curve) from (H) to 5 min (n = 4). (J) Purified wild type (WT, black) or lrrk2 KO (KO, red) B-lymphocytes stimulated with NAADP-AM (3 µM). (K) Quantification of calcium responses (area under curve) from (H) to 5 min (n = 6). Partial calcium response curve is shown (to 3 min) as fluorescent counts (iLm1). For western data, histone H3 and GAPDH are shown as fractionation and loading controls. Western bands are quantified, normalized to the loading control, and presented relative to the control lane. (# – not significant; *p < 0.05; **p < 0.002, ***p < 0.0001, Student’s t-test or one-way ANOVA with post hoc Tukey’s HSD or Fisher’s LSD).
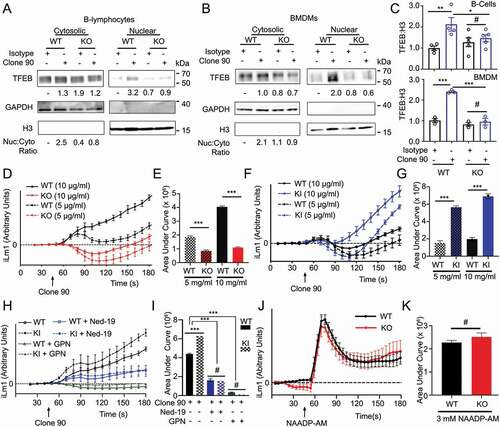
The pathogenic LRRK2G2019S mutation is the most common genetic cause of PD and enhances the protein’s kinase activity [Citation14]. To verify the importance of LRRK2 kinase activity in CD38-mediated calcium mobilization, we first preincubated B-lymphocytes with the LRRK2 kinase inhibitor GSK2578215A. This blunted the calcium response elicited by CD38 (Fig. S2D and S2E), indicating that LRRK2 kinase activity is required for calcium production following CD38 ligation. Next, we monitored cytoplasmic calcium levels after CD38 ligation in WT and LRRK2G2019S knock-in (KI) B-lymphocytes [Citation38]. LRRK2G2019S KI cells exhibited a significantly larger calcium response than WT controls, confirming the importance of LRRK2 kinase activity (. Indicating that LRRK2G2019S impacts CD38-mediated calcium by enhancing LRRK2’s physiological activity, pretreatment of both WT and LRRK2G2019S KI B-lymphocytes with GPN or Ned-19 reduced the calcium response to similar levels (. Finally, we explored whether LRRK2 functions upstream or downstream of NAADP using NAADP-AM, a cell-permeant NAADP analog, and measuring calcium responses in WT and lrrk2 KO B-lymphocytes. We observed no differences in the calcium response to NAADP-AM between WT and lrrk2 KO B-lymphocytes, suggesting LRRK2 functions upstream of NAADP production (. Together, our data show that LRRK2 kinase activity is required for the NAADP-dependent calcium response downstream of CD38. LRRK2 functions upstream of NAADP in this signaling pathway and is required for CD38-dependent TFEB activation.
CD38 ligation induces CD38 endolysosomal targeting independent of LRRK2
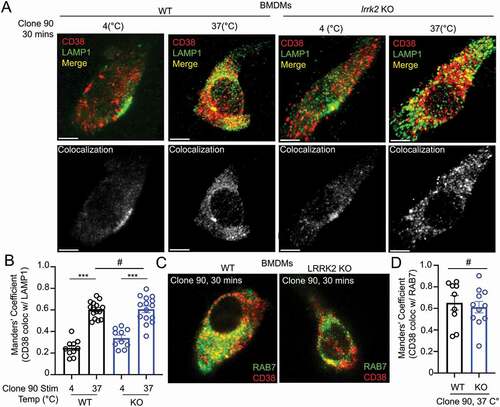
As our data suggest LRRK2 functions downstream of CD38 but upstream of NAADP, we reasoned LRRK2 might regulate CD38 internalization, CD38 trafficking through the endolysosomal pathway, or CD38-mediated production of NAADP. Flow cytometry-based CD38 internalization assays showed no differences between WT and lrrk2 KO B cells after clone 90 stimulation (Fig. S3A). We next monitored CD38 intracellular localization after clone 90 stimulation by visualizing active CD38 complexes via immunofluorescence. WT macrophages exhibited significantly enhanced CD38-LAMP1 colocalization (Manders’ coefficient 0.24 unstimulated vs. 0.60 stimulated) and prominent CD38-RAB7 colocalization (Manders’ coefficient 0.65) following clone 90 stimulation, confirming clone 90 ligation results in CD38 targeting to the endolysosomal system (–D). Notably, lrrk2 KO cells showed no deficits in CD38 targeting to RAB7 or LAMP1 compared to WT cells (–D), demonstrating LRRK2 does not regulate CD38 trafficking through the endolysosomal system. Together, these data suggest that CD38 is targeted to the endolysosomal system after clone 90 ligation independently of LRRK2, and calcium mobilization defects observed in lrrk2 KO cells are not due to deficits in CD38 internalization or trafficking through the endolysosomal system.
Figure 3. Clone 90 ligation targets CD38 to the endolysosomal system independently of LRRK2. (A) Confocal imaging analysis in WT and lrrk2 KO BMDMs to directly visualize colocalization between CD38 (tagged with clone 90-Alexa Fluor 647, red) in the absence of signaling (4°C) and after initiation of signaling for 30 min (37°C) with co-staining of LAMP1 (green). Colocalization channel is shown in gray pseudocolor. (B) Manders’ coefficient illustrating percent of CD38 colocalizing with LAMP1 (n ≥ 10). (C) Confocal imaging analysis in WT and lrrk2 KO BMDMs to directly visualize colocalization between CD38-Alexa Fluor 647 (red) 30 min after initiation of signaling with co-staining of RAB7 after cell fixation (green). (D) Manders’ coefficient illustrating percent of CD38 colocalizing with RAB7 (n ≥ 10). (# – not significant; *p < 0.05; **p < 0.002, ***p < 0.0001, Student’s t-test or one-way ANOVA with post hoc Tukey’s HSD).
CD38 and LRRK2 form a membrane-associated complex that is internalized upon CD38 ligation
As our previous experiments functionally linked CD38 and LRRK2, we next determined whether these proteins interact. In B-lymphocytes, endogenous LRRK2 co-immunoprecipitated with CD38 basally (without stimulation) and following 15-, 30-, or 60- min stimulation with clone 90 upon pulldown of active complexes ( and S3B). No interaction was appreciated in lrrk2 KO B-lymphocytes, validating the specificity of the detected interaction (Fig. S3C). LRRK2 contains an N-terminal leucine-rich repeat (LRR) domain, a ROC GTPase domain, a COR linker domain, a receptor-interacting protein family kinase domain, and a C-terminal WD40 domain [Citation14]. To elucidate the region(s) responsible for the CD38-LRRK2 interaction, we used several full-length and truncated LRRK2 constructs (). We expressed FLAG-CD38 and GFP-LRRK2 WT in HEK293T cells, observing an interaction with a high degree of specificity upon CD38 immunoprecipitation (Fig. S3D). We next expressed FLAG-CD38 and constructs encoding MYC-tagged full-length LRRK2, LRRK2 LRR domain, LRRK2 ROC-COR-Kinase domains, and LRRK2 WD40 domain in HEK293T cells. After immunoprecipitation of FLAG-CD38, only full-length LRRK2 and the LRRK2 ROC-COR-Kinase mutant were detectable, indicating the CD38-LRRK2 interaction requires either the LRRK2 ROC, COR, or Kinase domain (). We mapped this interaction to the ROC-COR domain of LRRK2, but were unable to further characterize the interaction due to instability of the ROC and COR domains when expressed individually ().
Figure 4. CD38 and LRRK2 interact after CD38 activation. (A) Co-immunoprecipitation of endogenous CD38 and LRRK2 in purified wild type B-lymphocytes following pulldown of anti-CD38 (clone 90, 10 µg/ml)-CD38 complexes using protein G affinity isolation after stimulation for the indicated time. (B) Schematic of LRRK2 constructs used in mapping the CD38-LRRK2 interaction (LRR: Leucine-rich repeat, ROC: Ras of complex, COR: C-terminal of ROC). (C and D) Domain mapping of the interaction between CD38 and LRRK2 using the indicated constructs. (E) Fluorescence resonance electron transfer fluorescence lifetime imaging (FRET-FLIM) of HEK293T cells transfected with MYC-LRRK2 with or without HA-CD38 imaged unstimulated or after anti-CD38 (clone 90, 10 µg/ml) stimulation for 30 min. Top panel shows fluorescence intensity of MYC-LRRK2-594, while bottom panels depict fluorescence lifetime with MYC-LRRK2-594 functioning as the donor and clone 90-Alexa Fluor 647 as the acceptor. White arrows indicate areas of CD38-LRRK2 interaction. Scale bar: 10 μm, 3.75 μm (zoom). (F) Quantification of the average fluorescence lifetime of MYC-LRRK2-594 (n = 15). (G) Calculated FRET efficiency in the unstimulated or clone-90 stimulated state. (H) Immunoblotting of the indicated proteins after stimulation with anti-CD38 (clone 90, 10 µg/ml) for the indicated time. ACTB/β-Actin is shown as a loading control. (# – not significant, *p < 0.05; **p < 0.002, ***p < 0.0001, Student’s t-test or one-way ANOVA with post hoc Tukey’s HSD).
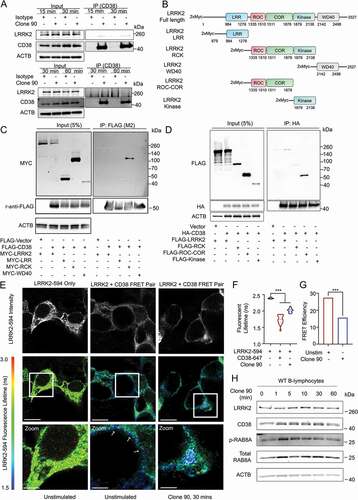
To spatially resolve the CD38-LRRK2 interaction, we expressed HA-CD38 and MYC-LRRK2 in HEK293T cells and monitored their interaction using fluorescence resonance energy transfer by fluorescence lifetime imaging (FRET-FLIM). As previously shown in , when expressed alone, HA-CD38 exists both on the plasma membrane and in intracellular structures, while LRRK2 exists both on the cell membrane and in the cytoplasm (). In the unstimulated state, the CD38-LRRK2 interaction observed by fluorescent lifetime shortening is restricted to the plasma membrane. Upon clone 90 ligation, the CD38-LRRK2 interaction is observed intracellularly (white arrows), suggesting the CD38-LRRK2 complex is internalized following CD38 activation (). We note that fluorescent lifetime increased and FRET efficiency decreased following clone 90 stimulation (, which may reflect dynamic changes in the CD38-LRRK2 complex affecting the spatial proximity of CD38 and LRRK2.
Finally, we assessed LRRK2 kinase activity after clone 90 ligation by assaying phosphorylation of the LRRK2 substrate RAB8 [Citation39]. RAB8 phosphorylation increased significantly at 1 and 5 min after clone 90 ligation, suggesting an increase in LRRK2 kinase activity after CD38 activation ( and S3E). We next investigated whether CD38 is a direct substrate of the LRRK2 kinase. After co-expression of FLAG-CD38 and either a control vector, MYC-LRRK2 WT, or MYC-LRRK2G2019S, we observed no change in either threonine or serine phosphorylation of immunoprecipitated CD38 (Fig. S3F and S3G). Notably, the MYC-LRRK2 WT protein and MYC-LRRK2G2019S mutant co-immunoprecipitated to a similar extent upon FLAG-CD38 pull down (Fig. S3F and S3G), suggesting that the enhanced calcium mobilization observed in LRRK2G2019S KI cells was not due to more robust interaction of the LRRK2G2019S mutant with CD38 than WT LRRK2. Together, our results show that CD38 and LRRK2 exist constitutively in complex on the plasma membrane and that CD38 ligation with clone 90 both enhances LRRK2 kinase activity and promotes internalization of this complex.
LRRK2-deficient BMDMs have TFEB activation defects and a deficient M1 glycolytic switch
Having established a critical role for LRRK2 in TFEB activation downstream of CD38, we further characterized the LRRK2-TFEB relationship. Consistent with existing literature, we observed phosphorylation of LRRK2 at Ser935 and upregulation of TFEB after BMDM stimulation with LPS (Fig. S4A) [Citation40,Citation41]. lrrk2 KO BMDMs did not upregulate TFEB in response to LPS (Fig. S4B), confirming lrrk2 KO cells have TFEB activation defects. We functionally validated the link between LRRK2 and TFEB by monitoring BMDM metabolic flux following LPS stimulation. LPS stimulation of BMDMs promotes a switch to glycolytic metabolism and an M1 (proinflammatory) macrophage phenotype, and TFEB is important in enabling this glycolytic switch [Citation42–44]. We thus investigated whether the observed TFEB activation defects in lrrk2 KO macrophages following LPS stimulation would manifest as a glycolytic switch defect during M1 polarization. The utilization of glycolysis can be characterized by the extracellular acidification rate (ECAR) and oxygen consumption rate after stimulation [Citation45]. While WT BMDMs effectively switched to glycolysis following LPS stimulation as shown by increased ECAR, lrrk2 KO BMDMs showed defects in glycolytic switching under the same conditions (Fig. S4C). These data implicate LRRK2 as an important regulator of TFEB in BMDMs.
LRRK2G2019S promotes TFEB nuclear translocation and stabilization independent of CD38
As previous studies have reported LRRK2 mutants regulate NAADP-dependent calcium signaling in cell types that do not express CD38 [Citation31,Citation46], we explored the relationship between LRRK2 and TFEB in cell lines lacking CD38. Expression of the most common pathogenic LRRK2 mutant (LRRK2G2019S) in HeLa cells in the presence of TFEB-mCherry induced robust TFEB nuclear localization, while control cells showed little nuclear TFEB (. Detection of endogenous TFEB after nuclear fractionation of HEK293T cells expressing LRRK2 and its mutants consistently showed increased nuclear and cytosolic TFEB levels in LRRK2G2019S-expressing cells (, validating that LRRK2G2019S drives TFEB activation. We note that the His-LRRK2G2019S construct expressed at lower levels than our LRRK2 WT construct (), and use this construct several times in our study to more closely mimic endogenous levels of LRRK2G2019S. Finally, to determine if LRRK2G2019S induction of TFEB nuclear translocation requires LRRK2 kinase activity, we assayed TFEB-mCherry nuclear localization in LRRK2G2019S-expressing cells in the presence or absence of the LRRK2 kinase inhibitor GSK2578215A. Inhibition of LRRK2G2019S kinase activity surprisingly did not reduce TFEB nuclear translocation (Fig. S4D), suggesting LRRK2G2019S drives TFEB nuclear localization in a kinase-independent manner in the absence of CD38.
Figure 5. Overexpression of LRRK2 activates TFEB by promoting its stabilization and nuclear translocation. (A) Confocal imaging of HeLa cells expressing TFEB-mCherry and either GFP vector or GFP-LRRK2G2019S. Treatment with the GSK3B inhibitor CHIR99201 is shown as a positive control. Nuclei are stained with DAPI (blue). Scale bar: 20 µm. (B) Quantification of % of cells exhibiting TFEB nuclear translocation after co-transfection of TFEB-mCherry, GFP-LRRK2 WT and GFP-LRRK2G2019S (GS) in (A) (n = 4, ≥ 50 cells/repeat). (C) Immunoblot of endogenous TFEB after nuclear fractionation of HEK293T cells expressing LRRK2 WT and LRRK2G2019S (GS). (D) Quantification of (C) in HEK293T cells (n = 3). (E) Immunoblotting illustrating phospho-shift (indicated by arrow) of overexpressed TFEB-FLAG or TFEBΔCT-FLAG (TFEB*, aa 1–461) in HEK293T cells co-transfected with a control vector, His-LRRK2G2019S (GS), or GFP-LRRK2G2019S (GS^). (F) Quantification of (E). Bands were normalized to the control group for each TFEB construct (n ≥ 3). Western bands are quantified, normalized to the loading control, and presented relative to the control lane. (# – not significant, *p < 0.05; **p < 0.002, ***p < 0.0001, one-way ANOVA with post hoc Tukey’s HSD).
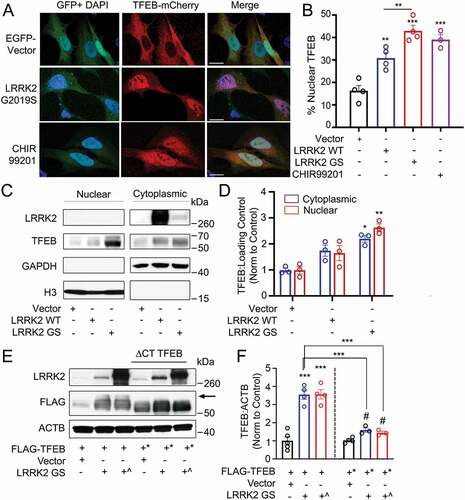
Noting that overexpression of LRRK2G2019S increased TFEB protein levels in addition to promoting its nuclear translocation, we investigated the mechanisms by which LRRK2 increases TFEB levels in our overexpression model. TFEB is stabilized via phosphorylation of its serine-rich C-terminus [Citation45], thus we evaluated whether LRRK2 acts via this mechanism. We expressed full-length TFEB-FLAG or a truncated TFEBΔCT-FLAG mutant (aa 1–461, deletion of the phosphorylated serine-rich region) with either a control vector, His-LRRK2G2019S, or GFP-LRRK2G2019S. We observed an upward shift in the TFEB-FLAG from cells expressing His-LRRK2G2019S and GFP-LRRK2G2019S compared to the control. Suggesting this shift is due to C-terminus phosphorylation, the upshift was not present under the same conditions upon blotting TFEBΔCT-FLAG (). Incubation of these lysates with λ phosphatase abolished the upward shift for all bands, confirming that the mobility shift of TFEB-FLAG was due to phosphorylation (Fig. S4E). Functionally, His-LRRK2G2019S and GFP-LRRK2G2019S expression increased TFEB-FLAG levels 3-fold compared to the control, with no significant increase observed in TFEBΔCT-FLAG after LRRK2G2019S expression (. These results indicate that overexpressed LRRK2G2019S indirectly promotes C-terminus phosphorylation of TFEB, thereby increasing its stability.
LRRK2G2019S induces TFEB target gene expression dependent on AMPK
To verify that LRRK2-dependent TFEB nuclear translocation promotes TFEB target gene induction, we evaluated protein and mRNA levels of several TFEB target genes. LRRK2G2019S-expressing HEK293T cells showed increased LAMP1, SQSTM1/p62 (sequestome 1), BECN1/Beclin-1, CTSD/Cathepsin D, and MAP1LC3B/LC3B (. Consistently, several assayed genes were increased at the mRNA level, including CTSF, LAMP1, UVRAG, and BECN1 (). Expression of LRRK2 WT in HEK293T cells did not increase LAMP1, SQSTM1, BECN1, CTSD, or MAP1LC3B at the protein level (Fig. S5A and S5B) or increase CTSF, LAMP1, UVRAG, or BECN1 at the mRNA level (Fig. S5C), confirming that expression of the pathogenic LRRK2G2019S mutant but not LRRK2 WT induces functional activation of TFEB in the absence of CD38. The initial report linking LRRK2 to NAADP-dependent autophagosome formation implicated AMP-activated protein kinase (AMPK) [Citation31]. We thus tested whether there was a role for AMPK in LRRK2G2019S induced upregulation of TFEB target genes. Consistent with published data [Citation31], expression of LRRK2G2019S promoted activation of AMPK (Fig. S5D). Inhibition of AMPK with the specific inhibitor Dorsomorphin did not affect LRRK2G2019S-mediated TFEB nuclear translocation (Fig. S5E). However, both dorsomorphin and PRKAA1/AMPKα1-PRKAA2/AMPKα2 KD inhibited the LRRK2G2019S-dependent transcriptional upregulation of TFEB target genes(. Importantly, treatment with dorsomorphin alone or KD of PRKAA1 and PRKAA2 had no effect on the expression of TFEB target genes (Fig. S5F). AMPK KD was validated at the protein level by western blotting, confirming our findings (Fig. S5G). A recent report showed that AMPK promotes autophagy by epigenetically licensing TFEB target genes via CARM1 (coactivator-associated arginine methyltransferase 1) [Citation47]. Our data indicate that LRRK2 activates AMPK to license transcription of TFEB target genes. Though the exact mechanism is undetermined, AMPK may function through CARM1 to epigenetically promote TFEB target gene transcription.
Figure 6. AMPK is required for the LRRK2-induced transcription of TFEB target genes. (A) Immunoblotting of the indicated TFEB target proteins in HEK293T cells after transfection of a control vector or His-LRRK2G2019S (GS). (B) Quantification of immunoblots from (A) (n ≥ 4). (C) q-RT-PCR in HEK293T cells transfected with a control vector or His-LRRK2G2019S (GS) (n ≥ 3). (D) q-RT-PCR of TFEB target genes in HEK293T cells transfected with His-LRRK2G2019S with or without dorsomorphin (5 μM, 1 h) pretreatment (n ≥ 3). (E) q-RT-PCR of TFEB target genes in HEK293T cells transfected with His-LRRK2G2019S and either control siRNA or siRNA targeting PRKAA1 and PRKAA2 (n = 4). Fold mRNA change is normalized to GAPDH and shown relative to the control. (*p < 0.05; **p < 0.002, ***p < 0.0001, Student’s t-test or one-way ANOVA with post hoc Tukey’s HSD).
LRRK2 promotes TFEB activation via MTOR-independent NAADP-TPCN2-dependent signaling
Finally, we investigated the mechanism by which LRRK2G2019S induces TFEB nuclear translocation in the absence of CD38. Cells expressing LRRK2 WT or LRRK2G2019S showed no changes in MTOR signaling or in the subcellular localization of the MTOR-controlled transcriptional repressor of autophagy ZKSCAN3 (Fig. S6A-C), indicating that LRRK2 regulation of TFEB is MTOR independent. We observed no changes in MAPK/ERK (extracellular-signaling regulated kinase) or GSK3B/GSK3β (glycogen synthase kinase-3 beta) signaling following expression of LRRK2 (Fig. S6D and S6E), signifying LRRK2-mediated TFEB translocation is independent of these pathways. As CD38 activation induces TFEB nuclear translocation via calcium signaling, we tested whether LRRK2G2019S utilizes a similar mechanism. In HeLa cells, LRRK2G2019S-induced TFEB nuclear translocation was reversed by calcium chelation with BAPTA-AM, inhibition of PPP3/calcineurin by FK506, and KD of the PPP3/calcineurin subunit PPP3CB (protein phosphatase 3 catalytic subunit beta) (. Consistent with previous results, pharmacological inhibition of NAADP or KD of the putative NAADP-gated lysosomal calcium channel TPCN2 inhibited LRRK2G2019S-induced TFEB nuclear translocation (. Gene KD after targeted RNAi was verified at the protein level in all cases (Fig. S6F and S6G). We also verified the involvement of PPP3/calcineurin and NAADP in LRRK2G2019S-mediated TFEB nuclear translocation by western blotting after subcellular fractionation (, and showed that expression of TPCN2 drives TFEB nuclear translocation in an NAADP-dependent manner by imaging and nuclear fractionation (. Taken together, these data show that expression of LRRK2G2019S induces TFEB activation through an NAADP-TPCN2-lysosomal calcium-dependent pathway.
Figure 7. LRRK2G2019S-mediated TFEB nuclear translocation requires Ca2+, NAADP, and TPCN2 (A) Confocal imaging in HeLa cells expressing TFEB-mCherry and a control vector (MT) or His-LRRK2G2019S with or without BAPTA-AM (fast calcium chelator, 10 μM, 1 h), EGTA-AM (slow calcium chelator, 10 μM, 1 h), FK506 (calcineurin inhibitor, 5 nM, 1 h), control siRNA, PPP3CB siRNA, or MCOLN1 siRNA. Scale bar: 10 μm. (B) Quantification TFEB nuclear translocation from (A) (n = 3, ≥ 50 cells/repeat). (C) Confocal imaging in HeLa cells expressing TFEB-mCherry and a control vector (MT), or TFEB-mCherry and His-LRRK2G2019S with or without Ned-19 (NAADP inhibitor, 100 μM, 1 h), PERK inhibitor (PERK-I, 10 μM, 1 h), control siRNA, or TPCN2 siRNA. Scale bar: 10 μm. (D) Quantification of TFEB nuclear translocation from (C) (n = 3, ≥ 50 cells/repeat). (E) Immunoblot of endogenous TFEB from nuclear fractions of HEK293T cells transfected with a control vector or His-LRRK2G2019S (GS) and either control siRNA or PPP3CB siRNA (PPP3CB KD). (F) Immunoblot of endogenous TFEB from nuclear fractions in HEK293T cells transfected with a control vector or His-LRRK2G2019S (GS) and treated with Ned-19 (100 μm, 2 h). (G) Confocal imaging in HeLa cells transfected with TFEB-mCherry and TPC2-EGFP. DAPI and TFEB-mCherry colocalization channel is shown on the right. Scale bar: 10 μm. (H) Quantification of % cells exhibiting TFEB nuclear translocation from (G) (n = 3, ≥ 50 cells/repeat). (I) Immunoblotting of endogenous TFEB following nuclear fractionation of HEK293T cells expressing TPCN2-EGFP. For western data, histone H3 and GAPDH are shown as fractionation and loading controls. Western bands are quantified, normalized to the loading control, and presented relative to control lane. (*p < 0.05; **p < 0.002, ***p < 0.0001, one-way ANOVA with post hoc Tukey’s HSD).
Discussion
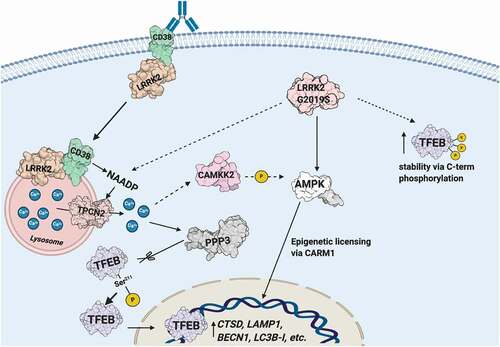
In this study, we characterize a novel signaling pathway in B-lymphocytes and macrophages (). We show CD38 exists in a complex with LRRK2 on the plasma membrane, and that ligation of CD38 with the anti-CD38 mAb clone 90 results in complex internalization and targeting to the endolysosomal system. This generates an NAADP-dependent calcium signal, likely due to NAADP production by CD38 in acidic compartments, resulting in mobilization of lysosomal calcium and calcium-induced calcium release. CD38 ligation increases LRRK2 kinase activity, which is required for generation of the calcium signal. TFEB, the master transcriptional regulator of the autophagy and lysosome machinery, is activated downstream of CD38 by calcium signaling due to dephosphorylation at Ser211 by the phosphatase PPP3/calcineurin. lrrk2 KO cells accordingly show defects in TFEB activation following stimulation with CD38 or LPS. Notably, the pathogenic LRRK2G2019S mutant promotes constitutive TFEB activation in a CD38-independent manner due to TFEB stabilization via C-terminal phosphorylation and enhanced TFEB nuclear translocation via lysosomal calcium signaling (). Our work has physiological implications in B cells and macrophages, and clinical implications as CD38, LRRK2, and TFEB are all linked to human disease.
Figure 8. Schematic illustrating the CD38-LRRK2-TFEB signaling pathway in B-lymphocytes and macrophages. The CD38-LRRK2 complex exists on the plasma membrane and activation of CD38 results in the internalization of the CD38-LRRK2 complex and its targeting to the endolysosomal system. CD38 promotes generation of an NAADP-dependent lysosomal calcium signal, which is dependent on LRRK2 kinase activity. This results in the activation of PPP3/calcineurin, which dephosphorylates TFEB at Ser211 and allows its nuclear translocation. The pathogenic kinase overactive LRRK2G2019S mutant aberrantly activates TFEB via NAADP-TPCN2-dependent calcium signaling and stabilizes TFEB by promoting its C-terminal phosphorylation. Solid arrows indicate known relationships, while dashed arrows indicated hypothesized connections.
Currently, the molecular signaling mechanisms downstream of CD38 remain unclear. In B-lymphocytes, CD38 ligation with the mAbs CS/2 and NIM-R5 signal through the tyrosine kinases Fyn and Lyn to induce BTK (Bruton agammaglobulinemia tyrosine kinase) phosphorylation and downstream activation of PLD (phospholipase D). Functionally, these antibodies induce apoptosis of T1 B-lymphocytes, proliferation and maturation of T2 B-lymphocytes, and class switching to IgG1 during co-stimulation with IL5 (interleukin-5) [Citation48–50]. In our study, we find that ligation of CD38 with NIM-R5 does not generate a robust calcium response, suggesting that clone 90 induced CD38 signaling is separate and distinct from signaling associated with other CD38 agonistic antibodies. Consistent with this notion, CD38 enzymatic activity is dispensable for signaling induced by NIM-R5 or CS/2 [Citation48–50], but is required for signaling downstream of clone 90 as CD38 enzymatic activity is needed for the production of NAADP [Citation5].
While CD38-independent NAADP synthesis by unknown enzymes has been reported [Citation51,Citation52], CD38 is the only well-characterized protein known to produce NAADP across multiple cell types [Citation6,Citation53,Citation54]. CD38-mediated production of NAADP occurs in endolysosomal compartments due to the requirement of an acidic pH to overcome electrostatic repulsion between acidic residues of CD38 and its substrate nicotinic acid [Citation7]. A recent study from Fang et al. showed ligation of type II CD38 with nanobodies results in clathrin-dependent internalization, targeting to the endolysosomal system, and NAADP production secondary to localization of the CD38 enzymatic domain to the acidic vesicle lumen [Citation5]. The anti-CD38 clone 90 antibody used in this study recognizes type II CD38 at its C-terminus [Citation55], consistent with the spatial restriction required for CD38 production of NAADP.
We extend upon the findings by Fang et al. by implicating LRRK2 in CD38-NAADP signaling [Citation5]. We show LRRK2 exists constitutively in complex with CD38 on the plasma membrane and that this complex is internalized and targeted to the endolysosomal system following clone 90 ligation. As our data suggest that LRRK2 functions downstream of CD38 but upstream of NAADP, we reasoned LRRK2 may regulate CD38 internalization, CD38 trafficking through the endolysosomal system, or CD38 production of NAADP. Given the known role for LRRK2 in the proper trafficking of receptors through the endolysosomal system [Citation56,Citation57], we were surprised to find LRRK2 does not regulate CD38 internalization or endolysosomal targeting. Though the exact mechanism through which LRRK2 regulates CD38 remains unknown, our data suggests that LRRK2 potentiates CD38-mediated NAADP production. We note the rapid temporal dynamics of calcium signal generation after clone 90 ligation, with a prolonged calcium response beginning 90 s after stimulation. It is unclear how much CD38 internalization is required for generating the NAADP-dependent calcium signal, but observe time-dependent CD38 internalization as quickly as one minute after CD38 ligation.
Our data suggest LRRK2G2019S potentiates TFEB activation in both CD38-dependent and CD38-independent manners. In the presence of CD38, LRRK2G2019S enhances the calcium response downstream of clone 90 due to enhanced kinase activity. In the absence of CD38, LRRK2G2019S promotes TFEB activation in a kinase-independent manner by increasing TFEB levels and promoting its nuclear translocation via NAADP signaling. We note that the utilization of an overexpression system is an important limitation of our findings regarding the effects of LRRK2G2019S on TFEB protein levels. This is further confounded by data from lrrk2 KO cells, which fail to show a change in TFEB protein levels at baseline. It remains unclear whether this phenomenon in lrrk2 KO cells is due to compensatory changes, or if the finding is simply not recapitulated in the knockout. Nonetheless, our finding that LRRK2G2019S activates TFEB both via CD38-dependent and CD38-independent mechanisms are consistent with the literature, as a previous study showed LRRK2 promotes autophagosome formation in an NAADP-dependent manner [Citation31]. Moreover, LRRK2G2019S patient fibroblasts (which express little to no CD38) exhibit increased lysosomal size and exaggerated calcium responses to NAADP-AM [Citation46]. In understanding the pathophysiology of PD, the role of LRRK2 in the regulation of autophagy remains unclear. The preponderance of discordant reports suggests LRRK2 modulates multiple steps in the autophagy pathway [Citation29]. This report is the first linking LRRK2 to TFEB, elucidating an additional mechanism by which LRRK2 may regulate both autophagy and the lysosomal pathway. Further research is needed to determine the exact role of LRRK2’s regulation of TFEB in autophagy.
Our study also has implications in innate immunity. In macrophages, CD38 expression is robustly induced upon exposure to immune stimuli [Citation58]. It has been shown to promote inflammation downstream of LPS and is involved in calcium release after phagosome formation to enable phagocytosis [Citation59,Citation60]. Here, we implicate CD38 in the activation of TFEB, which transcriptionally regulates many chemokines and cytokines promoting macrophage activation [Citation24,Citation41]. Thus, CD38 may promote inflammation after pathogen stimulation via TFEB. CD38-deficient cells poorly control intracellular infections, including Listeria monocytogenes and Mycobacterium avium [Citation61,Citation62]. LRRK2-deficient cells show similar defects in controlling intracellular infection, including Listeria monocytogenes and Salmonella typhimurium [Citation63]. TFEB-dependent defects in autophagy and inflammation in CD38- and LRRK2-deficient cells may contribute to these observed phenotypes. Finally, LRRK2 kinase inhibitors have gained Phase I FDA clearance in a small patient cohort. Given that LRRK2 kinase inhibition decreases signaling downstream of CD38, it will be important to ensure that patients on LRRK2 kinase inhibitors do not exhibit defects in innate immunity and enhanced susceptibility to infection. In summary, we provide strong evidence for a novel CD38-LRRK2-TFEB signaling pathway in immune cells. This pathway may have significant effects on health and disease.
Materials and methods
Mice
lrrk2 knockout (KO) (B6.129X1(FVB-LRRK2tm1.1Cai/J, Jax Stock No 12453) and LRRK2G2019S knock-in (KI) (Lrrk2tm1.1Hlme, Jax Stock No 030961) mice backcrossed onto a C57BL/6 J background were kindly provided by Dr. Mark Cookson (National Institute of Aging, National Institutes of Health) [Citation38,Citation64]. C57BL/6 (Jax Stock No 000664) were purchased from Jackson Laboratory. lrrk2 KO mice were bred as heterozygotes and littermate controls used whenever possible. Otherwise, age and sex-matched C57BL/6 J served as controls after 2 weeks of co-housing. All mice used in this study were 6–14 weeks of age. Mice were housed in pathogen-free conditions and allowed free access to food and water. All animal experiments and protocols used in this study were approved and carried out in accordance with the guidelines of the NIAID Animal Care and Use Committee at the National Institutes of Health.
Cell isolation and culture
Primary B cells were isolated from total splenocytes by negative depletion using biotinylated antibodies to CD4 (GK 1.5; BD Biosciences, 553730), CD8A/CD8 (53–6.7; BD Biosciences, 550281), Gr-1 (RB6-8C5; BD Biosciences, 561084), and ITGAX/CD11c (HL3; BD Biosciences, 550283) with Dynabeads M-280 Streptavidin (Thermo Fisher Scientific, 11206D) following the manufacturer’s protocol. PTPRC/B220+ B cell purity was routinely greater than 95%. Primary B cells were maintained in complete B cell media consisting of Gibco RPMI 1640 (Thermo Fisher Scientific, 21875034) supplemented with 10% Gibco fetal calf serum (FCS; Thermo Fisher Scientific, A4766801) and antibiotics (100 IU/mL penicillin and 100 ug/mL streptomycin). Primary BMDMs were prepared as previously described [Citation65]. In short, bone marrow was flushed from the femurs and tibia of 6- to 14-week-old mice. Bone marrow was resuspended in sterile ACK lysis buffer (Lonza Bioscience, BP10-548EB) to remove red blood cells, and the remaining cells plated in complete RPMI (10% FCS + antibiotics) supplemented with L929 cell-conditioned medium (30% vol:vol). On day 4, loosely adherent cells were removed and fresh medium added; macrophages were used on days 6–8 of culture. HEK293T cells (ATCC, CRL-3216) and HeLa cells (ATCC, CCL-2) were purchased from the American Type Culture Collection (ATCC) and maintained in complete Gibco DMEM (Thermo Fisher Scientific, 10566016; 10% FCS + antibiotics). Nutrient starvation was induced by culture in Hanks’ Balanced Salt Solution (HBSS; Thermo Fisher Scientific, 14175095).
Plasmids, siRNA, and transfection
Human AcGFP-LRRK2 WT and G2019S plasmids [Citation66]; GFP-LRRK2 WT and GFP-LRRK2G2019S, plasmids [Citation67]; MYC-LRRK2 WT, MYC-LRRK2G2019S, MYC-LRRK2 ROC-COR-Kinase (RCK), MYC-LRRK2 ROC-COR, MYC-LRRK2 Kinase, MYC-LRRK2 WD40, and MYC-LRRK2 LRR plasmids [Citation66]; the Emerald-LRRK2 WT, and His-LRRK2G2019S plasmids were kind gifts from Dr. Mark Cookson (National Institute of Aging, National Institutes of Health). The TPCN2-EGFP (80153, deposited by Dr. Santiago Di Pietro) and TFEB-GFP (38199, deposited by Dr. Shawn Ferguson) plasmids were purchased from Addgene, and the TFEB-FLAG and TFEB-mCherry plasmids were previously described [Citation68]. The TFEBΔCT-FLAG (aa 1–461) plasmid was provided by Dr. Gerard Karsenty (Columbia University) [Citation69], and the FLAG-ZKSCAN3 plasmid provided by Dr. Santosh Chauhan (Institute of Life Sciences) [Citation70]. The control FLAG and FLAG-CD38 (human) vectors were provided by Dr. Eduardo Chini (Mayo Clinic) [Citation71], and HA-CD38 (mouse) purchased (Sino Biological, MG50191-CY). Plasmids were transfected using Roche XTremeGENE HP DNA Transfection Reagent (Sigma-Aldrich, 6366236001) at a 3:1 (ul HP: ug DNA) ratio. siRNA pools targeting human PPP3CB (sc-39196), MCOLN1 (sc-44519), TPCN2 (sc-96434), PRKAA1/AMPKα1-PRKAA2/AMPKα2 (sc-45312), and control siRNA with a scrambled sequence (sc-37007) were purchased from Santa Cruz Biotechnology. siRNA was prepared at 40 nM with 2 µl transfection reagent and transfected overnight before assay. siRNA KD were validated at the protein level.
Reagents and antibodies
The following antibodies were used for cell stimulation: purified anti-mouse CD38 (Clone 90; BioLegend, 102702), purified rat IgG2a, κ isotype control (Clone RTK2758; BioLegend, 400565). In certain experiments, the following reagents/inhibitors were used at the indicated concentration in cell culture: LPS (E. Coli Serotype R515; Enzo Life Sciences, ALX-581-007-L001), NAADP-AM (3 μM; AAT Bioquest, 21000), GSK2578215A (LRRK2 inhibitor, 1 µM; Tocris Bioscience, 4629), GPN (200 µM; Santa Cruz Biotechnology, sc-252858), EDTA (2 mM; Sigma-Aldrich, E6758), thapsigargin (500 nM; Tocris Bioscience, 1138), 8-Br-cADPR (100 µM; BIOLOG Life Science Institute, B065), 8-Br-ADPR (100 µM; BIOLOG Life Science Institute, B051), Ned-19 (100 µM; Cayman Chemical, 17527), cyclosporine (10 µM; R&D Systems, 1101/100), FK506 (5 nM; Eton Bioscience Inc, 1100060052), CHIR 99021 (GSK3B inhibitor, 5 µM; Tocris Bioscience, 4423), BAPTA-AM (10 µM; R&D Systems, 2787), EGTA-AM (10 µM; AnaSpec Inc, AS-84100), GSK2606414 (EIF2AK3/PERK inhibitor, 10 µM; Tocris Bioscience, 5107), and dorsomorphin (5 µM; Tocris Bioscience, 3093).
Flow cytometry based internalization assay
B-lymphocytes were immunostained with anti-PTPRC/B220 (RA3-6B2; BioLegend, 103205), anti-CR2/CD21 (4E3; Thermo Fisher Scientific, 50–162-73), FCER2A/CD23 (B3B4, BioLegend, 601620), CD24/CD24A (M1/69; BD Biosciences, 562360), and CD38 (clone 90; BioLegend, 102729) for 15 min at 4°C, washed, and incubated in RPMI for 30 min at 37°C, 5% CO2 before stimulation with 10 µg/ml anti-CD38 or isotype control antibody for 1 min to 60 min. Cells were fixed in 4% paraformaldehyde (Thermo Fisher Scientific, 50–980-493) for 20 min at the indicated times. After washing, the cells were resuspended in 250 μL 1% BSA (Sigma-Aldrich, 10735086001) in PBS (Thermo Fisher Scientific, 10010049) and filtered prior to acquisition on a FACSCelesta SORP (BD Biosciences, Franklin Lakes NJ). Data processing was performed on FlowJo 10.7 (BD Biosciences, Franklin Lakes NJ), and values presented as % cell surface CD38 compared to T0.
Cell lysis and immunoprecipitation
For standard immunoblotting, cells were lysed in RIPA Buffer (Thermo Fisher Scientific, 89900) with PhosSTOPTM phosphatase inhibitor tablet (Sigma-Aldrich, 4906845001) and cOmpleteTM protease inhibitor tablet (Sigma-Aldrich, 11697498001) at 4°C for 30 min. Lysates were cleared at 21,000 x g for 10 min and the supernatant collected and diluted in 4x NuPage LDS Sample Buffer (Thermo Fisher Scientific, NP0007). To dephosphorylate proteins following lysis, lysates were incubated with lambda protein phosphatase (NEB, P0753S) for 30 min following the manufacturer’s protocol; lysates were then diluted in 4x NuPage LDS Sample Buffer. To separate nuclear and cytoplasmic fractions, cells were first lysed at 4°C for 30 min in Buffer A containing 20 mM HEPES pH 7.4 (Thermo Fisher Scientific, 11460496), 50 mM β-glycerophosphate (Sigma-Aldrich, G9422), 0.5% (v:v) NP-40 (Sigma-Aldrich, 492016), 2 mM EGTA (Sigma-Aldrich, 324626), and 10% (v:v) glycerol (Sigma-Aldrich, G5516) with cOmpleteTM protease inhibitor and PhosSTOPTM tablets. The resultant lysate was spun down at 11,000 x g for 10 min, and the supernatant collected as the cytoplasmic fraction. The nuclear pellet was washed 6x in Buffer A and then lysed with Buffer A + 0.75% (v:v) SDS (Sigma-Aldrich, L3771) for 30 min. The resultant lysate was considered the nuclear fraction. Fractions were diluted in 4x NuPage LDS Sample Buffer for further analysis.
For immunoprecipitation experiments, cells were lysed with Buffer C, which is Buffer A plus 0.5% (w:v) CHAPS (Thermo Fisher Scientific, 28300). To immunoprecipitate FLAG-CD38, the lysate was incubated overnight at 4°C with either mouse anti-FLAG M2 Affinity Agarose Gel (Thermo, A2220) or rat anti-FLAG (L5; BioLegend, 637303) followed by protein G affinity isolation (Thermo Fisher Scientific, 10004D). The immunoprecipitates were collected and washed eight times with lysis buffer. To immunoprecipitate HA-CD38, lysates were incubated overnight at 4°C with anti-HA beads (Thermo Fisher Scientific, 88836) and washed twice with 5 M NaCl and four times with lysis buffer. For immunoprecipitation of active endogenous CD38 complexes, purified murine B cells were incubated with either clone 90 (10 μg/ml) or the isotype control antibody for the specified time. Cells were lysed in Buffer C and subject to protein G affinity isolation for 2.5 h. Samples were washed four times. For all immunoprecipitations, proteins were released by adding DTT (Thermo Fisher Scientific, R0861), 2-mercaptoethanol (Sigma-Aldrich, M6250), 4x NuPage LDS Sample Buffer, and heating at 100°C for 10 min prior to immunoblotting.
Immunoblotting
Samples were heated at 100°C for 10 min, separated by SDS-PAGE, and transferred to a nitrocellulose membrane (Thermo Fisher Scientific, IB301002) using the iBLOT Gel Transfer System (Invitrogen, Waltham MA) on setting P2 for 7 min. The membrane was blocked with 5% nonfat milk (Thermo Fisher Scientific, NC9121673) (or 5% BSA) w:v in TBST buffer (25 mM Tris-HCl, pH 7.5, 150 mM NaCl, 0.1% Tween 20) for 1 h, and then incubated at 4°C overnight with the primary antibody in 3% nonfat milk (or 5% BSA) in TBST buffer (w:v) while shaking. The following primary antibodies were used for western blotting: phospho-LRRK2 (Ser935, UDD2 10 [Citation12]; Abcam, ab133450; 1:1000), total LRRK2 (MJFF2; Abcam, ab133474; 1:1000), human TFEB (Bethyl Laboratories, A303-672A; 1:2000), human TFEB (Cell Signaling Technology, 4202; 1:1000), mouse TFEB (Bethyl Laboratories, A303-673A; 1:1000), phospho-serine (Q5; Qiagen, 37430; 1:800), phospho-serine (Q7; Qiagen, 37420; 1:800), LAMP1 (H4A3; Santa Cruz Biotechnology, sc-20011; 1:1000), CTSD (C-20; Santa Cruz Biotechnology, sc-377299; 1:1000), SQSTM1/p62 (P-15; Santa Cruz Biotechnology, sc-28359; 1:1000), BECN1 (K-15; Santa Cruz Biotechnology,sc-10087; 1:1000), MAP1LC3B (Cell Signaling Technology, 2775; 1:1000), CD38 (R&D Systems, AF4947; 1:2000), mouse-anti-FLAG (M2; Sigma-Aldrich, F1804; 1:1000), rabbit-anti-FLAG (Rockland, 600–401-383; 1:2000), mouse-anti-MYC (9E10; Santa Cruz Biotechnology, sc-40; 1:500), rabbit-anti-MYC (71D10; Cell Signaling Technology, 2278; 1:1000), GFP (Cell Signaling, 2555; 1:1000), phospho-PRKAA/AMPK (Thr172) (40H9; Cell Signaling Technology, 2535; 1:1000), PRKAA/AMPK (D5A2; Cell Signaling Technology, 5831; 1:2000), TPCN2 (Abcam, ab119915; 1:500), PPP3CB (Thermo Fisher Scientific, 55148-1-AP; 1:1000), MTOR (7 C10; Cell Signaling Technology, 2983; 1:1000), phospho-RPS6KB1/p70S6K (Thr389) (1A5; Cell Signaling Technology, 9206; 1:1000), total RPS6KB1/p70S6K (49D7; Cell Signaling Technology, 2708; 1:1000), phospho-RPS6/S6 ribosomal protein (Ser236/256) (Cell Signaling Technology, 2211S; 1:1000), phospho-GSK3B (Ser9) (Cell Signaling Technology, 9336; 1:1000), total GSK3B (1V001; Santa Cruz Biotechnology, sc-71186; 1:1000), phospho-MAPK/ERK (Thr202/Tyr204) (E10; Cell Signaling Technology, 9106; 1:1000), total MAPK/ERK (137 F5; Cell Signaling Technology, 4695; 1:1000), phospho-RAB8 (Thr72) (MJF-R20; Abcam, ab230260; 1:5000), total RAB8 (EPR14873; Abcam, ab188574; 1:2000), Histone H3 (Cell Signaling Technology, 4499; 1:2000), HRP-conjugated GAPDH (Proteintech Group, HRP-60004; 1:10,000), HRP conjugated ACTB/β-actin (Sigma-Aldrich, A3854; 1:10,000). The appropriate secondary antibody conjugated to HRP (Cell Signaling Technology, 7074 and 7076) was used to detect the protein of interest via enhanced chemiluminescence (ECL, Bio-Rad) and images obtained using the iBright FL1000 (Thermo Fishcer Scientific, Waltham MA) or Amersham Hyperfilm (GE Healthcare, 28–9068-50). Membranes were stripped using Restore™ Plus Western Blot Stripping Buffer (Thermo Fisher Scientific, 46428) following the manufacturer’s protocol, re-blocked, and reblotted. Blots were scanned and imported into Photoshop (Adobe, Mountain View CA) as a tagged image file format. Quantification of band intensity was performed using standard methods on ImageJ (National Institutes of Health, Bethesda MD); bands were normalized to their respective loading control and presented as fold-change of the control. Immunoblots shown are representative of three independent experiments unless otherwise noted.
Immunofluorescence
Cells were seeded in glass-bottom 14-mm microwell dishes (MatTek Life Sciences, P35 GCOL-1.0–14-C) and either transfected overnight or treated. Prior to imaging, cells were fixed with 4% paraformaldehyde for 10 min and permeabilized using either 0.2% Triton X-100 (Thermo Fisher Scientific, AC215680010) or 0.1% Tween 20 (Sigma-Aldrich, P1379) for 10 min. Cells were then blocked in 3% BSA in PBS for 30 min and incubated with the appropriate primary antibody diluted in 1% BSA in PBS at 4°C overnight. The following primary antibodies were used for immunofluorescence: FLAG (M2; Sigma-Aldrich, F1804; 1:500), TFEB (MyBioSource, MBS2538354; 1:100), HA (BioLegend, 901514; 1:300), MYC (71D10; Cell Signaling Technology, 2278; 1:200). After washing 5x with PBS, the appropriate Alexa Flour-conjugated secondary antibodies (Thermo Fisher Scientific, A32723, A32727, A32787, A32731, A32732, and A32733; 1:500) were added for 30 min at room temperature. To stain active CD38 complexes, live cells were either stimulated with clone 90 (10 μg/ml) or clone 90-Alexa Fluor 647 (BioLegend, 102716; 10 μg/ml). After fixation, clone 90 stimulated cells were directly stained with a secondary antibody specific for clone 90, while clone 90-Alexa Fluor 647 stimulated cells were visualized directly. In certain experiments, cells were stimulated with clone 90-Alexa Fluor 647 at 4°C and 37°C to visualize basal and clone 90-stimulated states respectively. Cells were counterstained with DAPI (1 μg/ml; Sigma-Aldrich, D9542) for 5 min following secondary antibody incubation. Imaging was performed using a Leica SP5 or SP8 inverted 5 channel confocal microscope equipped with ultra-sensitive hybrid detectors (Leica Microsystems, Buffalo Grove, IL). The following laser lines were used at minimal laser power (0.2–1%): diode for 405 nm, Argon for 458 and 488 nm, and HeNe lasers for 594 and 633 nm excitation wavelengths. Z stacks of cellular monolayers (Z = 10–15 µm) were collected for further processing. Post-acquisition image processing was performed using Huygens (Scientific Volume Imaging, Hilversum North Holland) and Imaris (Bitplane, Concord MA) software.
FRET-FLIM Sample preparation and analysis
HEK293T cells were seeded onto 12-mm poly-l-lysine coated coverslips (Thermo Fisher Scientific, 08–774-383) and transfected overnight with HA-CD38, MYC-LRRK2, or both constructs. Twenty-four hours post-transfection, samples were either left unstimulated or stimulated with Alexa Fluor 647-conjugated clone 90 (10 μg/ml) for 30 min at 37°C. Samples were then washed with PBS, fixed with BD Cytofix™ (BD Biosciences, 554655) following the manufacturer’s protocol, and blocked with 1% BSA in PBS for 15 min at RT. Cells were stained with anti-HA (BioLegend, 901514;1:300), anti-MYC (71D10; Cell Signaling Technology, 2278; 1:200), or clone 90-Alexa Fluor 647 (BioLegend, 102716; 1:50) in 1% BSA in PBS overnight and with the appropriate secondary antibodies (Thermo Fisher Scientific, A32754 and A32728; 1:500) for 1 h at RT the next day. Coverslips were then mounted onto glass slides, and images acquired using a Leica SP8WLL falcon inverted confocal microscope with a 63× oil immersion objective (Leica Microsystems, Buffalo Grove IL). For fluorescence resonance energy transfer by fluorescence lifetime imaging (FRET-FLIM) analysis, fluorescence decays were acquired and resolved by time-correlated single-photon counting using SP8 FLIM FALCON system equipped with a tunable white light laser system set at 594 nm excitation wavelength and 80 MHz frequency. Images were acquired at 512–512-pixel format, collecting over 1,000 photons per pixel. FRET efficiency transients and FRET-FLIM Images were analyzed and processed using LASX Single Molecule detection analysis software (Leica Microsystems, Buffalo Grove IL).
TFEB subcellular localization imaging
To observe subcellular localization of transfected TFEB-mCherry, HeLa cells were plated on 14 mm microwell dishes (MatTek Life Sciences, P35GCOL-1.0–14-C) and transfected with 300 ng TFEB mCherry and 500 ng of the gene of interest. In certain experiments, inhibitors were added 1–2 h prior to imaging. To quantify the nuclear translocation of TFEB, the percent of cells with nuclear TFEB was manually determined; at least 5 fields and a minimum of 150 cells were quantified per dish, and each experiment was performed independently three times. In all cases, the investigator was blind to the condition being quantified. To observe the subcellular localization of endogenous TFEB, BMDMs were treated as indicated and stained for TFEB and DAPI. Z stacks were captured and subject to post-acquisition processing on Imaris (Bitplane). Briefly, nuclei were segmented using the DAPI channel and cell body segmented using the TFEB channel. For each cell, the mean fluorescence intensity (MFI) of the TFEB channel for both the nuclear and cytoplasmic compartment were measured and the nuclear:cytoplasmic TFEB MFI ratio calculated [Citation72]. Data is presented as nuclear:cytoplasmic MFI normalized to the control group.
Intracellular calcium measurements
Cells were seeded at 105 cells per 100 µl loading medium (complete RPMI) into poly-D-lysine coated black wall, clear bottom 96 well microtiter plates (Thermo Fisher Scientific, 152037). An equal volume of assay loading buffer (FLIPR calcium 4 assay kit; Molecular Devices, R8141) in HBSS supplemented with 20 mM HEPES and 2 mM probenecid (Sigma-Aldrich, 57–66-9) was added. Cells were incubated at 37°C for 1 h before adding the indicated dose of purified anti-CD38 (clone 90), rat IgG2a, κ isotype control antibody, or NAADP-AM (3 μM). The calcium flux peak was measured using a FlexStation 3 (Molecular Devices, San Jose CA) for 5 min and the data analyzed using SoftMax Pro 5.2 (Molecular Devices, San Jose CA). Calcium responses are shown for individual wells in a 96 well plate analyzed in parallel, and experiments were repeated on three independent batches of cells with similar results. Data is shown as fluorescent counts and the y-axis labeled as Lm1.
Quantitative RT-PCR
Total RNA was isolated using TRIzol Reagent (Thermo Fisher Scientific, 15596026) following the manufacturer’s protocol. The yield was determined using a NanoDrop One spectrophotometer (Thermo Fisher Scientific, Waltham MA). cDNA was synthesized from 2 µg of total RNA in a 20 µl reaction mixture using the Transcriptor First Strand cDNA Synthesis Kit (Sigma-Aldrich, 11483188001). RT-PCR was performed with the synthesized cDNA using FastStart Universal SYBR Green Master (Sigma-Aldrich, 4913914001) and primers for genes of interest on a StepOne Real-Time PCR System (Thermo Fisher Scientific, Waltham MA) following the manufacturer’s instructions. The results were normalized to GAPDH, and relative mRNA levels calculated using the 2−ΔΔCt method. Primer sequences are listed in Table S1.
Seahorse assay for metabolic flux
Metabolic flux on BMDMs was performed as previously described [Citation45]. In short, BMDMs were plated at 100,000 cells/well in an XFe96 Cell Culture Microplate (Agilent Technologies, 101085–004) and stimulated with the indicated dose of LPS or IL4 (R&D Systems, 404-ML-010) for 24 h. In a non-CO2 incubator, the Seahorse Sensor Cartridge (Agilent Technologies, 102416–100) was hydrated in ddH2O overnight and calibrated in Seahorse Calibrant Solution (Agilent Technologies, 100840–000) 1 h prior to assay. BMDMs were washed and incubated in Seahorse XF Base Medium (Agilent Technologies, 103335–100) supplemented with 2 mM glutamine (Thermo Fisher Scientific, 25030149) at pH 7.4 in a non-CO2 incubator for 1 h prior to assay. Extracellular acidification rates (ECAR) and oxygen consumption rates (OCR) were measured using the Seahorse XFe96 (Agilent Technologies, Wilmington DE), and both ECAR and OCR were recorded after the sequential injection of 2.5 M glucose (Thermo Fisher Scientific, A2494001), 5 mM oligomycin A (Cayman Chemicals, 11342), 5 mM FCCP (Cayman Chemicals, 15218) + 100 mM Sodium Pyruvate (Thermo Fisher Scientific, 11360070), and 5 mM Antimycin A (Sigma Aldrich, A8674) + 5 mM Rotenone (Cayman Chemicals, 13995). Measurements were normalized to cell density as measured by Hoechst (Thermo Fisher Scientific, 62249) staining.
Statistical analysis and schematic
Student’s t-test or One-way ANOVA followed by post hoc analysis was used to test for statistical differences between groups. Statistical analysis was done on GraphPad Prism 7.01 and p < 0.05 considered significant. Data are expressed as a mean value ± SEM. Experiments were typically repeated three times. The schematic was made using BioRender.
Supplemental Material
Download MS Word (27.2 MB)Acknowledgments
We thank Dr. Adamantios Mamais and Dr. Mark Cookson for helpful discussions and input on this manuscript. We thank Dr. Anthony Fauci for his longstanding support. This research was supported by the intramural program of the National Institute of Allergy and Infectious Diseases.
Disclosure statement
No potential conflict of interest was reported by the author(s).
Supplementary material
Supplemental data for this article can be accessed here
Additional information
Funding
Related Research Data
References
- Bonello F, D’Agostino M, Moscvin M, et al. CD38 as an immunotherapeutic target in multiple myeloma. Expert Opin Biol Ther. 2018;18(12):1209–1221.
- Frerichs KA, Nagy NA, Lindenbergh PL, et al. CD38-targeting antibodies in multiple myeloma: mechanisms of action and clinical experience. Expert Rev Clin Immunol. 2018;14(3):197–206.
- Chini EN, Chini CCS, Espindola Netto JM, et al. The pharmacology of CD38/NADase: an emerging target in cancer and diseases of aging. Trends Pharmacol Sci. 2018;39(4):424–436.
- Lee HC. Structure and enzymatic functions of human CD38. Mol Med (Cambridge, MA). 2006 Nov-Dec;12(11–12):317–323.
- Fang C, Li T, Li Y, et al. CD38 produces nicotinic acid adenosine dinucleotide phosphate in the lysosome. J Biol Chem. 2018 May 25;293(21):8151–8160.
- Cosker F, Cheviron N, Yamasaki M, et al. The Ecto-enzyme CD38 is a nicotinic acid adenine dinucleotide phosphate (NAADP) synthase that couples receptor activation to Ca2+ mobilization from lysosomes in pancreatic acinar cells. J Biol Chem. 2010 December 3;285(49):38251–38259.
- Graeff R, Liu Q, Kriksunov IA, et al. Acidic residues at the active sites of CD38 and ADP-ribosyl cyclase determine nicotinic acid adenine dinucleotide phosphate (NAADP) synthesis and hydrolysis activities. J Biol Chem. 2006 Sep 29;281(39):28951–28957.
- Knowles H, Li Y, Perraud A-L. The TRPM2 ion channel, an oxidative stress and metabolic sensor regulating innate immunity and inflammation [journal article]. Immunol Res. 2013 March 01;55(1):241–248.
- Ogunbayo OA, Zhu Y, Rossi D, et al. Cyclic adenosine diphosphate ribose activates ryanodine receptors, whereas NAADP activates two-pore domain channels. J Biol Chem. 2011 Mar 18;286(11):9136–9140.
- Calcraft PJ, Ruas M, Pan Z, et al. NAADP mobilizes calcium from acidic organelles through two-pore channels. Nature. 2009;459(7246):596.
- Pitt SJ, Funnell TM, Sitsapesan M, et al. TPC2 is a novel NAADP-sensitive Ca2+ release channel, operating as a dual sensor of luminal pH and Ca2+. J Biol Chem. 2010 Nov 5;285(45):35039–35046.
- Jiang H, Acharya C, An G, et al. SAR650984 directly induces multiple myeloma cell death via lysosomal-associated and apoptotic pathways, which is further enhanced by pomalidomide. Leukemia. 2016 Feb;30(2):399–408.
- Overdijk MB, Jansen JH, Nederend M, et al. The therapeutic CD38 monoclonal antibody daratumumab induces programmed cell death via fcgamma receptor-mediated cross-linking. J Immunol. 2016 Aug 1;197(3):807–813.
- Cookson MR. The role of leucine-rich repeat kinase 2 (LRRK2) in Parkinson’s disease. Nat Rev Neurosci. 2010;11(12):791–797.
- Humphries F, Yang S, Wang B, et al. RIP kinases: key decision makers in cell death and innate immunity. Cell Death Differ. 2015 Feb;22(2):225–236.
- Healy DG, Falchi M, O’Sullivan SS, et al. Phenotype, genotype, and worldwide genetic penetrance of LRRK2-associated Parkinson’s disease: a case-control study. Lancet Neurol. 2008 7; Jul(7):583–590.
- Cookson MR. Cellular functions of LRRK2 implicate vesicular trafficking pathways in Parkinson’s disease. Biochem Soc Trans. 2016;44(6):1603–1610.
- Anderson CA, Boucher G, Lees CW, et al. Meta-analysis identifies 29 additional ulcerative colitis risk loci, increasing the number of confirmed associations to 47. Nat Genet. 2011 Mar;43(3):246–252.
- Barrett JC, Hansoul S, Nicolae DL, et al. Genome-wide association defines more than 30 distinct susceptibility loci for Crohn’s disease. Nat Genet. 2008 Aug;40(8):955–962.
- Waro BJ, Aasly JO. Exploring cancer in LRRK2 mutation carriers and idiopathic Parkinson’s disease. Brain Behav. 2018 Jan;8(1):e00858.
- Gardet A, Benita Y, Li C, et al. LRRK2 is involved in the IFN-gamma response and host response to pathogens. J Immunol. 2010 Nov 1;185(9):5577–5585.
- Deretic V, Saitoh T, Akira S. Autophagy in infection, inflammation and immunity [Review]. Nat Rev Immunol. 2013;13(10):722–737.
- Settembre C, Di Malta C, Polito VA, et al. TFEB links autophagy to lysosomal biogenesis. Science. 2011 Jun 17;332(6036):1429–1433.
- Nabar NR, Kehrl JH. The transcription Factor EB links cellular stress to the immune response. Yale J Biol Med. 2017 Jun;90(2):301–315.
- Rah SY, Lee YH, Kim UH. NAADP-mediated Ca(2+) signaling promotes autophagy and protects against LPS-induced liver injury. Faseb J. 2017 Jul;31(7):3126–3137.
- Bao JX, Zhang QF, Wang M, et al. Implication of CD38 gene in autophagic degradation of collagen I in mouse coronary arterial myocytes. Front Biosci (Landmark Ed). 2017 Jan 1;22:558–569.
- Xiong J, Xia M, Xu M, et al. Autophagy maturation associated with CD38-mediated regulation of lysosome function in mouse glomerular podocytes. J Cell Mol Med. 2013;17(12):1598–1607.
- Zhang Y, Xu M, Xia M, et al. Defective autophagosome trafficking contributes to impaired autophagic flux in coronary arterial myocytes lacking CD38 gene. Cardiovasc Res. 2014;102(1):68–78.
- Manzoni C. The LRRK2–macroautophagy axis and its relevance to Parkinson’s disease. Biochem Soc Trans. 2017;45(1):155.
- Schapansky J, Nardozzi JD, Felizia F, et al. Membrane recruitment of endogenous LRRK2 precedes its potent regulation of autophagy. Hum Mol Genet. 2014 Aug 15;23(16):4201–4214.
- Gomez-Suaga P, Luzon-Toro B, Churamani D, et al. Leucine-rich repeat kinase 2 regulates autophagy through a calcium-dependent pathway involving NAADP. Hum Mol Genet. 2012 Feb 1;21(3):511–525.
- Gomez-Suaga P, Churchill GC, Patel S, et al. A link between LRRK2, autophagy and NAADP-mediated endolysosomal calcium signalling. Biochem Soc Trans. 2012 Oct;40(5):1140–1146.
- Funaro A, Reinis M, Trubiani O, et al. CD38 functions are regulated through an internalization step. J Immunol. 1998 Mar 1;160(5):2238–2247.
- ZOCCHI E, USAI C, GUIDA L, et al. Ligand-induced internalization of CD38 results in intracellular Ca2+ mobilization: role of NAD+ transport across cell membranes. FASEB J. 1999;13(2):273–283.
- Medina DL, Di Paola S, Peluso I, et al. Lysosomal calcium signalling regulates autophagy through calcineurin and TFEB [Article]. Nat Cell Biol. 2015;17(3):288–299.
- Gerasimenko JV, Charlesworth RM, Sherwood MW, et al. Both RyRs and TPCs are required for NAADP-induced intracellular Ca(2)(+) release. Cell Calcium. 2015 Sep;58(3):237–245.
- Zhu MX, Evans AM, Ma J, et al. Two-pore channels for integrative Ca signaling. Commun Integr Biol. 2010 Jan-Feb;3(1):12–17.
- Yue M, Hinkle KM, Davies P, et al. Progressive dopaminergic alterations and mitochondrial abnormalities in LRRK2 G2019S knock-in mice. Neurobiol Dis. 2015 Jun;78:172–195.
- Steger M, Tonelli F, Ito G, et al. Phosphoproteomics reveals that Parkinson’s disease kinase LRRK2 regulates a subset of Rab GTPases. eLife. 2016;5:e12813.
- Dzamko N, Inesta-Vaquera F, Zhang J, et al. The IkappaB kinase family phosphorylates the Parkinson’s disease kinase LRRK2 at Ser935 and Ser910 during Toll-like receptor signaling. PLoS One. 2012;7(6):e39132.
- Pastore N, Brady OA, Diab HI, et al. TFEB and TFE3 cooperate in the regulation of the innate immune response in activated macrophages. Autophagy. 2016;12(8):1240–1258.
- Galván-Peña S, O’Neill LAJ. Metabolic reprograming in macrophage polarization. Front Immunol. 2014;5:420.
- Tannahill GM, Curtis AM, Adamik J, et al. Succinate is a danger signal that induces IL-1β via HIF-1α. Nature. 2013;496(7444):238–242.
- Chen D, Xie J, Fiskesund R, et al. Chloroquine modulates antitumor immune response by resetting tumor-associated macrophages toward M1 phenotype. Nat Commun. 2018;9(1):873.
- Van den Bossche J, Baardman J, de Winther MPJ. Metabolic Characterization of Polarized M1 and M2 Bone Marrow-derived Macrophages Using Real-time Extracellular Flux Analysis. J. Vis. Exp. 2015;105:e53424. doi:https://doi.org/10.3791/53424.
- Hockey LN, Kilpatrick BS, Eden ER, et al. Dysregulation of lysosomal morphology by pathogenic LRRK2 is corrected by TPC2 inhibition. J Cell Sci. 2015 Jan 15;128(2):232–238.
- Shin HJ, Kim H, Oh S, et al. AMPK-SKP2-CARM1 signalling cascade in transcriptional regulation of autophagy. Nature. 2016 Jun 15;534(7608):553–557.
- Yasue T, Nishizumi H, Aizawa S, et al. A critical role of Lyn and Fyn for B cell responses to CD38 ligation and interleukin 5. Proc Natl Acad Sci U S A. 1997;94(19):10307–10312.
- Rodriguez-Alba JC, Moreno-Garcia ME, Sandoval-Montes C, et al. CD38 induces differentiation of immature transitional 2 B lymphocytes in the spleen. Blood. 2008 Apr 1;111(7):3644–3652.
- Moreno-Garcia ME, Lopez-Bojorques LN, Zentella A, et al. CD38 signaling regulates B lymphocyte activation via a phospholipase C (PLC)-gamma 2-independent, protein kinase C, phosphatidylcholine-PLC, and phospholipase D-dependent signaling cascade. J Immunol. 2005 Mar 1;174(5):2687–2695.
- Gul R, Park DR, Shawl AI, et al. Nicotinic acid adenine dinucleotide phosphate (NAADP) and cyclic ADP-Ribose (cADPR) mediate Ca2+ signaling in cardiac hypertrophy induced by β-adrenergic stimulation. PLoS One. 2016;11(3):e0149125.
- Soares S, Thompson M, White T, et al. NAADP as a second messenger: neither CD38 nor base-exchange reaction are necessary for in vivo generation of NAADP in myometrial cells. Am J Physiol Cell Physiol. 2007 Jan;292(1):C227–39.
- Moreschi I, Bruzzone S, Melone L, et al. NAADP+ synthesis from cADPRP and nicotinic acid by ADP-ribosyl cyclases. Biochem Biophys Res Commun. 2006 Jun 30;345(2):573–580.
- Lin WK, Bolton EL, Cortopassi WA, et al. Synthesis of the Ca(2+)-mobilizing messengers NAADP and cADPR by intracellular CD38 enzyme in the mouse heart: role in β-adrenoceptor signaling. J Biol Chem. 2017 Aug 11;292(32):13243–13257.
- Park DR, Nam TS, Kim YW, et al. Oxidative activation of type III CD38 by NADPH oxidase-derived hydrogen peroxide in Ca(2+) signaling. Faseb J. 2018 Nov 19;33(3):3404-3419.fj201800235R.
- Gómez-Suaga P, Rivero-Ríos P, Fdez E, et al. LRRK2 delays degradative receptor trafficking by impeding late endosomal budding through decreasing Rab7 activity. Hum Mol Genet. 2014 Dec 20;23(25):6779–6796.
- Rivero-Ríos P, Romo-Lozano M, Madero-Pérez J, et al. The G2019S variant of leucine-rich repeat kinase 2 (LRRK2) alters endolysosomal trafficking by impairing the function of the GTPase RAB8A. J Biol Chem. 2019 Mar 29;294(13):4738–4758.
- Amici SA, Young NA, Narvaez-Miranda J, et al. CD38 is robustly induced in human macrophages and monocytes in inflammatory conditions [Original Research]. Front Immunol. 2018 Jul 10;9(1593). DOI:https://doi.org/10.3389/fimmu.2018.01593
- Kang J, Park KH, Kim JJ, et al. The role of CD38 in Fcgamma receptor (FcgammaR)-mediated phagocytosis in murine macrophages. J Biol Chem. 2012 Apr 27;287(18):14502–14514.
- Shu B, Feng Y, Gui Y, et al. Blockade of CD38 diminishes lipopolysaccharide-induced macrophage classical activation and acute kidney injury involving NF-κB signaling suppression. Cell Signal. 2018;42:249–258.
- Viegas MS, do Carmo A, Silva T, et al. CD38 plays a role in effective containment of mycobacteria within granulomata and polarization of Th1 immune responses against Mycobacterium avium. Microbes Infect. 2007 Jun;9(7):847–854.
- Lischke T, Heesch K, Schumacher V, et al. CD38 controls the innate immune response against Listeria monocytogenes. Infect Immun. 2013;81(11):4091.
- Liu W, Liu X, Li Y, et al. LRRK2 promotes the activation of NLRC4 inflammasome during Salmonella Typhimurium infection. J Exp Med. 2017;214(10):3051.
- Lin X, Parisiadou L, Gu X-L, et al. Leucine-rich repeat kinase 2 regulates the progression of neuropathology induced by Parkinson’s-disease-related mutant α-synuclein. Neuron. 2009;64(6):807–827.
- Vural A, Nabar NR, Hwang IY, et al. Gα i2 signaling regulates inflammasome priming and cytokine production by biasing macrophage phenotype determination. J Immunol. 2019 Jan 25;202:1510–1520.
- Greggio E, Zambrano I, Kaganovich A, et al. The Parkinson disease-associated leucine-rich repeat kinase 2 (LRRK2) is a dimer that undergoes intramolecular autophosphorylation. J Biol Chem. 2008 Jun 13;283(24):16906–16914.
- Greggio E, Jain S, Kingsbury A, et al. Kinase activity is required for the toxic effects of mutant LRRK2/dardarin. Neurobiol Dis. 2006;23(2):329–341.
- Yue Y, Nabar NR, Shi CS, et al. SARS-coronavirus open reading Frame-3a drives multimodal necrotic cell death. Cell Death Dis. 2018 Sep 5;9(9):904.
- Ferron M, Settembre C, Shimazu J, et al. A RANKL-PKCbeta-TFEB signaling cascade is necessary for lysosomal biogenesis in osteoclasts. Genes Dev. 2013 Apr 15;27(8):955–969.
- Chauhan S, Goodwin JG, Chauhan S, et al. ZKSCAN3 is a master transcriptional repressor of autophagy. Mol Cell. 2013 Apr 11;50(1):16–28.
- Chini CCS, Guerrico AMG, Nin V, et al. Targeting of NAD metabolism in pancreatic cancer cells: potential novel therapy for pancreatic tumors. Clin Cancer Res. 2014;20(1):120.
- Wang C, Niederstrasser H, Douglas PM, et al. Small-molecule TFEB pathway agonists that ameliorate metabolic syndrome in mice and extend C. elegans lifespan. Nat Commun. 2017 Dec 22;8(1):2270.